Abstract
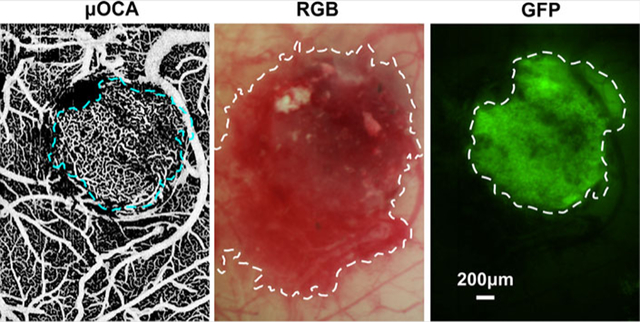
Accurate detection of early tumor margin is of great preclinical and clinical implications for predicting the survival rate of subjects and assessing the response of tumor microenvironment to chemotherapy or radiation therapy. Here, we report a multimodality optical imaging study on in vivo detection of tumor boundary by analyzing neoangiogenesis of tumor microenvironment (microangiography), microcirculatory blood flow (optical Doppler tomography) and tumor proliferation (green fluorescent protein [GFP] fluorescence). Microangiography demonstrates superior sensitivity (77.7 ± 6.4%) and specificity (98.2 ± 1.7%) over other imaging technologies (eg, optical coherence tomography) for tumor margin detection. Additionally, we report longitudinal in vivo imaging of tumor progression and show that the abrupt tumor cell proliferation did not occur until local capillary density and cerebral blood flow reached their peak approximately 2 weeks after tumor implantation. The unique capability of longitudinal multimodality imaging of tumor angio-genesis may provide new insights in tumor biology and in vivo assessment of the treatment effects on anti-angiogenesis therapy for brain cancer.
Keywords: brain tumor margin detection, cerebral capillary flow imaging, fluorescence imaging, microvasculature, OCT, optical coherence tomography, μOCA, μODT
Graphical Abstract
1 | 1. INTRODUCTION
According to the age-adjusted average annual incidence rates for cancers, cancers in the brain and central nerve system are among the most frequent cancers in children of age 0–14 and in adults of age 15–39 in the United States [1]. Moreover, brain cancer is one of the most dangerous cancers with high mortality rate and short median length of survival (40.9 weeks) [2]. To improve the survival rates of brain cancer, early diagnosis and therapeutic treatment is highly desirable. Therefore, in vivo detection of tumor boundary and evaluation of tumor size are of high clinical relevance [3] not only for early diagnosis but also for assessing therapeutic outcomes [4] which, however, remains a challenge for both macroscopic and microscopic imaging modalities. Conventional macroscopic technologies, for example, positron-emission tomography, single-photon emission computerized tomography and diffusion magnetic resonance imaging, have demonstrated their capability for assessing the response to cancer therapies [4–6]; however, their spatial resolution, typically on the order of 1 mm, fail to image microvasculature and cannot provide detailed change in the tumor microenvironment. On the contrary, confocal fluorescence or multiphoton excitation microscopy can provide subcellular or molecular insights into tumor pathophysiology, including gene expression, angiogenesis and metabolic microenvironment of tumors, yet the relatively small field of view (FOV) and insufficient image depth may limit its application for in vivo imaging of tumor proliferation and tumor microenvironment [7].
Recent advances in 3D optical coherence tomography (OCT), including ultrahigh-resolution optical coherence angiography (μOCA) and Doppler tomography (μODT), permit in vivo visualization of microvascular networks and quantitative imaging of cerebral blood flow velocity (CBFv) over a large FOV and at capillary resolution [8, 9], thus highly desirable for cancer research. Complimentary to vascular diagnosis by μOCA/μODT, OCT characterizes depth-resolved backscattering properties of biological tissue for 3D morphological diagnosis, for instance, for identifying soft-tissue sarcomas [10, 11]. It was demonstrated that the contrast of highly scattering necrotic core over low-scattering healthy tissue could be used to extract tumor boundary [12]; Nevertheless, scattering-based approaches for identifying tumor region may suffer intensity fall-off due to off-focus alignment or field curvature of the subject or separation from surrounding inflammatory or necrotic lesions. Alternatively, integrated Raman spectroscopy into OCT was reported to further improve the diagnosis of cancer cells [13]; hemoglobin saturation and oxygenation map also showed as promising biomarkers for tumor detection and characterization of tumor progression [14, 15].
Here we propose an alternative approach to identify tumor margin by analyzing the features of the microvascular networks in the tumor microenvironment. Noteworthily, neoangiogenesis, triggered by hypoxic environment, is a process of recruiting new micro-vessels to supply rapid growth of tumor [16, 17]. It is among common phenomena of the tumor microenvironment and, more importantly, a feature detectable by μOCA/μODT. Thus, we characterized the differences of microvascular density (based on μOCA) between highly angiogenic tumor and the surrounding normal tissue as the diagnostic criterion (ie, “biomarker”) for identifying early tumor margin since the recruit of micro-vessels occurs at the early phase of tumor progression prior to the formation of necrotic core and the commence of avascular process [18]. Furthermore, we compared the sensitivity/specificity of this method for tumor margin detection with other imaging methods, including μODT, μOCT, white-light image and fluorescence image (tumor expressing GFP). Moreover, to explore the progression of the tumor microenvironment in vivo, we launched a longitudinal imaging study that tracked multi-parameter changes including capillary blood flow velocity, microvascular density and tumor cell proliferation via tumor expressing GFP fluorescence, from which the correlations between those parameters were derived.
2 |. METHODS
2.1 |. Animal preparation
A male C57/B6 mouse at the age of 12–14 weeks (Jackson Lab, Bar Harbor,) was anesthetized with inhalational 2.0%−2.5% isoflurane mixed with pure oxygen. After the mouse head was firmly fixed onto a custom stereotaxic frame to minimize motion artifacts, a approximately 4 × 5 mm2 cranial window above the sensorimotor cortex was carefully opened and the exposed cortical surface was immediately moisturized by 2% agarose gel and affixed with a 160 μm-thick glass coverslip using biocompatible cyanocrylic glue. For chronic studies, the surgical procedure is similar to the aforementioned protocol [19] except that dental cement was applied to the edges of the coverslip to secure its attachment with the skull and the wound was sutured, sterilized and the mouse was given antibiotic and anti-inflammation treatments (if necessary) to ensure long-term optical clearance. The physiological states of the mouse including electrocardiography (ECG), respiration rate and body temperature were continuously monitored (SA Instruments, Stony Brook, New York) during the experiment. The animal protocols were approved by Institutional Animal Care and Use Committees of Stony Brook University and followed the National Institutes of Health (NIH) Guideline for Care and Use of Laboratory Animals.
2.2 |. Intracranial tumor transplantation
A total of 1.5 × 10⁴ GFP-expressing GL261 tumor cells [20] in 0.8 μL of dulbecco’s modified eagle media was injected into the mouse’s sensorimotor cortex (approximately 300 μm below cortical surface) using a 30-gauge hypodermic needle at a slow rate controlled by a precision infusion pump (PHD-2000; Harvard Apparatus, Holliston). About 15–30 minutes later, the cranial window was sealed.
2.3 |. In vivo μOCT, surface white light and fluorescence imaging and image reconstruction
In vivo 3D imaging of cortical morphology and cerebral microcircular networks was performed on a custom ultrahigh-resolution optical coherence tomography (μOCT) system [21], in which a broadband source (λ = 1310 nm; ΔλFWHM ≈ 200 nm) was employed to illuminate a 2 × 2 wavelength-flattened fiberoptic Michelson interferometer, capable of providing an axial resolution of 2.5 μm in biological tissue (ie, Lc = 2[ln2]1/2/π·λ2/Δλcp). Light exiting the sample arm was focused on mouse sensorimotor cortex by a near infrared achromatic doublet (f18mm/NA0.25; Edmound Optics, Barrington), yielding a maximal lateral resolution of 3.2 μm. The return light from sample and reference arms was combined in the detection fiber, collimated and linearly diffracted by a custom spectrometer, and detected by a 2 k-pixel linescan InGaAs camera (2048R; Sensors Unlimited, Princeton) at up to 145 k A-lines/s. During image acquisition, en-face maximum intensity projection of cerebral vascular networks was instantaneously reconstructed via graphic processing unit boosted custom graphical user interface programming to enable real-time display of flow networks, for example, 2 M pixels per cross-sectional or B-scan as fast as 473fps. 3D images of microvasculature (ultrahigh-resolution optical coherence angiography—μOCA) and cerebral blood flow networks (ultrahigh-resolution optical coherence Doppler tomography—μODT) in mouse cortex were reconstructed by speckle variance analysis [22] and phase subtraction method [23], respectively. Although the theoretical image depth of μOCT can be up to approximately 3.6 mm, the measured image depth of μODT for capillary flow network was 1.4 mm [21], which was limited by lens abberrations, depth of field of OCT scan lens and mostly multiple scattering of mouse cortical tissue.
In parallel, in vivo 2D surface white-light (RGB) and GFP fluorescence (excitation at 470–490 nm, emission at 505–535 nm) imaging was acquired on a modified zoom microscope (4×/0.4NA Plan APO, AZ100; Nikon, Tokyo) which was illuminated with multi-channel light-emitting diode light engine (Spectra X; Lumencor, Beaverton) and detected by a sCMOS camera (Zyla 5.5; Andor, Belfast) in a timesharing mode [24, 25].
Suppression of artifacts induced by bulk motion is critical to ensure accurate detection of microvasculature by Frangi-Hessian filtering, which tends to increase stripe-like motion artifacts. For speckle variance based μOCA, motion artifacts are resulted from substantial image decorrelation across multiple B-scans due to instantaneous drift in the x, y, z directions or even tilting angle [26] (Figure 1A). Here, we modified the scanning scheme to acquire additional redundant scans (N′ > N) and calculated μOCA only from those most correlated B-scans to minimize the motion artifacts. Figure 1 compares μOCA images before (A) and after (B) motion artifact removal, clearly demonstrating the improved image quality. Figure 1C, D shows the corresponding cross-sectional images before and after motion removal. To identify the most correlated B-scans among the multiple repeated B-scans (eg, N′ = 14), the averaged correlation coefficients r(i, j) were calculated using Eqs. (1) and (2), from which those B-scans with the N = 6 highest r(i, j) as highlighted by black arrows in Figure 1E were selected to reconstruct μOCA.
| (1) |
| (2) |
where r(i, j) represents the correlation coefficient across redundant B-scans, and i and j are the frame index. x and y denote the pixel index of each individual B-scan. After bulk motion removal, the signal to noise ratio signal-to-noise ratio was drastically improved from 2.11 dB (C) to 19.03 dB (D).
FIGURE 1.
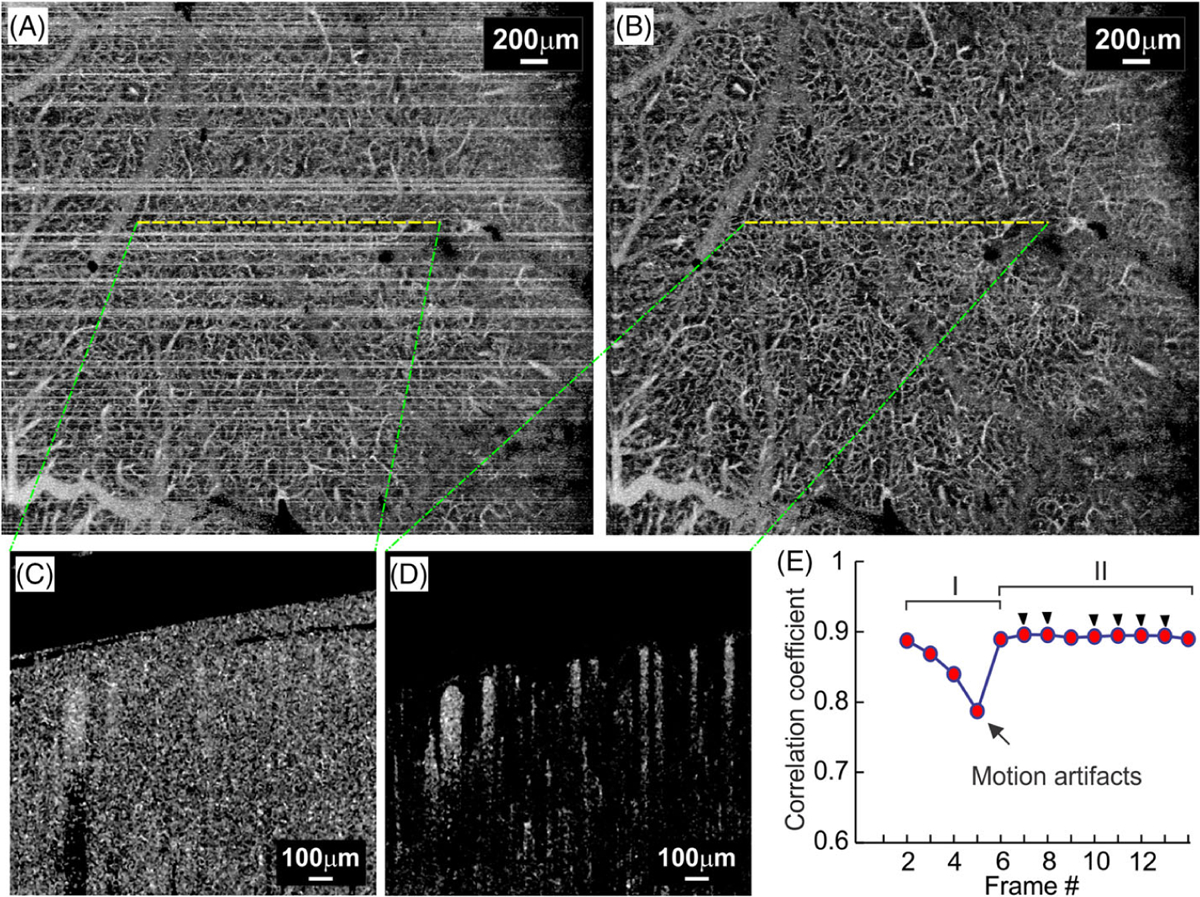
Removal of bulk motion artifacts. A and B, ultrahigh-resolution optical coherence angiography (μOCA) images before and after motion removal; C and D, Cross-sectional μOCA images before and after motion removal; E, Plot of averaged correlation coefficient, in which periods I and II are declined r(i, j) due to motion artifacts and high r(i, j) for stable frames, and black arrow heads highlight the six frames with highest r(i, j) selected for μOCA calculation
Figure 2 is the flow chart to illustrate the process for segmentation of microvasculature, in which a μOCA image (Figure 2A) after removal of motion artifact is segmented to a binarized image for further quantification of microvascular features. Here, multi-scale Frangi-Hessian filtering [27, 28] was applied to generate the vessel-likeness map of the cerebrovascular network to significantly enhance the accuracy of vessel segmentation. Briefly, this method analyzes the eigenvalues (λ1, λ2, λ3) of the corresponding Hessian matrix that characterizes the shape of tubular structure (eg, vessels). As the eigenvalue of the Hessian matrix in axial direction (eg, λ1) is lower than those in the radial directions (λ2, λ3), for example, |λ1| ≤ |λ2| ≤ |λ3|, vessel tracking was performed and a vessel-likeness map characterizing the likeness of tubular shape was calculated. However, the heterogeneity of vessel size in a mouse cortex remains a great challenge for Frangi-Hessian method. As the mismatch between Hessian matrix scale σ and target vessel often leads to either undetected large branches (eg, green arrows, Figure 2B) or overestimated boundaries of small capillaries (eg, yellow arrows, Figure 2C′). To address this problem, a hybrid method combining Frangi-Hessian filtering with thresholding segmentation was reported to segment large and small vessels separately [28]. Here, considering the heterogeneity of small vessel intensity, we applied a region growing algorithm to Figure 2A instead of Frangi-Hessian filtering with large scale factor (ie, Figure 2C with 1 < σ < 15) to specifically detect large branches. Briefly, the algorithm expended or grew “seeds” region by comparing the signal intensity of the test pixel IT(x) with that of the already-known “seed” pixel IS(x). Then, the test pixel was marked as new “seed” pixel if the intensity difference was smaller than a predefined threshold t. The iteration or growing procedure stopped until no more test pixels could be included in “seeds” domain, yielding a final binarized branch vessel map as shown in (Figure 2E). Meanwhile, we used Frangi-Hessian filtering to segment capillary networks (Figure 2B) and then converted to a binarized capillary map as shown in Figure 2D.
FIGURE 2.
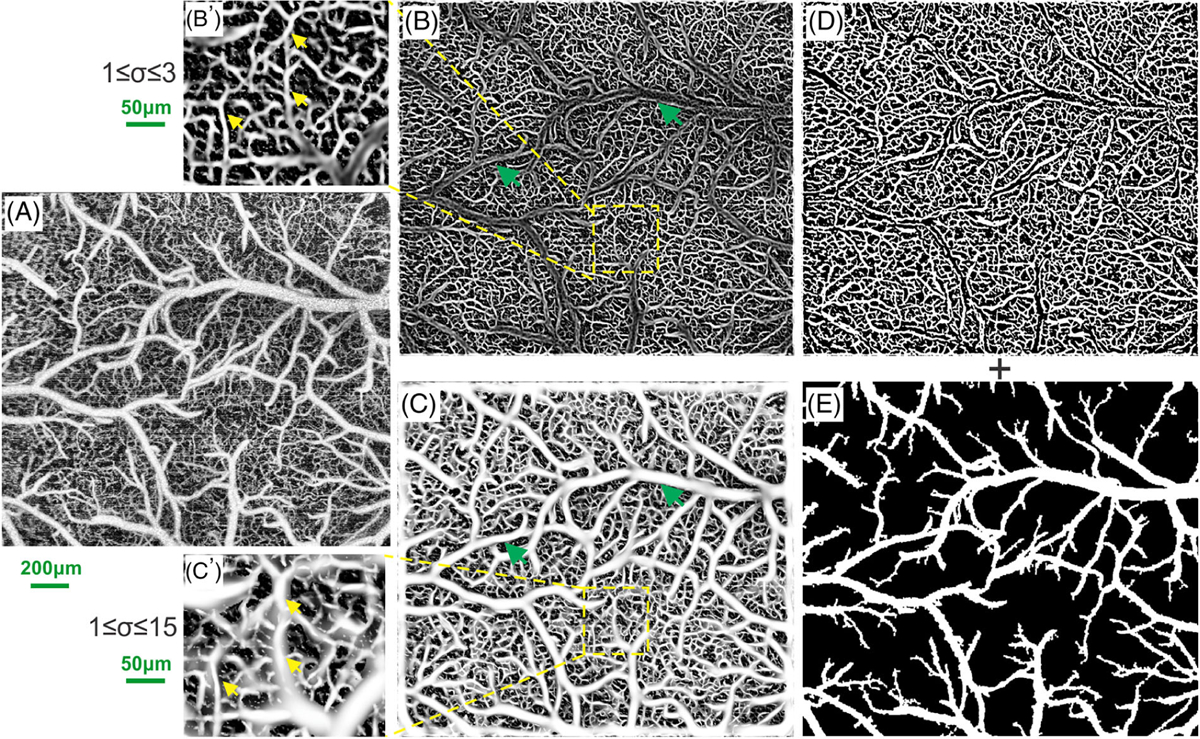
Hybrid segmentation of vascular networks based on Frangi-Hessian filtering and region growing algorithms. A, original ultrahigh-resolution optical coherence angiography (μOCA) image; B and C, vessel-likeness maps processed by multi-scale Frangi-Hessian filtering for small-scale (1 ≤ σ ≤ 3) and large-scale (1 ≤ σ ≤ 15) factors; B′ and C′, insets to illustrate typical heterogenous vascular networks containing both small and large vessels, where green arrows in (B) point out the undetected large branches that are clearly identified in (C), and yellow arrows in (B′) point to the capillaries which are blurring and overestimated in (C′); D and E, binarized images of microvascular network by Frangi-Hessian filtering derived from (B) and of branch vessels by region growing algorithm
As a result of interlaying the binary maps of region growing algorithm for branch vessels and Frangi-Hessian filtering for capillary networks, a binary map of the entire vascular networks was derived, as shown in Figure 3B [9, 25, 29]. A comparison between magnified views in Figure 3A′, B′ clearly demonstrates the effectiveness of our vessel tracking algorithm for segmentation of the vascular networks. Based on Figure 3B, the vascular density map D(x, y) was derived in Figure 3C that characterizes the density distribution of the vascular network using fill factor defined as the pixel# occupied by vessel skeletons vs that of the region of interest [9, 30]. Then, the normalized density map was computed below for tumor boundary detection:
FIGURE 3.
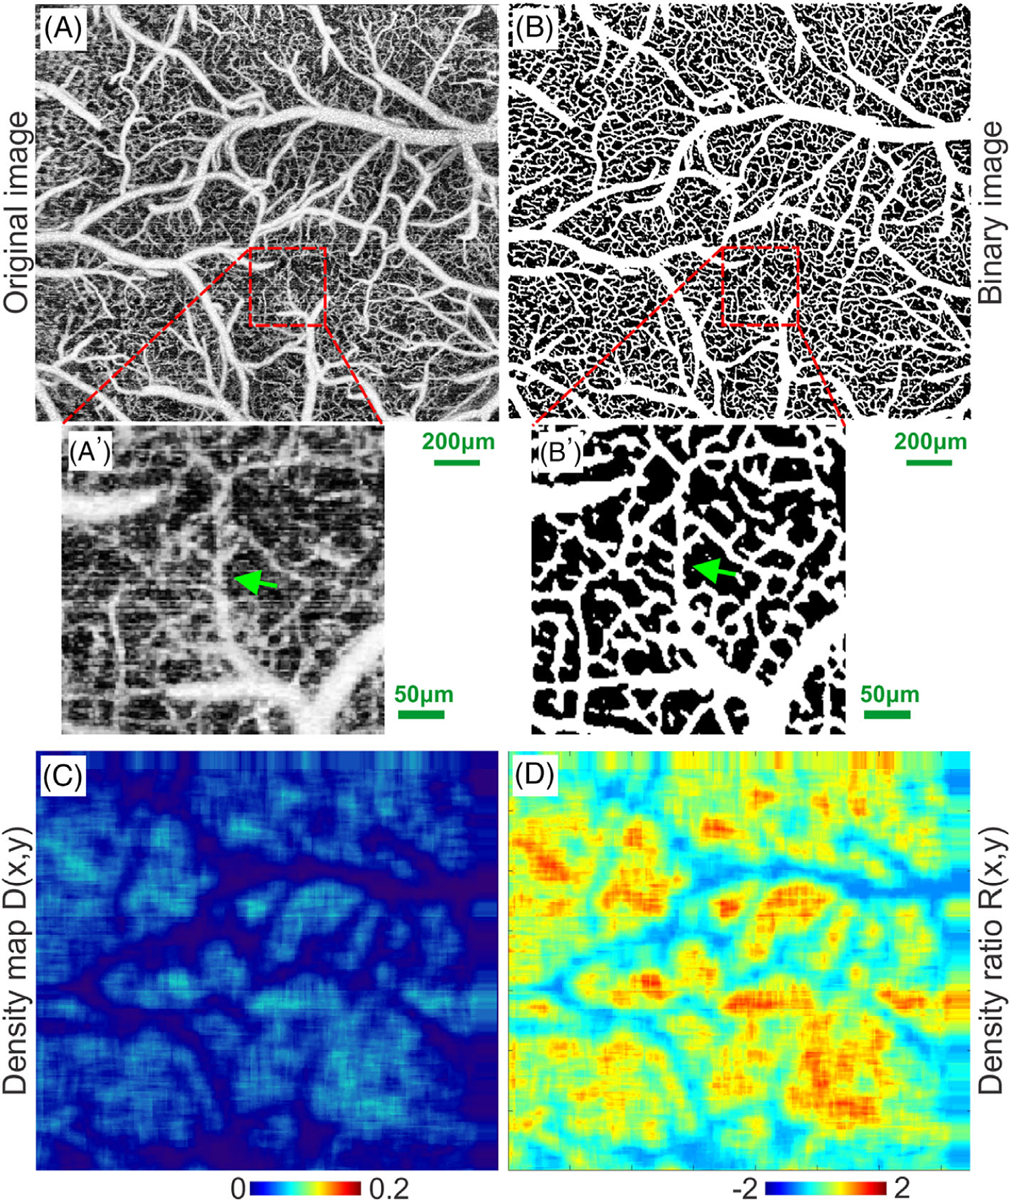
Flow chart to illustrate vascular segmentation. A and A′, original ultrahigh-resolution optical coherence angiography (μOCA) image of mouse sensorimotor cortex and a zoom-in ROI; B and B′, binarized image of vascular network in (A) and the zoom-in ROI; (C) density map of the capillary network; (D) density ratio map. Green arrows in (A′, B′) point out uncovered microvascular details
| (3) |
It is noteworthy that during vessel segmentation, an image processing algorithm combining local adaptive vessel segmentation with distance transform was applied to generate a skeletonized vessel diameter map (eg, Euclidean distance map), which enabled quantitative analysis of the vessel size heterogeneity [31, 32].
In addition, an image processing toolbox in ImageJ was used to calculate tumor boundary for different image modalities. An image was first preprocessed with autothresholding algorithm to avoid subjective errors [33]; then, the islands and holes in the image were either removed or filled up using the built-in morphological operations [34]. Finally, the tumor margin was readily detected by applying Sobel-filter-based edge detection [35]. To accommodate longitudinal tracking of tumor proliferation, instead of H&E histology, we used GFP fluorescence images as in vivo diagnostic criteria (“Gold standard”) for tumor margin and tumor size determinations to evaluate those of other imaging modalities in this study.
3 |. RESULTS
As in vivo imaging of mouse cortex was acquired in parallel using a multimodality platform that combines tumor fluorescence (via injection of GFP-expressing tumor cells), morphology (μOCT) and vasculature (μOCA/μOCT), detection of tumor by each modality was presented and compared, including the tumor boundary. In addition, time-lapse imaging allowed for tracking of tumorigenesis and the associated changes in tumor microenvironment (eg, neoangiogenesis).
3.1 |. μOCA/μOCT detection of early tumor in mouse cortex in vivo
The orthotopic xenograft tumor transplanted in mouse sensorimotor cortex was detected and the tumor boundary was identified based on the density ratio map (eg, Figure 3D) of tumor microvascular networks. Figure 4 compares μOCA images of mouse sensorimotor cortex of a control mouse (upper panel), a mouse after saline injection (mid panel) and that of tumor cell injection (lower panel). Figure 4A, E and I are the segmented in vivo μOCA images from which the distance maps in Figure 4B, F and J were derived to characterize the vessel size distribution of the microvascular networks, ranging from approximately 3 μm capillaries to 132 μm branch vessels. In a normal mouse sensorimotor mouse, the vascular distribution is largely uniform (Figure 4A, B). In a saline control mouse, it is mostly uniform distributed (Figure 4E, F) except at the injection spot (dashed green circle) where some pial vessels are thinner and redirected. However, the vascular network of a tumor-mouse cortex is vastly different (Figure 4I, J), in which the neoangiogenic microvasculature is random, cluster-like, heterogenous, tortuous and can thus be clearly differentiated from the surrounding microvascular network. Figure 4C, G and K are the corresponding ratio images of the vascular density. Both control and saline mice show uniform distribution of microvasculature and smooth branching patterns except a small avascular area due to injection injury, whose vascular density is not significantly different. On the contrary, the vascular network within the tumorous lesion shows drastic increased neoangiogenic capillary clusters. Quantitative analyses of Figure 4K reveal that the mean vascular density ratio within the tumor area (dashed dark circle), 109.10 ± 35.64%, is significantly higher than that of surrounding normal area (red dashed circle) of −10.92 ± 27.76%. Furthermore, the mean density ratio of within the tumor is significantly greater than that of control (27.36 ± 22.20%, P < .01) and of saline injection (29.14 ± 13.48%, P < .01).
FIGURE 4.
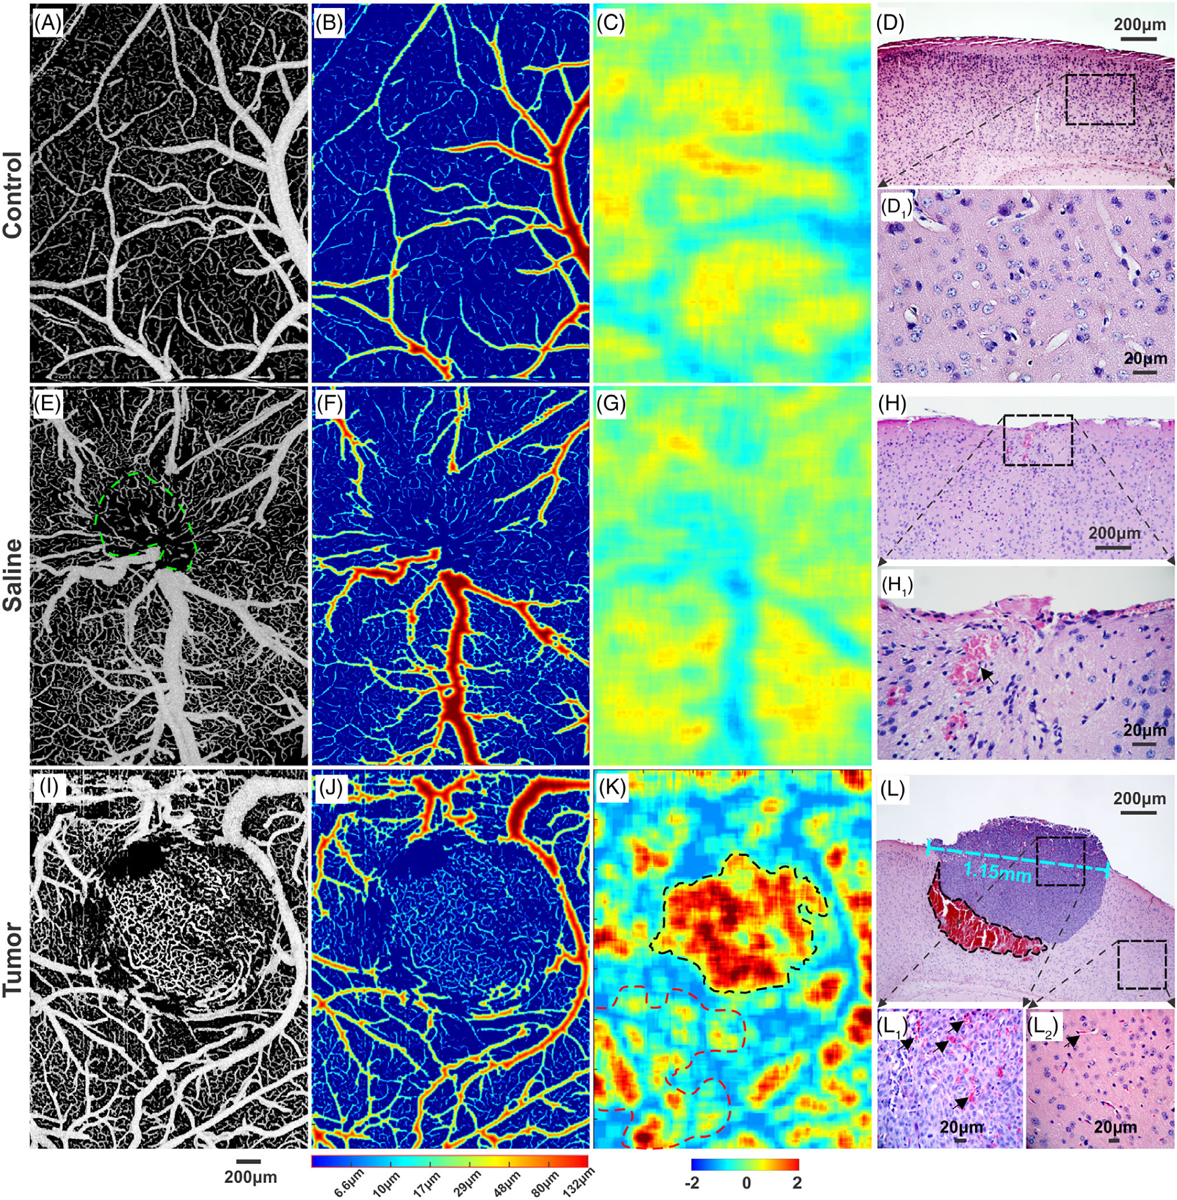
A comparison of cortical vasculature among control, saline and tumor injected mice on day 18 after injection. A, E and I, ultrahigh-resolution optical coherence angiography (μOCA) images of vascular network of mouse sensorimotor cortex. B, F and J, vessel size maps to show vascular network heterogeneity. C, G and K, density ratio images. D, H and L, H&E stained histological images (4×) of brain tissue from normal, saline sham and tumor mice, respectively. D1 and H1, high-magnification (40×) images of (D, H); L1 and L2, high-magnification (40×) images within the tumor and the surrounding normal tissue, respectively. The size of the solid tumor was approximately 1.15 mm (panel L) on day 18 after intracranial injection
H&E-stained histological images in Figure 4D, H and L provide ex vivo confirmation of μOCA identification of the vascular pathological changes resulting from tumorigenesis. Figure 4L shows the presence of a solid tumor grown in mouse cortex and abundant blood accumulation beneath the tumor (black-dashed circle), suggesting the recruit of massive blood flow during the early phase of tumorigenesis. High-magnification histological images show significantly higher red blood cell counts found within the tumor (black arrows in Figure 4L1) than in the surrounding normal area (Figure 4L2), suggestive of active neoangiogenesis identified by μOCA. Compared with control (Figure 4D1), saline injection only showed minor accumulation of red blood cells due to injection injury to the local vascular tree (Figure 4H1).
3.2 |. Tumor boundary detection in vivo
Figure 5 shows the tumor margin identified by different imaging modalities, including μOCA/μODT, en-face μOCT, white-light (RGB) surface image and GFP fluorescence image. Here, detection sensitivity and specificity are defined as sensitivity (SN) = true positive area/GFP area, specificity (SP) = true benign area/non-GFP area, which is under the assumption that fluorescence detection of GFP-expressing GL261 cells is the “gold standard” for tumor diagnosis and margin detection.
FIGURE 5.
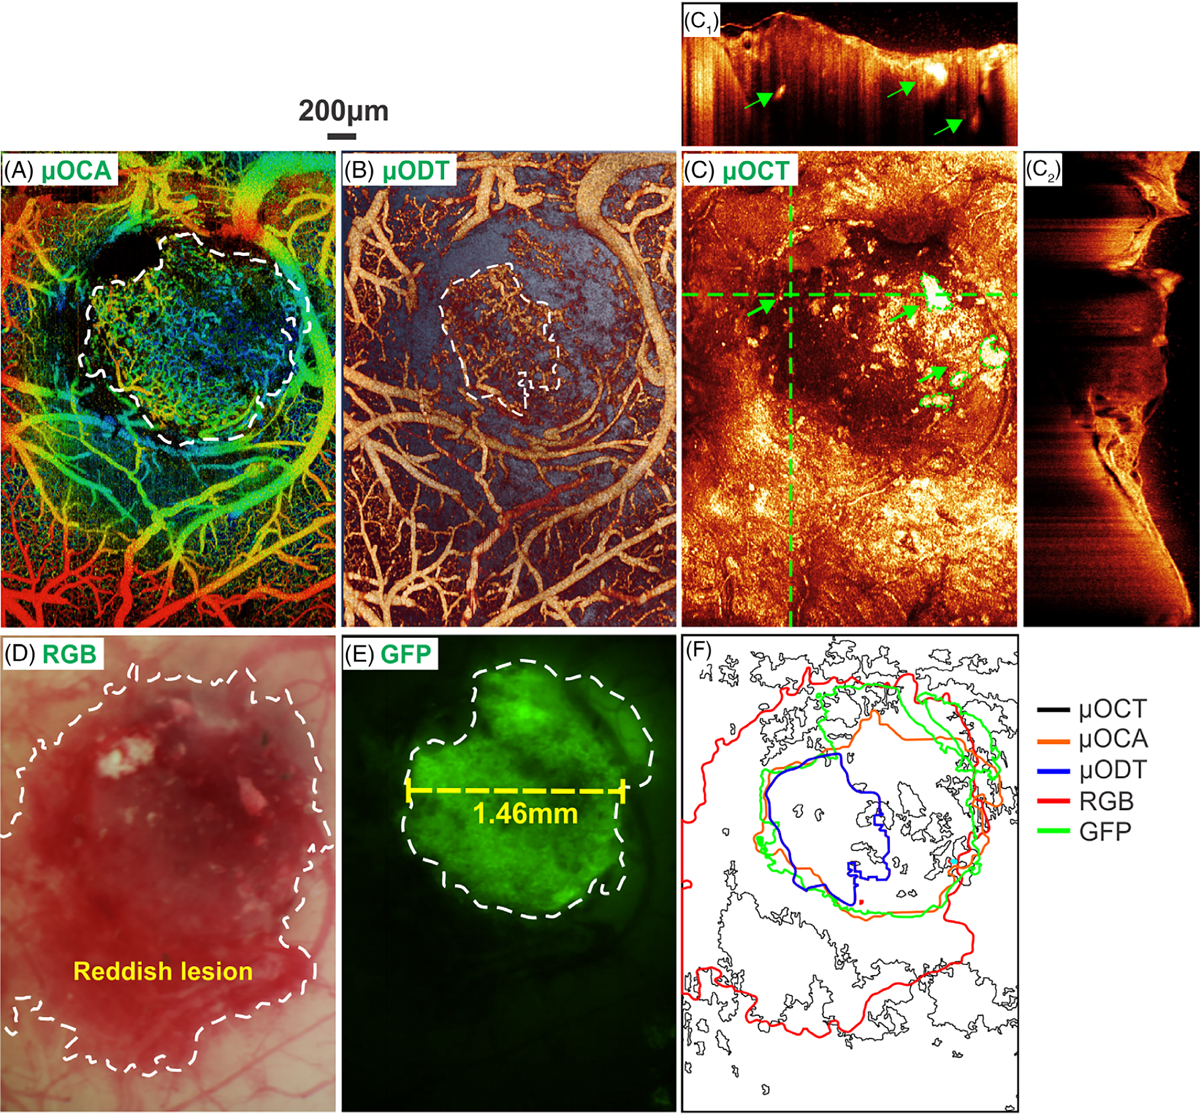
In vivo detection of tumor boundary by various imaging modalities. A and B, en face depth-encoded ultrahigh-resolution optical coherence angiography (μOCA) and ultrahigh-resolution optical Doppler tomography (μODT). C, en face optical coherence tomography (OCT) image, in which panels (C1) and (C2) are cross-sectional OCT images at locations landmarked by two dashed green crosslines (green arrows point to high-scattering necrotic cores). D and E, white-light and GFP images, in which the tumor boundary is marked by dashed white circles; F, a comparison of tumor boundaries detected by five image modalities in vivo. The size of the solid tumor measured by GFP+ fluorescence in vivo was approximately 1.46 mm (panel E) on day 18 after intracranial injection
The scattering properties of biological tissue due to carcinogenesis have been used for OCT diagnosis of early cancers [36]. For instance, OCT identifies the formation of necrotic cores (green arrows in Figure 5C1) as small lesions of drastically high scattering, and the tumor in Figure 5C2 as lower scattering than the surrounding cortical tissue. However, the mixture of tumor (lower scattering) and necrotic lesions (high scattering) altogether with increased inhomogeneity makes it difficult for OCT to accurately identify the tumor margin in Figure 5C. The sensitivity and specificity of OCT based on scattering for tumor margin detection were only 34.5% and 55.9%, respectively. On the contrary, as shown in Figure 4 that tumor-induced neoangiogenic microvasculature is vastly different from that within normal surrounding tissue, μOCA detection of tumor based on ratio density map was significantly enhanced (Figure 5A), with a sensitivity and specificity as high as 77.8% and 98.2%. Similarly, the diagnostic specificity by μODT based on capillary blood flow was as high as 97.9%; however, μODT fails to provide the comparable high sensitivity because of ultralow flow in the neoangiogenic capillaries as shown by a smaller detectable flow margin (dashed white circle in Figure 5B). White-light image, on the other hand, provides superior sensitivity (97.8%) by showing a large reddish area (dashed white circle in Figure 5D). Figure 5E shows the fluorescence image from GFP-expressing GL261 tumor cells, which serves as the in vivo gold standard for tumor diagnosis and tumor margin detection (dashed white circle).
For comparison, Figure 5F summarizes the tumor margins by these modalities where the green margin by GFP fluorescence is regarded as the true tumor boundary. White-light imaging substantially overestimated the tumor margin (red line) leading to low specificity whereas ODT severely underestimated the tumor margin (blue line) causing low sensitivity, which is likely due to limited sensitivity to detect ultraslow flow in new capillary vessels within the tumor. Because of high scattering heterogeneity, the tumor margin provided by OCT is random, spotty and disconnected. In comparison, the tumor margin landmarked by μOCA (inner red circle) based on vascular density ratio map is most accurate and correlates well with the GFP-fluorescence margin of the tumor.
3.3 |. Longitudinal tracking of implanted tumor microenvironment
To characterize the progression of tumor and tumor micro-environment, we performed in vivo longitudinal μODT/μOCA and fluorescence imaging to track the dynamic changes of tumor microvascular network and tumor cell proliferation. Figure 6 shows the longitudinal images acquired on day 7, 14, 18, 24 after tumor cell injection. On day 7, the microvasculature surrounding the injection spot (Figure 6E) was almost identical to that saline injection (Figure 4E), in which neither neoangiogenesis nor GFP fluorescence was apparent. Interestingly, during day 7–14 (week 2), tumor fluorescence (proliferation) did not increase until the onset on day 14 (Figure 6J), whereas the damaged vasculature surrounding the injection spot almost fully recovered, both capillary flow (Figure 6B) and microvascular density (Figure 6F) increased steadily. Quantitative analyses (Figure 6M) indicate that capillary flow within the tumor reached its maximum rate of 0.65 ± 0.19 mm/s on day 14, which is approximately 1-fold faster than its control counterpart of 0.37 ± 0.07 mm/s. The capillary density on day 14 increased 43% vs that on day 7 and reached a plateau of fill factor, FF = 0.31 ± 0.03. The tight coupling between capillary flow and angiogenesis suggested that tumor proliferation created a high demand for blood flow supply and therefore recruited neovessels to support the rapid tumor growth. Tumor proliferation (growth of fluorescence area) was delayed till day 14 when it suddenly increased to 0.49 mm2 and continued to grow exponentially to 4.15 mm2 on day 18 and 17.16 mm2 on day 24. It is noteworthy that while tumor rapidly proliferated, both capillary density and flow rate in the tumor started to decrease after day 18, suggesting the signs of tumor hypoxia and apoptosis. The latter is reflected by necrotic cores shown in Figure 5C [17].
FIGURE 6.
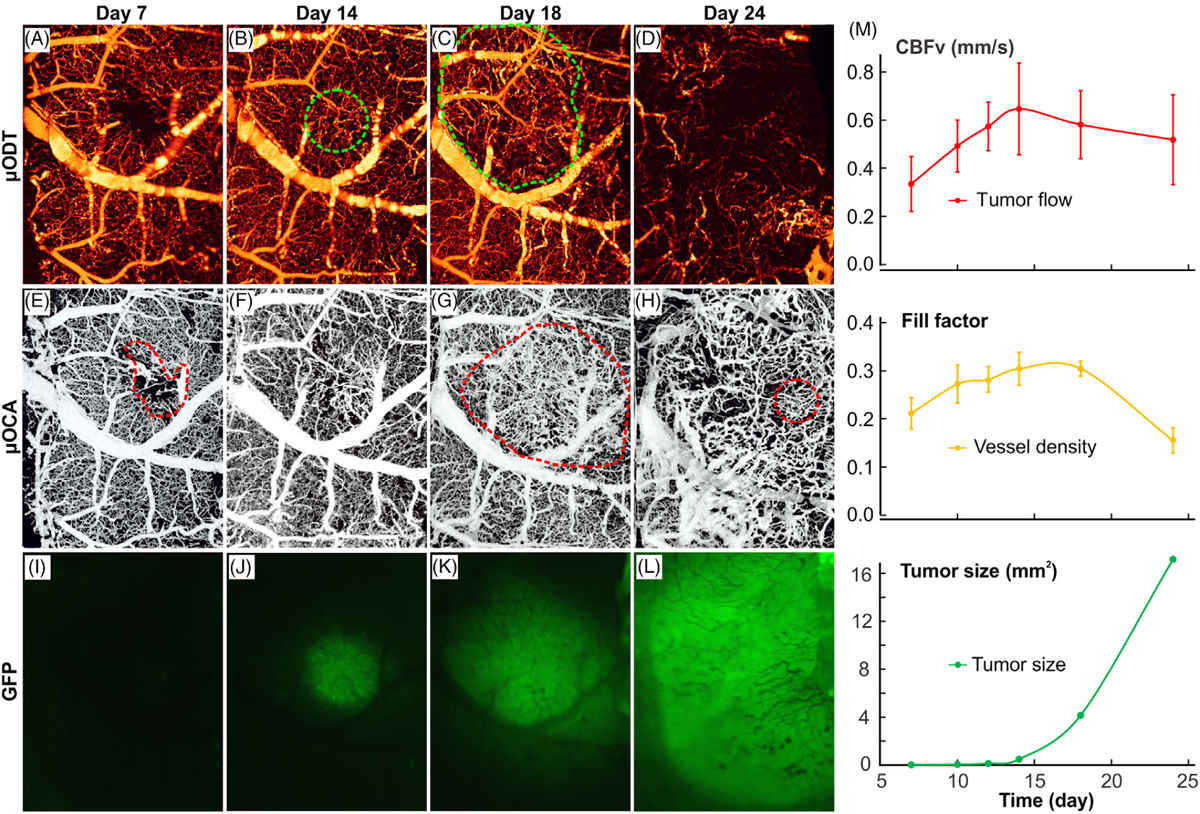
Longitudinal tracking of tumor progression with ultrahigh-resolution optical coherence angiography (μODT)/ultrahigh-resolution optical coherence angiography (μOCA) and fluoresence imaging in vivo. A-D, μODT images of microcirculatory blood flow acquired on day 7, 14, 8 and 24 after tumor cell injection. Dashed green circles point to high capillary flow within the tumor. E-H and I-L, the corresponding μOCA and GFP fluoresence images. Dashed red circles point to either injection spot or dense neoagniogenic vasculature. M, time-course plots of capillary flow (red), capillary density (fill factor; yellow) and tumor proliferation (GFP fluorescence; green)
4 |. DISCUSSION AND CONCLUSION
In this study, we presented methods and in vivo imaging results for the boundary detection of solid mouse brain tumor by analyzing the morphological features of the microvascular networks in the tumor environment. Additionally, we compared the tumor boundary simultaneously detected by various imaging technologies, including cerebrovasculature (μOCA), cerebral blood flow (μODT), micromorphology (μOCT), white-light surface image (RGB image) and fluorescence image (tumor-expressing GFP). The results indicated that the density ratio map based on μOCA provided superior sensitivity and specificity (≥80%) for tumor margin detection over other technologies (GFP fluorescence was used as in vivo gold standard). We reported longitudinal in vivo assessment of tumor progression which characterized the dynamical changes of the tumor microenvironment by multi-parameters and analyzed the correlation of capillary flow rate, angiogenesis and tumor cell proliferation. The results revealed a steady increase of capillary flow and microvascular density during the first 2 weeks, culminating in CBFv = 0.65 ± 0.19 mm/s and FF = 0.31 ± 0.03 on day 14. Importantly, the increase in tumor angiogenesis temporally correlated with the abrupt growth of tumor, which expanded exponentially starting from day 14 and exceeded the measurable size of 17.16 mm2 (ie, size of chronic cranial window) on day 24.
Interestingly, the analysis of microvasculatural features in tumor microenvironment allowed for identification of early tumor boundary during or even before the formation of necrotic cores. In the present study, we detected neoangiogenic region by markedly enhanced microvascular density ratio (109.1 ± 35.6%), suggesting that the tumor core massively recruited neo microvessels to meet the metabolic demands for aggressive proliferation of cancer cells. Compared to conventional OCT that relies on higher backscattering of necrotic core than that of the surrounding viable brain tissue [12], the μOCA based density ratio map provides superior sensitivity and specificity to discriminate between them and identify tumors. As the necrotic core was still a small portion of the whole solid tumor during the early stage of tumor progression (eg, green arrows in Figure 5C), OCT diagnosis severely underestimated true tumor size. On the contrary, the microvasculature based μOCA diagnosis, which relied on intrinsic properties of neoangiogenesis that tightly was associated with excessive metabolism of tumor cells even at early stage of tumor progression (Figure 5M), allowed for more precise detection of tumor boundary (Figure 5A).
The longitudinal monitoring of tumor progression revealed the correlation between capillary flow, angio-genesis and tumor cell proliferation. Interestingly, the onset of abrupt tumor-cell proliferation did not occur during the first 2 weeks, although both capillary flow and micro-vascular density were actively growing. In addition, neoangiogenesis reached a plateau near day 18 followed by a decline of microvascular density, whereas the tumor size underwent an exponential increase to 4.15 mm2 and beyond our cranial window size on day 24. The substantial difference between rapid cell proliferation and stagnating angiogenesis led to a huge deficit in metabolic supply and thus likely created a local hypoxic environment. Furthermore, as tumor growth continued, the accumulative metabolic deficit led to central apoptosis/necrosis, and the boundary of tumor vasculature formed a ring shape as shown in the density ratio maps (Figure 6G, H); therefore, this phenomenon could be used as a biomarker for tumor boundary detection in the later stage of tumorigenesis [18]. Meanwhile, despite that tumor micro vessels appeared larger than the surrounding normal microvasculature (Figure 6E vs Figure 6H), their blood flow decreased (Figure 6E) along with tumor proliferation, indicating the deficiency of tumor vasculature for blood supply.
It is noteworthy that in this feasibility study, in vivo GFP fluorescence detection instead of ex vivo H&E histology was used as “Gold standard” for tumor margin determination to evaluate other imaging modalities, which was a compromise to accommodate longitudinal tracking of tumor cell proliferation. For instance, the tumor size measured by in vivo GFP+ fluorescence (1.46 mm, Figure 5E) was larger than that measured by ex vivo histology (1.15 mm, Figure 4L), which was likely due to tissue shrinkage during histological processing. Future validation study is needed to compare in vivo and ex vivo GFP+ fluorescence and the histological evaluation of the same brain slice. In addition, with the animal procedures optimized (eg, injection depth, volume of tumor cells, imaging time points), statistical analyses not only for each animal but also across animals will be needed, especially for evaluating the efficacy of a therapeutic treatment.
In summary, we reported the boundary detection of early brain tumor by analyzing the morphological features of microvascular networks and showed that detection of tumor microvasculature by μOCA provided superior sensitivity and specificity over other imaging modalities such as backscattering-based μOCT, CBFv-based μODT and white-light surface image. In addition, we reported in vivo longitudinal tracking of tumor progression and compared critical parameters characterizing the temporal correlations between tumor cell proliferation (GFP fluorescence), angiogenesis (μOCA) and tumor blood supply (μODT). The results suggest that this multimodality imaging approach may provide a new means to study cancer biology and microenvironment and to access the efficacy novel angiogenic or anti-angiogenic therapies for cancer treatment. With enhanced penetration depth [21] and improved sensitivity for microcirculatory flow detection [9], this multimodality approach may find widespread applications for biomedical diagnoses or assessments such as wound healing, tissue engineering growth that require simultaneous imaging of microvascular activities and fluorescence-labeling or -expressing cellular features.
ACKNOWLEDGMENTS
The authors thank P. Liu for assisting with tumor cell injection and J. Cao’s lab for providing cancer cells. This study was supported in part by NIH grants R01DA048808 (YP/CD), R01DA042597 (CD/YP) and R01DA029718 (CD/YP).
REFERENCES
- [1].Ostrom QT, Gittleman H, Xu J, Kromer C, Wolinsky Y, Kruchko C, Barnholtz-Sloan JS, Neuro Oncol. 2016, 18, v1. [DOI] [PMC free article] [PubMed] [Google Scholar]
- [2].Laws ER, Parney IF, Huang W, Anderson F, Morris AM, Asher A, Lillehei KO, Bernstein M, Brem H, Sloan A, Berger MS, Chang S, J. Neurosurg 2003, 99, 467. [DOI] [PubMed] [Google Scholar]
- [3].Hamstra DA, Galbán CJ, Meyer CR, Johnson TD, Sundgren PC, Tsien C, Lawrence TS, Junck L, Ross DJ, Rehemtulla A, Ross BD, Chenevert TL, J. Clin. Oncol 2008, 26, 3387. [DOI] [PMC free article] [PubMed] [Google Scholar]
- [4].Moffat BA, Chenevert TL, Lawrence TS, Meyer CR, Johnson TD, Dong Q, Tsien C, Mukherji S, Quint DJ, Gebarski SS, Robertson PL, Junck LR, Rehemtulla A, Ross BD, Proc. Natl. Acad. Sci. U. S. A 2005, 102, 5524. [DOI] [PMC free article] [PubMed] [Google Scholar]
- [5].Spence AM, Mankoff DA, Muzi M, Neuroimaging Clin. N. Am 2003, 13, 717. [DOI] [PubMed] [Google Scholar]
- [6].Van de Wiele C, Lahorte C, Oyen W, Boerman O, Goethals I, Slegers G, Dierckx RA, Int. J. Radiat. Oncol. Biol. Phys 2003, 55, 5. [DOI] [PubMed] [Google Scholar]
- [7].Brown EB, Campbell RB, Tsuzuki Y, Xu L, Carmeliet P, Fukumura D, Jain RK, Nat. Med 2001, 7, 864. [DOI] [PubMed] [Google Scholar]
- [8].Ren H, Du C, Pan Y, Opt. Lett 2012, 37, 1388. [DOI] [PMC free article] [PubMed] [Google Scholar]
- [9].Pan Y, You J, Volkow ND, Park K, Du C, Neuroimage 2014, 103, 492. [DOI] [PMC free article] [PubMed] [Google Scholar]
- [10].Ren H, Yuan Z, Waltzer W, Shroyer K, Pan Y, J. Urol 2010, 184, 1499. [DOI] [PubMed] [Google Scholar]
- [11].Wang S, Liu CH, Zakharov VP, Lazar AJ, Pollock RE, Larin KV, J. Biomed. Opt 2014, 19, 21102. [DOI] [PubMed] [Google Scholar]
- [12].Vakoc BJ, Lanning RM, Tyrrell JA, Padera TP, Bartlett LA, Stylianopoulos T, Munn LL, Tearney GJ, Fukumura D, Jain RK, Bouma BE, Nat. Med 2009, 15, 1219. [DOI] [PMC free article] [PubMed] [Google Scholar]
- [13].Zakharov VP, Bratchenko IA, Artemyev DN, Myakinin OO, Kornilin DV, Kozlov SV, Moryatov AA, J. Biomed. Opt 2015, 20, 25003. [DOI] [PubMed] [Google Scholar]
- [14].Lin R, Chen J, Wang H, Yan M, Zheng W, Song L, Quant. Imag. Med. Surg 2014, 5, 23. [DOI] [PMC free article] [PubMed] [Google Scholar]
- [15].Lu G, Fei B, J. Biomed. Opt 2014, 19, 10901. [DOI] [PMC free article] [PubMed] [Google Scholar]
- [16].Carmeliet P, Nature 2005, 438, 932. [DOI] [PubMed] [Google Scholar]
- [17].Weis SM, Cheresh DA, Nat. Med 2011, 17, 1359. [DOI] [PubMed] [Google Scholar]
- [18].Welter M, Bartha K, Rieger H, J. Theor. Biol 2009, 259, 405. [DOI] [PubMed] [Google Scholar]
- [19].Park K, You J, Du C, Pan Y, Quant. Imag. Med. Surg 2015, 5, 97. [DOI] [PMC free article] [PubMed] [Google Scholar]
- [20].Szatmári T, Lumniczky K, Désaknai S, Trajcevski S, Hídvégi EJ, Hamada H, Sáfrány G, Cancer Sci. 2006, 97, 546. [DOI] [PMC free article] [PubMed] [Google Scholar]
- [21].You J, Zhang Q, Park K, Du C, Pan Y, Opt. Lett 2015, 40, 4293. [DOI] [PMC free article] [PubMed] [Google Scholar]
- [22].Cadotte DW, Mariampillai A, Cadotte A, Lee KKC, Kiehl T-R, Wilson BC, Fehlings MG, Yang VXD, Biomed. Opt. Express 2012, 3, 911. [DOI] [PMC free article] [PubMed] [Google Scholar]
- [23].Zhao Y, Chen Z, Saxer C, Xiang S, de Boer JF, Nelson JS, Opt. Lett 2000, 25, 114. [DOI] [PubMed] [Google Scholar]
- [24].Gu X, Chen W, Volkow ND, Koretsky AP, Du C, Pan Y, Cell Rep. 2018, 23, 3878. [DOI] [PMC free article] [PubMed] [Google Scholar]
- [25].Gu X, Chen W, You J, Koretsky AP, Volkow ND, Pan Y, Du C, NeuroImage 2018, 165, 251. [DOI] [PMC free article] [PubMed] [Google Scholar]
- [26].Liu X, Kirby M, Zhao F, Biomed. Opt. Express 2014, 5, 3833. [DOI] [PMC free article] [PubMed] [Google Scholar]
- [27].Frangi AF, Niessen WJ, Vincken KL, Viergever MA, in Multiscale Vessel Enhancement Filtering, Vol. (Eds: Wells WM, Colchester A, Delp S), Springer Berlin Heidelberg, Berlin, Heidelberg: 1998, p. 130. [Google Scholar]
- [28].Yousefi S, Liu T, Wang RK, Microvasc. Res 2015, 97, 37. [DOI] [PMC free article] [PubMed] [Google Scholar]
- [29].You J, Li A, Du C, Pan Y, Appl. Phys. Lett 2017, 110, 011102. [DOI] [PMC free article] [PubMed] [Google Scholar]
- [30].You J, Volkow ND, Park K, Zhang Q, Clare K, Du C, Pan Y, JCI Insight 2017, 2, e90809. [DOI] [PMC free article] [PubMed] [Google Scholar]
- [31].Maurer CR, Rensheng Q, Raghavan V, IEEE Trans. Pattern Anal. Mach. Intell 2003, 25, 265. [Google Scholar]
- [32].Zhang Q, You J, Volkow ND, Choi J, Yin W, Wang W, Pan Y, Du C, J. of Biomedical Optics, 2016, 21(2), 026006 10.1117/1.JBO.21.2.026006. [DOI] [PMC free article] [PubMed] [Google Scholar]
- [33].Calvard TWRS, IEEE Trans. Syst. Man Cybern 1978, 8, 630. [Google Scholar]
- [34].Gonzalez RC, Woods RE, Digital Image Processing, 3rd ed., Upper Saddle River, NJ: Prentice-Hall Inc., 2006. [Google Scholar]
- [35].Kanopoulos N, Vasanthavada N, Baker RL, IEEE J Solid-State Circ. 1988, 23, 358. [Google Scholar]
- [36].Krupinski J, Stroemer P, Slevin M, Marti E, Kumar P, Rubio F, Neuroreport 2003, 14, 1171. [DOI] [PubMed] [Google Scholar]


