

Abstract
Recent advances in biotechnology and cancer genomics have afforded enormous opportunities for development of more effective anticancer therapies. A key thrust of this modern drug development paradigm is successful identification of predictive biomarkers that can distinguish patients who might be sensitive to new targeted therapies. To respond to this challenge, a number of phase III cancer trial designs integrating biomarker-based objectives have been proposed and implemented in oncology drug development. In this article, we provide an updated review of commonly used biomarker-based randomized clinical trial designs, with a particular focus on design efficiency. When the efficacy of a new therapy may be limited to a biomarker-defined subgroup, the choice of an appropriate randomized clinical trial design should be guided by the strength of the biomarker’s credentials. If compelling evidence indicates that a targeted therapy is beneficial only in a particular biomarker-defined subgroup, an enrichment design should be used. If there is strong evidence that the treatment is likely to be more beneficial in the biomarker-positive patients but a meaningful benefit is also possible in the biomarker-negative patients, then a properly powered biomarker-stratified design (eg, a subgroup-specific or Marker Sequential Test strategy) would provide the most rigorous determination of the sensitive populations. If the evidence supporting the predictive value of the biomarker is weak and the treatment is expected to work in the overall population, then a fallback design could be used. Careful selection of an appropriate phase III design strategy that integrates evaluation of a new anticancer therapy and its companion diagnostic is critical to the success of precision medicine in oncology.
INTRODUCTION
As a result of advances in biotechnology and improved understanding of cancer biology, therapeutic development in oncology has largely shifted from a focus on cytotoxic agents toward novel molecularly targeted and immune anticancer therapies. Efficient development of these new anticancer drugs requires identification of predictive biomarkers that can reliably differentiate the patient population into a subgroup that benefits from the therapy versus the remaining population, in whom the benefit-to-risk ratio is not sufficient for the therapy to be recommended. In such settings, the traditional broad-eligibility randomized clinical trial (RCT) that focuses on assessing the overall treatment effect in the entire study population may be suboptimal because this strategy may miss effective agents or result in recommending therapy to patients who do not benefit from it. To address this issue, increasingly common are phase III biomarker-driven RCTs that integrate the assessment of a new treatment with the validation of a putative predictive biomarker to identify a sensitive subpopulation that derives tangible clinical benefit from the treatment.1,2
In this article, we provide an up-to-date review of the commonly used biomarker-based phase III RCT designs. In the next section, we examine the salient features of each design, with a particular focus on design efficiency. We then briefly discuss key considerations for the conduct and monitoring of these designs. Finally, we provide practical examples of design implementations. The presentation concludes with a summary of the recommendations.
TRIAL DESIGN APPROACHES
This section provides an overview of the principal phase III biomarker-driven design approaches to integrated development of a new therapy and a companion biomarker. When designing a definitive phase III trial, the available evidence in the biomarker’s ability to identify sensitive patients may vary. The strength of this evidence (the biomarker’s credentials) is a key consideration in selecting an appropriate RCT design.3,4
To facilitate the presentation, we first define the following key statistical parameters used to design an RCT: the type I error α (significance level), which is the probability of incorrectly recommending an ineffective therapy; the power, which is the probability of correctly recommending an effective therapy; and the target treatment effect, which is the treatment effect that the study has a desired power to identify. A typical trial design is derived by selecting values for each of the three parameters according to the clinical setting at hand. For a desired target treatment effect, the RCT sample size will depend on the design type I error and power; a smaller type I error and/or higher power require more precision in estimating the treatment effect and thus larger sample sizes. Phase III trials typically use a one-sided type I error α = .025 and a power in the 80% to 90% range. Most phase III trials in oncology use time-to-event end points (eg, progression-free survival or overall survival [OS]), with the target treatment effect expressed in terms of the hazard ratio (HR). With a time-to-event end point, the precision of the HR estimate is a function of the number of observed events; thus, the sample size will also depend on the event rates, accrual rates, and length of follow-up.
Context
Key Objectives
Commonly used phase III biomarker-driven randomized clinical trial (RCT) designs are reviewed, with a particular focus on definitive evaluation of targeted treatments and their companion biomarkers.
Knowledge Generated
When the efficacy of a new cancer therapy may be limited to a biomarker-defined subgroup, the choice of an appropriate phase III RCT design should be guided by the strength of the biomarker credentials. Design efficiency considerations are particularly important in rare population settings that require balancing feasibility and evidential requirements.
Relevance
This article provides a practical guide for designing a biomarker-based phase III RCT. Careful selection of an appropriate phase III design strategy that integrates evaluation of a new anticancer therapy and its companion diagnostic can ensure proper use of resources and enhance the scientific rigor of trials in the era of precision oncology.
Biomarker With Very Strong Credentials
When there is sufficiently strong evidence that the treatment effect is limited to a specific biomarker-defined subgroup (eg, biomarker-positive patients), then the so-called enrichment design is often used (Fig 1A). In an enrichment design, eligibility is limited to the biomarker-positive patients, who are randomly assigned between the experimental and control arms. Thus, the enrichment design avoids treating patients with an experimental therapy that is not expected to work for them.
FIG 1.
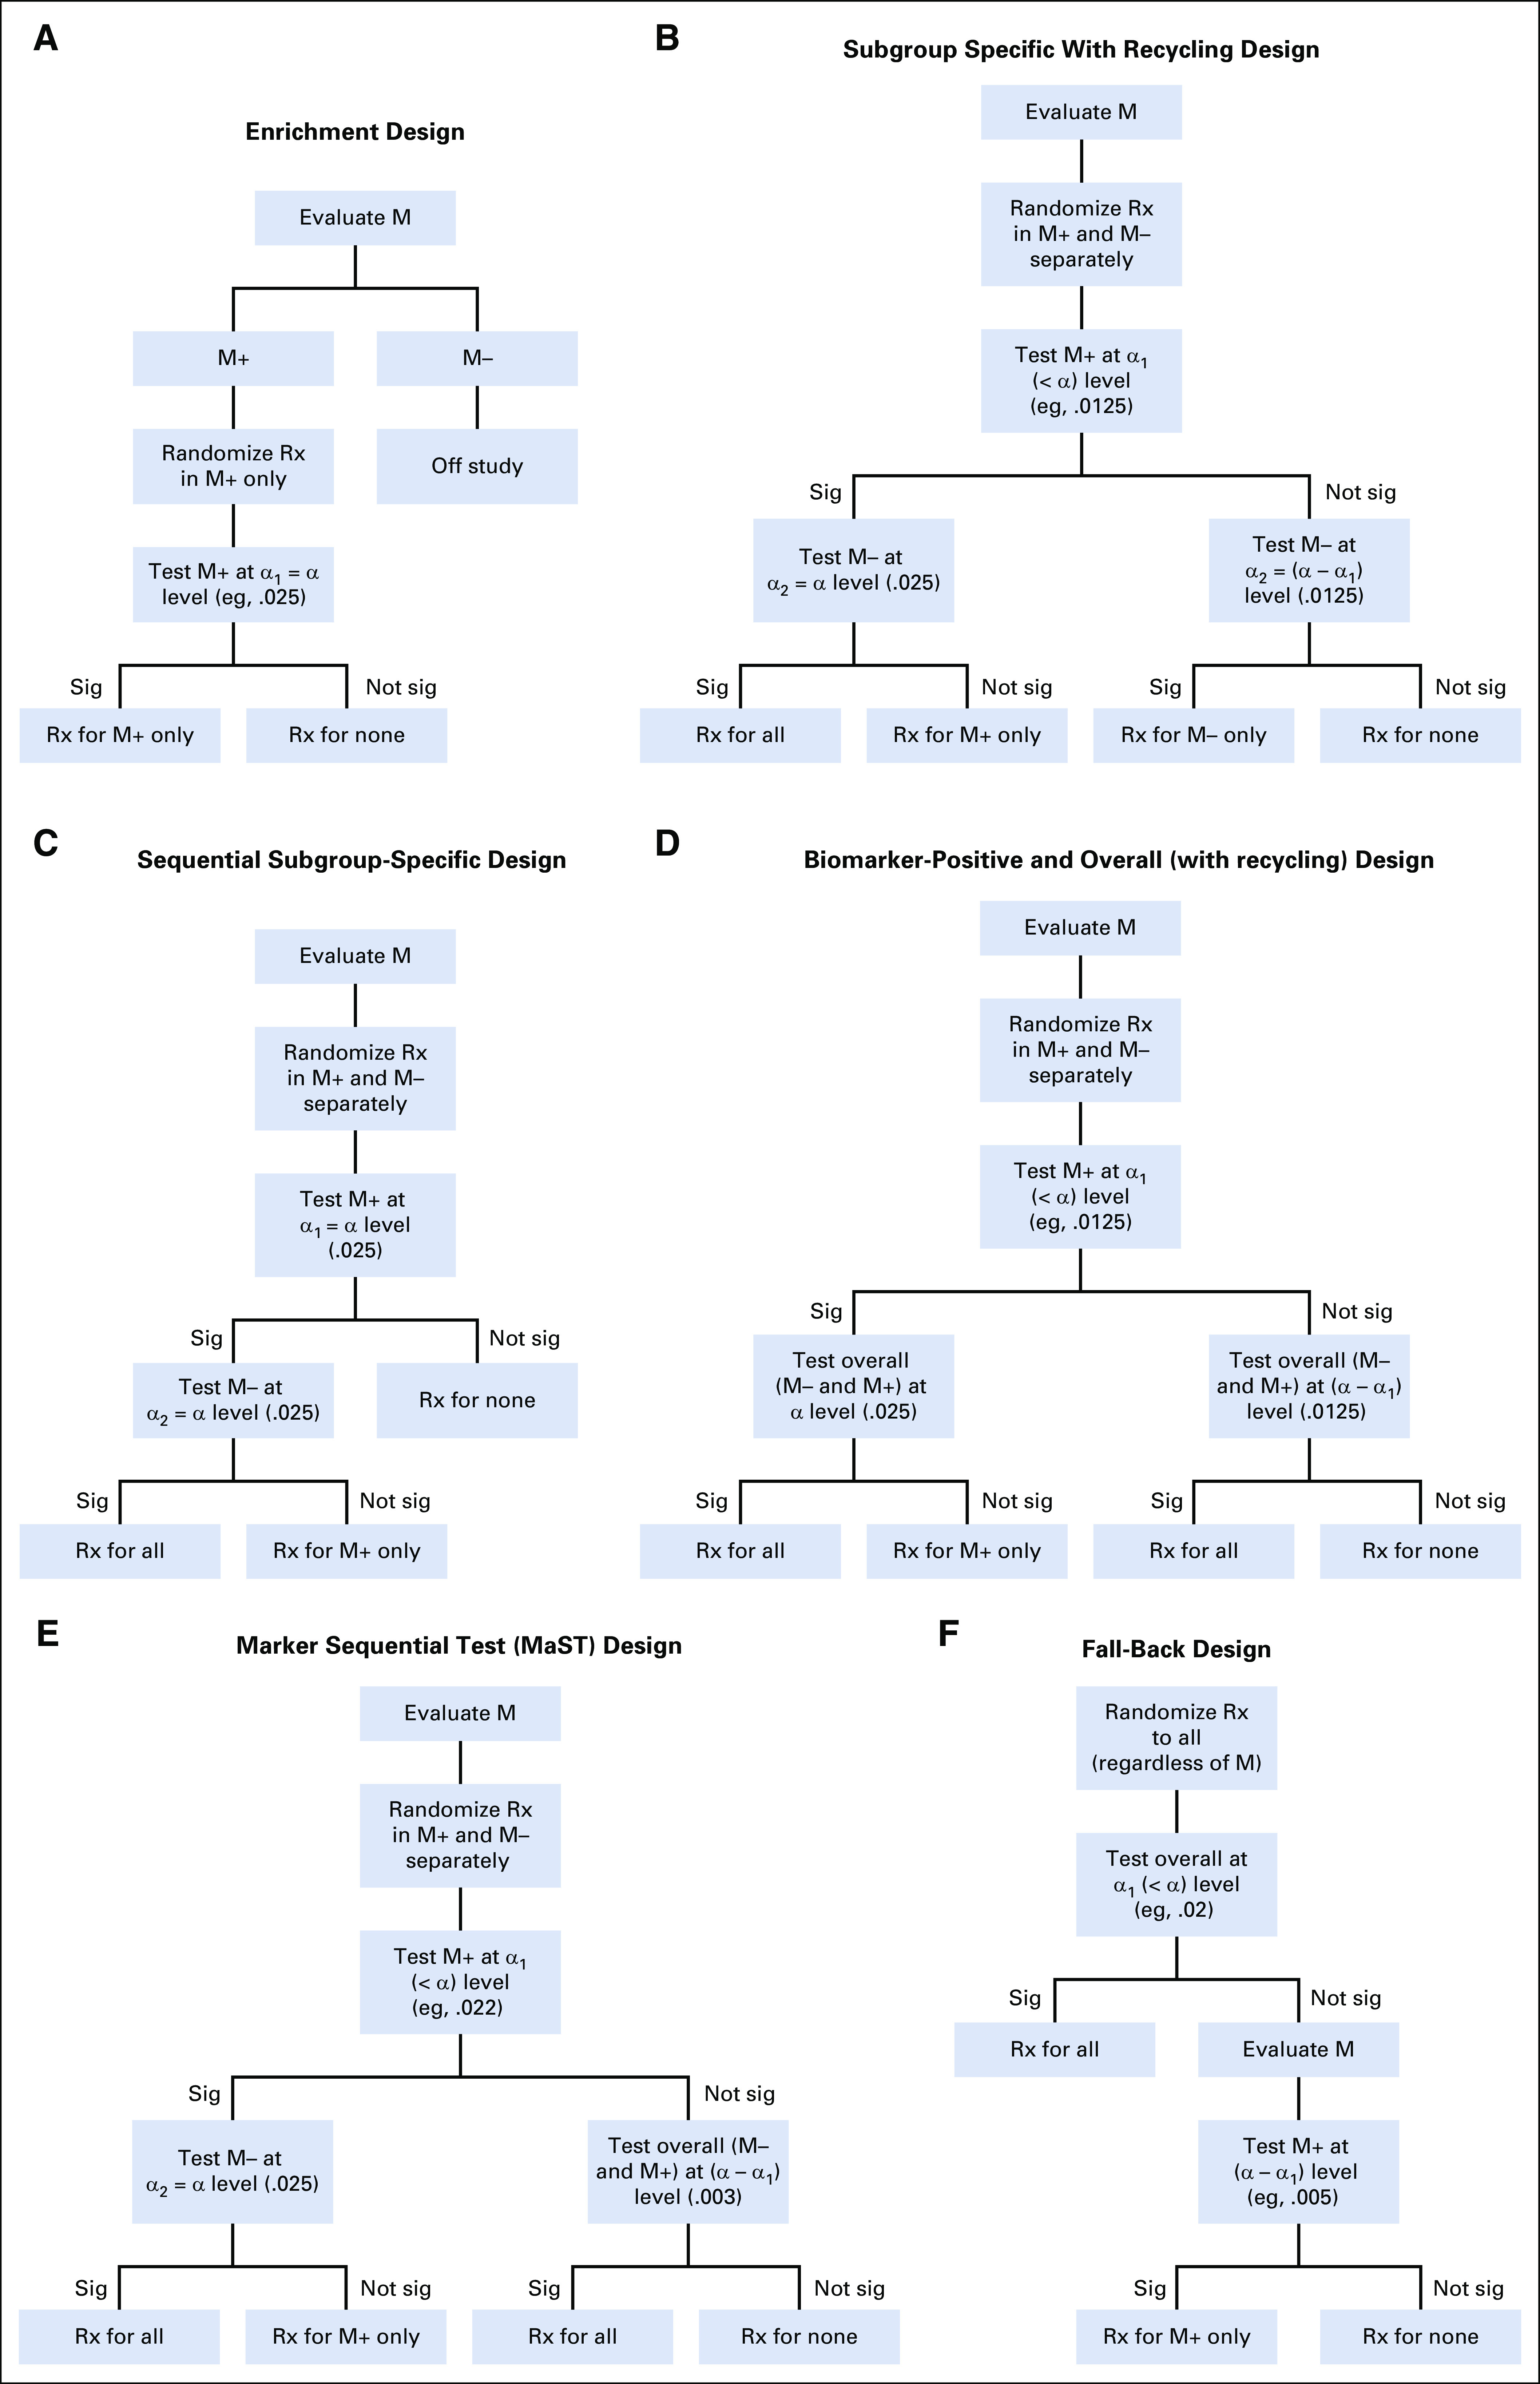
(A) Enrichment design. (B) Subgroup-specific with recycling design. (C) Sequential subgroup-specific design. (D) Biomarker-positive and overall (with recycling) design. (E) Marker Sequential Test (MaST) design. (F) Fallback design. M, marker; M+, marker positive; M−, marker negative; Rx, treatment; sig, significant.
The sample size calculation for enrichment designs is the same as for traditional (untargeted) RCTs that do not involve biomarkers. However, to identify biomarker-positive patients, an enrichment design must either include its own screening component or depend on outside screening (eg, from next-generation sequencing). Note that when biomarker positivity is low in the patient population, many patients will need to be screened to identify the number of biomarker-positive patients necessary to complete the study. For example, the BRIM3 trial (ClinicalTrials.gov identifier: NCT01006980),5 which evaluated a BRAF inhibitor vemurafenib in patients with BRAFv600E-mutated melanoma, had to screen 2,107 patients with melanoma to enroll 675 patients with the BRAF mutation. When the biomarker is indeed predictive in identifying patients who benefit from the therapy, an enrichment design is quite efficient because it can dramatically reduce the number of randomly assigned patients required (by focusing the trial on a population with an undiluted treatment effect).6
Despite its advantages, the enrichment design has some limitations. Positive results from an enrichment trial provide no information regarding the potential treatment benefit in biomarker-negative patients. If the targeted therapy indeed benefits all patients regardless of biomarker status, then restricting the trial population to only biomarker-positive patients slows trial accrual and limits the patient population that can ultimately be helped by the therapy.
Biomarker With Strong Credentials
At the time a definitive trial is being designed, there is often sufficient evidence to assume that the targeted therapy is more likely to benefit biomarker-positive patients than the biomarker-negative patients, but a potential treatment benefit in biomarker-negative patients cannot be ruled out. In this case, a design that randomly assigns patients to the experimental and control treatments within biomarker-defined subgroups, the so-called biomarker-stratified design, would be the most appropriate approach for a combined assessment of the therapy and the companion biomarker. A biomarker-stratified trial could provide sufficiently reliable information on the distribution of the risk-benefit ratio of the new therapy across biomarker subgroups to inform treatment efficacy and the need for the biomarker to guide treatment use.
Biomarker-positive and biomarker-negative (subgroup-specific) strategy.
The most straightforward approach to design a biomarker-stratified trial is based on separate testing of the biomarker-positive and biomarker-negative patient subgroups. Ideally, this subgroup-specific strategy should be powered to detect clinically relevant treatment effects in each subgroup, albeit in practice, the biomarker-positive subgroup is often prioritized. Because the biomarker-positive patients are typically expected to derive more benefit from the targeted therapy than the biomarker-negative patients, the design could assume a larger treatment effect for the former.
Because the design involves testing of two subpopulations, the overall study-wise probability of recommending an ineffective therapy to any subpopulation (overall type I error or overall significance level α of the design) is inflated if no account of the multiple testing is made. Accordingly, a multiple comparison procedure is used to control the overall significance level. In a well-established approach, one allocates the overall α between the biomarker-positive and biomarker-negative tests, as follows: significance level α1 (α1 ≤ α) to testing the biomarker-positive subgroup and significance level α2, calculated as α − α1, to testing the biomarker-negative subgroup. Then, one can use α recycling techniques to optimize the design by specifying the sequence in which the subgroups are tested, with the α level from an earlier significance test redistributed to the subsequent test.7-9 For example, one can first test the biomarker-positive subgroup at significance level α1. If that test is significant, then α1 is redistributed to testing the biomarker-negative subgroup, resulting in an α = α2 + α1 significance level available for testing the biomarker-negative subgroup; if the test of the biomarker-positive subgroup is not significant, then an α2 significance level is used for the biomarker-negative test (Fig 1B). This provides considerable flexibility for adjusting the design to a particular setting; at one extreme, one can allocate only half of the overall α to the initial testing of the biomarker-positive subgroup (α1 = α/2). More typically, a sequential subgroup-specific approach allocates the entire significance level α to first test the biomarker-positive subgroup. This is appropriate because one believes it is unlikely that the treatment works in the biomarker-negative subgroup unless it also works in the biomarker-positive subgroup. If the biomarker-positive test is significant, then α is redistributed to testing the biomarker-negative subgroup; if the biomarker-positive test is negative, all testing is stopped (Fig 1C). For example, the PRIME trial10 (ClinicalTrials.gov identifier: NCT00364013) evaluated the epidermal growth factor receptor antibody panitumumab in colorectal cancer. The trial was designed to first test the KRAS wild-type subgroup at the α1 = .025 significance level, with testing of the KRAS-mutated subgroup (at the α2 = .025 significance level) conditional on observing a significant result in the KRAS wild-type subgroup.
Biomarker-positive and overall strategy.
An indirect approach to identifying the sensitive patient population is to test the treatment effect in both the biomarker-positive subgroup and the overall population. To account for testing of the two populations, the biomarker-positive/overall designs use multiple testing procedures similar to those used in the subgroup-specific designs. Some designs allocate a portion of the study α to the biomarker-positive test (α1) and the rest (α2 = α − α1) to testing the overall population (Fig 1D).11 For example, the OAK study (ClinicalTrials.gov identifier: NCT02008227),12 which compared a programmed death ligand 1 (PD-L1) inhibitor atezolizumab with docetaxel as second-line therapy in non–small-cell lung cancer, was designed to test the PD-L1 high-expression subgroup at the α1 = .01 level and the overall population at the α2 = .015 level (.025 − .010). Other biomarker-positive/overall designs are implemented in a fully sequential manner, first testing the biomarker-positive population at the α significance level, and then, if significant, the overall population at the α significance level. For example, the IMvigor211 study (ClinicalTrials.gov identifier: NCT02302807),13 which compared atezolizumab with chemotherapy in urothelial carcinoma, was designed to first test the subgroup with greater than 5% PD-L1 expression; then, if that subgroup was significant, test the subgroup with greater than 1% PD-L1 expression; and then finally test the overall population if the first two tests were significant (all tests at the α = .025 level). Note that some trials apply this design in the reverse order; they first test the overall population, and only if this test is significant do they then test the biomarker-positive population.14 Requiring a significant result in the overall population to test the biomarker-positive subgroup is not logical and can result in failing to detect benefit limited to the biomarker-positive population. For example, the Impassion130 trial (ClinicalTrials.gov identifier: NCT02425891), which tested the addition of atezolizumab to chemotherapy in metastatic breast cancer, was not able to formally test OS in the PD-L1–positive population because the test in the overall population was not significant.14
Regardless of the particular implementation, a major concern with the biomarker-positive/overall testing approach is that when the benefit of the treatment is limited to the biomarker-positive patients, the design may inappropriately recommend the treatment to the biomarker-negative subgroup.8,15,16 This is because a statistically significant result in the overall population may be driven by a large treatment effect in the biomarker-positive patients even with no effect in the biomarker-negative subgroup. From the clinical perspective, if treatment efficacy is demonstrated in the biomarker-positive patients, then the only relevant question is whether the treatment works in the biomarker-negative patients. Because the biomarker-positive/overall approach cannot reliably determine the population for which the treatment should be indicated, it should be avoided. Even in circumstances where the biomarker-positive/overall approach is considered justified, the design should always specify biomarker-negative subgroup analysis as a secondary goal.
Marker Sequential Test design.
A potential concern with the subgroup-specific testing strategy is that it has lower power for therapies with moderate treatment effects that are similar across the biomarker subgroups, relative to the designs based on testing the overall population. (Indeed, this is often used to justify the biomarker-positive/overall strategy.) This concern is addressed by the Marker Sequential Test (MaST) design17 (Fig 1E), which incorporates sequential tests of the treatment effect in the biomarker-positive subgroup, biomarker-negative subgroup, and overall population (while controlling the probability of recommending an ineffective therapy to either biomarker-positive or biomarker-negative patients at significance level α). First, the biomarker-positive subgroup is tested at a slightly reduced significance level (eg, α1 = .022). If this test is significant, then the biomarker-negative subgroup is tested at the full significance level α (eg, α = .025). If the test in the biomarker-positive subgroup is not significant, then the overall population is tested at significance level of (α – α1). For example, a phase III study of blinatumomab (ECOG E1910; ClinicalTrials.gov identifier: NCT02003222) in acute lymphoblastic leukemia evaluated minimum residual disease as a predictive biomarker for blinatumomab15 using the MaST design.
The MaST design requires a slightly larger sample size (approximately 4%) than the sequential subgroup-specific design (because the biomarker-positive subgroup is tested at the reduced significance level α1). At the same time, it has considerably higher power in situations where the treatment effect is homogeneous across the biomarker subgroups.17
Biomarker With Weak Credentials
When the treatment is expected to be broadly effective (ie, reliable evidence for predictive value of the biomarker is lacking), the most appropriate strategy would be a design that enrolls all patients regardless of their biomarker status and focuses on the treatment effect in the overall population. However, it is still possible to incorporate a prospectively specified, statistically rigorous contingency plan to accommodate evaluation of the treatment effect in a biomarker-defined subgroup if the test in the overall population is negative.11 This is known as a fallback design.
In a fallback design, the treatment effect is first tested in the overall population using a slightly reduced significance level of α1. If the results are positive, then the treatment is recommended for the overall population; if the results are negative, then the test of treatment effect is performed in the biomarker-positive subgroup at a significance level of (α – α1) (Fig 1F). Because of the relatively small reduction in the significance level for the overall population test, the fallback design results only in a marginal inflation of sample size compared with a traditional RCT that uses the entire significance level on the overall test.11 Statistically speaking, the fallback approach is identical to the biomarker-positive/overall strategy (described earlier), and thus, it does not control for the probability of incorrectly recommending treatment to biomarker-negative patients when they do not benefit from it. Therefore, use of this design should be limited to settings where the treatment is expected to be widely beneficial and the biomarker prevalence is low (< 20%). When the prevalence is low, overall results are unlikely to be driven by the biomarker-positive effect, and conducting a subgroup-specific design may be infeasible. Even when the use of the fallback design is considered justified, one should always include estimation of the treatment effect in the biomarker-negative patients as a secondary goal.
Unlike the designs described earlier, the fallback design is initially focused on testing the overall population, so there is no need to know patient biomarker status up front. Thus, it is possible to incorporate the final stages of the biomarker validation into a fallback design. One potential setting for this strategy is when a candidate biomarker is scored on a continuous or ordinal scale but a suitable cutoff for identifying sensitive patients has not been established.18 Another potential setting is when a predictive genomic signature is simultaneously developed and validated on the trial data.19 For example, the DERMA trial (ClinicalTrials.gov identifier: NCT00796445),20 which evaluated a MAGE-A3 immunotherapeutic in adjuvant melanoma, was designed to test the overall population at the α = .02 level. If the test in the overall population was negative, then the design would test the treatment effect in the subset of patients with the study-validated predictive gene signature (gene signature positive) at the α = .005 level. Because the impact of misspecifying the biomarker in the biomarker trial design could be dramatic,4 one should use designs with biomarker validation features in these settings.
BIOMARKER ASCERTAINMENT AND ACCRUAL CONSIDERATIONS
Except for the fallback approach, most biomarker designs assume that the patient’s biomarker status is known at the time of study entry. However, in some situations, it may be difficult to ascertain the biomarker status before randomization (eg, when the biomarker assay turnaround time is not short). Theoretically, one can still use the biomarker-stratified approaches described earlier by allowing biomarker assessment to be performed after randomization; this is sometimes known as the all-comers approach. In large RCTs the distribution of the biomarker status will be naturally balanced between the arms, so use of stratified randomization for balancing is not necessary. However, because some patients may not have their biomarker status determined (eg, due to missing or insufficient tumor specimen or assay failure), for the subgroup-specific designs, the primary analysis is limited to patients with determined status (for the MaST and the biomarker-positive/overall designs, all patients can be used in the overall test). If the biomarker assessments are done without knowledge of the randomized treatment assignment and outcome, this approach provides an unbiased evaluation of the biomarker. Unfortunately, use of the all-comers approach is generally not practical for biomarkers with strong credentials: some of these designs prospectively specify independent sample size goals for the biomarker-positive and biomarker-negative subgroups, and most others include interim monitoring that may at some point restrict accrual to one of the subgroups (see Interim Monitoring). An advantage of obtaining the biomarker assessment up front is that only patients used in the analyses will be enrolled. Furthermore, in some settings, the requirement of having a biomarker assessment to enter the study may encourage more rigorous specimen handling and thus improve the biomarker ascertainment success rate. A compromise approach (between requiring the biomarker assessment up front and not having any biomarker-related eligibility requirements) is to require specimen submission for study enrollment with the biomarker assessed at a later point.
INTERIM MONITORING
For ethical and efficiency reasons, most RCTs incorporate interim monitoring rules that allow stopping the study as soon as the study question is answered. This includes stopping when there is early convincing evidence that the new therapy is superior as well as stopping when there is sufficient early evidence that the new therapy is no better (or even worse) than the standard therapy (futility).
For biomarker-driven designs, interim monitoring rules should reflect the nature of the study goal.21 For the enrichment and fallback designs (that at least initially focus on a single population), interim monitoring can be performed in all randomly assigned patients (albeit an argument is sometimes made for more conservative futility monitoring in the overall population in fallback designs to minimize the possibility of premature stopping before the potential benefit in the biomarker-positive subgroup can be ruled out). The designs with strong biomarker credentials that enroll biomarker-negative patients (subgroup-specific, biomarker-positive/overall, and MaST designs) should include an adequate interim futility rule in the biomarker-negative subgroup because the therapy may be ineffective in that population.1,11 If the biomarker-negative subgroup is closed for futility, the study could continue enrolling biomarker-positive patients. The biomarker-positive subgroup can include superiority monitoring; if that subgroup is stopped early for superiority, the study could continue enrolling biomarker-negative patients to evaluate the therapy in that subgroup.
IMPLEMENTATION OF THE BIOMARKER DESIGNS
We now illustrate how the biomarker designs are implemented for a range of biomarker prevalences. Suppose one is evaluating a new treatment in a setting where the median OS with the current standard of care is 12 months (in both biomarker subgroups) and the expected accrual rate is 30 patients per month. In the biomarker-positive subgroup, one would like to be able to detect an HR of 0.6, whereas in the biomarker-negative subgroup, an HR in the 0.7-0.75 range is desired. Table 1 lists possible design implementations for biomarkers with 50%, 25%, and 10% prevalence. For each biomarker subgroup, the table lists the probability of recommending the new therapy for that subgroup along with sample sizes, accrual durations, and follow-up periods (note that for practical reasons, biomarker trials are usually designed to have accrual open to both groups, with the overall sample size defined by the sample size required for the biomarker-positive subgroup).
TABLE 1.
Implementation of the Biomarker Designs for a Range of Biomarker Prevalences

The first step in the design is to determine the number of biomarker-positive patients needed to detect the target treatment effect for that subgroup. In the current setting, for biomarkers with 50%, 25%, and 10% prevalence, one needs to enroll 300, 240, and 150 patients, respectively, to have acceptable power for an HR of 0.6. Note that as the biomarker prevalence decreases, to ensure adequate power for the biomarker-positive subgroup (in the subgroup-specific and biomarker-positive/overall designs), one needs to allocate an increasing portion of the study α to the biomarker-positive subgroup (50%, 76%, and 80% of α is allocated to α1 for 50%, 25%, and 10% prevalence, respectively). When biomarker-positive prevalence is relatively high (close to 50%), additional (longer) follow-up will be required on the biomarker-negative patients to achieve acceptable power for detecting the desired target effect. Conversely, when the biomarker prevalence is low, additional (longer) follow-up may be required for the data to mature in the biomarker-positive subgroup.
For the MaST, biomarker-positive/overall, and fallback designs in Table 1, the probabilities of recommending therapy for a given subgroup include recommendations that are based on both the subgroup-specific and the overall tests. One can see in Table 1 that for the biomarkers in the 25% to 50% range, MaST, biomarker-positive/overall, and subgroup-specific with recycling designs provide the best power in the situations where treatment is beneficial in both subgroups. However, it is important to remember that, unlike the biomarker-positive/overall design, the MaST approach is explicitly designed to control for the probability of an incorrect treatment recommendation for biomarker-negative patients. The implications of this are illustrated in Table 2, in which the new therapy is only beneficial in the biomarker-positive subgroup. One can see that although the MaST design controls the probability of recommending ineffective therapy to biomarker-negative patients at 2.5%, this probability could be high for the biomarker-positive/overall design (eg, 69% and 40% in 50% and 25% prevalence cases, respectively). Thus, the biomarker-positive/overall design is generally inappropriate for the phase III settings.
TABLE 2.
Power of the Designs in Table 1 When There Is No Benefit in the Biomarker-Negative Patients

SUMMARY
When biomarker positivity is rare (prevalence is ≤ 10%), designing a biomarker-stratified trial could be challenging because timely accrual of the necessary number of biomarker-positive patients may be impossible. For example, in the clinical settings considered in Table 1, if the biomarker prevalence is 10%, then it takes 50 months to enroll 150 biomarker-positive patients (1,500 patient total) to have 80% power for an HR of 0.6 (after an additional 18 months of follow-up). In rare biomarker settings where the biomarker credentials are weak (ie, the treatment is expected to have broad benefit), one can use the fallback design (eg, with 10% prevalence, a 600-patient fallback design would have 82% power when there is some effect in both biomarker subgroups; Table 1). Note that in this rare biomarker setting, when the treatment effect is limited to the biomarker-positive patients, the probability of the fallback design incorrectly recommending ineffective therapy to the biomarker-negative patients is low (5%; Table 2). Unfortunately, in this case, the probability of recommending the therapy for biomarker-positive patients is low as well (22% to detect an HR of 0.6). However, the probability is higher for stronger benefit (eg, 85% for an HR of 0.33).
When a rare biomarker has strong credentials, there may be no alternative but to screen a large number of patients to enroll enough biomarker-positive patients to reliably evaluate benefit in that subgroup. In this case, one would need to design the study so that enrollment of biomarker-negative patients can be stopped (after the required number of these patients are enrolled), with only biomarker-positive enrollment allowed thereafter. This can be done by specifying separate accrual goals for each subgroup based on independently targeting an appropriate HR in each subgroup. Similarly, if the biomarker prevalence is greater than 50%, then one may have to continue accrual to the biomarker-negative subgroup after the biomarker-positive subgroup finishes accrual. Note that in special situations where many patients in the community already have their biomarker status available, an enrichment design with a low-prevalence biomarker may still be performed in a timely manner.
When the efficacy of a new therapy may be limited to a biomarker-defined subgroup, the choice of an appropriate phase III RCT design should be guided by the strength of the biomarker credentials. If compelling evidence indicates that a targeted therapy is beneficial only in a particular biomarker-defined subgroup, an enrichment design should be used. If there is strong evidence that the treatment is likely to be more beneficial in the biomarker-positive patients but a meaningful benefit is also possible in the biomarker-negative subgroup, then a properly powered biomarker-stratified design using a subgroup-specific strategy with recycling or the MaST strategy would provide the most accurate and efficient determination of the sensitive population. If the evidence supporting the predictive value of the biomarker is weak and the treatment is expected to work in the overall population, then a fallback design could be used.
Biomarker-driven randomized phase III trials are resource intensive and often take a long time to complete. Careful selection of an appropriate phase III design strategy that integrates evaluation of a new anticancer therapy and its companion diagnostic is critical to the success of precision medicine in oncology.
AUTHOR CONTRIBUTIONS
Conception and design: All authors
Collection and assembly of data: All authors
Data analysis and interpretation: All authors
Manuscript writing: All authors
Final approval of manuscript: All authors
Accountable for all aspects of the work: All authors
AUTHORS' DISCLOSURES OF POTENTIAL CONFLICTS OF INTEREST
The following represents disclosure information provided by authors of this manuscript. All relationships are considered compensated. Relationships are self-held unless noted. I = Immediate Family Member, Inst = My Institution. Relationships may not relate to the subject matter of this manuscript. For more information about ASCO's conflict of interest policy, please refer to www.asco.org/rwc or ascopubs.org/po/author-center.
No potential conflicts of interest were reported.
REFERENCES
- 1.Sargent DJ, Conley BA, Allegra C, et al. Clinical trial designs for predictive marker validation in cancer treatment trials. J Clin Oncol. 2005;23:2020–2027. doi: 10.1200/JCO.2005.01.112. [DOI] [PubMed] [Google Scholar]
- 2.Freidlin B, McShane LM, Korn EL. Randomized clinical trials with biomarkers: Design issues. J Natl Cancer Inst. 2010;102:152–160. doi: 10.1093/jnci/djp477. [DOI] [PMC free article] [PubMed] [Google Scholar]
- 3.Freidlin B, Korn EL. Biomarker enrichment strategies: Matching trial design to biomarker credentials. Nat Rev Clin Oncol. 2014;11:81–90. doi: 10.1038/nrclinonc.2013.218. [DOI] [PubMed] [Google Scholar]
- 4.Hoering A, Leblanc M, Crowley JJ. Randomized phase III clinical trial designs for targeted agents. Clin Cancer Res. 2008;14:4358–4367. doi: 10.1158/1078-0432.CCR-08-0288. [DOI] [PMC free article] [PubMed] [Google Scholar]
- 5.Chapman PB, Hauschild A, Robert C, et al. Improved survival with vemurafenib in melanoma with BRAF V600E mutation. N Engl J Med. 2011;364:2507–2516. doi: 10.1056/NEJMoa1103782. [DOI] [PMC free article] [PubMed] [Google Scholar]
- 6.Maitournam A, Simon R. On the efficiency of targeted clinical trials. Stat Med. 2005;24:329–339. doi: 10.1002/sim.1975. [DOI] [PubMed] [Google Scholar]
- 7.Bretz F, Maurer W, Brannath W, et al. A graphical approach to sequentially rejective multiple test procedures. Stat Med. 2009;28:586–604. doi: 10.1002/sim.3495. [DOI] [PubMed] [Google Scholar]
- 8.Dmitrienko A, Millen B, Lipkovich I. Multiplicity considerations in subgroup analysis. Stat Med. 2017;36:4446–4454. doi: 10.1002/sim.7416. [DOI] [PubMed] [Google Scholar]
- 9.Dmitrienko A, D’Agostino R., Sr Traditional multiplicity adjustment methods in clinical trials. Stat Med. 2013;32:5172–5218. doi: 10.1002/sim.5990. [DOI] [PubMed] [Google Scholar]
- 10.Douillard JY, Siena S, Cassidy J, et al. Randomized, phase III trial of panitumumab with infusional fluorouracil, leucovorin, and oxaliplatin (FOLFOX4) versus FOLFOX4 alone as first-line treatment in patients with previously untreated metastatic colorectal cancer: The PRIME study. J Clin Oncol. 2010;28:4697–4705. doi: 10.1200/JCO.2009.27.4860. [DOI] [PubMed] [Google Scholar]
- 11.Redman MW, Crowley JJ, Herbst RS, et al. Design of a phase III clinical trial with prospective biomarker validation: SWOG S0819. Clin Cancer Res. 2012;18:4004–4012. doi: 10.1158/1078-0432.CCR-12-0167. [DOI] [PMC free article] [PubMed] [Google Scholar]
- 12.Rittmeyer A, Barlesi F, Waterkamp D, et al. Atezolizumab versus docetaxel in patients with previously treated non-small-cell lung cancer (OAK): A phase 3, open-label, multicentre randomised controlled trial. Lancet. 2017;389:255–265. doi: 10.1016/S0140-6736(16)32517-X. [DOI] [PMC free article] [PubMed] [Google Scholar]
- 13.Powles T, Durán I, van der Heijden MS, et al. Atezolizumab versus chemotherapy in patients with platinum-treated locally advanced or metastatic urothelial carcinoma (IMvigor211): A multicentre, open-label, phase 3 randomised controlled trial. Lancet. 2018;391:748–757. doi: 10.1016/S0140-6736(17)33297-X. [DOI] [PubMed] [Google Scholar]
- 14.Schmid P, Adams S, Rugo HS, et al. Atezolizumab and nab-paclitaxel in advanced triple-negative breast cancer. N Engl J Med. 2018;379:2108–2121. doi: 10.1056/NEJMoa1809615. [DOI] [PubMed] [Google Scholar]
- 15.Freidlin B, Sun Z, Gray R, et al. Phase III clinical trials that integrate treatment and biomarker evaluation. J Clin Oncol. 2013;31:3158–3161. doi: 10.1200/JCO.2012.48.3826. [DOI] [PMC free article] [PubMed] [Google Scholar]
- 16.Rothmann MD, Zhang JJ, Lu L, et al. Testing in a prespecified subgroup and the intent-to-treat population. Drug Inf J. 2012;46:175–179. doi: 10.1177/0092861512436579. [DOI] [PMC free article] [PubMed] [Google Scholar]
- 17.Freidlin B, Korn EL, Gray R. Marker sequential test (MaST) design. Clin Trials. 2014;11:19–27. doi: 10.1177/1740774513503739. [DOI] [PMC free article] [PubMed] [Google Scholar]
- 18.Jiang W, Freidlin B, Simon R. Biomarker-adaptive threshold design: A procedure for evaluating treatment with possible biomarker-defined subset effect. J Natl Cancer Inst. 2007;99:1036–1043. doi: 10.1093/jnci/djm022. [DOI] [PubMed] [Google Scholar]
- 19.Freidlin B, Simon R. Adaptive signature design: An adaptive clinical trial design for generating and prospectively testing a gene expression signature for sensitive patients. Clin Cancer Res. 2005;11:7872–7878. doi: 10.1158/1078-0432.CCR-05-0605. [DOI] [PubMed] [Google Scholar]
- 20.Dreno B, Thompson JF, Smithers BM, et al. MAGE-A3 immunotherapeutic as adjuvant therapy for patients with resected, MAGE-A3-positive, stage III melanoma (DERMA): A double-blind, randomised, placebo-controlled, phase 3 trial. Lancet Oncol. 2018;19:916–929. doi: 10.1016/S1470-2045(18)30254-7. [DOI] [PubMed] [Google Scholar]
- 21.Crowley J, Hoering A.(eds)Early stopping of clinical trialsinHandbook of Statistics in Clinical Oncology(ed 3)Boca Raton, FL, CRC Press; 2012. pp211-228 [Google Scholar]