Abstract
PURPOSE
To determine if radiomic measures of tumor heterogeneity derived from baseline contrast-enhanced computed tomography (CE-CT) are associated with durable clinical benefit and time to off-treatment in patients with recurrent ovarian cancer (OC) enrolled in prospective immunotherapeutic trials.
MATERIALS AND METHODS
This retrospective study included 75 patients with recurrent OC who were enrolled in prospective immunotherapeutic trials (n = 74) or treated off-label (n = 1) and had baseline CE-CT scans. Disease burden (total tumor volume, number of disease sites), radiomic measures of intertumor heterogeneity (cluster-site entropy, cluster-site dissimilarity), and intratumor heterogeneity of the largest lesion (Haralick texture features) were computed. Associations of clinical, conventional imaging, and radiomic measures with durable clinical benefit and time to off-treatment were examined.
RESULTS
In univariable analysis, fewer disease sites, lower intertumor heterogeneity (lower cluster-site entropy, lower cluster-site dissimilarity), and lower intratumor heterogeneity of the largest lesion (higher energy) were significantly associated with durable clinical benefit (P ≤ .031). More disease sites, presence of pleural disease and/or distant metastases, higher intertumor heterogeneity (higher cluster-site entropy, higher cluster-site dissimilarity), and higher intratumor heterogeneity of the largest lesion (higher Contrastlargest-lesion) were significantly associated with shorter time to off-treatment (P ≤ .034). In multivariable analysis, higher Energylargest-lesion (indicator of lower intratumor heterogeneity; P = .006; odds ratio, 1.41) and fewer disease sites (P = .003; odds ratio, 1.64) remained significant indicators of durable clinical benefit (multivariable model C-index, 0.821). Higher cluster-site dissimilarity (indicator of higher intertumor heterogeneity) was a modest but single independent indicator of shorter time to off-treatment (P = .004; hazard ratio, 1.19; C-index, 0.6).
CONCLUSION
Fewer disease sites and lower intra- and intertumor heterogeneity modeled from the baseline CE-CT may indicate better response of OC to immunotherapy.
INTRODUCTION
Ovarian cancer (OC) is the deadliest gynecologic malignancy.1,2 Most patients respond to cytoreductive surgery and platinum-based chemotherapy but eventually experience recurrence and develop chemotherapy-resistant disease.3 Poor outcomes relate to the loss in DNA repair mechanisms, resulting in highly heterogeneous tumors that exhibit early clonal evolution and rapid onset of chemotherapy resistance.3-6
Immunotherapy is a novel treatment paradigm that has emerged with improved understanding of the cancer-immunity cycle.7 Immune checkpoint inhibitors are effective in multiple solid tumors. In OC, immunotherapy remains a promising approach, although the success is limited to date.8-10
Individualized selection of therapy requires the accurate prediction of benefit. Thus, the discovery of predictive biomarkers is a major research direction. Rapid clonal evolution and potential under-sampling of tumor heterogeneity (TH) with single-site, single–time-point biopsies are important barriers to achieving effective predictive classifiers in highly heterogeneous OC.11,12 To date, most progress has been achieved through multiregion genomic analysis, which, realistically, would not be possible for every patient and lesion.6,12-14
Standard-of-care medical imaging presents a latent opportunity to capture the entire tumor in space and, if obtained serially, in time.15 The emerging field of radiomics allows the noninvasive extraction of high-dimensional data from medical images to provide insights into tumor biology—including “virtual sampling” of TH within a single lesion (intra-TH) and between lesions (inter-TH).16 This information may complement molecular profiling in personalizing medical decisions, including the selection of patients appropriate for treatment with chemoimmunotherapy.
CONTEXT
Key Objective
Individualized selection of therapy requires accurate prediction of patient benefit. In ovarian cancer, early multiregion dissemination and profound tumor heterogeneity (TH) limit the discovery of predictive biomarkers on the basis of the tissue samples from few individual tumors. We aimed to explore the potential of quantitative analysis of standard-of-care computed tomography (CT) to noninvasively capture spatial TH and predict response to immunotherapy.
Knowledge Generated
Quantitative analysis of pretreatment CT including radiomic measures of TH may facilitate the delivery of precision medicine by identifying patients who derive most benefit from immunotherapy. Indeed, fewer disease sites and lower image-based intra-TH were two independent indicators of durable clinical benefit; higher inter-TH was a single independent indicator of shorter time to off-treatment.
Relevance
Number of disease sites and radiomic measures of TH derived from baseline CT are potential noninvasive predictive imaging biomarkers of response that require additional exploration in the context of multimodal approaches to ovarian cancer.
In patients with OC, contrast-enhanced computed tomography (CE-CT) is the standard-of-care imaging to evaluate disease extent at all phases of patient management, including initial diagnosis, post-treatment surveillance, disease recurrence, and assessment of response. Although the Response Evaluation Criteria in Solid Tumors (RECIST) version 1.1 and immune-related response criteria are applied to assess response to immunotherapies, there is a paucity of predictive biomarkers of response to chemotherapy, targeted therapy, and immunotherapy to facilitate the selection of rational individualized combination therapies.17-19
The potential of radiomics to model intra- and inter-TH on imaging to predict the response of OC to immunotherapy is an unexplored area. Thus, the purpose of this study was to determine if radiomic measures of TH derived from baseline CE-CT are associated with durable clinical benefit and time to off-treatment in patients with recurrent OC enrolled in immunotherapeutic trials.
MATERIALS AND METHODS
The institutional review board approved this retrospective Health Insurance Portability and Accountability Act–compliant study and waived the requirement for written informed consent.
Patient Population
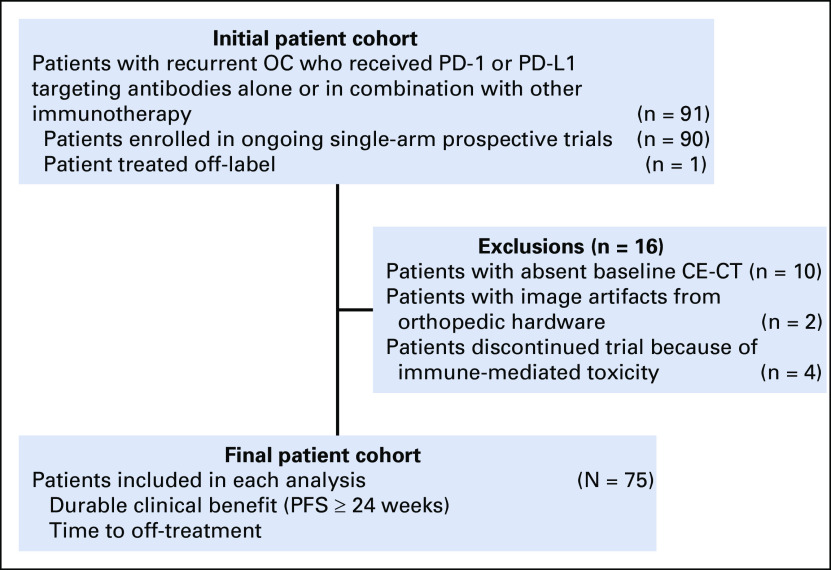
The search of our institutional database identified 91 women with recurrent OC who were enrolled in ongoing prospective immunotherapeutic trials that targeted programmed cell death 1 (PD-1) or programmed cell death-ligand 1 (PD-L1) alone or in combination with other agents. After the exclusion of 16 patients, the final study population included 75 patients (Appendix Fig A1).
Patient records were reviewed to collect clinical information and determine the first treatment date and the off-study date resulting from progression. Progression was defined as clinical deterioration and/or imaging progression according to immune-related RECIST.19 Time to off-treatment was defined as the number of days between the first treatment date and the off-study date. Durable clinical benefit was defined as progression-free survival of 24 or more weeks.20-22
CT Analysis
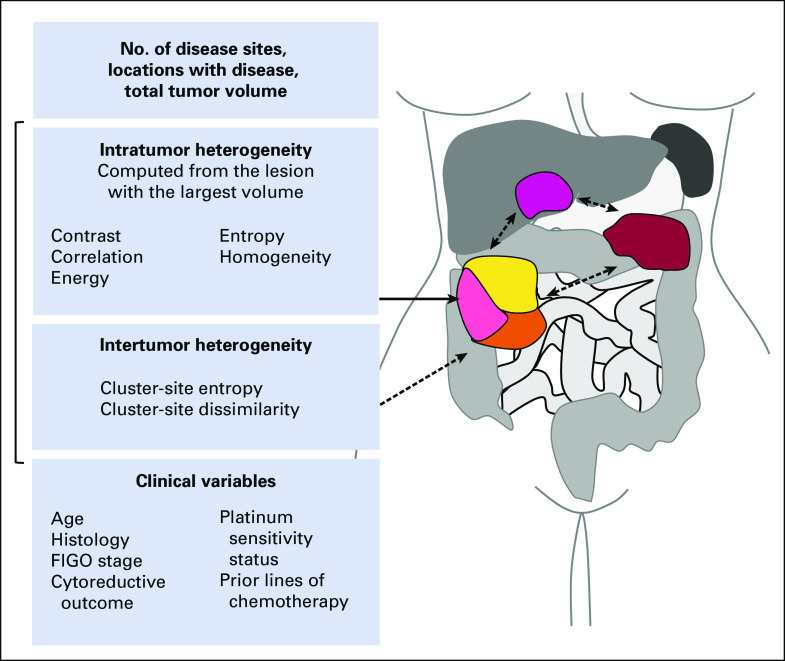
Baseline CE-CT acquisition parameters, segmentation of the entire tumor burden, and computation of volumes of interest (VOIs) are described in the Appendix. For each patient, the total tumor volume (TTV) was determined as the sum of VOIs of all lesions (Fig 1). The VOIs were also compared to identify the lesion with the largest volume. The number of anatomic sites with disease and locations were recorded as in the Appendix. All locations were mutually exclusive.
FIG 1.
Illustration shows clinical variables and baseline contrast-enhanced computed tomography–derived features, including intra- and intertumor heterogeneity measures. FIGO, International Federation of Gynecology and Obstetrics.
Extraction of Radiomic Measures From Baseline CT Scans
Texture features were extracted directly from CT images without additional preprocessing to avoid imaging blur and spurious features. Five intra-TH measures (Haralick texture features) derived from the lesion with the largest volume and two inter-TH measures (cluster-site entropy, cluster-site dissimilarity) were computed following the steps described here (Fig 1).23
Step 1: Per-voxel Haralick texture features.
We computed Haralick texture of contrast, correlation, energy, entropy, and homogeneity using in-house implementation of C++ within the Insight Segmentation and Registration Toolkit.23-25 These measures were computed per voxel within each segmented rescaled VOI using a neighborhood size of 11 × 11 × 1 and 32 histogram bins for the gray-level co-occurrence matrix. The above per-voxel Haralick texture measures were then used to compute intra-TH measures (step 2) and inter-TH measures (step 3).
Step 2: Intratumor heterogeneity measures.
We chose the lesion with the largest volume on the basis of the results of prior radiomic studies.26,27 Intra-TH measures were summarized as the mean of all per-voxel Haralick texture features within VOIlargest-lesion. Intra-TH measures consisted of Energylargest-lesion, Entropylargest-lesion, Contrastlargest-lesion, Homogeneitylargest-lesion, and Correlationlargest-lesion.
Step 3: Intertumor heterogeneity texture measures.
We computed inter-TH measures (cluster-site entropy, cluster-site dissimilarity) in several steps. First, per-voxel Haralick textures within all segmented tumors were clustered together to produce subregions within all lesions using the Kernel K-means clustering method, where each subregion represents a group of voxels with highly similar texture values. We then described each subregion by the mean of all per-voxel Haralick texture values within that subregion.
Second, pairwise subregion dissimilarities were computed as the Euclidean distance between the subregion pairs, where each subregion was represented by the mean textural values inside that subregion. The subregion pair dissimilarities were converted into a dissimilarity map capturing the textural differences between the subregions within all lesions. The dissimilarity map provides a visual representation of all pairwise subregion dissimilarities per-patient and quantifies the magnitude of textural differences within all the subregion pairs. A highly textured dissimilarity map points to greater frequency of dissimilarities between subregions, whereas more a homogeneous map suggests less frequent dissimilarities between subregions.
Third, a group dissimilarity matrix was computed from the dissimilarity map for each patient. Group dissimilarity matrix is a two-dimensional histogram that captures the frequency of dissimilarities between subregions and the number of neighboring dissimilar subregions.
Cluster-site entropy (cSE) was computed directly from the all subregion pair dissimilarities. It captures the variability in dissimilarities between subregions and is calculated using the Shannon entropy formula:
where N is the number of subregion pairs.
Cluster-site dissimilarity (cluDiss) was derived from the group dissimilarity matrix. It captures the asymmetry in the distribution of dissimilarities between subregions and is computed using the following formula:
where K is the number of dissimilarity levels and M is group size levels, and are the normalized mean of dissimilarity levels and group sizes, and G is the group dissimilarity matrix.
Computational methods are available publicly via the open-source software CERR (getInterTumorHeteroFeature at https://github.com/cerr/CERR/).28
Statistical Analysis
TTV and several radiomic measures demonstrated highly skewed distributions and were logarithmically transformed. Given the large number of sites, all disease locations were grouped as follows: peritoneal disease (PD)/ovarian tumor, lymphadenopathy ± PD/ovarian tumor, pleural disease/distant metastases ± lymphadenopathy ± PD/ovarian tumor.
Cox proportional hazard regressions were used to examine univariable and multivariable associations of clinical variables and CE-CT measures with time to off-treatment. Patients were censored if they were receiving treatment at the time of last follow-up. An estimated hazard ratio (HR) greater than 1 indicated higher risk of off-treatment, and HR less than 1 indicated lower risk. Univariable and multivariable associations of clinical variables and CE-CT measures with durable clinical benefit were examined with the logistic regression. The variables with P values < .1 at the univariable analysis were entered into the multivariable model. A sensitivity analysis was performed using cross-validated least absolute shrinkage and selection operator (LASSO) regression including all variables with 200 random repetitions.29 The variables in final multivariable models were also selected more than 90% of the time by LASSO regression. Model discriminability was assessed with the receiver operating characteristic analysis and internally validated concordance statistics (C-index).30 In multivariable logistic regression, bias-correct C-index was estimated using the bootstrapping technique. The R code used in the analysis is available for download through https://github.com/harveerar/JCO-PO-OvaryImmunotherapy.
The correlations between the measures significant at multivariable analyses (number of disease sites, intra-TH [Energylargest-lesion] and inter-TH [cluster-site dissimilarity]) were tested with Spearman correlation coefficient (rs). A test with P value < .05 was considered statistically significant. All statistical analyses were performed in the software package R, version 3.5.
RESULTS
Patients
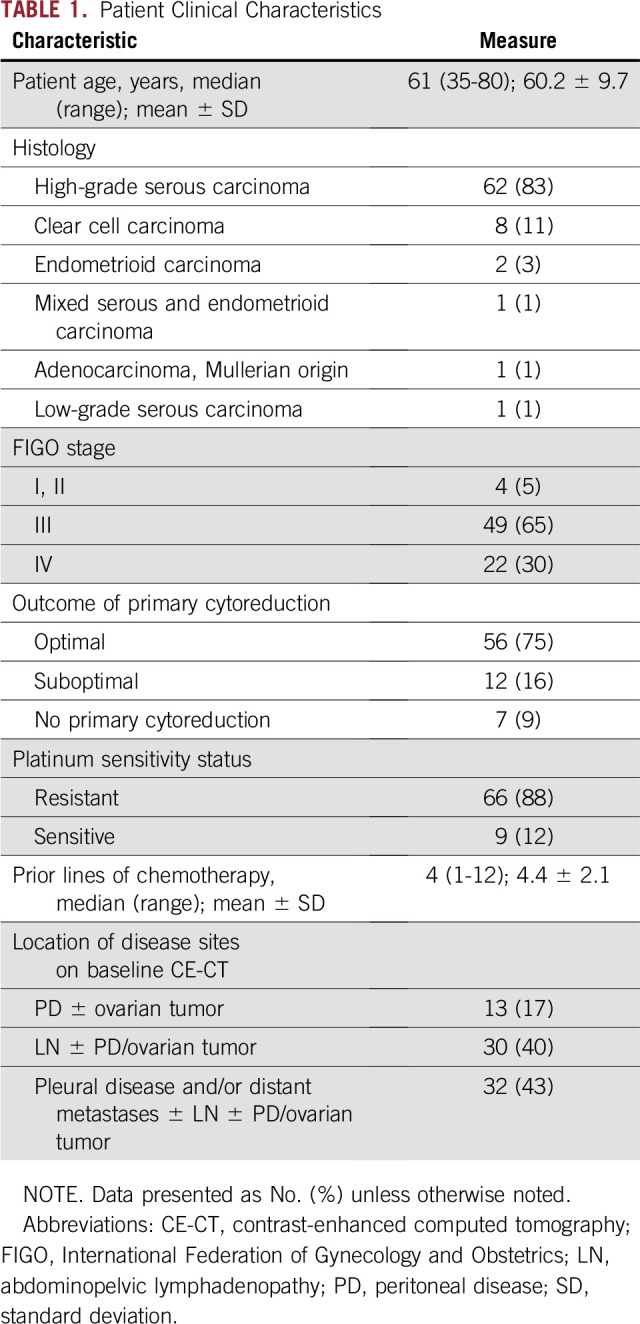
Patient clinical characteristics are listed in Table 1. The median time to off-treatment was 84 days (95% CI, 56 to 104 days). Patients with durable clinical benefit were classified as deriving benefit from treatment (n = 14; 18.7%), and those without durable clinical benefit were classified as deriving no benefit from immunotherapy (n = 61; 81.3%).
TABLE 1.
Patient Clinical Characteristics
Univariable and Multivariable Associations of Clinical and CE-CT–Derived Variables With Durable Clinical Benefit
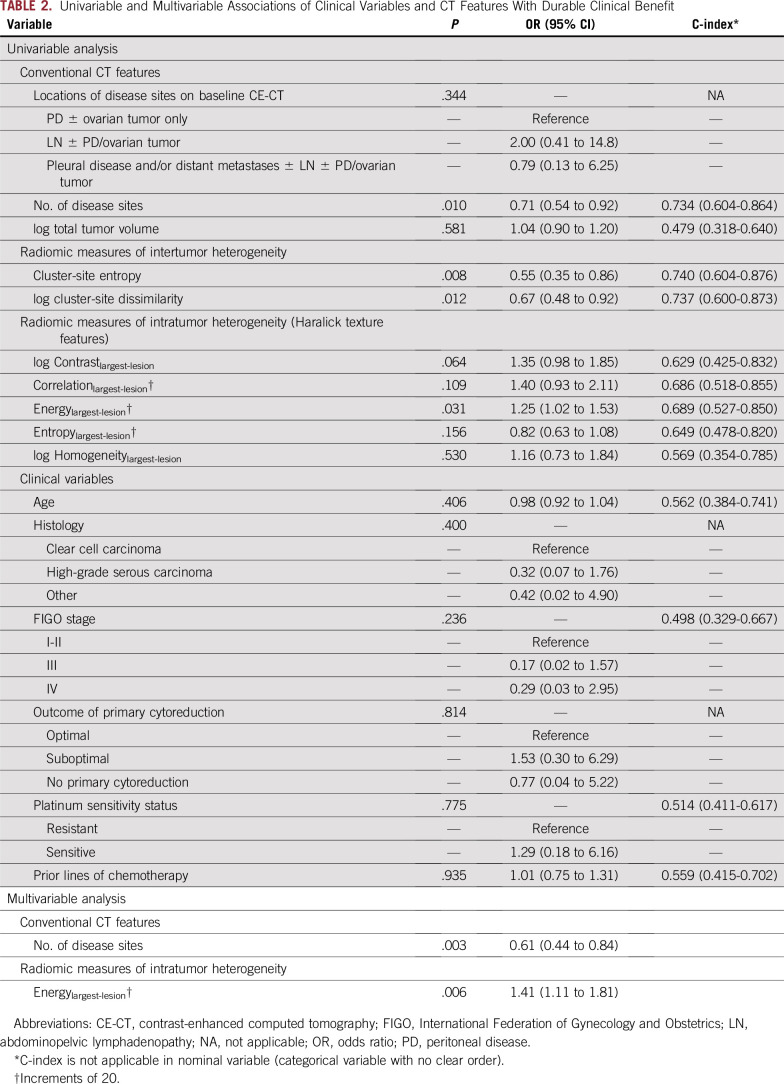
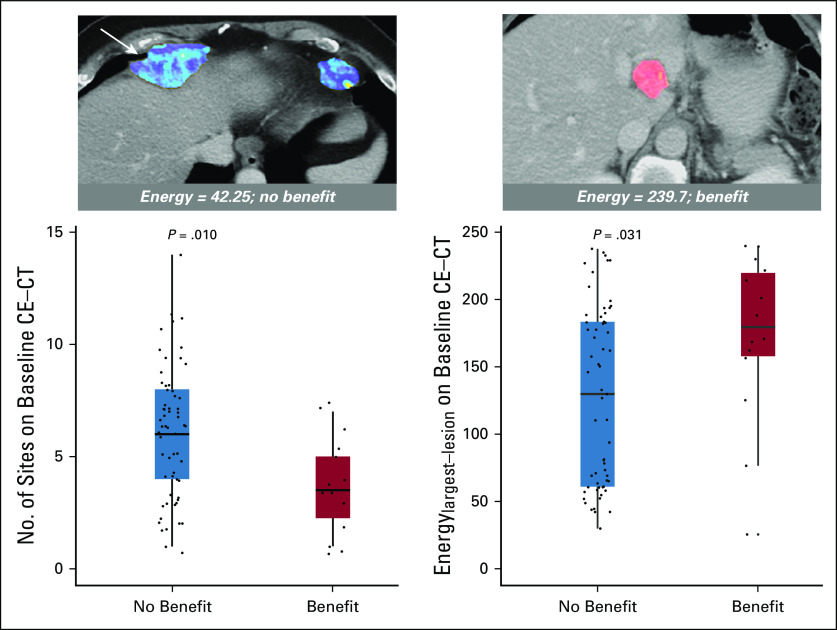
In univariable analysis, fewer disease sites (P = .010), lower inter-TH indicated by lower cluster-site entropy (P = .008) and lower cluster-site dissimilarity (P = .012), and lower intra-TH indicated by higher Energylargest-lesion (P = .031) were associated with durable clinical benefit, whereas clinical variables and disease distribution were not (Table 2; Fig 2).
TABLE 2.
Univariable and Multivariable Associations of Clinical Variables and CT Features With Durable Clinical Benefit
FIG 2.
Axial baseline computed tomography (CT) images from two different patients with Energy (a measure of intratumor heterogeneity) overlaid on segmented tumors (arrow points to the largest lesion). Two box plots illustrate the univariable associations of baseline CT-derived number of disease sites and Energylargest-lesion (a measure of intratumor heterogeneity) with durable clinical benefit (progression-free survival ≥ 24 weeks). CE, contrast enhanced.
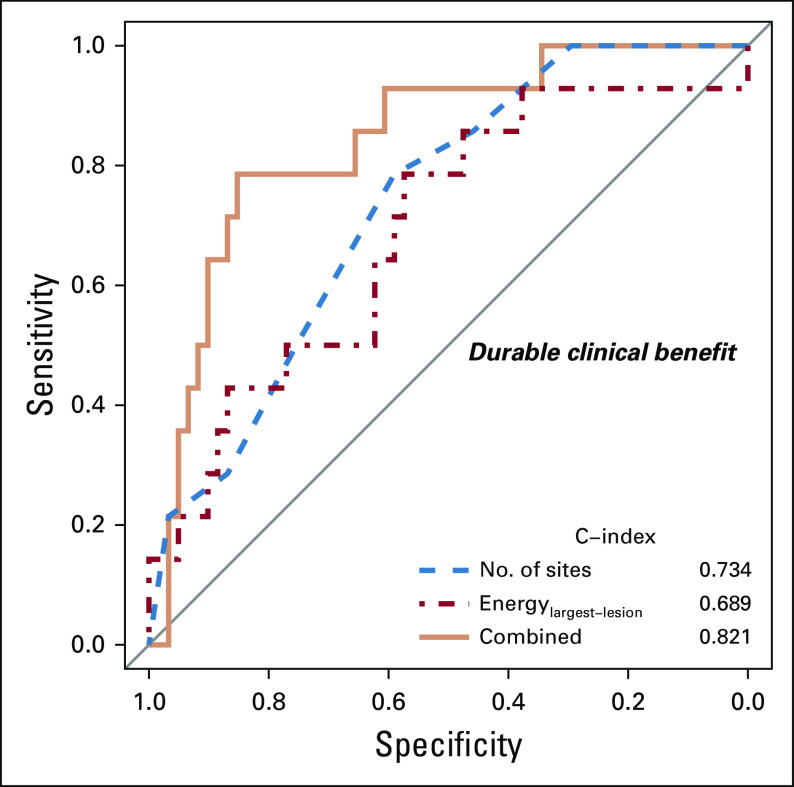
In multivariable analysis, fewer disease sites (P = .003; odds ratio, 1.64; 95% CI, 1.19 to 2.27) and higher Energylargest-lesion (indicating lower intra-TH; P = .006; odds ratio, 1.41; 95% CI, 1.11 to 1.81) remained as the only variables associated with durable clinical benefit (C-index, 0.821; Table 2; Fig 3). Notably, none of the patients with more than seven disease sites on baseline CE-CT (n = 18) achieved durable clinical benefit.
FIG 3.
Plots of receiver operating characteristic curves demonstrating the discriminatory ability of the model to identify patients with durable clinical benefit on the basis of number of disease sites, Energylargest lesion, or both.
Univariable and Multivariable Associations of Clinical and CE-CT–Derived Variables With Time to Off-Treatment
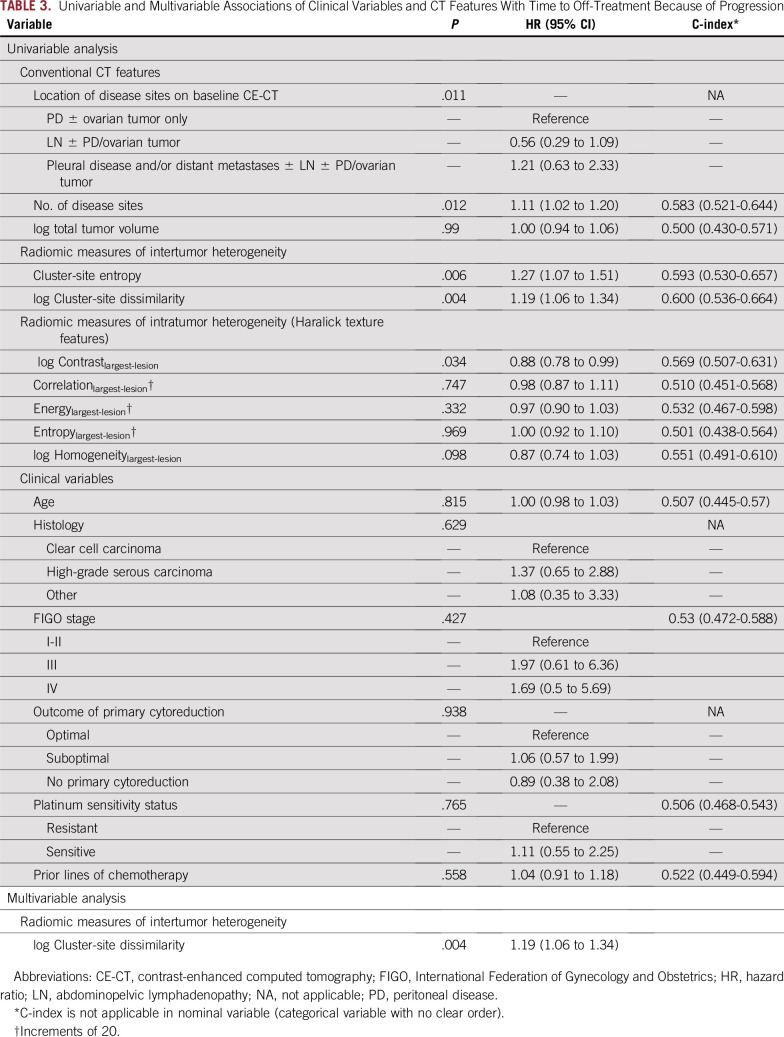
In univariable analysis, shorter time to off-treatment was associated with more disease sites (P = .012), presence of pleural disease/distant metastases (P = .011), higher inter-TH indicated by higher cluster-site entropy (P = .006) and higher cluster-site-dissimilarity (P = .004), and higher intra-TH indicated by higher Contrastlargest-lesion (P = .034; Table 3). Clinical variables were not significant.
TABLE 3.
Univariable and Multivariable Associations of Clinical Variables and CT Features With Time to Off-Treatment Because of Progression
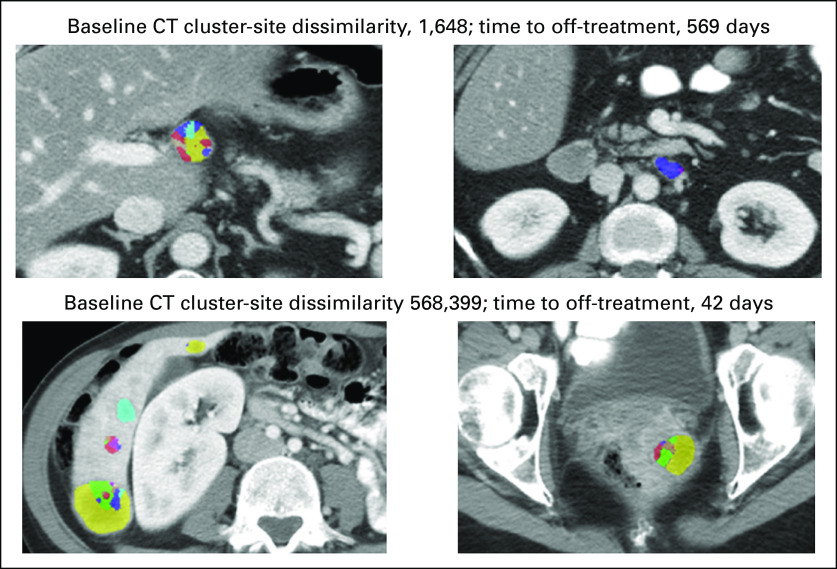
Higher inter-TH indicated by higher cluster-site-dissimilarity (P = .004; HR, 1.19) remained as the only variable associated with shorter time to off-treatment in multivariable analysis (C-index, 0.6; Table 3; Appendix Fig A2).
Correlations Between Variables Associated With Clinical Outcomes at Multivariable Analyses
Inter-TH (cluster-site dissimilarity) was positively correlated with number of disease sites (rs, 0.842). Intra-TH (Energylargest-lesion) did not correlate with either number of disease sites or inter-TH (cluster-site dissimilarity; rs, 0.151 and 0.087, respectively).
DISCUSSION
OC often presents with advanced-stage high-volume disease, demonstrates high intra- and inter-TH in the genome and tumor microenvironment (TME), and exhibits rapid onset of chemotherapy resistance.5,11,12,31 Because most patients with OC present with disseminated disease, multiregion analysis is important to adequately capture TH and develop useful biomarkers of response and prognosis. Ideally, these biomarkers should be based on noninvasive or minimally invasive approaches to capture/sample TH and enable individualized treatment decisions in OC.
Our study highlights a novel noninvasive method to model spatial TH via radiomic analysis of CT and demonstrates that quantitative image-based measures relate to clinical outcomes—specifically, the prediction of response to immunotherapy. We found that fewer disease sites and lower intra-TH of the largest lesion (higher Energylargest-lesion) were the only indicators of durable clinical benefit at multivariable analysis. Combined fewer disease sites and lower intra-TH (higher Energylargest-lesion) were a composite indicator of durable clinical benefit, with a C-index of 0.821. Notably, none of the patients with more than seven disease sites experienced durable clinical benefit. Higher inter-TH (higher cluster-site dissimilarity) was the only indicator of shorter time to off-treatment at multivariable analysis. Clinical variables, TTV, and locations of disease on CE-CT were not predictive of response. Our results suggest that quantitative analysis of baseline CE-CT may facilitate the delivery of precision medicine to patients with OC by identifying patients who may benefit from immunotherapy.
Immunotherapy has transformed the treatment of several solid and hematologic malignancies, but the efficacy varies across tumor types and patients.10 OC exhibits poor response to immune checkpoint inhibitors, with the biomarkers of response and resistance remaining unexplored. Effective implementation will likely require additional insights into cancer-immune interactions, refinement of immune-response criteria, and development of multifactorial predictive biomarkers (eg, cancer immunogram) to personalize the selection of immunotherapy.32,33 At present, predictive biomarkers of response to immunotherapy include PD-1 expression, tumor mutational/neoantigen burden assessment, tumor-infiltrating lymphocyte evaluation, and immune gene expression assays.34 Nevertheless, composite multimodal multifaceted biomarkers that noninvasively capture spatiotemporal TH will likely be necessary to comprehensively assess immune TME and serve as clinical decision support for prognosis inference and prediction of response.
TH is an important element to consider and quantify in any OC cancer immunogram, because lower TH has been associated with improved prognosis and better response to chemotherapy and immunotherapy.5,11,12 Two recent articles highlight the importance of spatial TH for accurate characterization of immune TME in OC. Jiménez-Sánchez et al11 performed a comprehensive immune profiling of metastases from a single patient with recurrent OC. They identified distinct immune TME among metastatic sites and linked T-cell infiltration and exclusion within spatially distinct metastases to differential growth trajectories. Recently, Zhang et al12 analyzed 212 multiregion samples from 38 patients with newly diagnosed high-grade serous ovarian cancer (HGSOC). The major finding was that the immune TME varied in space and potentially shaped clonal selection in patients with newly diagnosed HGSOC.
CE-CT is the standard-of-care imaging approach that is widely used for the evaluation of patients with OC. Phenotypic TH is apparent on CT images and can be quantified over entire tumor and/or multiple sites of tumor with radiomic analysis. Although baseline CE-CT–derived predictive biomarkers of response to immunotherapy would be useful as clinical decision support tools, the interplay of radiomic measures with clinical outcomes in OC remains largely unexplored. Few studies to date have evaluated the role of radiomics to model spatial TH and capture immune TME.33,35
Vargas et al35 proposed a novel method to compute inter-TH on CE-CT and found higher inter-TH to associate with shorter overall survival and greater risk of incomplete surgical resection in 38 patients with newly diagnosed advanced-stage HGSOC. We applied a similar approach to quantify TH in our patient cohort. In contrast to the approach used by Vargas et al,35 we computed inter-TH between lesions rather than anatomic sites of disease for more comprehensive assessment of TH. We also modeled textural heterogeneity within tumor by subdividing each lesion into subregions with similar values of texture features. Similar to Vargas et al,35 we demonstrated that higher inter-TH measured on the baseline CE-CT was associated with worse outcomes, as indicated by shorter time to off-treatment.
Although the assessment of image-based inter-TH is a promising approach, at present, the translation to routine clinical practice and clinical trials is limited by labor-intensive multiregion tumor segmentation and complex computational analysis across multiple tumors. In the future, deep learning techniques may enable accurate semiautomated tumor delineation reducing manual effort. In the meantime, we also examined the value of such readily accessible quantitative measures as number of disease sites, TTV, and intra-TH of the largest lesion measured from the baseline CE-CT. We found fewer disease sites and lower intra-TH of the largest lesion (indicated by higher Energylargest-lesion) to be significant indicators of durable clinical benefit at multivariable analysis. This finding is potentially explained by a positive relationship between the number of disease sites and inter-TH (rs, 0.842), with more disease sites increasing the probability of inter-TH and reducing the likelihood of durable clinical benefit. The number of disease sites is a ready-to-use measure that is available from the baseline CE-CT and does not require sophisticated computation, and yet it is not currently used in clinical practice or clinical trials to infer response. Our study suggests that the number of disease sites is a measure that deserves additional investigation and potentially indirectly reflects spatial TH in OC.
TTV on baseline CE-CT was not predictive of response to immunotherapy in our cohort. Peritoneal bulky disease (at least one peritoneal implant > 5 cm) was previously evaluated as a predictor of response to chemotherapy in OC. Recognizing the substantial limitation of this measure in assessing tumor burden, peritoneal bulky disease was not predictive of chemotherapy response.36,37 The role of tumor volume/burden as a prognostic measure and a predictor of benefit from immunotherapy requires additional investigation. For example, Joseph et al38 found that baseline tumor size was independently prognostic of survival, but not of response to pembrolizumab, in patients with melanoma. In contrast, Sun et al33 reported that tumor volume was not predictive of overall survival in patients with various cancer types treated with anti–PD-1 and anti–PD-L1 immunotherapy.
Only one prior study examined the interplay between radiomic analysis, effector T cells, tumor immune phenotypes, and response to immunotherapy.33 In this study, Sun et al33 developed a CE-CT–derived radiomic signature of CD8 cells by segmenting and extracting image-based features from either biopsied or largest lesion in patients with one of five advanced solid malignant tumors. They then proceeded to validate their radiomic signature of CD8 cells in two independent cohorts and demonstrate the associations of radiomic signature of CD8 cells with tumor immune phenotype and response to immunotherapy, respectively. Similar to their study, we analyzed baseline CE-CT in patients with OC and demonstrated the associations between quantitative image-based radiomic measures and response to immunotherapy.
Our study has several limitations. First, our cohort was sourced from a single institution. The sample size was relatively small because of the relatively recent implementation of immunotherapy in clinical trials of OC. Our findings may have been influenced by variation in treatment regimens. Thus, our results require validation in large, preferably multicenter, cohorts of patients once these become available. Second, given the hypothesis-generating nature of our study, a single experienced radiologist segmented all tumor on each baseline scan. Automated or semi-automated methods to segment OC implants are currently absent. Their development is key to implementing robust pipelines for quantitative image analysis. Once available, it will be imperative to compare the performance of these techniques to human observers with various levels of experience. Third, a small set of well-established image features (ie, Haralick textures) were extracted because of the relatively small sample size and focus on image-based inter-TH, a measure computed on the basis of Haralick features.35 Larger numbers of features, including new features (eg, Co-Occurence of Local Anisotropic Gradient Orientations [CoLIAGe]), should be explored further, but this will require a large data set (independent training and validation cohorts) to reliably estimate the model’s performance.
In conclusion, the number of disease sites and radiomic measures of TH from baseline CE-CT are potential predictive imaging biomarkers of responsiveness to immunotherapy. These require additional validation in the context of multi-omic approaches to OC.
ACKNOWLEDGMENT
We thank Joanne Chin, MFA, ELS, for her editorial assistance with this manuscript.
APPENDIX
Computed Tomography Scans
Acquisition parameters were uniform to ensure minimal interscan variability. All baseline contrast-enhanced computed tomography scans (CE-CTs) were acquired using multidetector CT scanners with 16 to 256 rows of detectors (GE Healthcare, Chicago, IL). Five of 75 scans were performed at outside institutions and digitized into the institutional picture archiving and communication system (Centricity PACS; GE Healthcare, Chicago, IL). CE-CTs were acquired in the late portal venous phase after the administration of nonionic intravenous contrast (in-house CT scans: 150 mL of Omnipaque 300, GE Healthcare, Chicago, IL) and oral contrast (in-house CT scans: either 30 mL of Omnipaque 300 diluted in 1,000 mL of water or oral barium sulfate (Bracco E-Z-EM, Quebec, QC, Canada). Acquisition parameters were as follows: slice thickness, 5 mm; 120 kVp; automatic milliampere setting, 120 to 440 mAs; and pitch, 0.984 and 1.375.
Tumor Segmentation on Baseline CE-CT Scans
An experienced radiologist (Y.H., with 9 years of experience in gynecologic oncologic imaging) performed manual segmentation of the entire tumor volume on each baseline CE-CT scan. Using the Insight Segmentation and Registration Toolkit–SNAP version 3.4 software, the radiologist traced the outer contour of each lesion on every axial slice with tumor (Yushkevich, et al: Neuroimage 31:1116-1128, 2006). All lesions (≥ 10 mm in maximum diameter) and enlarged lymph nodes (≥ 10 mm in maximum short-axis diameter) were segmented, with care taken to exclude adjacent tumor-free tissues. Baseline and preceding CT scans were reviewed as needed to facilitate the differentiation of tumor from postsurgical or post-treatment change. Any questions that arose during segmentation were resolved via discussion and consensus between two radiologists (Y.H. and Y.L.), with 9 and 12 years of experience, respectively, in gynecologic oncologic imaging.
Segmented images were rescaled to intensities from 0 to 255 before the extraction of texture features to ensure comparable ranges of intensity across all studies. Regions of interest (ROIs) belonging to the same lesion (ROIlesion) and originating from the set of contiguous craniocaudal images in the same anatomic location were summed to create the volume of interest for that lesion (VOIlesion). Volumes of interest for lesions with noncontiguous ROIs were obtained by summing the volumes of various groups of contiguous ROIs in the same anatomic location as follows: , where N is the number of groups of contiguous ROIs belonging to the same lesion. The radiomic features for the lesions were represented as a matrix of features with the row elements corresponding to the voxels enclosed within all the ROIs belonging to that lesion and the columns corresponding to the individual Haralick textures.
Description of Haralick Texture Features
Energy captures the average frequency of co-occurring CT intensities between neighboring voxels within a tumor, such that tumors with more homogeneous appearance have higher energy. Entropy quantifies the variability in the distribution of CT intensities within the tumor, such that tumors with more heterogeneous appearance have larger entropy. Contrast and homogeneity magnify the differences in spatial heterogeneity between voxels with similar CT intensities versus those with highly variable CT intensities. Correlation measures the frequency of positive or negative correlation of CT intensities between neighboring voxels within a tumor.
FIG A1.
Flowchart shows the details of patient selection process. CE-CT, contrast-enhanced computed tomography; OC, ovarian cancer; PD-1, programmed cell death 1; PD-L1, programmed cell death ligand 1; PFS, progression-free survival.
FIG A2.
Axial baseline computed tomography (CT) images from two patients with Haralick texture subregions (used to compute intertumor heterogeneity measures) overlaid on segmented tumors illustrating the association between lower intertumor heterogeneity and longer time to off-treatment (top set of images) versus higher intertumor heterogeneity and shorter time to off-treatment (bottom set of images).
Footnotes
Supported by the National Cancer Institute Grant No. P30 CA008748 (paid to institution), the Uehara Memorial Foundation Postdoctoral Fellowship and Japan Society for the Promotion of Science Overseas Research Fellowship (Y.H.), the Ovarian Cancer Research Alliance and the Department of Defense Ovarian Cancer Research Academy Grant No. OC150111 (D.Z.), and the Mark Foundation for Cancer Research and Cancer Research UK Cambridge Centre Grant No. C9685/A25177 (E.S.).
AUTHOR CONTRIBUTIONS
Conception and design: Yuki Himoto, Harini Veeraraghavan, Dmitriy Zamarin, Alexandra Snyder, Stephanie Nougaret, Fuki Shitano, Evis Sala, Yulia Lakhman
Administrative support: Yulia Lakhman
Collection and assembly of data: Yuki Himoto, Harini Veeraraghavan, Dmitriy Zamarin, Fuki Shitano, Margaret Callahan, Wei Wang, Evis Sala, Yulia Lakhman
Provision of study material or patients: Dmitriy Zamarin, Yulia Lakhman
Data analysis and interpretation: Harini Veeraraghavan, Junting Zheng, Dmitriy Zamarin, Alexandra Snyder, Marinela Capanu, Stephanie Nougaret, Hebert A. Vargas, Evis Sala, Yulia Lakhman
Manuscript writing: All authors
Final approval of manuscript: All authors
AUTHORS' DISCLOSURES OF POTENTIAL CONFLICTS OF INTEREST
The following represents disclosure information provided by authors of this manuscript. All relationships are considered compensated. Relationships are self-held unless noted. I = Immediate Family Member, Inst = My Institution. Relationships may not relate to the subject matter of this manuscript. For more information about ASCO's conflict of interest policy, please refer to www.asco.org/rwc or ascopubs.org/po/author-center.
Dmitriy Zamarin
Employment: Acorda Therapeutics (I)
Consulting or Advisory Role: BioMed Valley Discoveries, Merck, PsiOxus Therapeutics, Synlogic, Western Oncolytics, Tesaro, Agenus, Trieza Therapeutics, ACM Biolabs
Research Funding: Merck
Patents, Royalties, Other Intellectual Property: I hold a patent regarding the use of recombinant Newcastle Disease Virus (NDV) for cancer therapy (Inst)
Travel, Accommodations, Expenses: Roche
Alexandra Snyder
Employment: Adaptive Biotechnologies, Merck
Stock and Other Ownership Interests: Merck
Consulting or Advisory Role: Driver Group
Research Funding: Bristol-Myers Squibb
Travel, Accommodations, Expenses: Genentech, Bristol-Myers Squibb
Margaret Callahan
Employment: Bristol-Myers Squibb (I), Celgene (I), Kleo Pharmaceuticals (I), Bristol-Myers Squibb (I)
Consulting or Advisory Role: AstraZeneca, Moderna Therapeutics, Merck
Research Funding: Bristol-Myers Squibb (Inst)
Other Relationship: Clinical Care Options, Potomac Center for Medical Education
Evis Sala
Honoraria: Siemens Healthineers
Speakers' Bureau: Siemens Healthineers
Travel, Accommodations, Expenses: Siemens Healthineers
Yulia Lakhman
Stock and Other Ownership Interests: Y-mAbs Therapeutics
No other potential conflicts of interest were reported.
REFERENCES
- 1.Torre LA, Trabert B, DeSantis CE, et al. Ovarian cancer statistics, 2018. CA Cancer J Clin. 2018;68:284–296. doi: 10.3322/caac.21456. [DOI] [PMC free article] [PubMed] [Google Scholar]
- 2.Siegel RL, Miller KD, Jemal A. Cancer statistics, 2018. CA Cancer J Clin. 2018;68:7–30. doi: 10.3322/caac.21442. [DOI] [PubMed] [Google Scholar]
- 3.Jayson GC, Kohn EC, Kitchener HC, et al. Ovarian cancer. Lancet. 2014;384:1376–1388. doi: 10.1016/S0140-6736(13)62146-7. [DOI] [PubMed] [Google Scholar]
- 4. doi: 10.1038/nature10166. Cancer Genome Atlas Research Network: Integrated genomic analyses of ovarian carcinoma. Nature 474:609-615, 2011 [Erratum: Nature 490:298, 2012] [DOI] [PMC free article] [PubMed] [Google Scholar]
- 5.Schwarz RF, Ng CK, Cooke SL, et al. Spatial and temporal heterogeneity in high-grade serous ovarian cancer: A phylogenetic analysis. PLoS Med. 2015;12:e1001789. doi: 10.1371/journal.pmed.1001789. [DOI] [PMC free article] [PubMed] [Google Scholar]
- 6.Bashashati A, Ha G, Tone A, et al. Distinct evolutionary trajectories of primary high-grade serous ovarian cancers revealed through spatial mutational profiling. J Pathol. 2013;231:21–34. doi: 10.1002/path.4230. [DOI] [PMC free article] [PubMed] [Google Scholar]
- 7.Chen DS, Mellman I. Elements of cancer immunity and the cancer-immune set point. Nature. 2017;541:321–330. doi: 10.1038/nature21349. [DOI] [PubMed] [Google Scholar]
- 8. Odunsi K: Immunotherapy in ovarian cancer. Ann Oncol 28:viii1-viii7, 2017. [DOI] [PMC free article] [PubMed]
- 9.Zamarin D, Jazaeri AA. Leveraging immunotherapy for the treatment of gynecologic cancers in the era of precision medicine. Gynecol Oncol. 2016;141:86–94. doi: 10.1016/j.ygyno.2015.12.030. [DOI] [PMC free article] [PubMed] [Google Scholar]
- 10.Ribas A, Wolchok JD. Cancer immunotherapy using checkpoint blockade. Science. 2018;359:1350–1355. doi: 10.1126/science.aar4060. [DOI] [PMC free article] [PubMed] [Google Scholar]
- 11.Jiménez-Sánchez A, Memon D, Pourpe S, et al. Heterogeneous tumor-immune microenvironments among differentially growing metastases in an ovarian cancer patient. Cell. 2017;170:927–938.e20. doi: 10.1016/j.cell.2017.07.025. [DOI] [PMC free article] [PubMed] [Google Scholar]
- 12.Zhang AW, McPherson A, Milne K, et al. Interfaces of malignant and immunologic clonal dynamics in ovarian cancer. Cell. 2018;173:1755–1769.e22. doi: 10.1016/j.cell.2018.03.073. [DOI] [PubMed] [Google Scholar]
- 13.Funnell T, Zhang AW, Grewal D, et al. Integrated structural variation and point mutation signatures in cancer genomes using correlated topic models. PLOS Comput Biol. 2019;15:e1006799. doi: 10.1371/journal.pcbi.1006799. [DOI] [PMC free article] [PubMed] [Google Scholar]
- 14.McPherson A, Roth A, Laks E, et al. Divergent modes of clonal spread and intraperitoneal mixing in high-grade serous ovarian cancer. Nat Genet. 2016;48:758–767. doi: 10.1038/ng.3573. [DOI] [PubMed] [Google Scholar]
- 15.Gillies RJ, Kinahan PE, Hricak H. Radiomics: Images are more than pictures, they are data. Radiology. 2016;278:563–577. doi: 10.1148/radiol.2015151169. [DOI] [PMC free article] [PubMed] [Google Scholar]
- 16.Lambin P, Leijenaar RTH, Deist TM, et al. Radiomics: The bridge between medical imaging and personalized medicine. Nat Rev Clin Oncol. 2017;14:749–762. doi: 10.1038/nrclinonc.2017.141. [DOI] [PubMed] [Google Scholar]
- 17.Eisenhauer EA, Therasse P, Bogaerts J, et al. New response evaluation criteria in solid tumours: Revised RECIST guideline (version 1.1) Eur J Cancer. 2009;45:228–247. doi: 10.1016/j.ejca.2008.10.026. [DOI] [PubMed] [Google Scholar]
- 18.Seymour L, Bogaerts J, Perrone A, et al. iRECIST: Guidelines for response criteria for use in trials testing immunotherapeutics. Lancet Oncol. 2017;18:e143–e152. doi: 10.1016/S1470-2045(17)30074-8. [DOI] [PMC free article] [PubMed] [Google Scholar]
- 19.Chiou VL, Burotto M. Pseudoprogression and immune-related response in solid tumors. J Clin Oncol. 2015;33:3541–3543. doi: 10.1200/JCO.2015.61.6870. [DOI] [PMC free article] [PubMed] [Google Scholar]
- 20.Borcoman E, Kanjanapan Y, Champiat S, et al. Novel patterns of response under immunotherapy. Ann Oncol. 2019;30:385–396. doi: 10.1093/annonc/mdz003. [DOI] [PubMed] [Google Scholar]
- 21.Brahmer JR, Tykodi SS, Chow LQ, et al. Safety and activity of anti-PD-L1 antibody in patients with advanced cancer. N Engl J Med. 2012;366:2455–2465. doi: 10.1056/NEJMoa1200694. [DOI] [PMC free article] [PubMed] [Google Scholar]
- 22.Shukuya T, Mori K, Amann JM, et al. Relationship between overall survival and response or progression-free survival in advanced non-small cell lung cancer patients treated with anti-PD-1/PD-L1 antibodies. J Thorac Oncol. 2016;11:1927–1939. doi: 10.1016/j.jtho.2016.07.017. [DOI] [PMC free article] [PubMed] [Google Scholar]
- 23. Haralick RM, Shanmugam K, Dinstein I: Textural features for image classification. IEEE Trans Syst Man Cybern SMC-3:610-621, 1973. [Google Scholar]
- 24.Fehr D, Veeraraghavan H, Wibmer A, et al. Automatic classification of prostate cancer Gleason scores from multiparametric magnetic resonance images. Proc Natl Acad Sci USA. 2015;112:E6265–E6273. doi: 10.1073/pnas.1505935112. [DOI] [PMC free article] [PubMed] [Google Scholar]
- 25.Yoo TS, Ackerman MJ, Lorensen WE, et al. Engineering and algorithm design for an image processing Api: A technical report on ITK--the Insight Toolkit. Stud Health Technol Inform. 2002;85:586–592. [PubMed] [Google Scholar]
- 26.Rao SX, Lambregts DM, Schnerr RS, et al. CT texture analysis in colorectal liver metastases: A better way than size and volume measurements to assess response to chemotherapy? United European Gastroenterol J. 2016;4:257–263. doi: 10.1177/2050640615601603. [DOI] [PMC free article] [PubMed] [Google Scholar]
- 27.Lubner MG, Stabo N, Lubner SJ, et al. CT textural analysis of hepatic metastatic colorectal cancer: Pre-treatment tumor heterogeneity correlates with pathology and clinical outcomes. Abdom Imaging. 2015;40:2331–2337. doi: 10.1007/s00261-015-0438-4. [DOI] [PubMed] [Google Scholar]
- 28.Apte AP, Iyer A, Crispin-Ortuzar M, et al. Technical note: Extension of CERR for computational radiomics: A comprehensive MATLAB platform for reproducible radiomics research. Med Phys. 2018;45:3713–3720. doi: 10.1002/mp.13046. [DOI] [PMC free article] [PubMed] [Google Scholar]
- 29.Tibshirani R. Regression shrinkage and selection via the Lasso. J R Stat Soc B. 1996;58:267–288. [Google Scholar]
- 30. Hosmer D, Lemeshow S: Applied Logistic Regression (ed 2). New York, NY, John Wiley & Sons, 2000. [Google Scholar]
- 31.Macintyre G, Goranova TE, De Silva D, et al. Copy number signatures and mutational processes in ovarian carcinoma. Nat Genet. 2018;50:1262–1270. doi: 10.1038/s41588-018-0179-8. [DOI] [PMC free article] [PubMed] [Google Scholar]
- 32.Blank CU, Haanen JB, Ribas A, et al. Cancer Immunology. The “cancer immunogram. Science. 2016;352:658–660. doi: 10.1126/science.aaf2834. [DOI] [PubMed] [Google Scholar]
- 33.Sun R, Limkin EJ, Vakalopoulou M, et al. A radiomics approach to assess tumour-infiltrating CD8 cells and response to anti-PD-1 or anti-PD-L1 immunotherapy: An imaging biomarker, retrospective multicohort study. Lancet Oncol. 2018;19:1180–1191. doi: 10.1016/S1470-2045(18)30413-3. [DOI] [PubMed] [Google Scholar]
- 34.Gibney GT, Weiner LM, Atkins MB. Predictive biomarkers for checkpoint inhibitor-based immunotherapy. Lancet Oncol. 2016;17:e542–e551. doi: 10.1016/S1470-2045(16)30406-5. [DOI] [PMC free article] [PubMed] [Google Scholar]
- 35.Vargas HA, Veeraraghavan H, Micco M, et al. A novel representation of inter-site tumour heterogeneity from pre-treatment computed tomography textures classifies ovarian cancers by clinical outcome. Eur Radiol. 2017;27:3991–4001. doi: 10.1007/s00330-017-4779-y. [DOI] [PMC free article] [PubMed] [Google Scholar]
- 36.Gordon AN, Fleagle JT, Guthrie D, et al. Recurrent epithelial ovarian carcinoma: A randomized phase III study of pegylated liposomal doxorubicin versus topotecan. J Clin Oncol. 2001;19:3312–3322. doi: 10.1200/JCO.2001.19.14.3312. [DOI] [PubMed] [Google Scholar]
- 37.Gordon AN, Tonda M, Sun S, et al. Long-term survival advantage for women treated with pegylated liposomal doxorubicin compared with topotecan in a phase 3 randomized study of recurrent and refractory epithelial ovarian cancer. Gynecol Oncol. 2004;95:1–8. doi: 10.1016/j.ygyno.2004.07.011. [DOI] [PubMed] [Google Scholar]
- 38. doi: 10.1158/1078-0432.CCR-17-2386. Joseph RW, Elassaiss-Schaap J, Kefford R, et al: Baseline tumor size is an independent prognostic factor for overall survival in patients with melanoma treated with pembrolizumab. Clin Cancer Res 24:4960-4967, 2018 [Erratum: Clin Cancer Res 24:6098, 2018] [DOI] [PMC free article] [PubMed] [Google Scholar]


