

Abstract
Purpose
In the I-SPY 2 TRIAL (Investigation of Serial Studies to Predict Your Therapeutic Response With Imaging and Molecular Analysis 2), the pan–erythroblastic oncogene B inhibitor neratinib was available to all hormone receptor (HR)/human epidermal growth factor receptor 2 (HER2) subtypes and graduated in the HR-negative/HER2-positive signature. We hypothesized that neratinib response may be predicted by baseline HER2 epidermal growth factor receptor (EGFR) signaling activation/phosphorylation levels independent of total levels of HER2 or EGFR proteins.
Materials and Methods
Complete experimental and response data were available for between 130 and 193 patients. In qualifying analyses, which used logistic regression and treatment interaction analysis, 18 protein/phosphoprotein, 10 mRNA, and 12 DNA biomarkers that related to HER family signaling were evaluated. Exploratory analyses used Wilcoxon rank sum and t tests without multiple comparison correction.
Results
HER pathway DNA biomarkers were either low prevalence or nonpredictive. In expression biomarker analysis, only one gene (STMN1) was specifically associated with response to neratinib in the HER2-negative subset. In qualifying protein/phosphoprotein analyses that used reverse phase protein microarrays, six HER family markers were associated with neratinib response. After analysis was adjusted for HR/HER2 status, EGFR Y1173 (pEGFR) showed a significant biomarker-by-treatment interaction (P = .049). Exploratory analysis of HER family signaling in patients with triple-negative (TN) disease found that activation of EGFR Y1173 (P = .005) and HER2 Y1248 (pHER2) (P = .019) were positively associated with pathologic complete response. Exploratory analysis in this pEGFR/pHER2–activated TN subgroup identified elevated levels of estrogen receptor α (P < .006) in these patients.
Conclusion
Activation of HER family phosphoproteins associates with response to neratinib, but only EGFR Y1173 and STMN1 appear to add value to the graduating signature. Activation of HER2 and EGFR in TN tumors may identify patients whose diseases respond to neratinib and implies that there is a subset of patients with TN disease who paradoxically exhibit HER family signaling activation and may achieve clinical benefit with neratinib; this concept must be validated in future studies.
INTRODUCTION
The I-SPY 2 TRIAL (Investigation of Serial Studies to Predict Your Therapeutic Response With Imaging and Molecular Analysis 2; ClinicalTrials.gov identifier: NCT01042379) is a phase II, adaptive neoadjuvant therapy trial in which the primary goal was to determine the predictive probabilities of phase III trial success for various targeted therapeutics. Patients with locally advanced, high-risk breast cancer had their diseases assigned to one of eight subtypes on the basis of hormone receptor (HR), human epidermal growth factor receptor 2 (HER2), and Mammaprint-based high1/(ultra)high2 risk statuses.1-3
Neratinib, a pan-erythroblastic oncogene B (ERBB) inhibitor, was available to patients with all tumor subtypes in the I-SPY 2 TRIAL, and the agent availability was graduated in the HR-negative/HER2-positive signature.4 Neratinib has shown activity against HER2-positive metastatic breast cancer, and there is also evidence for activity against HER2-negative tumor cells in vitro.5,6 Because neratinib was available to all patients in the trial, this study provided an opportunity to test the efficacy of the drug in patients with HER2-negative tumors.
Cell line–based preclinical studies have implicated alterations in HER/AKT/mTOR family genes on the DNA, mRNA, or protein level as predictive of neratinib response.7-11 However, recent HER2 therapy–based clinical trials in which HER family biomarkers at the total protein and/or mRNA level were analyzed for response prediction found that none provided predictive value compared with the conventional, US Food and Drug Administration–approved immunohistochemistry (IHC)/fluorescence in situ hybridization–based HER2/estrogen receptor (ER) testing methods.12-14 Previous work with the I-SPY 1 TRIAL cohort revealed that HER2 phosphorylation was highly concordant with HER2 expression.15 That study identified a subpopulation of patients who had HER2-negative disease by standard testing yet had HER2 phosphorylation levels similar to patients with HER2-positive disease. The HER2 activation seen in these patients in the HER2-negative subtype appeared coincident with epidermal growth factor receptor (EGFR) activation.
On the basis of the mechanism of action of neratinib as a potent HER family kinase inhibitor combined with observations of I-SPY 1 TRIAL results, we postulated that HER2 and EGFR activation/phosphorylation may be predictive of neratinib response independent of total HER2 status in the I-SPY 2 TRIAL; this hypothesis was motivation for an exploratory analysis within the HER2-negative and triple-negative (TN) subpopulation. Our analysis of HER/phosphoinositide-3-kinase (PI3K)/AKT signaling family components in pretreatment samples from the neratinib and concurrent control arms of the I-SPY 2 TRIAL was performed at a unique multiomic level. We report results from the following: (1) assessment of selected mutation/copy number alterations by exome sequencing, (2) mRNA expression levels by expression microarrays, and (3) analysis of protein/phosphoprotein levels by reverse phase protein arrays (RPPAs) as specific biomarkers of neratinib response. DNA and mRNA analyses evaluated 10 to 12 key genes in this pathway, including HER2, EGFR, mTOR, AKT, and PIK3CA. RPPA analysis assessed the ability of 18 protein/phosphoproteins that comprise the known drug targets of neratinib (EGFR, HER2) and downstream effector molecules, such as SHC transforming protein 1 (SHC) and mammalian target of rapamycin (mTOR)/AK-thyoma (AKT) signaling components to predict complete pathologic response (pCR) to neratinib. To our knowledge, this study is the most comprehensive multiomic investigation of the HER family pathway activation status and its relationship to HER family–targeted neoadjuvant therapy response in patients with early-stage breast cancer to date.
MATERIALS AND METHODS
In the I-SPY 2 TRIAL, all patients received at least standard chemotherapy (paclitaxel followed by doxorubicin/cyclophosphamide [T > AC]). Patients randomly assigned to the experimental arm were treated with neratinib in addition to standard chemotherapy (neratinib + T > AC).4 In patients with HER2-positive disease, neratinib was administered in place of trastuzumab (Appendix Fig A1). pCR was the primary end point for analysis. All patients provided institutional review board–approved informed consent before specimens were collected.
Pretreatment biopsy specimens from patients in the neratinib and concurrent control arms of the I-SPY 2 TRIAL were analyzed for mRNA expression by using Agilent 44K expression arrays (Agendia, Irvine, CA), signaling protein activation by RPPA, and DNA sequencing (approximately 2,000-gene mini-cancer genome; Utrecht, the Netherlands). A CONSORT diagram with the number of evaluable patients for each molecular profiling analysis is shown in Figure 1. Details of sample preparation and data processing are provided in the Data Supplement.
Fig 1.

CONSORT diagram that outlines the number of patients included in the neratinib and control arms of the I-SPY 2 TRIAL (Investigation of Serial Studies to Predict Your Therapeutic Response With Imaging and Molecular Analysis 2) and those included in the subsequent analyses. CNV, copy number variation; RPPA, reverse phase protein array.
In our prespecified analysis plan,16 logistic regression was used to assess association with pCR in the control and neratinib treated populations individually. Relative biomarker performance between arms (biomarker-by-treatment interaction) was assessed with a logistic model (pCR approximately equaled treatment + biomarker + [treatment × biomarker]). Analysis also was performed to adjust for HR/HER2 status (pCR ∼ treatment + biomarker + [treatment × biomarker] + HR status + HER2 status). If a continuous biomarker did not follow a normal distribution, we applied a nonparametric method that discretized the score by using a series of cut points, and we applied logistic modeling for the dichotomized biomarker at each cut point; significance was assessed by permutation testing. This procedure produced an optimal cut point that maximized the significance of the biomarker-by-treatment interaction. Markers with pCR associations that had P values < .05 were identified as significant. No multiple comparison adjustments were applied. For significant biomarkers, Bayesian logistic regression analysis was performed, as previously described, with the following model: pCR ∼ HR + HER2 + biomarker + treatment + (treatment × HR) + (treatment × HER2) + (treatment × biomarker).16
In additional analyses, parametric t tests (for normally distributed data) or nonparametric Wilcoxon rank sum tests (for non-normally distributed data) were used to assess association of protein end points with pCR in the control and neratinib-treated populations individually. Analytes associated with response only in the neratinib and not the control arm were selected for additional analysis, and P values < .05 were identified as significant. Markers were analyzed individually; sample sizes were small, and P values were descriptive and not corrected for multiple comparisons. Receiver operating characteristic curves were generated for end points associated with pCR in the neratinib-treated arm of the trial to identify potential cut points for biomarker positivity rates within selected patient subtypes.
RESULTS
Evaluation of HER Family Gene Point Mutations and DNA Amplification/Loss as Predictors of Neratinib Sensitivity
We evaluated somatic mutations and copy number variations (CNVs) in 12 HER family–linked signaling pathway genes—EGF, EGFR, HER2, NRG1, IGF1R, PIK3CA, AKT1, PTEN, STMN1, and mTOR—by targeting exome sequencing across all evaluable patients. A total of 50 patients (38%) had at least one mutation, whereas 66 (51%) had at least one CNV in these 12 genes. However, the prevalence of any given alteration was low (Fig 2), which precluded statistical analyses for most of the genes. PIK3CA somatic mutations were the most frequent. Consistent with publications that link PIK3CA mutation with resistance to neratinib and other HER2-targeted agents,14,17-19 only two (13%) of 16 patients with mutated PIK3CA achieved pCR in the neratinib arm compared with 24 (39%) of 62 patients with wild-type PIK3CA. However, PIK3CA mutation status did not show a significant biomarker-by-treatment interaction.
Fig 2.
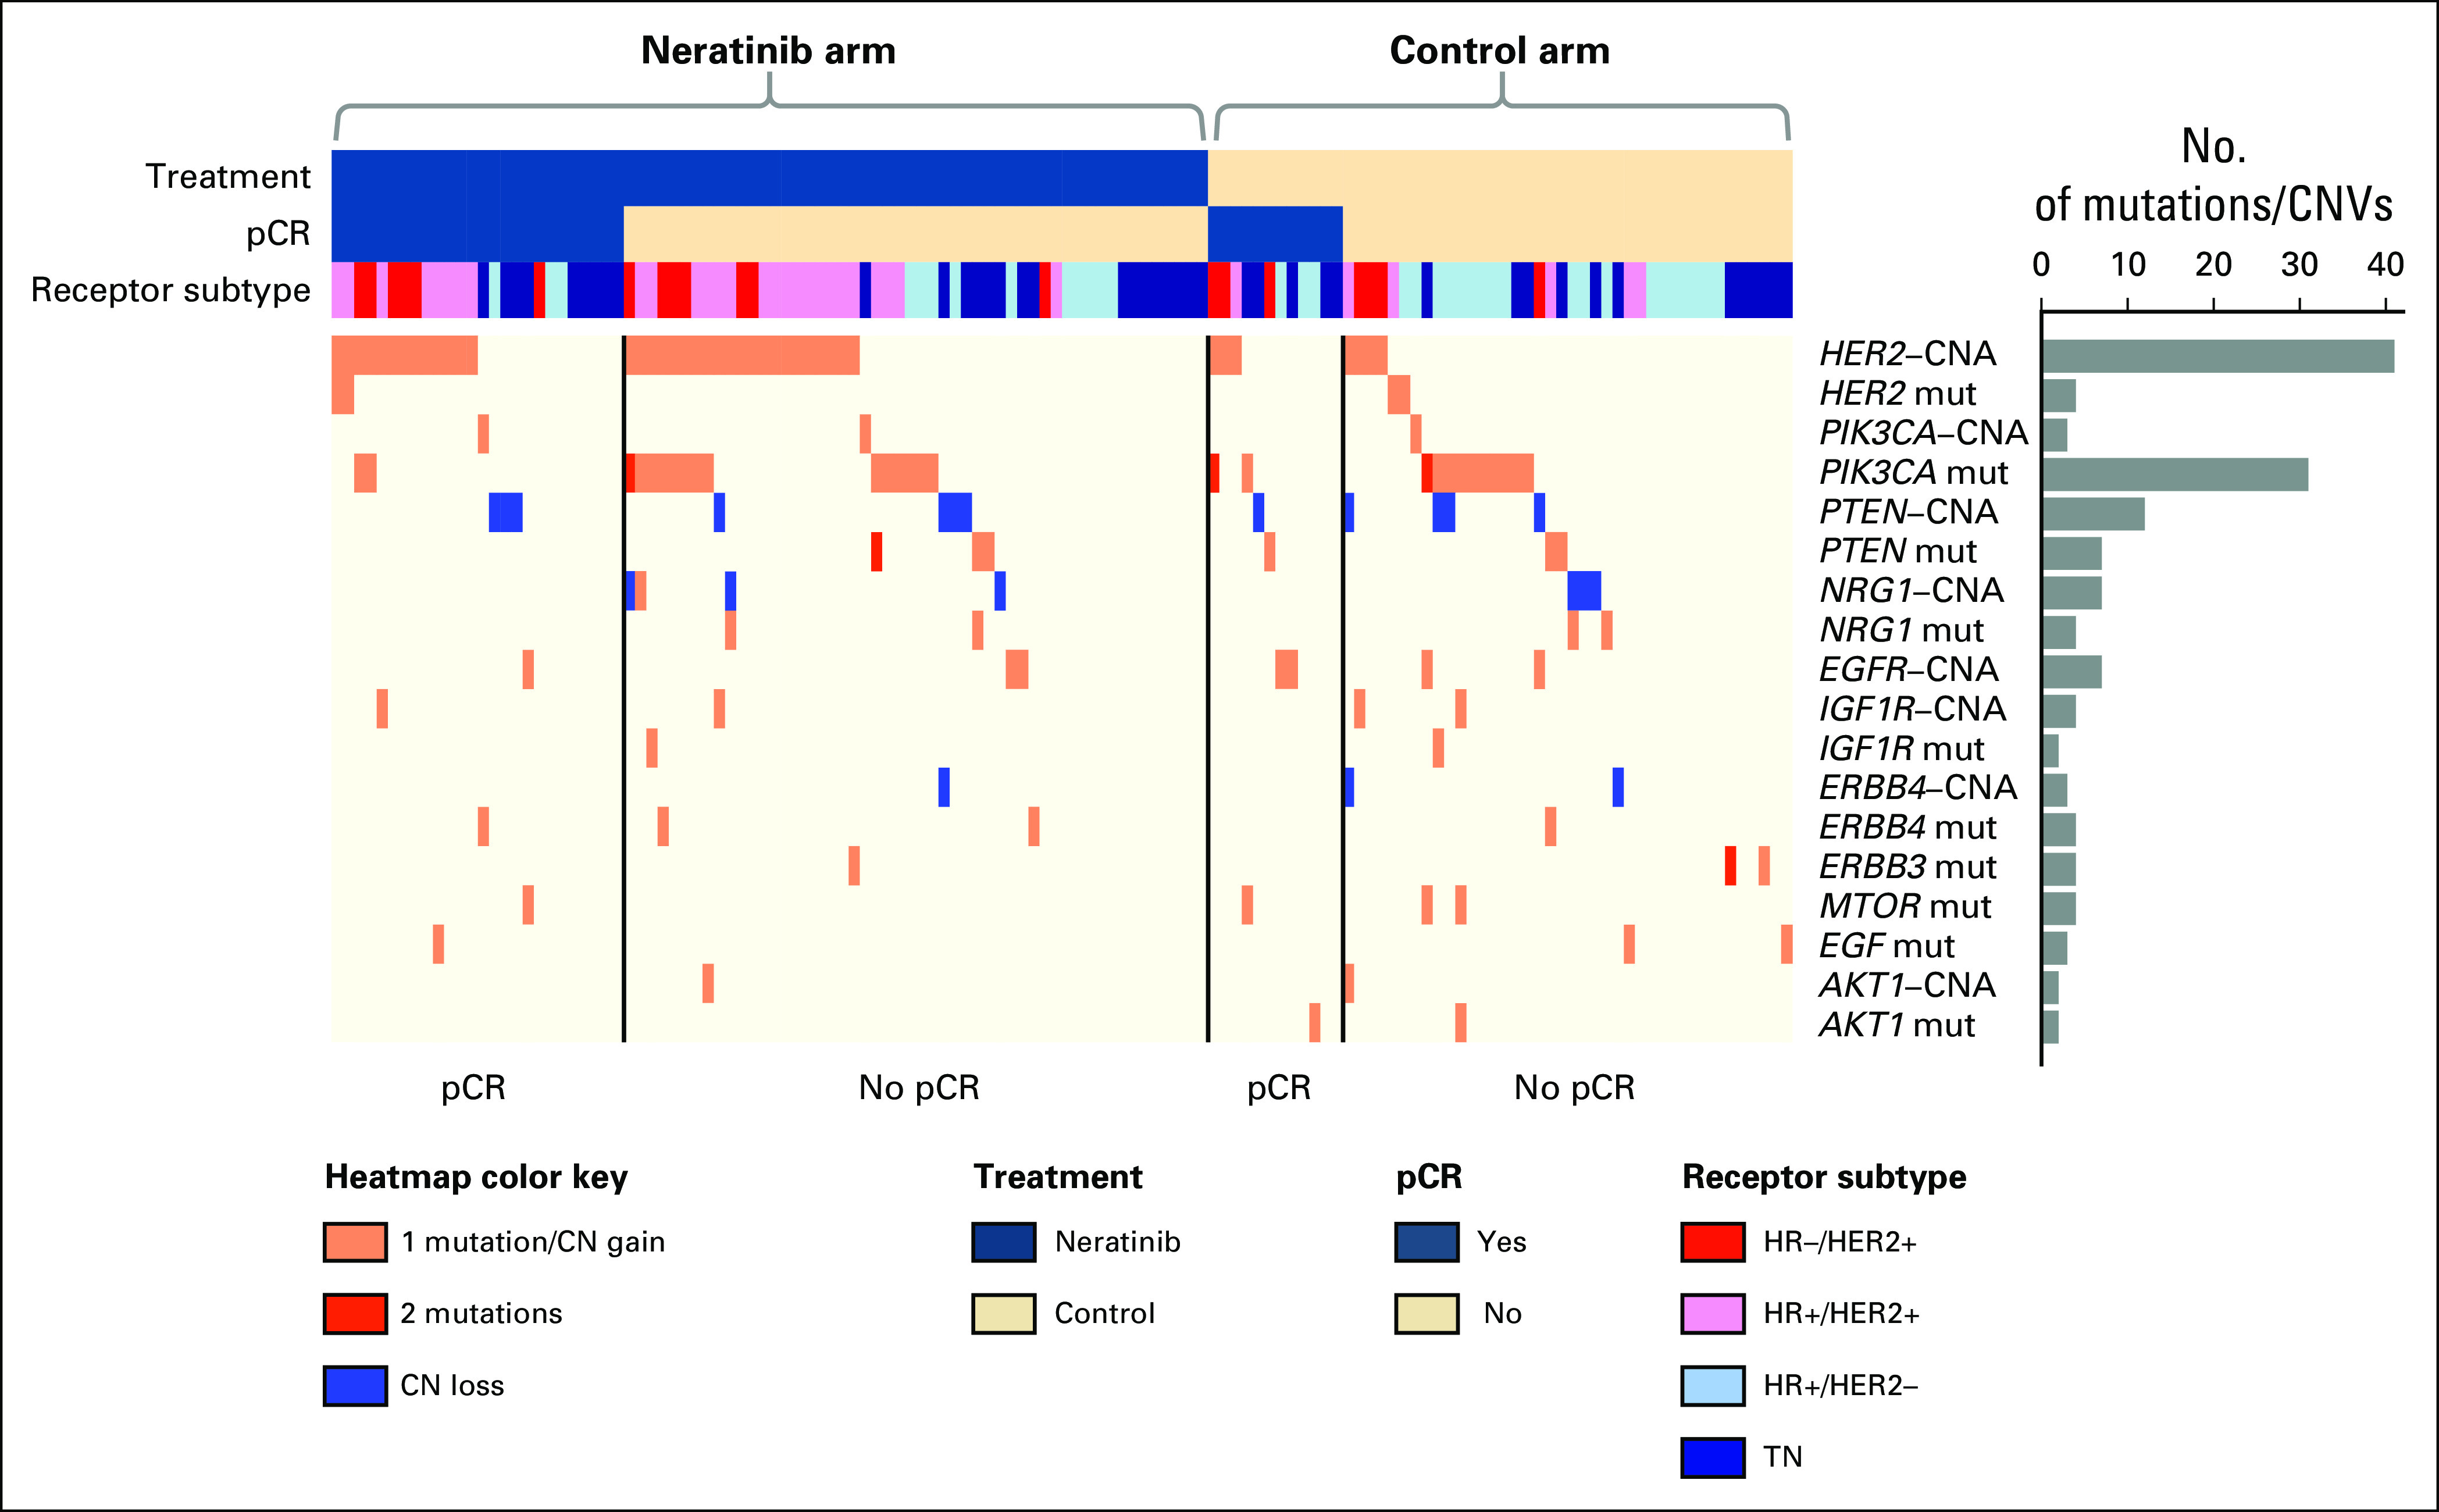
Heatmap of mutations and copy number variations (CNVs) in HER family signaling genes. Patient data are arranged first by arm, then by pathologic complete response (pCR) status along columns, and biomarkers are hierarchically clustered along rows. Prevalence of DNA aberrations is represented by the bar plot to the right. Within the heatmap, pink represents a single mutation (mut) or CN gain; red, two mutations; and blue, CN loss. HR, hormone receptor; TN, triple negative.
Association of HER Family Gene Expression With Response to Neratinib
We evaluated 10 predefined HER family signaling genes as expression biomarkers of neratinib response in all evaluable patients (Appendix Table A1). HER2 expression was significantly associated with sensitivity to neratinib combination therapy (and in the HER2-positive subpopulation), and IGF1R, to resistance; neither gene was associated with response in the control arm of the trial (Appendix Tables A1 and A2). However, no significant biomarker-by-treatment interactions were observed. Within the HER2-negative subset, STMN1 was associated with response to neratinib (P = .0023) and not control, and this result showed a significant biomarker-by-treatment interaction (P = .0036; Fig 3A; Appendix Table A3). At an optimal threshold that maximized the interaction, 27% of patients with HER2-negative disease (29 of 106 patients) had STMN1-high status (Fig 3B-C). This result held for the continuous variable and as the median for a cut point (data not shown). By using Bayesian modeling, the estimated pCR rate of patients with HER2-negative/STMN1-high status in the treatment arm was 57% compared with 17% in the control arm (Fig 3D); the predictive probability of phase III success in this subset was 97%.
Fig 3.
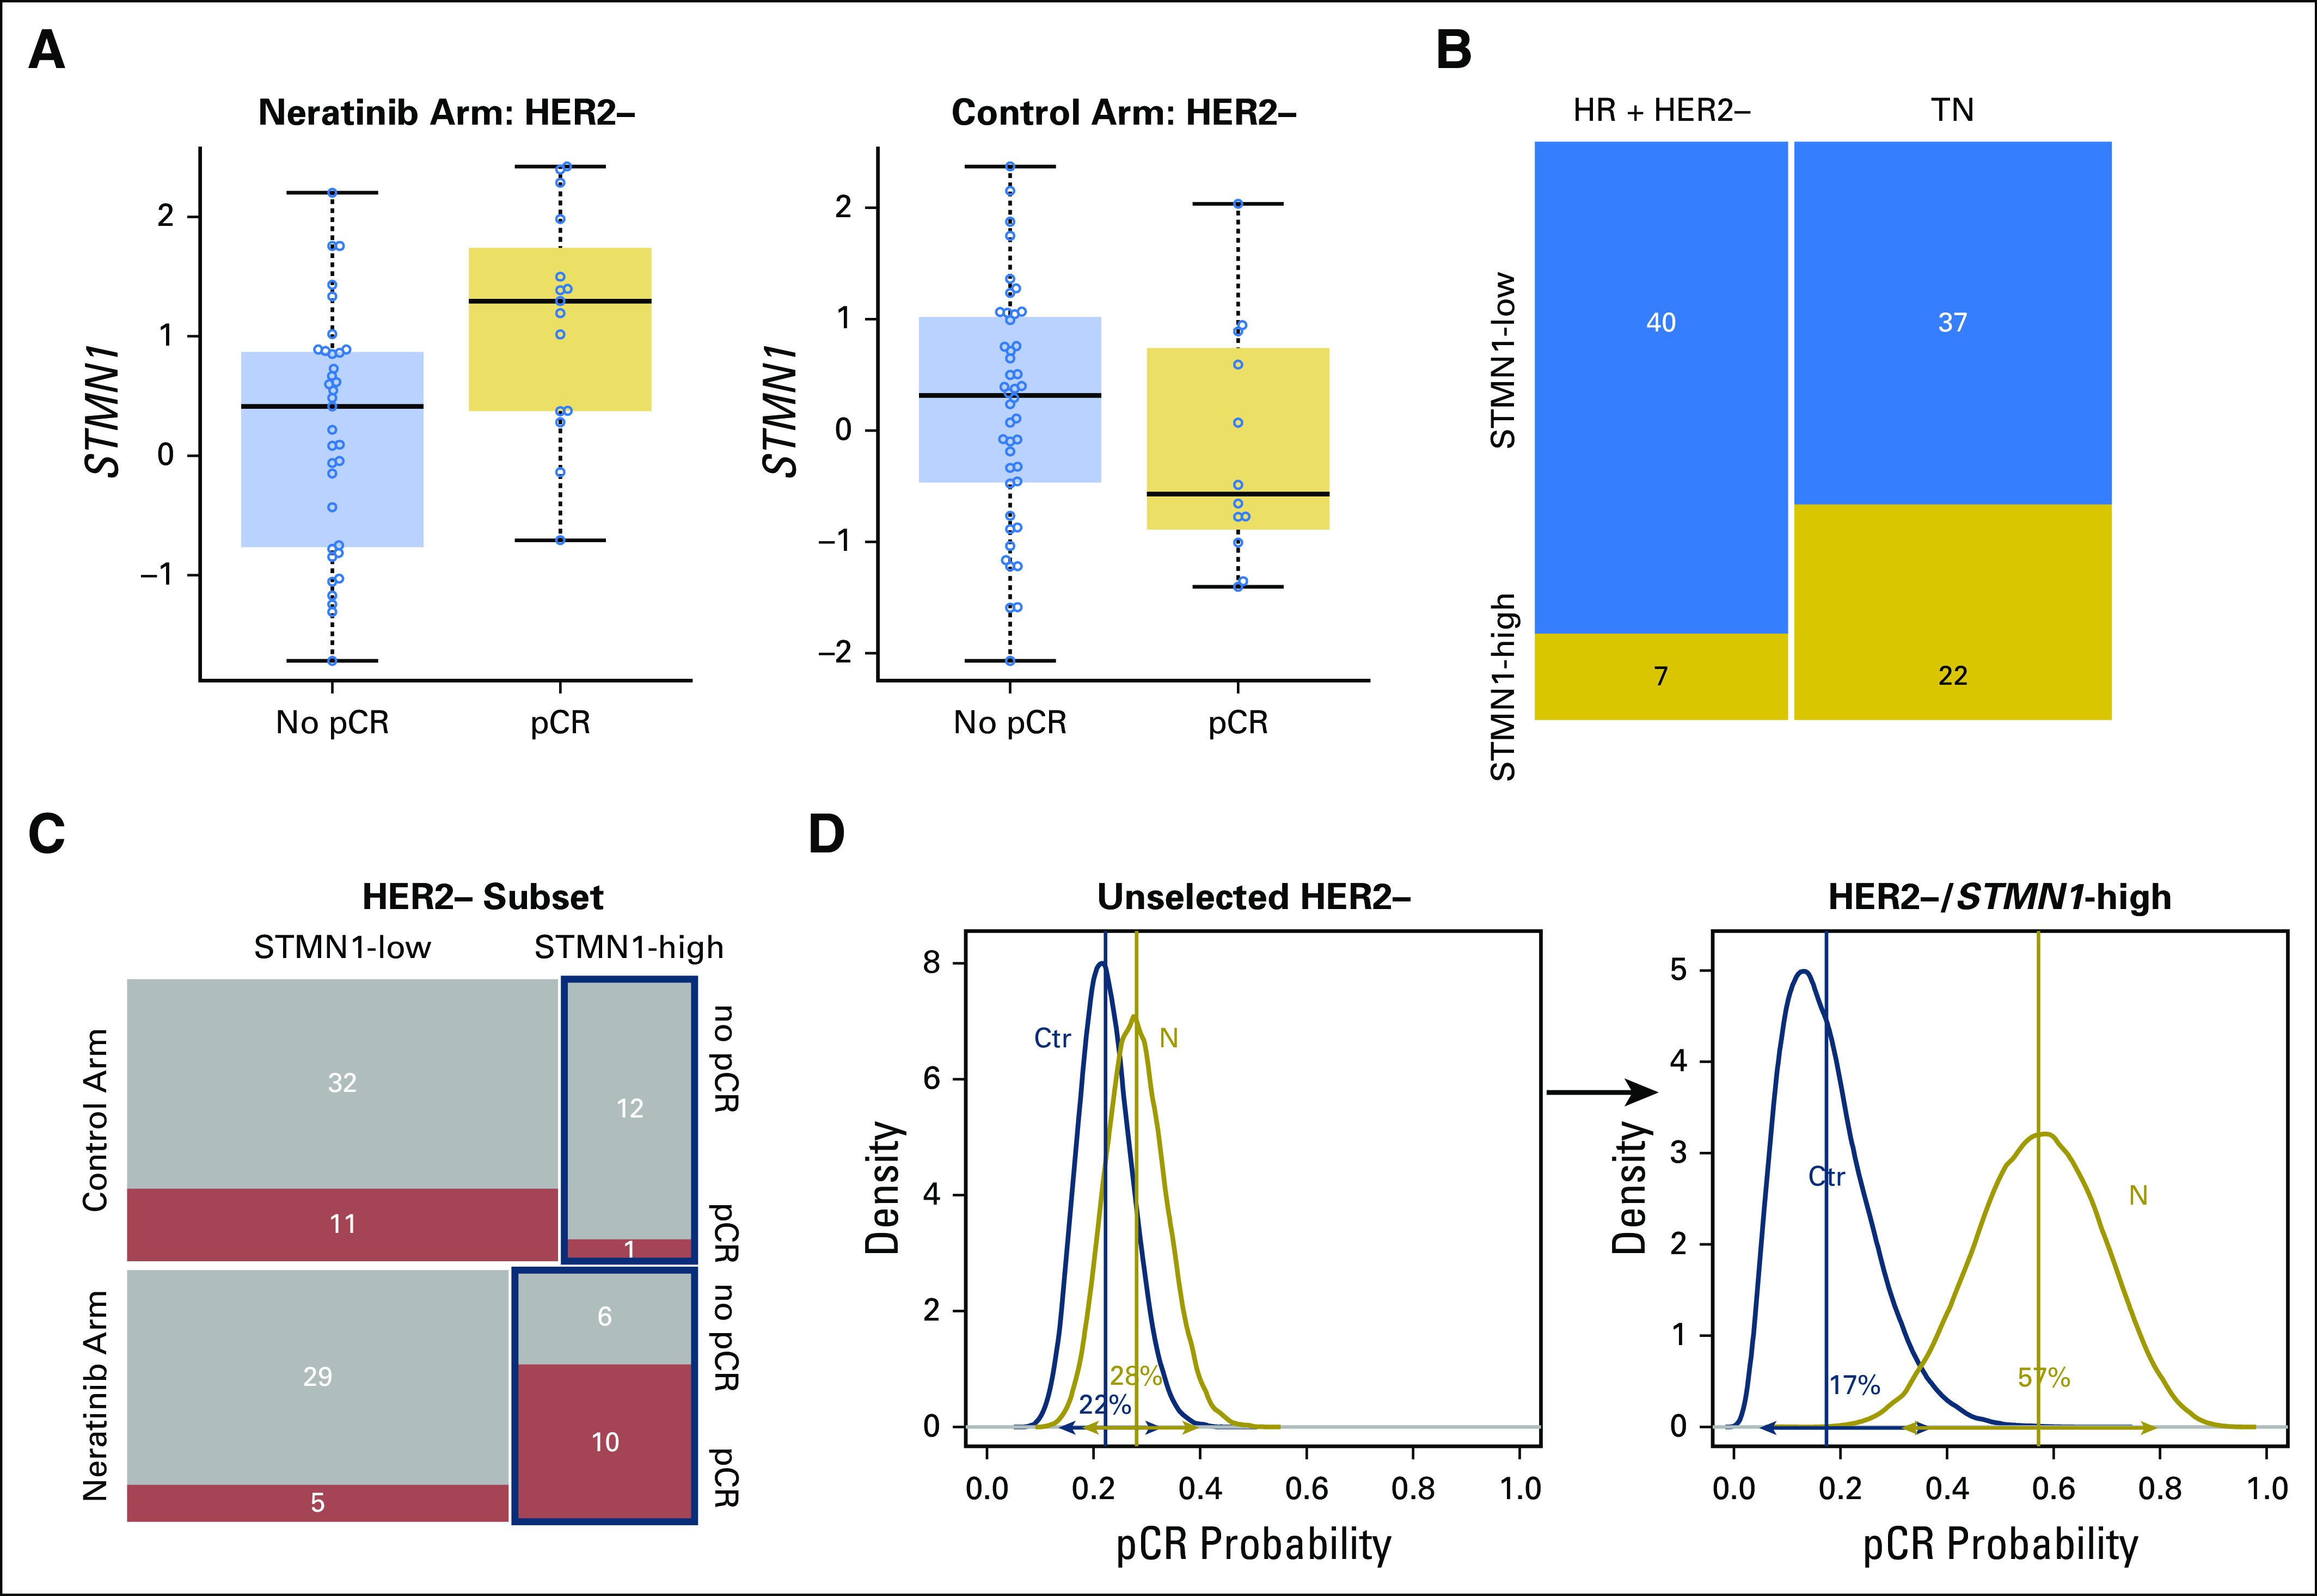
STMN1 expression level as a biomarker of neratinib response in patients with human epidermal growth factor receptor 2 (HER2)-negative disease. (A) Box plots of STMN1 expression in the HER2-negative subset by arm and response. (B) Distribution of patients with STMN1-high and -low expression levels by hormone receptor (HR) subtype within HER2-negative subset. (C) Mosaic plot of pathologic complete response (pCR) distribution by STMN1 status within the neratinib and control arms. (D) Bayesian estimated pCR probability distributions in (left) the unselected HER2-negative subset and (right) the HER2-negative/STMN1-high subset in the control (blue) and neratinib (gold) arms.
HER Family Protein Signaling Activation as Predictors of Neratinib Sensitivity
We evaluated 18 HER family signaling proteins/phosphoproteins as biomarkers of neratinib response by using RPPA data from pretreatment, laser capture microdissection (LCM)–purified tumor epithelia across all evaluable patients in the neratinib and concurrent control arms. Six of the 18 HER family biomarkers tested (EGFR Y1068, EGFR Y1173, EGFR Y992, HER2 total, HER2 Y1248, and SHC Y317) were associated with pCR in neratinib-treated patients but not in concurrent control-arm patients in the trial (Table 1). The same markers were associated with neratinib response in the HER2-positive population, with the exception of SHC Y317 (Table 1).
Table 1.
Assessment of Qualifying Biomarker Association With pCR in Various Populations of Patients in Neratinib-Treated and Control Arms in the I-SPY 2 TRIAL

The permutation test–based strategy with a logistic regression model that included HER2 and HR status as covariates revealed that EGFR Y1173 showed a significant biomarker-by-treatment interaction (P = .049). We dichotomized patients by their EGFR Y1173 intensity values into high and low groups (optimal cut point of 4,501, which maximized the significance of the biomarker-by-treatment interaction term), and we evaluated the distribution of pCR rates (Table 2). The odds ratio (OR) between EGFR Y1173 groups in the neratinib-treated versus the control arm was 10.1. When patients with EGFR Y1173–high status were added to the graduated HR-negative/HER2-positive subset, the OR associated with treatment was 3.2 and was comparable to that of the HR-negative/HER2-positive signature (OR, 2.1), which increased the prevalence of patients with biomarker-positive disease by approximately 50% and increased the predictive probability of phase III success (Appendix Table A4).
Table 2.
pCR Rates for EGFR Y1173 and HER2 Y1248 Biomarker High/Low Groups by HR/HER2 Subtype in Neratinib-Treated and Control Groups

Comparison of HER Family Gene Expression, Protein, Phosphoprotein, and Mutation Data
Unsupervised clustering revealed that total protein levels of HER-family genes clustered with its gene expression level, whereas phosphoprotein levels were more highly correlated to one another than to their respective gene or total protein expression levels (Fig 4). PIK3CA mutations (28 of 130 patients) were not associated with altered levels of PIK3CA expression of protein/phosphoprotein; however, they were associated with lower levels of STMN1 and EGFR gene expression and higher levels of the phosphoproteins PTEN S380 and AKT S473 (data not shown).
Fig 4.

Integrated heatmap showing the relationships between expression and protein/phosphoprotein biomarkers. Patient data are arranged first by arm, then by pathologic complete response (pCR) status, along columns, and biomarkers are hierarchically clustered along rows. The subset of biomarkers represented include phosphoproteins associated with response to neratinib, and their associated mRNA and total protein levels (scaled to a median of 0 and standard deviation of 1). The most prevalent DNA alterations are included in the annotation track (blue, mutated; white, wild type; gray, not available). EGFR, epidermal growth factor receptor; ERBB, erythroblastic oncogene B; HER2, human epidermal growth factor receptor 2; HR, hormone receptor; NA, not available; SHC, SHC transforming protein; TN, triple negative.
Exploratory Analysis of HER Family Signaling in Patients With TN Disease
Although neratinib graduated in the HR-negative/HER2-positive signature, this signature was characterized by IHC/fluorescence in situ hybridization–based analysis of total HER2 expression and did not measure HER2 or EGFR phosphorylation. We were particularly interested in evaluation of HER signaling/phosphorylation in the subgroup of patients with TN disease as a predictor of response to neratinib. Among the 18 HER family qualifying protein biomarkers, increased EGFR Y1173 (P = .005) and HER2 Y1248 (P = .019) phosphorylation were significantly associated with pCR in the neratinib-treated patients with TN disease but not in the control arm, and this could not be explained by mutations or copy number alterations in EGFR, HER2, or other genes related to HER family signaling (Table 1; Fig 4).
We used optimal cut points determined by receiver operating characteristic analysis for EGFR Y1173 and HER2 Y1248, which were nearly identical to those obtained by the permutation testing described in HER Family Protein Signaling Activation as Predictors of Neratinib Sensitivity, to assess their correlation with pCR in patients with TN disease. Two-way plots of EGFR Y1173 and HER2 Y1248 for neratinib-treated and concurrent controls demonstrated that nine (82%) of 11 patients with TN disease who exhibited elevated phospho-EGFR (pEGFR) and phospho-HER2 (pHER2) levels experienced a pCR in response to neratinib treatment compared with four (36%) of 11 with TN disease among the concurrent controls (Table 2; Fig 5A-B). Bayesian evaluation of EGFR Y1173 and HER2 Y1248 as biomarkers for neratinib response in the TN population revealed a comparable probability of success in a phase III trial to that of the graduated HR-negative/HER2-positive population (Fig 5C; Appendix Tables A4 and A5). The combination of the two biomarkers (TN and EGFR Y1173-high/HER2 Y1248-high) proved to have the highest probability of success (95%) compared with EGFR Y1173 or HER2 Y1248 modeled individually (72% and 82%, respectively; Appendix Table A5).
Fig 5.
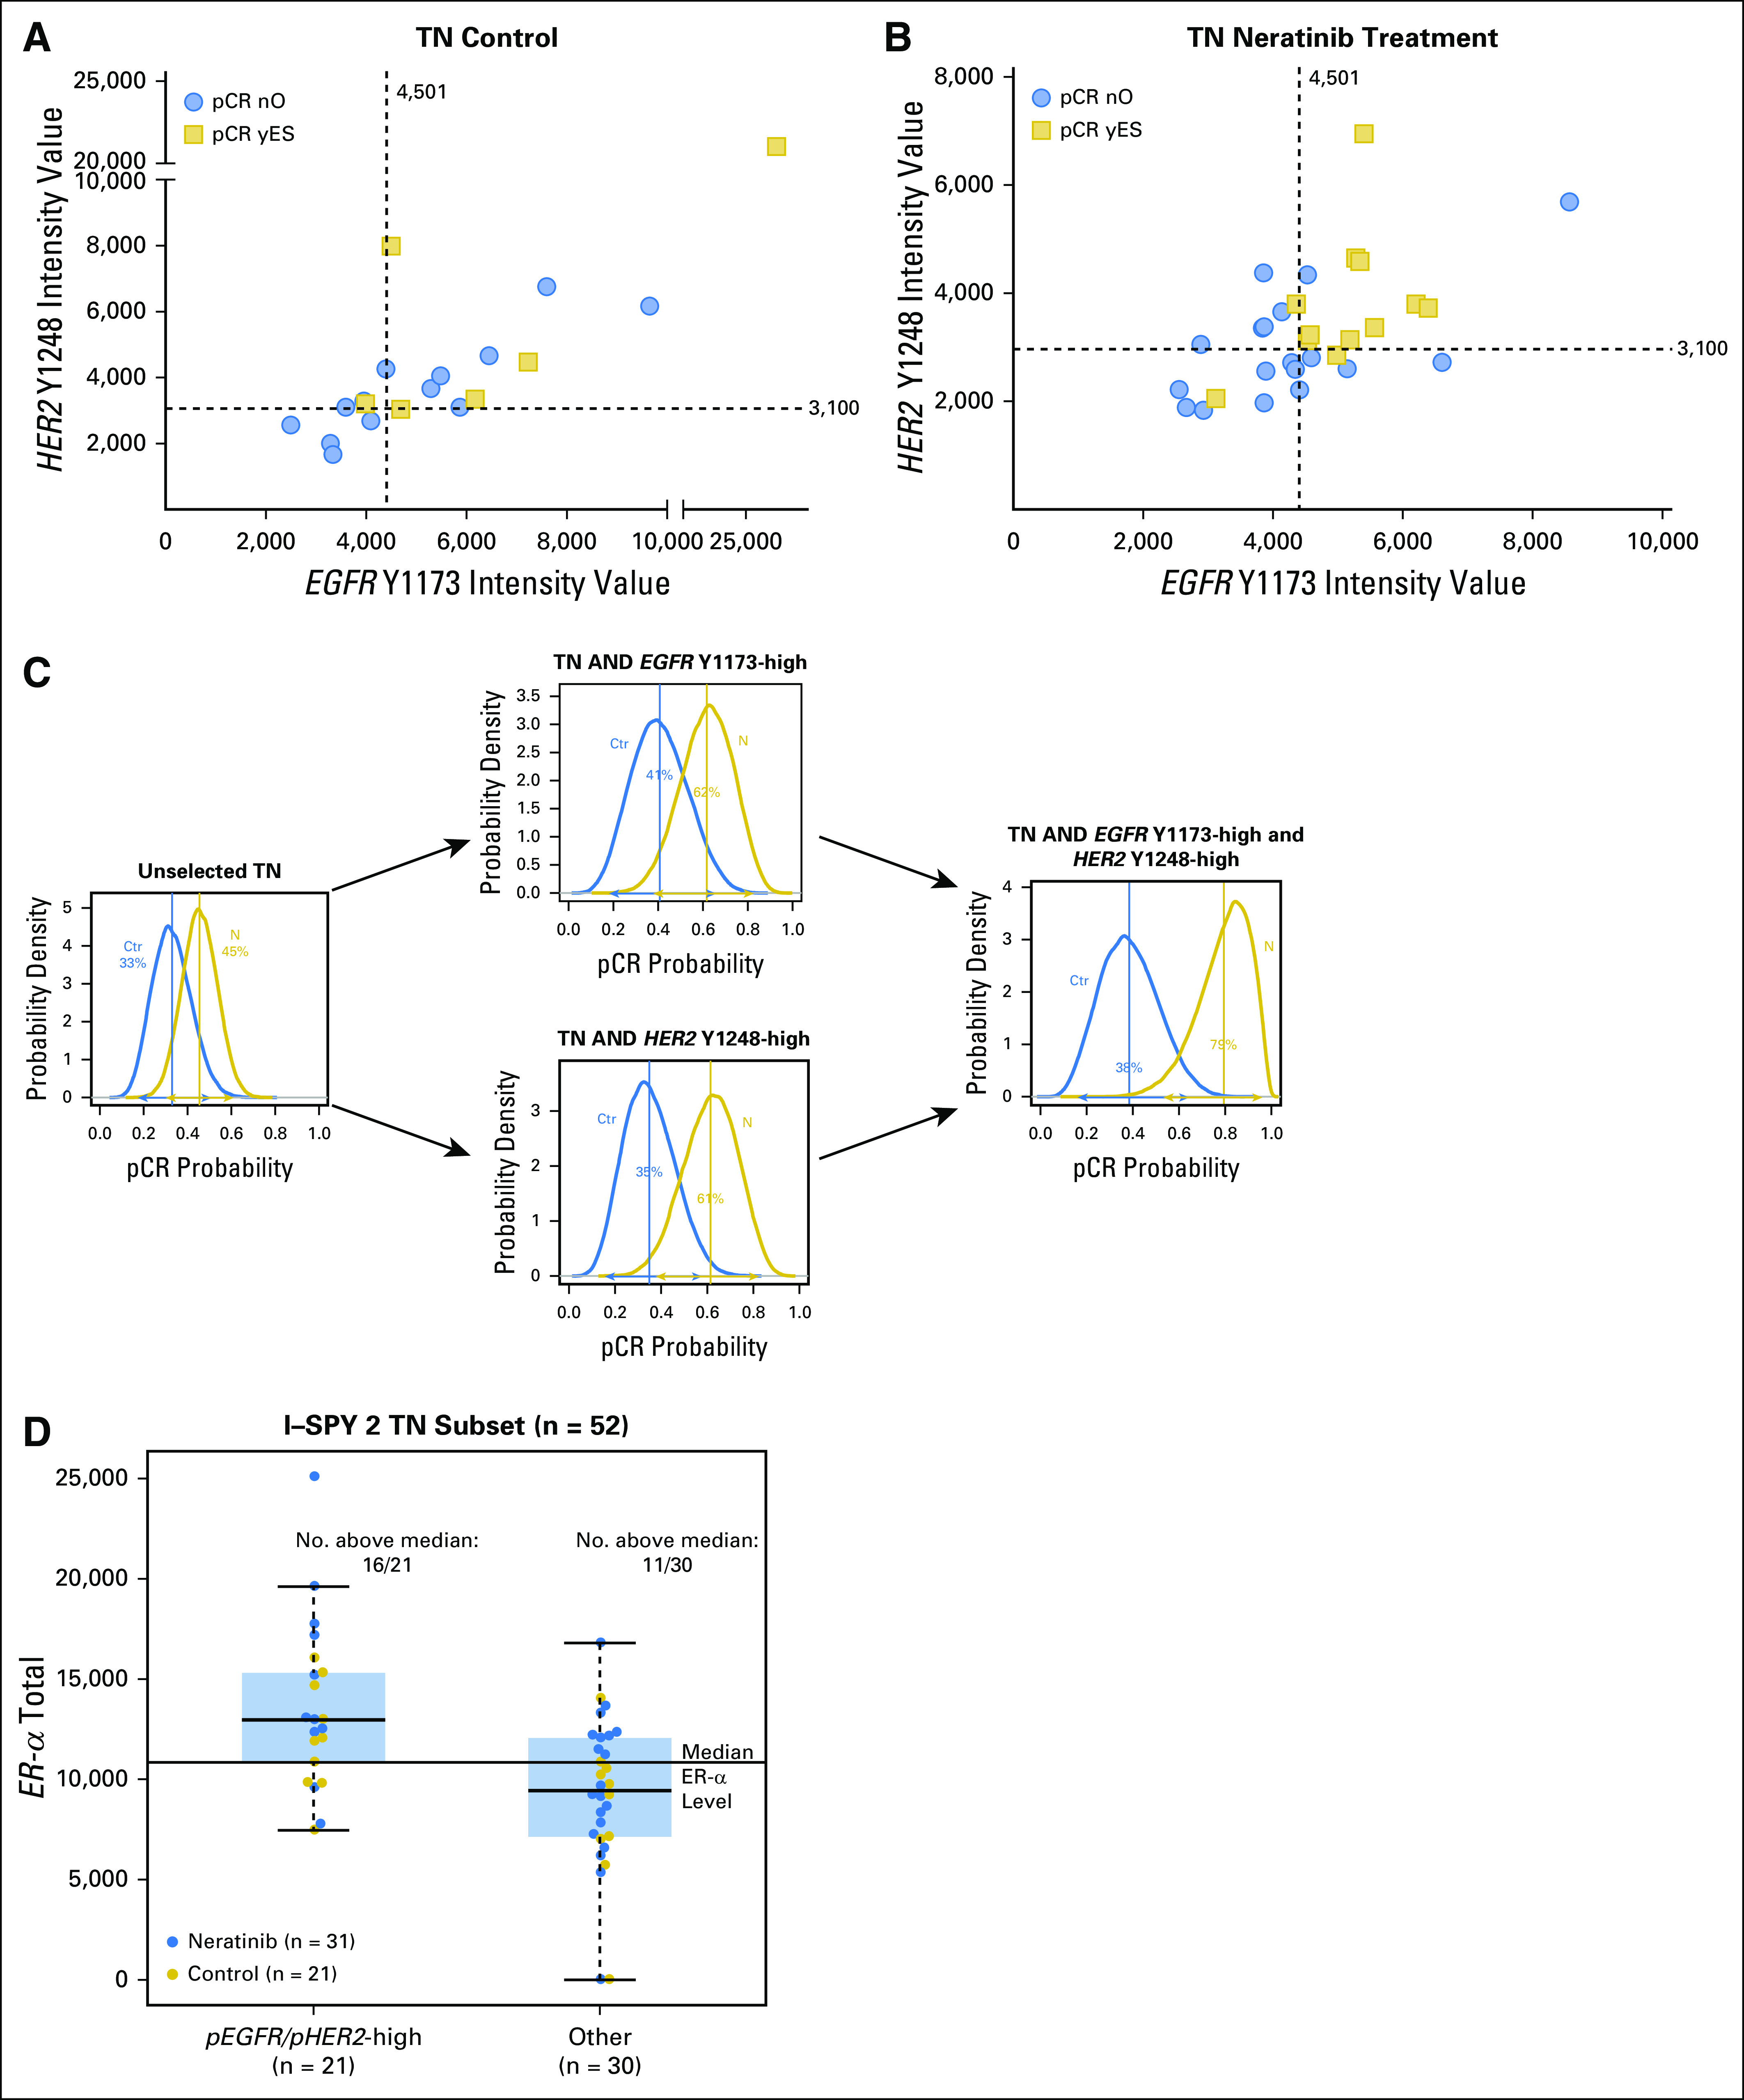
Analysis of epidermal growth factor receptor (EGFR) Y1173 and human epidermal growth factor receptor 2 (HER2) Y1248 as biomarkers for neratinib response in patients with triple-negative (TN) disease enrolled in the I-SPY 2 TRIAL (Investigation of Serial Studies to Predict Your Therapeutic Response With Imaging and Molecular Analysis 2). (A) and (B) Two-way plots of EGFR Y1173 and HER2 Y1248 intensities for TN (A) control group and (B) neratinib-treated patients. Pathologic complete response (pCR): no, blue circles; yes, gold squares. Dashed lines indicate cut points for biomarker positivity. (C) Probability distributions in patients with TN disease that incorporate EGFR Y1173 and HER2 Y1248 as biomarkers of response. Blue curves represent concurrent control patients and gold curves represent the neratinib-treated TN population. The mean of each distribution is the estimated rate of pCR. (D) Box plot of estrogen receptor alpha (ER-α) levels in the phospho-EGFR/phospho-HER2 biomarker-high and -low populations.
ERs have been shown to be able to act as membrane, nongenomic signaling molecules through direct interaction with tyrosine kinases, including EGFR and HER2, even when present at low levels, and to activate receptor tyrosine kinases.20-22 Across all patients with TN disease in the neratinib arms of the I-SPY 2 TRIAL, levels of total ER-α were higher in pEGFR/pHER2-high TN tumors (P < .001). In this pEGFR/pHER2-high group of TN tumors, 16 (76%) of 21 patients had ER-α levels greater than the median value for the TN population compared with 11 (37%) of 30 patients in the rest of the TN population (Fig 5D). In the neratinib-treated population alone, 11 (35%) of 31 patients had pEGFR/pHER2-high status, and nine (82%) of 11 patients had total ER-α levels greater than the TN population median.
DISCUSSION
As precision cancer medicine evolves into concomitant processes of discovery, validation, and development of biomarkers predictive of therapeutic response alongside the clinical assessment of drug efficacy, there is increasing emphasis on identification of predictive biomarker candidates as early as possible. In the I-SPY 2TRIAL, neratinib was available to all HR/HER2 tumor subtypes, and genomic, transcriptomic, and proteomic/phosphoproteomic biomarkers were measured in all pretreatment biopsy samples. This created a unique opportunity to explore a multiomic view to identify predictive markers that could transcend classic subtypes. Given that HER2 total protein levels do not strictly correlate with HER2 phosphorylation in the HER2-negative setting,15 and given that the phosphorylation status of HER2 protein (compared with total HER2) provides significant information on breast cancer survival,23-27 we postulated that phosphorylation levels of the neratinib drug targets HER2 and EGFR in pretreatment biopsy specimens would correlate with pCR in both HER2-positive and HER2-negative tumors.
Our data revealed that coactivation of HER2 and EGFR correlated with pCR in both HER2-positive and TN tumors. The pCR rate in the pEGFR/pHER2-high TN population, according to an optimal cut point for both markers, was 82% (nine of 11 patients) in the treatment arm, compared with 36% (four of 11 patients) with pCR in the control arm. Although these data are exploratory, this pCR rate was higher than the 55% of patients who had a complete response observed in the graduated HR-negative/HER2-positive arm for neratinib.4 In keeping with these results, in which phosphorylated EGFR levels rather than total EGFR were predictive for pCR, phosphorylated EGFR has been shown to be a potential predictive marker for anti-EGFR therapies in other tumors, such as non–small-cell lung cancer.28,29 Also, our expression analysis produced only one predictive biomarker for neratinib sensitivity, STMN1, a gene implicated in HER2 pathway signaling and chemotherapy sensitivity in non-HER2 amplified cell lines.30-33
Although our data indicate that phosphorylation levels of HER2 and EGFR correlate with pCR in neratinib-treated patients with breast cancer, a number of caveats in the study limit generalizability. The adaptive design of the trial allowed for efficient and quick graduation (or termination) of agent/marker combinations on the basis of their estimated likelihood of phase III success. However, this format tends to produce unbalanced groups with low patient numbers in each arm, which poses clear challenges from a biomarker discovery point of view. We found that phosphorylation of EGFR and HER2 were independently predictive of pCR in patients with either HER2-positive or HER2-negative disease. Furthermore, EGFR and HER2 were coactivated, which suggests a biochemical basis for pCR prediction. Analyses of the National Surgical Breast and Bowel Project B-31 trial and the North Central Cancer Treatment Group N9831 trial found that HER2-negative breast cancers received benefit from trastuzumab in the adjuvant setting,34,35 but recent results from the NSABP B-47 adjuvant trial reported no survival improvement with the addition of trastuzumab to standard chemotherapy in patients with HER2-low status.36 However, none of these studies assessed HER family phosphorylation or pathway activation status in HER2-negative subsets of patients who experienced disease response. Other studies with HER family inhibitors have shown that neratinib, in combination with insulin-like growth factor receptor (IGFR) inhibitors had antiproliferative effects in HER2 non-overexpressing breast cancer cell lines, and pilot clinical studies of lapatinib treatment in various metastatic cancers showed a correlation of pHER2 with lapatinib response.37,38
What is the basis for HER2 and EGFR activation in the TN subpopulation? The frequency of HER2 and EGFR mutations in the neratinib cohort is too small (n = 4 and 3, respectively) to be a contributing factor. Indeed, even the most prevalent genomic alterations did not statistically correlate with neratinib pCR, although PIK3CA mutation trended as a negative predictor in the I-SPY 2 TRIAL (P = .07). In the absence of genomic alterations related to HER family signaling when HER activation is seen, a logical postulate is that the process is mediated by ligand-driven events. Recently, it has been shown that neuregulin 1 (NRG1 or heregulin) and HER2 phosphorylation coincidentally occurred in a subset of HER2-negative tumors and that inhibition of EGFR or HER2 or both receptors reduced breast cancer stem cell survival and self-renewal.39 Although we evaluated NRG1 in our study and did not find any correlation with pCR or HER2 activation status (Table 1), we did explore the possibilities of other ligand-driven events underpinning the HER2 and EGFR activation observed in TN tumors, namely estrogen signaling. Estrogen can exert nongenomic activity called membrane-initiated steroid signaling through binding with ER at low concentrations40; ER may exist in a signalsome complex with a variety of receptor tyrosine kinases, such as IGFR,41 EGFR,42,43 or HER2,44,45 and lead to activation of EGFR, HER2, and IGFR121 in the absence of gene transcription. We found that ER-α levels in the TN cohort were higher in pEGFR/pHER2-high tumors than in tumors that were not HER2/EGFR activated (Fig 5). This result could provide a potential explanation for the paradoxical finding of HER2/EGFR activation in TN cancers in the absence of HER2 genomic alterations and must be confirmed in independent study sets.
The LCM-RPPA workflow used in this study provides a powerful and unique approach to quantitatively measure the activated signaling architecture of a large number of cancer-related pathways, including the HER family, from microscopic quantities of tissue. This technology and workflow is especially well suited for clinical sample assessment.46,47 Past studies have revealed the need for LCM to accurately assess phosphorylated and total protein levels, and to facilitate biomarker evaluation in the context of high and low tumor cell content.48 Moreover, unlike IHC-based approaches that can be adversely effected by choice of antigen retrieval method, the RPPA technique utilizes fully denatured protein in which phospho-epitopes are fully linearized and recognized by the cognate primary antibody.
Patients with TN breast cancer have a paucity of targeted therapeutic options available. Given the pCR rate observed and biomarker positive prevalence we found in the TN setting, we believe these data provide a strong molecular rationale to consider prospective validation of the findings in patients with TN disease who received neratinib. To our knowledge, this study is the first of its kind to quantitatively assess activated HER family signaling in the context of clinical response to HER-directed therapies in a TN population. The biomarker findings, although prespecified, ultimately are based on small numbers of patients and must be confirmed with larger patient populations in independent clinical studies to validate the findings and establish predictive cut points for pEGFR and pHER2 for prospective clinical use.
ACKNOWLEDGMENT
We thank Ting Dong and Xiaochen Zhu at George Mason University for assistance with statistical analysis, and we thank the patients, advocates, and investigators for their participation in the I-SPY 2 TRIAL (Investigation of Serial Studies to Predict Your Therapeutic Response With Imaging and Molecular Analysis 2).
Appendix
Collaborators
Investigation of Serial Studies to Predict Your Therapeutic Response With Imaging and Molecular Analysis 2 (I-SPY 2) trial investigators by site/affiliation: Avera Cancer Institute: Leyland-Jones B.; British Colombia Cancer Agency: Chia S., Serpanchy R., Yu C.; Emory University: McMillan S., Mosley R., Nguyen K., Wood E.C., Zelnak A.; Georgetown University: Dillis C., Donnelly R., Harrington T., Isaacs C., Kallakury B., Liu M., Lynce F., Oppong B., Pohlmann P., Tousimis E., Warren R., Willey S., Wong J.E., Zeck J.; Loyola University Chicago Medical Center: Albain K., Bartolotta M.B., Bova D., Brooks C., Busby B., Czaplicki K., Duan X., Gamez R., Ganesh K., Gaynor E., Godellas C., Grace-Louthen C., Kuritza T., Lo S., Nagamine A., Perez C., Robinson P., Rosi D., Vaince F., Ward K.; Inova Fairfax Hospital: Choquette K., Edmiston K., Gallimore H., McGovern J., Mokarem K., Pajaniappan M., Rassulova S., Scott K., Sherwood K., Wright J.; Mayo Clinic, Arizona: Anderson K.S., Gray R.J., Myers S.J., Northfelt D.E., Pockaj B.A., Roedig J., Wasif N.; Mayo Clinic, Rochester: Arens A.M., Boughey J.C., Brandt K.R., Carroll J.L., Chen B., Connors A.L., Degnim A.C., Farley D.R., Greenlee S.M., Haddad T.C., Hieken T.J., Hobday T.J., Jakub J.W., Liberte L.L., Liu M.C., Loprinzi C.L., Menard L.R., Moe M.M., Moynihan T.J., O'Sullivan C., Olson E.A., Peethambaram P.P., Ruddy K.J., Russell B.A., Rynearson A.L., Smith D.R., Visscher D.W., Windish A.J.; H. Lee Moffitt Cancer Center and Research Institute: Cox K., Dawson K., Newton O., Ramirez W.; Oregon Health and Science University: Bengtson H., Bucher J., Chui S., Gilbert-Ghormley B., Hampton R., Kemmer K.A., Kurdyla D., Nauman D., Spear J., Wilson A.; Swedish Cancer Institute: Beatty D., Dawson P., Ellis E.R., Fer M., Hanson J., Goetz M.P., Haddad T.C., Iriarte D., Kaplan H.G., Porter B., Rinn K., Thomas H., Thornton S., Tickman R., Varghis N.; University of Alabama at Birmingham: Caterinichia V., Delos Santos J., Falkson C., Forero A., Krontiras H., Vaklavas C., Wei S.; University of Arizona: Bauland A., Inclan L., Lewallen D., Powell A., Roney C., Schmidt K., Viscusi R.K., Wright H.; University of California, San Diego: Blair S., Boles S., Bykowski J., Datnow B., Densley L., Eghtedari M., Genna V., Hasteh F., Helsten T., Kormanik P., Ojeda-Fournier H., Onyeacholem I., Parker B., Podsada K., Schwab R., Wallace A., Yashar C.; University of California, San Francisco: Alvarado M.D., Au A., Balassanian R., Benz C., Buxton M., Chen Y.Y., Chien J., D'Andrea C., Davis S.E., Esserman L., Ewing C., Goga A., Hirst G.L., Hwang M., Hylton N., Joe B., Lyandres J., Kadafour M., Krings G., Melisko M., Moasser M., Munter P., Ngo Z., Park J., Price E., Rugo H., van't Veer L., Wong J., Yau C.; University of Chicago: Abe H., Jaskowiak N.T., Nanda R., Olopade F., Schacht D.V.; University of Colorado, Denver: Borges V., Colvin T., Diamond J., Elias A.D., Finlayson C., Fisher C., Hardesty L., Kabos P., Kounalakis N., Mayordomo J., McSpadden T., Murphy C., Rabinovitch R., Sams S., Shagisultanova E.; University of Kansas: Baccaray S., Khan Q.; University of Minnesota: Beckwith H., Blaes A., Emory T., Haddad T.C., Hui J., Klein M., Kuehn-Hajder J., Nelson M., Potter D., Tuttle T., Yee D., Zera R.; University of Pennsylvania: Bayne L., Bradbury A., Clark A., DeMichele A, Domchek S, Fisher C, Fox K, Frazee D, Lackaye M, Matro J, McDonald E., Rosen M., Shah P., Tchou J., Volpe M.; University of Texas MD Anderson Cancer Center: Alvarez R., Barcenas C., Berry D.A., Booser D., Brewster A., Brown P., Gonzalez-Angulo A., Ibrahim N., Karuturi M., Koenig K., Moulder S., Murray J., Murthy R., Pusztai L., Saigal B., Symmans W.F., Tripathy D., Theriault R., Ueno N., Valero V.; University of Southern California: Brown M., Carranza M., Flores Y., Lang J., Luna A., Perez N., Tripathy D., Watkins K.; University of Texas Southwestern Medical Center: Armstrong S, Boyd C, Chen L, Clark V, Frankel A, Euhus DM, Froehlich T., Goudreau S., Haley B., Harker-Murray A., Klemow D., Leitch A.M., Leon R., Li H., Morgan T., Qureshi N., Rao R., Reeves M., Rivers A., Sadeghi N., Seiler S., Staves B., Tagoe V., Thomas G., Tripathy D., Unni N., Weyandt S., Wooldridge R., Zuckerman J.; University of Washington: Korde L., Griffin M., Butler B., Cundy A., Rubinstein L., Hixson C.
Fig A1.
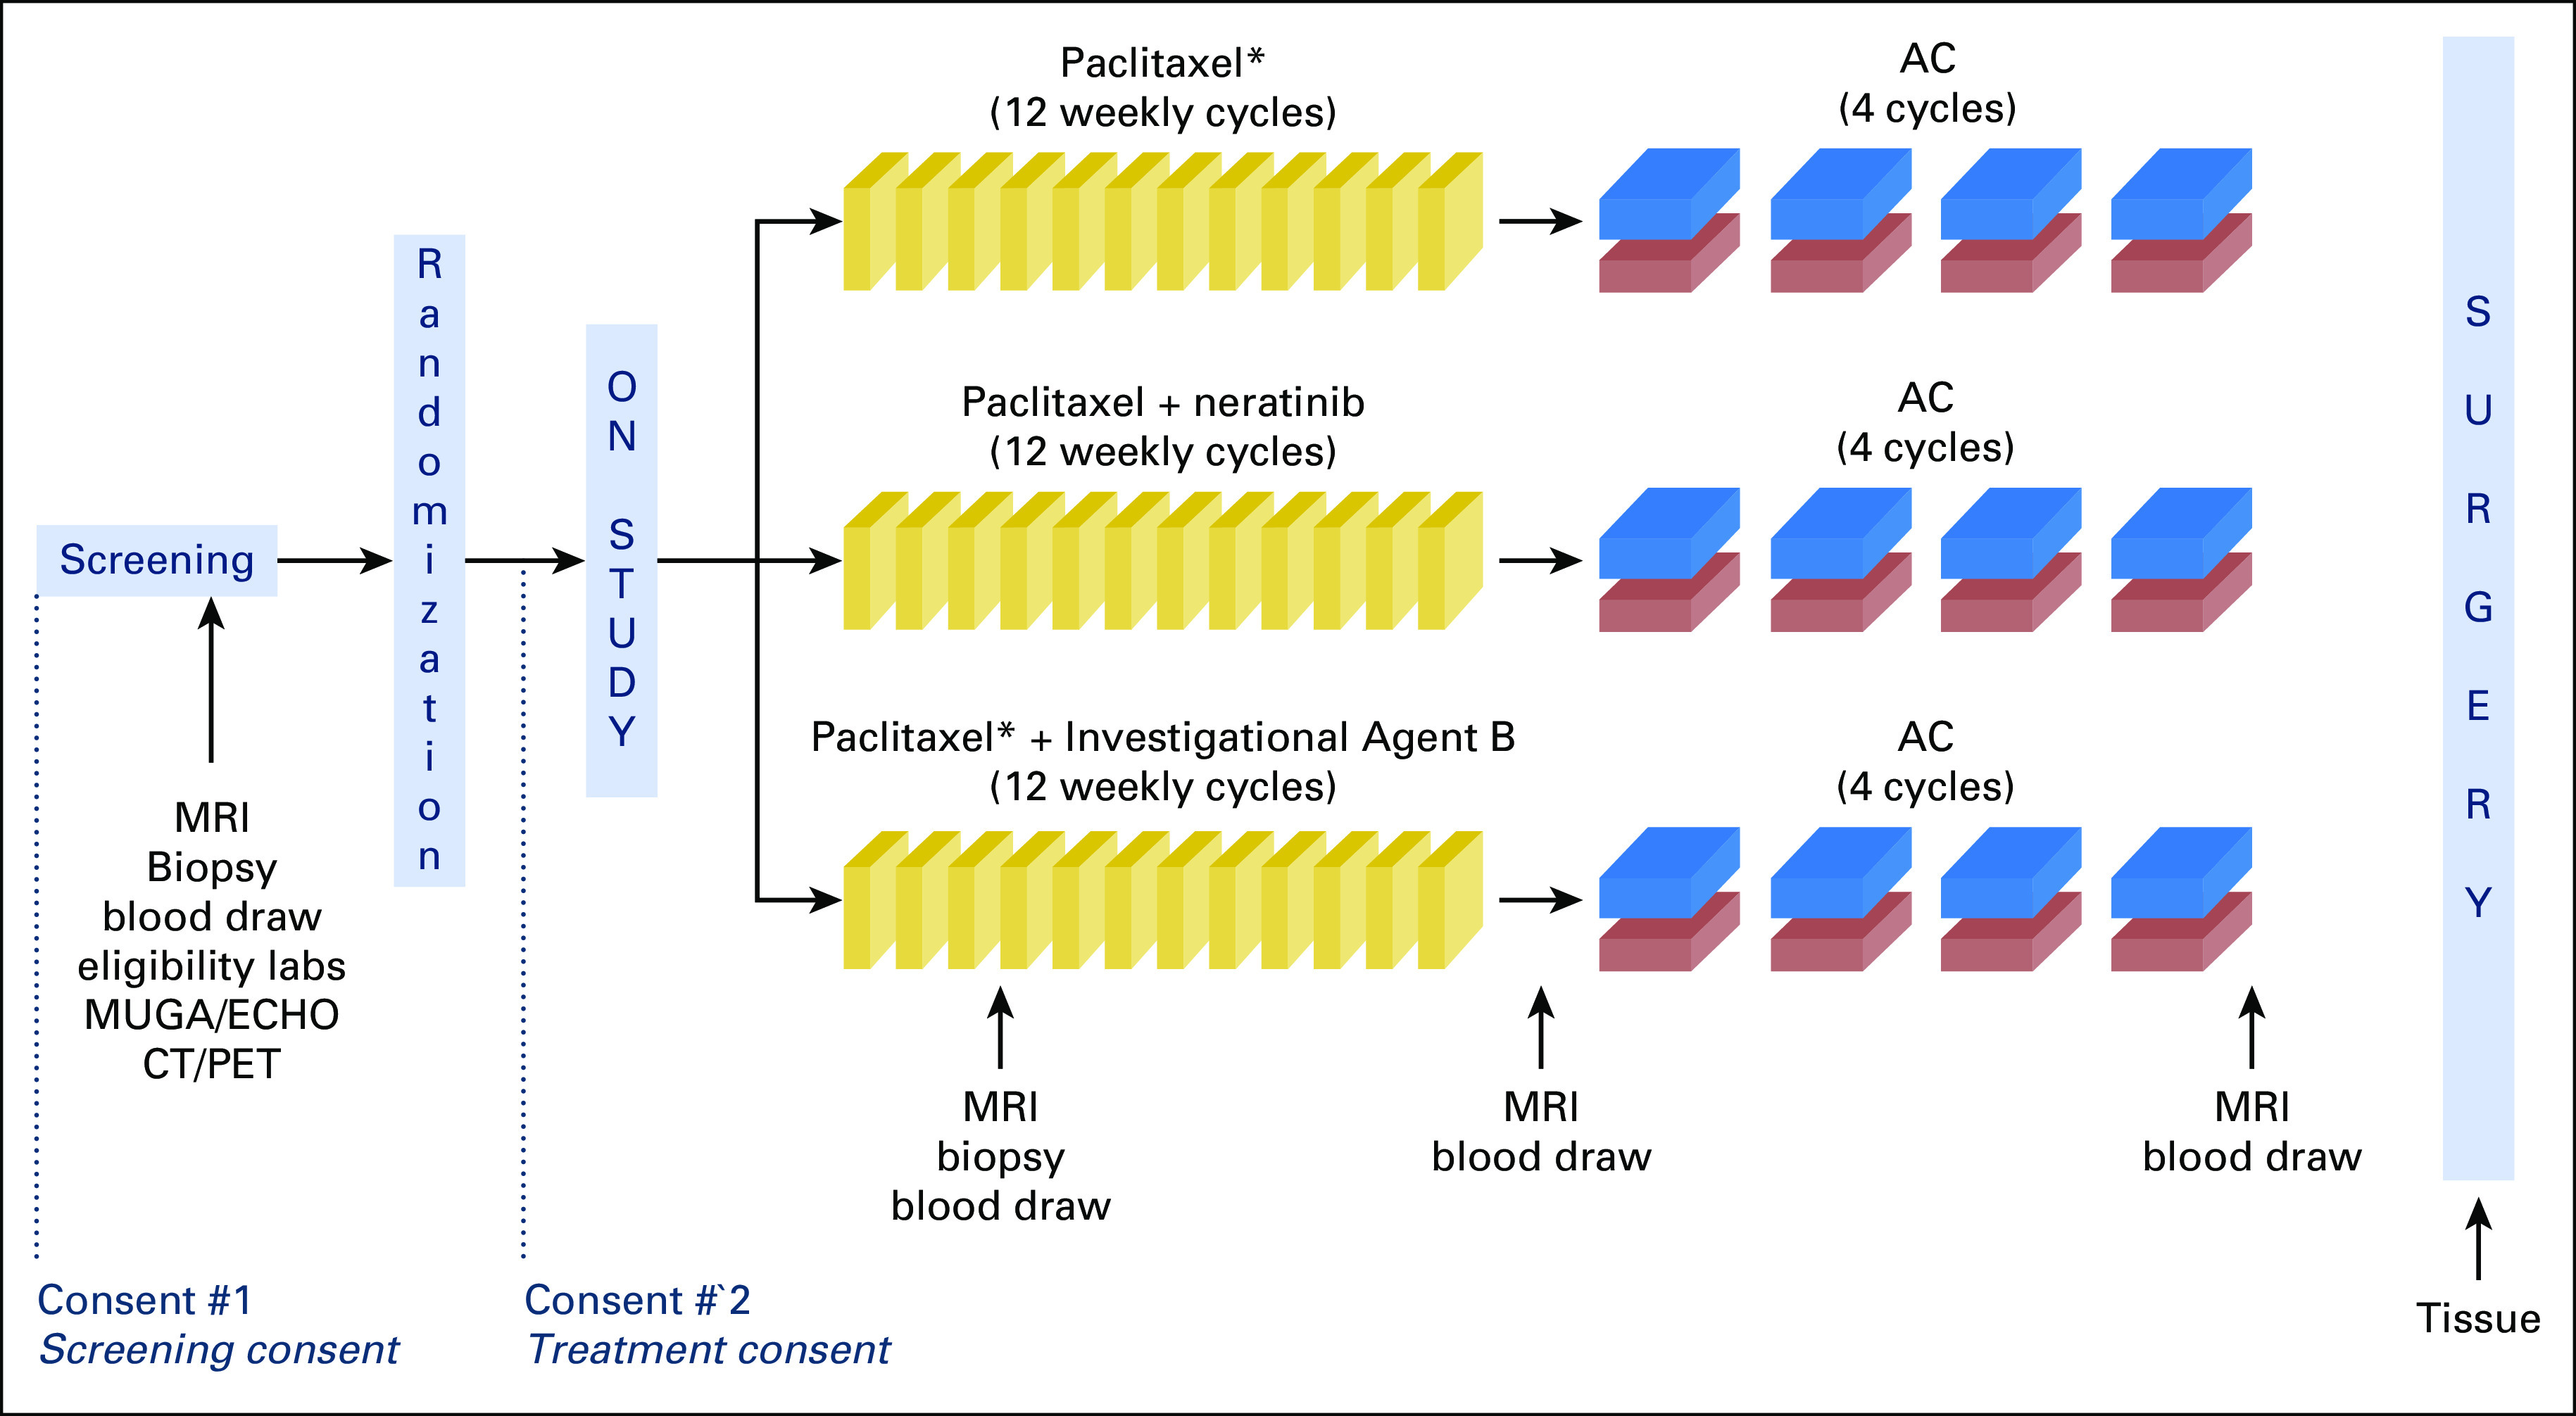
I-SPY2 TRIAL (Investigation of Serial Studies to Predict Your Therapeutic Response With Imaging and Molecular Analysis 2) schema for patients in the control and experimental therapy arms. (*) HER2-positive patients also received trastuzumab. AC, doxorubicin/cyclophosphamide; CT/PET, computed tomography/positron emission tomography; ECHO, echocardiogram; HER2, human epidermal growth factor receptor 2; MRI, magnetic resonance imaging; MUGA, multigated acquisition.
Table A1.
Gene Expression Associations With pCR Population as a Whole

Table A2.
Gene Expression Associations With pCR in HER2-Positive Subset

Table A3.
Gene Expression Associations With pCR in HER2-Negative Subset

Table A4.
Bayesian Probabilities of EGFR Y1173 as a Biomarker of Neratinib Response

Table A5.
Bayesian Probabilities and Biomarker Prevalence for TN Population

Footnotes
Supported by the Gateway for Cancer Research (Grant No. G-16-900); Sideout Foundation; QuantumLeap Healthcare Collaborative; Foundation for the National Institutes of Health; National Cancer Institute Center for Biomedical Informatics and Information Technology (Grant No. 28XS197); Stand Up to Cancer: Prospective Use of DNA-Guided Personalized Cancer Treatment; Safeway Foundation; the Bill Bowes Foundation; Quintiles Transnational; Johnson & Johnson; Genentech, Amgen, the San Francisco Foundation; Give Breast Cancer the Boot; Eli Lilly, Pfizer; Eisai; the Harlan family; the Avon Foundation for Women; and Alexandria Real Estate Equities.
Presented in part at the 2014 San Antonio Breast Cancer Symposium, San Antonio, TX, Dec. 9-13, 2014, the 2016 San Antonio Breast Cancer Symposium, San Antonio, TX, Dec. 6-10, 2016, and the Annual Meeting of the American Society for Clinical Oncology, Chicago, IL, May 29-June 2, 2015.
AUTHOR CONTRIBUTIONS
Conception and design: Julia D. Wulfkuhle, Christina Yau, Denise M. Wolf, Emile E. Voest, Angela DeMichele, Nola Hylton, Gillian Hirst, Douglas Yee, Laura Esserman, Minetta Liu, John W. Park, Laura van't Veer, Emanuel F. Petricoin
Collection and assembly of data: Julia D. Wulfkuhle, Christina Yau, Denise Wolf, Daniel J. Vis, Rosa I. Gallagher, Lamorna Brown-Swigart, Emile E. Voest, Nola Hylton, Laura van't Veer, Emanuel F. Petricoin
Data analysis and interpretation: Julia D. Wulfkuhle, Christina Yau, Denise M. Wolf, Daniel J. Vis, Rosa I. Gallagher, Gillian Hirst, Fraser Symmans, Laura Esserman, Minetta Liu, Donald Berry, John W. Park, Lodewyk F.A. Wessels, Laura van't Veer, Emanuel F. Petricoin
Provision of study material or patients: Laura Esserman
Manuscript writing: All authors
Final approval of manuscript: All authors
AUTHORS' DISCLOSURES OF POTENTIAL CONFLICTS OF INTEREST
The following represents disclosure information provided by authors of this manuscript. All relationships are considered compensated. Relationships are self-held unless noted. I = Immediate Family Member, Inst = My Institution. Relationships may not relate to the subject matter of this manuscript. For more information about ASCO's conflict of interest policy, please refer to www.asco.org/rwc or ascopubs.org/po/author-center.
Julia D. Wulfkuhle
Honoraria: DAVA Oncology
Patents, Royalties and other Intellectual Property: Co-inventor on filed George Mason University–assigned patents related to phosphorylated HER2 and EGFR response predictors for HER family directed therapeutics. As such can receive royalties and licensing distribution on any licensed IP
Christina Yau
Employment: NantOmics
Denise M. Wolf
No relationship to disclose
Daniel J. Vis
No relationship to disclose
Rosa I. Gallagher
No relationship to disclose
Lamorna Brown-Swigart
No relationship to disclose
Gillian Hirst
No relationship to disclose
Emile E. Voest
Consulting or Advisory Role: InteRNA, Biogeneration Ventures
Research Funding: Novartis (Inst), GlaxoSmithKline (Inst), Roche (Inst), Genentech (Inst), Pfizer (Inst), AstraZeneca (Inst), Eisai (Inst), Pfizer (Inst), Bristol-Myers Squibb (Inst), Merck (Inst)
Angela DeMichele
Honoraria: Pfizer
Consulting or Advisory Role: Calithera Biosciences, Novartis
Research Funding: Pfizer (Inst), Genentech (Inst), Incyte (Inst), Millennium (Inst), Bayer (Inst), Veridex (Inst), Calithera Biosciencs (Inst), GlaxoSmithKline (Inst), Wyeth (Inst)
Travel, Accommodations, Expenses: Pfizer, Calithera Biosciences, Novartis, Pfizer
Nola Hylton
No relationship to disclose
Fraser Symmans
Stock and Other Ownership Interests: ISIS Pharmaceuticals, Nuvera Biosciences, Delphi Diagnostics
Consulting or Advisory Role: Merck
Travel, Accommodations, Expenses: Luminex, Merck
Douglas Yee
No relationship to disclose
Laura Esserman
Consulting or Advisory Role: Blue Cross Blue Shield Association
Research Funding: Merck
Travel, Accommodations, Expenses: Blue Cross Blue Shield Association
Donald Berry
Employment: Berry Consultants
Leadership: Berry Consultants
Stock and Other Ownership Interests: Berry Consultants
Consulting or Advisory Role: Berry Consultants
Travel, Accommodations, Expenses: Berry Consultants
Minetta Liu
Research Funding: Eisai (Inst), Seattle Genetics (Inst), Novartis (Inst), Roche (Inst), Genentech (Inst), GRAIL (Inst), Merck (Inst), Janssen Diagnostics (Inst)
Travel, Accommodations, Expenses: GRAIL, Mreck, Celgene, Agena Bioscience, Menarini Silicon Biosystems, Cynvenio Biosystems
John W. Park
Stock and Other Ownership Interests: Merrimack
Consulting or Advisory Role: Genentech (Inst)
Speakers' Bureau: Genentech, Pfizer, Agendia (I)
Lodewyk F.A. Wessels
Research Funding: GlaxoSmithKline (Inst), Genmab (Inst)
Laura van 't Veer
Employment: Agendia
Leadership: Agendia
Stock and Other Ownership Interests: Agendia
Emanuel F. Petricoin III
Leadership: Perthera, Ceres Nanosciences
Stock and Other Ownership Interests: Perthera, Ceres Nanosciences, Avant Diagnostics
Consulting or Advisory Role: Perthera, Ceres Nanosciences, AZGen, Avant Diagnostics
Research Funding: Ceres Nanosciences (Inst), GlaxoSmithKline (Inst), Abbvie (Inst), Symphony Evolution (Inst)
Patents, Royalties, Other Intellectual Property: National Institutes of Health patents licensing fee distribution/royalty. Co-inventor on filed George Mason University–assigned patents related to phosphorylated HER2 and EGFR response predictors for HER family directed therapeutics. As such can receive royalties and licensing distribution on any licensed IP
Travel, Accommodations, Expenses: Perthera, Ceres Nanosciences
REFERENCES
- 1.Barker AD, Sigman CC, Kelloff GJ, et al. I-SPY 2: An adaptive breast cancer trial design in the setting of neoadjuvant chemotherapy. Clin Pharmacol Ther. 2009;86:97–100. doi: 10.1038/clpt.2009.68. [DOI] [PubMed] [Google Scholar]
- 2.Berry DA. Adaptive clinical trials in oncology. Nat Rev Clin Oncol. 2011;9:199–207. doi: 10.1038/nrclinonc.2011.165. [DOI] [PubMed] [Google Scholar]
- 3.Berry DA. The brave new world of clinical cancer research: Adaptive biomarker-driven trials integrating clinical practice with clinical research. Mol Oncol. 2015;9:951–959. doi: 10.1016/j.molonc.2015.02.011. [DOI] [PMC free article] [PubMed] [Google Scholar]
- 4.Park JW, Liu MC, Yee D, et al. Adaptive randomization of neratinib in early breast cancer. N Engl J Med. 2016;375:11–22. doi: 10.1056/NEJMoa1513750. [DOI] [PMC free article] [PubMed] [Google Scholar]
- 5.Sánchez-Martín M, Pandiella A. Differential action of small molecule HER kinase inhibitors on receptor heterodimerization: Therapeutic implications. Int J Cancer. 2012;131:244–252. doi: 10.1002/ijc.26358. [DOI] [PubMed] [Google Scholar]
- 6.Mullooly M, Conklin D, McGowan PM, et al. Neratinib to inhibit the growth of triple-negative breast cancer cells. J Clin Oncol 33), 2015 (suppl; abstr 1099.
- 7.Bose R, Kavuri SM, Searleman AC, et al. Activating HER2 mutations in HER2 gene amplification–negative breast cancer. Cancer Discov. 2013;3:224–237. doi: 10.1158/2159-8290.CD-12-0349. [DOI] [PMC free article] [PubMed] [Google Scholar]
- 8.Canonici A, Gijsen M, Mullooly M, et al. Neratinib overcomes trastuzumab resistance in HER2-amplified breast cancer. Oncotarget. 2013;4:1592–1605. doi: 10.18632/oncotarget.1148. [DOI] [PMC free article] [PubMed] [Google Scholar]
- 9.O’Neill F, Madden SF, Clynes M, et al. A gene expression profile indicative of early-stage HER2–targeted therapy response. Mol Cancer. 2013;12:69. doi: 10.1186/1476-4598-12-69. [DOI] [PMC free article] [PubMed] [Google Scholar]
- 10.Ma CX, Bose R, Gao F, et al. Neratinib efficacy and circulating tumor DNA detection of HER2 mutations in HER2-nonamplified metastatic breast cancer. Clin Cancer Res. 2017;23:5687–5695. doi: 10.1158/1078-0432.CCR-17-0900. [DOI] [PMC free article] [PubMed] [Google Scholar]
- 11.Hanker AB, Brewer MR, Sheehan JH, et al. An acquired HER2 T798I gatekeeper mutation induces resistance to neratinib in a patient with HER2 mutant–driven breast cancer. Cancer Discov. 2017;7:575–585. doi: 10.1158/2159-8290.CD-16-1431. [DOI] [PMC free article] [PubMed] [Google Scholar]
- 12.Fumagalli D, Venet D, Ignatiadis M, et al. RNA sequencing to predict response to neoadjuvant anti-HER2 therapy: a secondary analysis of the NeoALTTO randomized clinical trial. JAMA Oncol. doi: 10.1001/jamaoncol.2016.3824. doi: 10.1001/jamaoncol.2016.3824 [epub ahead of print on September 29, 2016] [DOI] [PMC free article] [PubMed] [Google Scholar]
- 13.Bianchini G, Kiermaier A, Bianchi GV, et al. Biomarker analysis of the NeoSphere study: Pertuzumab, trastuzumab, and docetaxel versus trastuzumab plus docetaxel, pertuzumab plus trastuzumab, or pertuzumab plus docetaxel for the neoadjuvant treatment of HER2-positive breast cancer. Breast Cancer Res. 2017;19:16–28. doi: 10.1186/s13058-017-0806-9. [DOI] [PMC free article] [PubMed] [Google Scholar]
- 14.Baselga J, Cortés J, Im SA, et al. Biomarker analyses in CLEOPATRA: A phase III, placebo-controlled study of pertuzumab in human epidermal growth factor receptor 2-positive, first-line metastatic breast cancer. J Clin Oncol. 2014;32:3753–3761. doi: 10.1200/JCO.2013.54.5384. [DOI] [PubMed] [Google Scholar]
- 15.Wulfkuhle JD, Berg D, Wolff C, et al. Molecular analysis of HER2 signaling in human breast cancer by functional protein pathway activation mapping. Clin Cancer Res. 2012;18:6426–6435. doi: 10.1158/1078-0432.CCR-12-0452. [DOI] [PMC free article] [PubMed] [Google Scholar]
- 16.Wolf DM, Yau C, Sanil A, et al. DNA repair deficiency biomarkers and the 70-gene ultra-high-risk signature as predictors of veliparib/carboplatin response in the I-SPY 2 breast cancer trial. NPJ Breast Cancer. 2017;3:31. doi: 10.1038/s41523-017-0025-7. [DOI] [PMC free article] [PubMed] [Google Scholar]
- 17.Loibl S, Majewski I, Guarneri V, et al. PIK3CA mutations are associated with reduced pathological complete response rates in primary HER2-positive breast cancer: Pooled analysis of 967 patients from five prospective trials investigating lapatinib and trastuzumab. Ann Oncol. 2016;27:1519–1525. doi: 10.1093/annonc/mdw197. [DOI] [PMC free article] [PubMed] [Google Scholar]
- 18.Cizkova M, Dujaric ME, Lehmann-Che J, et al. Outcome impact of PIK3CA mutations in HER2-positive breast cancer patients treated with trastuzumab. Br J Cancer. 2013;108:1807–1809. doi: 10.1038/bjc.2013.164. [DOI] [PMC free article] [PubMed] [Google Scholar]
- 19.Lopez S, Cocco E, Black J, et al. Dual HER2/PIK3CA targeting overcomes single-agent acquired resistance in HER2-amplified uterine serous carcinoma cell lines in vitro and in vivo. Mol Cancer Ther. 2015;14:2519–2526. doi: 10.1158/1535-7163.MCT-15-0383. [DOI] [PMC free article] [PubMed] [Google Scholar]
- 20.Ho KJ., Liao JK. Nonnuclear actions of estrogen. Arterioscler Thromb Vasc Biol. 2002;22:1952–1961. doi: 10.1161/01.atv.0000041200.85946.4a. [DOI] [PubMed] [Google Scholar]
- 21.Lee AV, Guler BL, Sun X, et al. Oestrogen receptor is a critical component required for insulin-like growth factor (IGF)-mediated signalling and growth in MCF-7 cells. Eur J Cancer. 2000;36:109–110. doi: 10.1016/s0959-8049(00)00264-1. [DOI] [PubMed] [Google Scholar]
- 22.Lee AV, Cui X, Oesterreich S. Cross-talk among estrogen receptor, epidermal growth factor, and insulin-like growth factor signaling in breast cancer. Clin Cancer Res. 2001;7:4429s–4435s. [PubMed] [Google Scholar]
- 23.Thor AD, Liu S, Edgerton S, et al. Activation (tyrosine phosphorylation) of ErbB-2 (HER-2/neu): A study of incidence and correlation with outcome in breast cancer. J Clin Oncol. 2000;18:3230–3239. doi: 10.1200/JCO.2000.18.18.3230. [DOI] [PubMed] [Google Scholar]
- 24.Cicenas J, Urban P, Küng W, et al. Phosphorylation of tyrosine 1248-ERBB2 measured by chemiluminescence-linked immunoassay is an independent predictor of poor prognosis in primary breast cancer patients. Eur J Cancer. 2006;42:636–645. doi: 10.1016/j.ejca.2005.11.012. [DOI] [PubMed] [Google Scholar]
- 25.Frogne T, Laenkholm AV, Lyng MB, et al. Determination of HER2 phosphorylation at tyrosine 1221/1222 improves prediction of poor survival for breast cancer patients with hormone receptor-positive tumors. Breast Cancer Res. 2009;11:R11. doi: 10.1186/bcr2230. [DOI] [PMC free article] [PubMed] [Google Scholar]
- 26.DiGiovanna MP, Stern DF, Edgerton SM, et al. Relationship of epidermal growth factor receptor expression to ErbB-2 signaling activity and prognosis in breast cancer patients. J Clin Oncol. 2005;23:1152–1160. doi: 10.1200/JCO.2005.09.055. [DOI] [PubMed] [Google Scholar]
- 27.Hudelist G, Köstler WJ, Czerwenka K, et al. Her-2/neu and EGFR tyrosine kinase activation predict the efficacy of trastuzumab-based therapy in patients with metastatic breast cancer. Int J Cancer. 2006;118:1126–1134. doi: 10.1002/ijc.21492. [DOI] [PubMed] [Google Scholar]
- 28.Emery IF, Battelli C, Auclair PL, et al. Response to gefitinib and erlotinib in non–small-cell lung cancer: A restrospective study. BMC Cancer. 2009;9:333–344. doi: 10.1186/1471-2407-9-333. [DOI] [PMC free article] [PubMed] [Google Scholar]
- 29.Wang F, Wang S, Wang Z, et al. Phosphorylated EGFR expression may predict outcome of EGFR-TKIs therapy for the advanced NSCLC patients with wild-type EGFR. J Exp Clin Cancer Res. 2012;31:65–75. doi: 10.1186/1756-9966-31-65. [DOI] [PMC free article] [PubMed] [Google Scholar]
- 30.Wali VB, Haskins JW, Gilmore-Hebert M, et al. Convergent and divergent cellular responses by ErbB4 isoforms in mammary epithelial cells. Mol Cancer Res. 2014;12:1140–1155. doi: 10.1158/1541-7786.MCR-13-0637. [DOI] [PMC free article] [PubMed] [Google Scholar]
- 31.Saal LH, Johansson P, Holm K, et al. Poor prognosis in carcinoma is associated with a gene expression signature of aberrant PTEN tumor suppressor pathway activity. Proc Natl Acad Sci USA. 2007;104:7564–7569. doi: 10.1073/pnas.0702507104. [DOI] [PMC free article] [PubMed] [Google Scholar]
- 32.Drury SC, Detre S, Leary A, et al. Changes in breast cancer biomarkers in the IGF1R/PI3K pathway in recurrent breast cancer after tamoxifen treatment. Endocr Relat Cancer. 2011;18:565–577. doi: 10.1530/ERC-10-0046. [DOI] [PubMed] [Google Scholar]
- 33.Zhu HW, Jiang D, Xie ZY, et al. Effects of stathmin 1 silencing by siRNA on sensitivity of esophageal cancer cells Eca-109 to paclitaxel. Genet Mol Res. 2015;14:18695–18702. doi: 10.4238/2015.December.28.18. [DOI] [PubMed] [Google Scholar]
- 34.Paik S, Kim C, Wolmark N. HER2 status and benefit from adjuvant trastuzumab in breast cancer. N Engl J Med. 2008;358:1409–1411. doi: 10.1056/NEJMc0801440. [DOI] [PubMed] [Google Scholar]
- 35.Perez EA, Reinholz MM, Hillman DW, et al. HER2 and chromosome 17 effect on patient outcome in the N9831 adjuvant trastuzumab trial. J Clin Oncol. 2010;28:4307–4315. doi: 10.1200/JCO.2009.26.2154. [DOI] [PMC free article] [PubMed] [Google Scholar]
- 36.Fehrenbacher L, Cecchini RS, Geyer CE, et al. NSABP B-47 (NRG oncology): Phase III randomized trial comparing adjuvant chemotherapy with adriamycin (A) and cyclophosphamide (C) > weekly paclitaxel (WP), or docetaxel (T) and C with or without a year of trastuzumab (H) I women with node-positive or high-risk node negative invasive breast cancer (IBC) expressing HER2 staining intensity of IHC 1+ or 2+ with negative FISH (HER2-low IBC). Cancer Res 78, 2018 (suppl; abstr GS1-02) [Google Scholar]
- 37.Chakraborty A, Hatzis C, DiGiovanna MP. Co-targeting the HER and IGF/insulin receptor axis in breast cancer, with triple targeting with endocrine therapy for hormone-sensitive disease. Breast Cancer Res Treat. 2017;163:37–50. doi: 10.1007/s10549-017-4169-9. [DOI] [PubMed] [Google Scholar]
- 38.Spector NL, Xia W, Burris H, III, et al. Study of the biologic effects of lapatinib, a reversible inhibitor of ErbB1 and ErbB2 tyrosine kinases, on tumor growth and survival pathways in patients with advanced malignancies. J Clin Oncol. 2005;23:2502–2512. doi: 10.1200/JCO.2005.12.157. [DOI] [PubMed] [Google Scholar]
- 39.Lee CY, Lin Y, Bratman SV, et al. Neuregulin autocrine signaling promotes self-renewal of breast tumor-initiating cells by triggering HER2/HER3 activation. Cancer Res. 2014;74:341–352. doi: 10.1158/0008-5472.CAN-13-1055. [DOI] [PMC free article] [PubMed] [Google Scholar]
- 40.Arpino G, Wiechmann L, Osborne CK, et al. Crosstalk between the estrogen receptor and the HER tyrosine kinase receptor family: Molecular mechanism and clinical implications for endocrine therapy resistance. Endocr Rev. 2008;29:217–233. doi: 10.1210/er.2006-0045. [DOI] [PMC free article] [PubMed] [Google Scholar]
- 41.Song RX, Barnes CJ, Zhang Z, et al. The role of Shc and insulin-like growth factor 1 receptor in mediating the translocation of estrogen receptor α to the plasma membrane. Proc Natl Acad Sci USA. 2004;101:2076–2081. doi: 10.1073/pnas.0308334100. [DOI] [PMC free article] [PubMed] [Google Scholar]
- 42.Márquez DC, Lee J, Lin T, et al. Epidermal growth factor receptor and tyrosine phosphorylation of estrogen receptor. Endocrine. 2001;16:73–81. doi: 10.1385/ENDO:16:2:073. [DOI] [PubMed] [Google Scholar]
- 43.Márquez DC, Pietras RJ. Membrane-associated binding sites for estrogen contribute to growth regulation of human breast cancer cells. Oncogene. 2001;20:5420–5430. doi: 10.1038/sj.onc.1204729. [DOI] [PubMed] [Google Scholar]
- 44.Pietras RJ, Arboleda J, Reese DM, et al. HER-2 tyrosine kinase pathway targets estrogen receptor and promotes hormone-independent growth in human breast cancer cells. Oncogene. 1995;10:2435–2446. [PubMed] [Google Scholar]
- 45.Márquez DC, Chen HW, Curran EM, et al. Estrogen receptors in membrane lipid rafts and signal transduction in breast cancer. Mol Cell Endocrinol. 2006;246:91–100. doi: 10.1016/j.mce.2005.11.020. [DOI] [PubMed] [Google Scholar]
- 46.Arnedos M, Vicier C, Loi S, et al. Precision medicine for metastatic breast cancer: Limitations and solutions. Nat Rev Clin Oncol. 2015;12:693–704. doi: 10.1038/nrclinonc.2015.123. [DOI] [PubMed] [Google Scholar]
- 47.Akbani R, Becker KF, Carragher N, et al. Realizing the promise of reverse phase protein arrays for clinical, translational, and basic research: A workshop report: The RPPA (Reverse Phase Protein Array) society. Mol Cell Proteomics. 2014;13:1625–1643. doi: 10.1074/mcp.O113.034918. [DOI] [PMC free article] [PubMed] [Google Scholar]
- 48.Mueller C, deCarvalho AC, Mikkelsen T, et al. Glioblastoma cell enrichment is critical for analysis of phosphorylated drug targets and proteomic-genomic correlations. Cancer Res. 2014;74:818–828. doi: 10.1158/0008-5472.CAN-13-2172. [DOI] [PubMed] [Google Scholar]