Abstract
PURPOSE
Cell-free DNA (cfDNA) and circulating tumor cell (CTC)–based liquid biopsies have emerged as potential tools to predict responses to androgen receptor (AR)–directed therapy in metastatic prostate cancer. However, because of complex mechanisms and incomplete understanding of genomic events involved in metastatic prostate cancer resistance, current assays (eg, CTC AR-V7) demonstrate low sensitivity and remain underutilized. The recent discovery of AR enhancer amplification in > 80% of patients with metastatic disease and its association with disease resistance presents an opportunity to improve on current assays. We hypothesized that tracking AR/enhancer genomic alterations in plasma cfDNA would detect resistance with high sensitivity and specificity.
PATIENTS AND METHODS
We developed a targeted sequencing and analysis method as part of a new assay called Enhancer and Neighboring Loci of Androgen Receptor Sequencing (EnhanceAR-Seq). We applied EnhanceAR-Seq to plasma collected from 40 patients with metastatic prostate cancer treated with AR-directed therapy to monitor AR/enhancer genomic alterations and correlated these events with therapy resistance, progression-free survival (PFS), and overall survival (OS).
RESULTS
EnhanceAR-Seq identified genomic alterations in the AR/enhancer locus in 45% of cases, including a 40% rate of AR enhancer amplification. Patients with AR/enhancer alterations had significantly worse PFS and OS than those without (6-month PFS, 30% v 71%; P = .0002; 6-month OS, 59% v 100%; P = .0015). AR/enhancer alterations in plasma cfDNA detected 18 of 23 resistant cases (78%) and outperformed the CTC AR-V7 assay, which was also run on a subset of patients.
CONCLUSION
cfDNA-based AR locus alterations, including of the enhancer, are strongly associated with resistance to AR-directed therapy and significantly worse survival. cfDNA analysis using EnhanceAR-Seq may enable more precise risk stratification and personalized therapeutic approaches for metastatic prostate cancer.
INTRODUCTION
Metastatic castration-resistant prostate cancer (mCRPC) is the most aggressive form of prostate cancer.1 Outcomes have improved significantly with the advent of androgen receptor (AR)–directed therapies such as abiraterone and enzalutamide.2-4 Still, approximately 20%-40% of patients exhibit primary resistance to these treatments and have substantially worse survival (median, < 6 months).5,6 Other patients develop secondary resistance to AR-directed therapy, responding well initially before eventually developing resistance.7 There is thus an urgent need for molecular biomarkers that can detect resistance to AR-directed therapy early, especially primary resistance, which would enable clinicians to consider alternative treatments (ie, chemotherapy, immunotherapy, or systemic radiotherapy) and potentially improve patient survival.
CONTEXT
Key Objective
Can we predict resistance to androgen receptor (AR)–directed therapy in patients with metastatic prostate cancer by tracking genomic alterations in the AR enhancer in addition to the AR gene body (AR/enhancer) in plasma cell-free DNA (cfDNA)?
Knowledge Generated
We developed Enhancer and Neighboring Loci of Androgen Receptor Sequencing (EnhanceAR-Seq) to monitor AR/enhancer alterations via liquid biopsy and detected AR enhancer amplification in cfDNA of 40% of patients with metastatic prostate cancer, including 8% without AR gene body amplification. Patients with cfDNA-detected alterations in the AR enhancer or gene body ubiquitously exhibited resistance to AR-directed therapy and had significantly worse survival.
Relevance
AR/enhancer alterations are the most frequent somatic event in metastatic prostate cancer, which we show are detectable in plasma cfDNA and predictive of resistance to AR-directed therapy and poor survival. Therefore, cfDNA liquid biopsy analysis of the AR/enhancer locus has the potential to improve risk stratification and help guide clinical decision making for metastatic prostate cancer.
The clinically validated circulating tumor cell (CTC) assay for detecting an aberrant AR splice variant (AR-V7), a predictive biomarker of resistance to AR-directed therapy, highlights the potential value of liquid biopsy analysis in patients with mCRPC.5,6,8 However, the reported sensitivity of this test for detecting AR-resistant mCRPC remains low at only approximately 30%.6,8 Thus, although indicated for clinical use, there is a need for more sensitive assays to detect resistance to AR-directed therapy.
Assessment of cell-free DNA (cfDNA) has recently emerged as a noninvasive means to assess relevant genomic alterations in multiple cancer types, including prostate cancer.9-16 cfDNA assessment of circulating tumor DNA has been shown to be sensitive for identifying tumor-specific somatic mutations with capability to even detect molecular residual disease.10,11,13,16,17 In mCRPC, detection sensitivities have been shown to be high before treatment initiation, and genomic alterations, including those that target the AR gene body, can be reliably measured.9,12,15 Still, it remains to be seen if measuring these genomic alterations can reliably identify resistance to AR-directed therapy.
Although AR is the key player in mCRPC treatment resistance, our understanding of the genomic alterations affecting AR is incomplete. To address this, recent large whole-genome sequencing studies discovered a long-range noncoding enhancer upstream of AR that promotes AR expression and resistance to AR-directed therapies.18-20 Indeed, the AR enhancer was found to be amplified in 81%-87% of patients and is the most frequent genomic alteration in mCRPC (11%-17% more than AR gene body amplification).18,20 Although studies have shown detection of AR gene body alterations in plasma cfDNA of patients with mCRPC,9,12,15 none of these tracked the AR enhancer. Here we present a liquid biopsy cfDNA technique to monitor genomic alterations, including the AR enhancer, called Enhancer and Neighboring Loci of Androgen Receptor Sequencing (EnhanceAR-Seq) and demonstrate the ability to detect resistance to AR-directed therapy with high sensitivity and specificity.
PATIENTS AND METHODS
Patient Enrollment
We prospectively enrolled 40 patients with metastatic prostate cancer treated with at least 1 month of standard-of-care AR-directed treatment (eg, abiraterone or enzalutamide). All patients were maintained on standard androgen deprivation therapy (ie, luteinizing hormone-releasing hormone receptor agonist or antagonist). Prior treatment with other systemic agents, including chemotherapy, was allowed. Patients with evidence of any active nonprostate malignancy other than localized skin cancer were excluded from the study. Eligible patients underwent blood collection for cfDNA analysis at the time of enrollment. All patients underwent continued clinical and laboratory follow-up as per the standard of care. In addition, healthy adult blood donors (n = 36) were recruited from the Washington University School of Medicine and the American Red Cross Blood Center in St Louis, Missouri. All samples were collected with informed consent and institutional review board approval in accordance with the Declaration of Helsinki.
Sequencing and Analysis of Plasma cfDNA
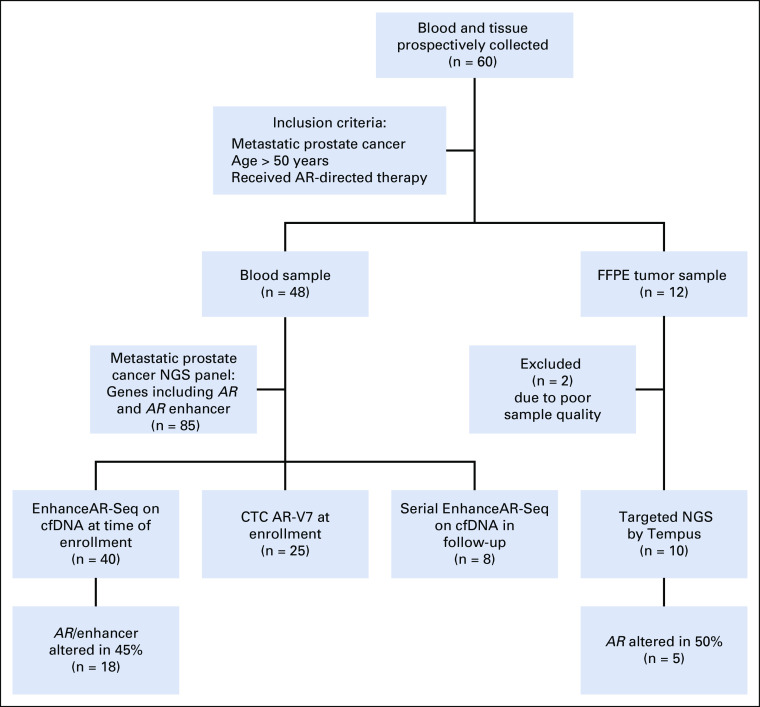
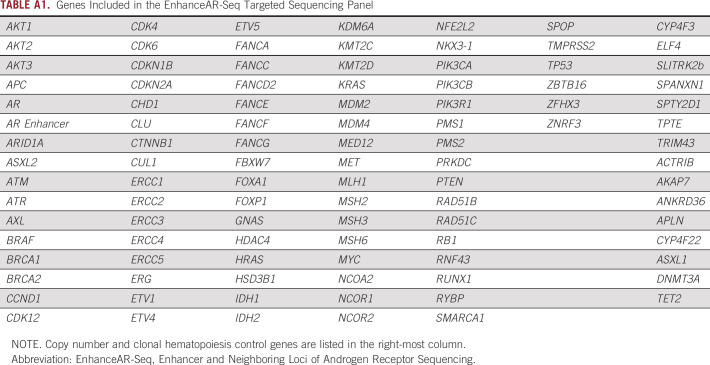
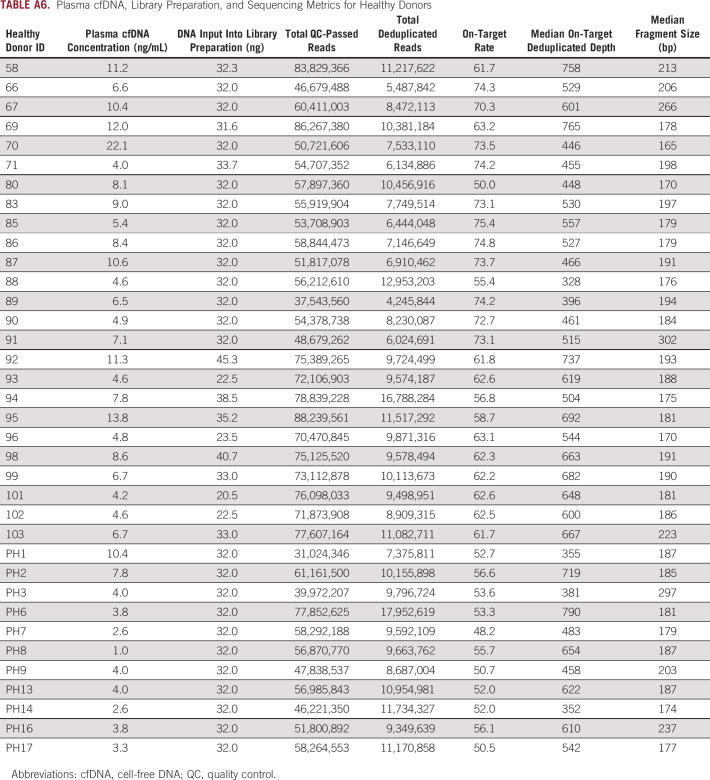
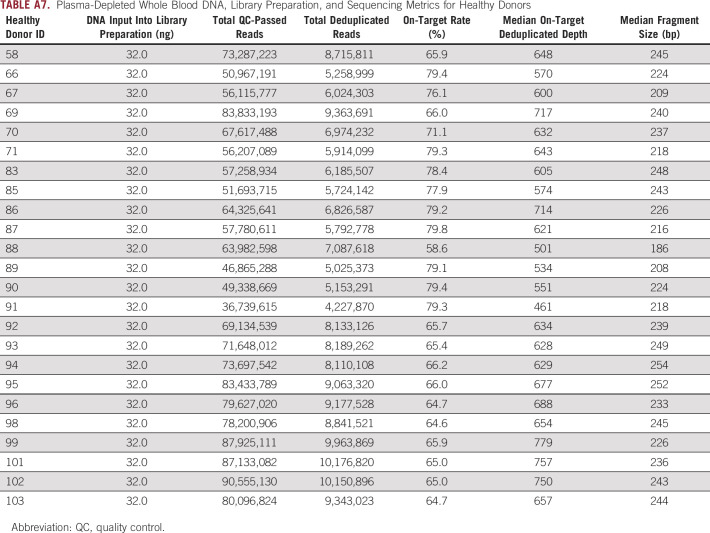
We developed EnhanceAR-Seq as a targeted sequencing assay of plasma cfDNA to monitor genomic alterations in the AR gene and AR enhancer loci and other frequently altered genes9,18 in metastatic prostate cancer (Appendix Table A1). We performed EnhanceAR-Seq on plasma from all patients acquired at the time of enrollment and analyzed genomic alterations with respect to matched plasma-depleted whole blood and unmatched healthy donor samples (Fig 1; Appendix Tables A2 to A7). In four patients, we also performed EnhanceAR-Seq on serial time points, including at least one time point during AR-directed treatment.
FIG 1.
Patient enrollment and sample collection. Patients with biopsy-proven metastatic prostate cancer treated with androgen receptor (AR)-directed therapy were enrolled in the study and samples were collected for tissue, cell-free DNA (cfDNA), and circulating tumor cell (CTC) analyses. EnhanceAR-Seq, Enhancer and Neighboring Loci of Androgen Receptor Sequencing; FFPE, formalin-fixed paraffin-embedded; NGS, next-generation sequencing.
Clinical Outcomes and Statistical Analysis
Resistance to AR-directed therapy was scored by a board-certified academic medical oncologist specializing in genitourinary cancers. Primary resistance was defined as prostate-specific antigen (PSA) progression, change of therapy, or death within 4 months of treatment initiation, or radiographic progression within 6 months. Secondary resistance was defined as PSA progression, change of therapy, radiographic progression, or death outside of this time frame. Associations between assay results and resistance to AR-directed therapy were assessed by Fisher’s exact test. A progression-free survival (PFS) event was defined as the time to PSA progression by Prostate Cancer Clinical Trials Working Group 321 criteria or death, and an overall survival (OS) event was defined as the time to death. The Kaplan-Meier method and multivariate Cox proportional hazards models were used to analyze survival outcomes. Additional methodological details are provided in the Appendix.
RESULTS
Patient Characteristics
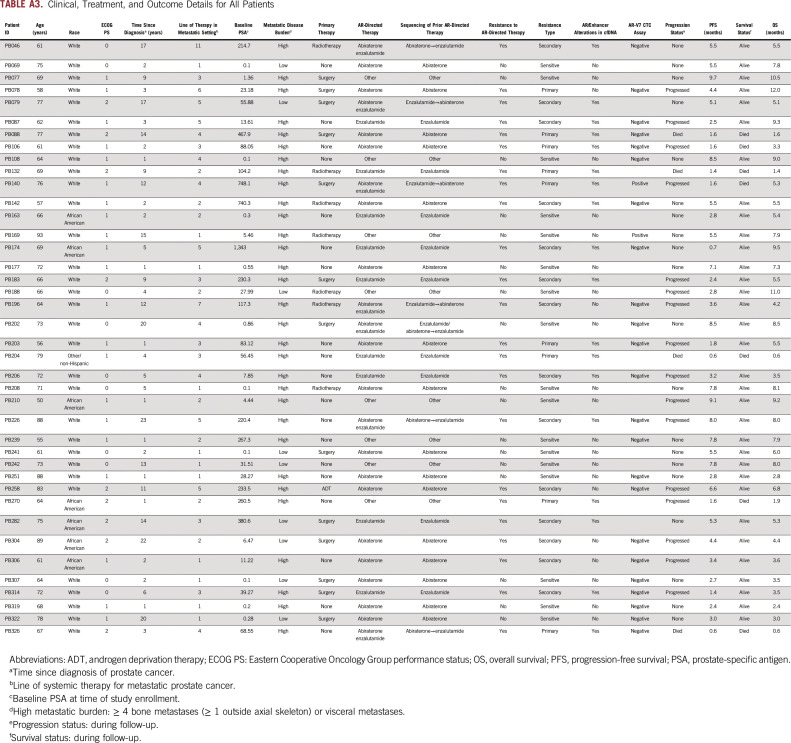
We prospectively enrolled 40 patients with metastatic prostate cancer treated with AR-directed therapy between November 2018 and November 2019 (Appendix Tables A2 and A3). The median age was 69 years, Eastern Cooperative Oncology Group performance status ranged between 0 and 2, and median follow-up time on study was 6.0 months. Among these patients, 11 were on their first line of systemic therapy, and the remaining 29 were on their second or greater line of systemic therapy for metastatic prostate cancer at the time of study enrollment.
EnhanceAR-Seq Detects Somatic Alterations in Plasma cfDNA
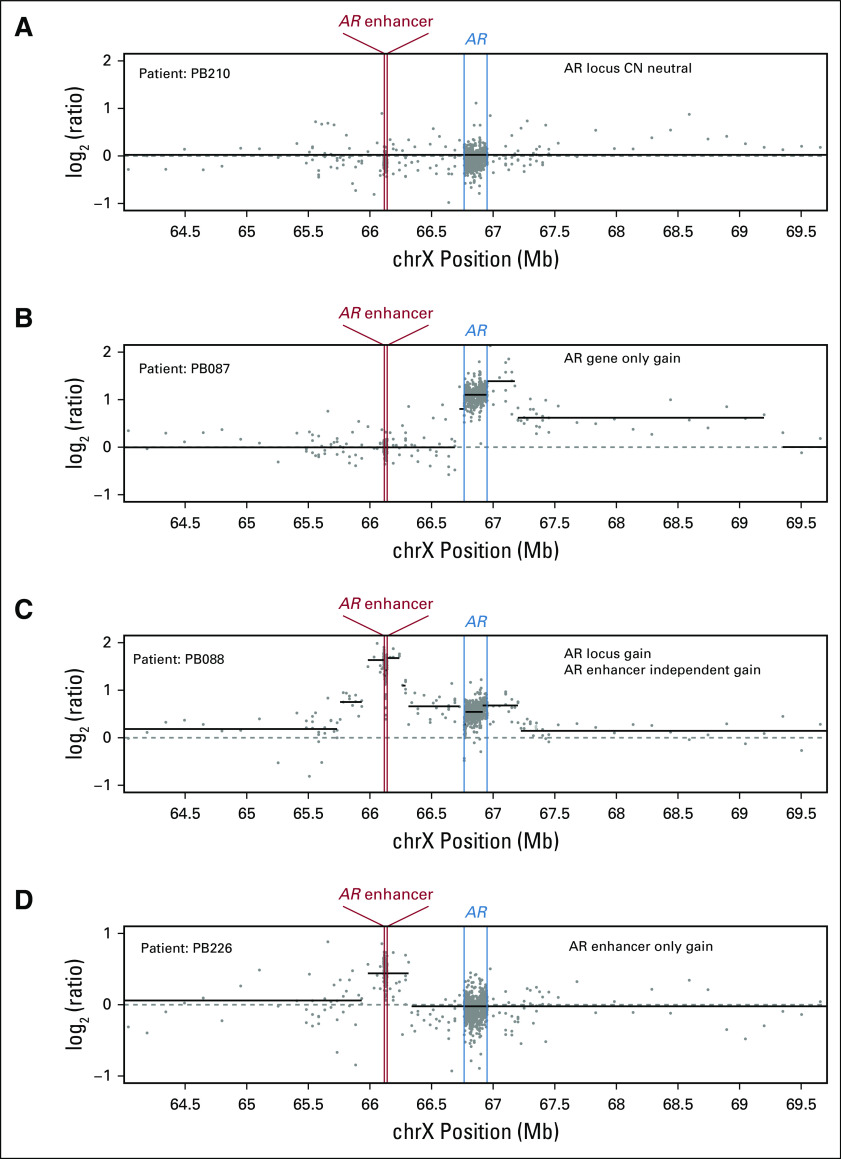
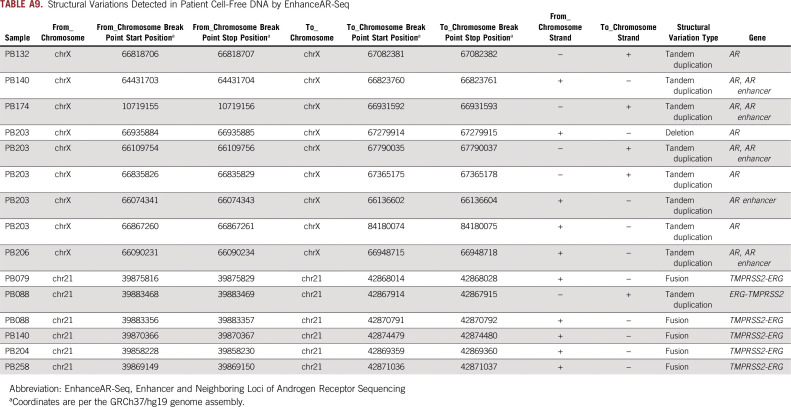
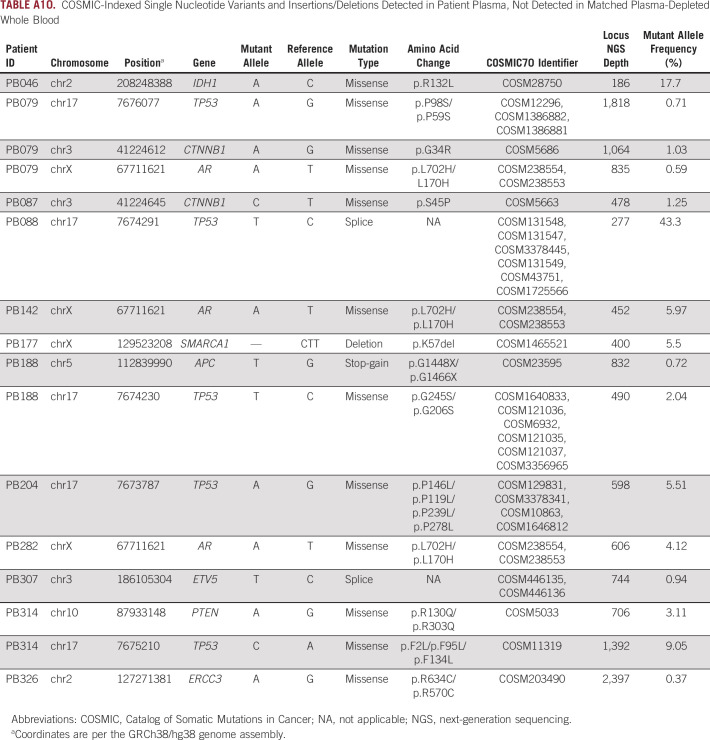
The most frequent genomic events detected in plasma cfDNA from our cohort were AR/enhancer alterations (most commonly copy number gain and tandem duplication), present in 18 patients (45%), including a 40% amplification rate in the AR enhancer region (Fig 2A; Appendix Tables A8 and A9). Three patients (8%) were found to have independent AR-enhancer amplification without AR gene body amplification, consistent with previous tissue-based results18,20 (Fig 2A; Appendix Fig A1; Appendix Table A8). Other genes frequently found in cfDNA to be targeted by alterations included TP53 and PTEN, which demonstrated copy number loss in 6 patients (15%) and Catalog of Somatic Mutations in Cancer (COSMIC)22–annotated nonsynonymous single nucleotide variants in 5 cases (13%; Fig 2A; Appendix Tables A8 and A10). We also detected TMPRSS2-ERG gene fusion in 5 cases (13%; Fig 2A; Appendix Table A9).
FIG 2.
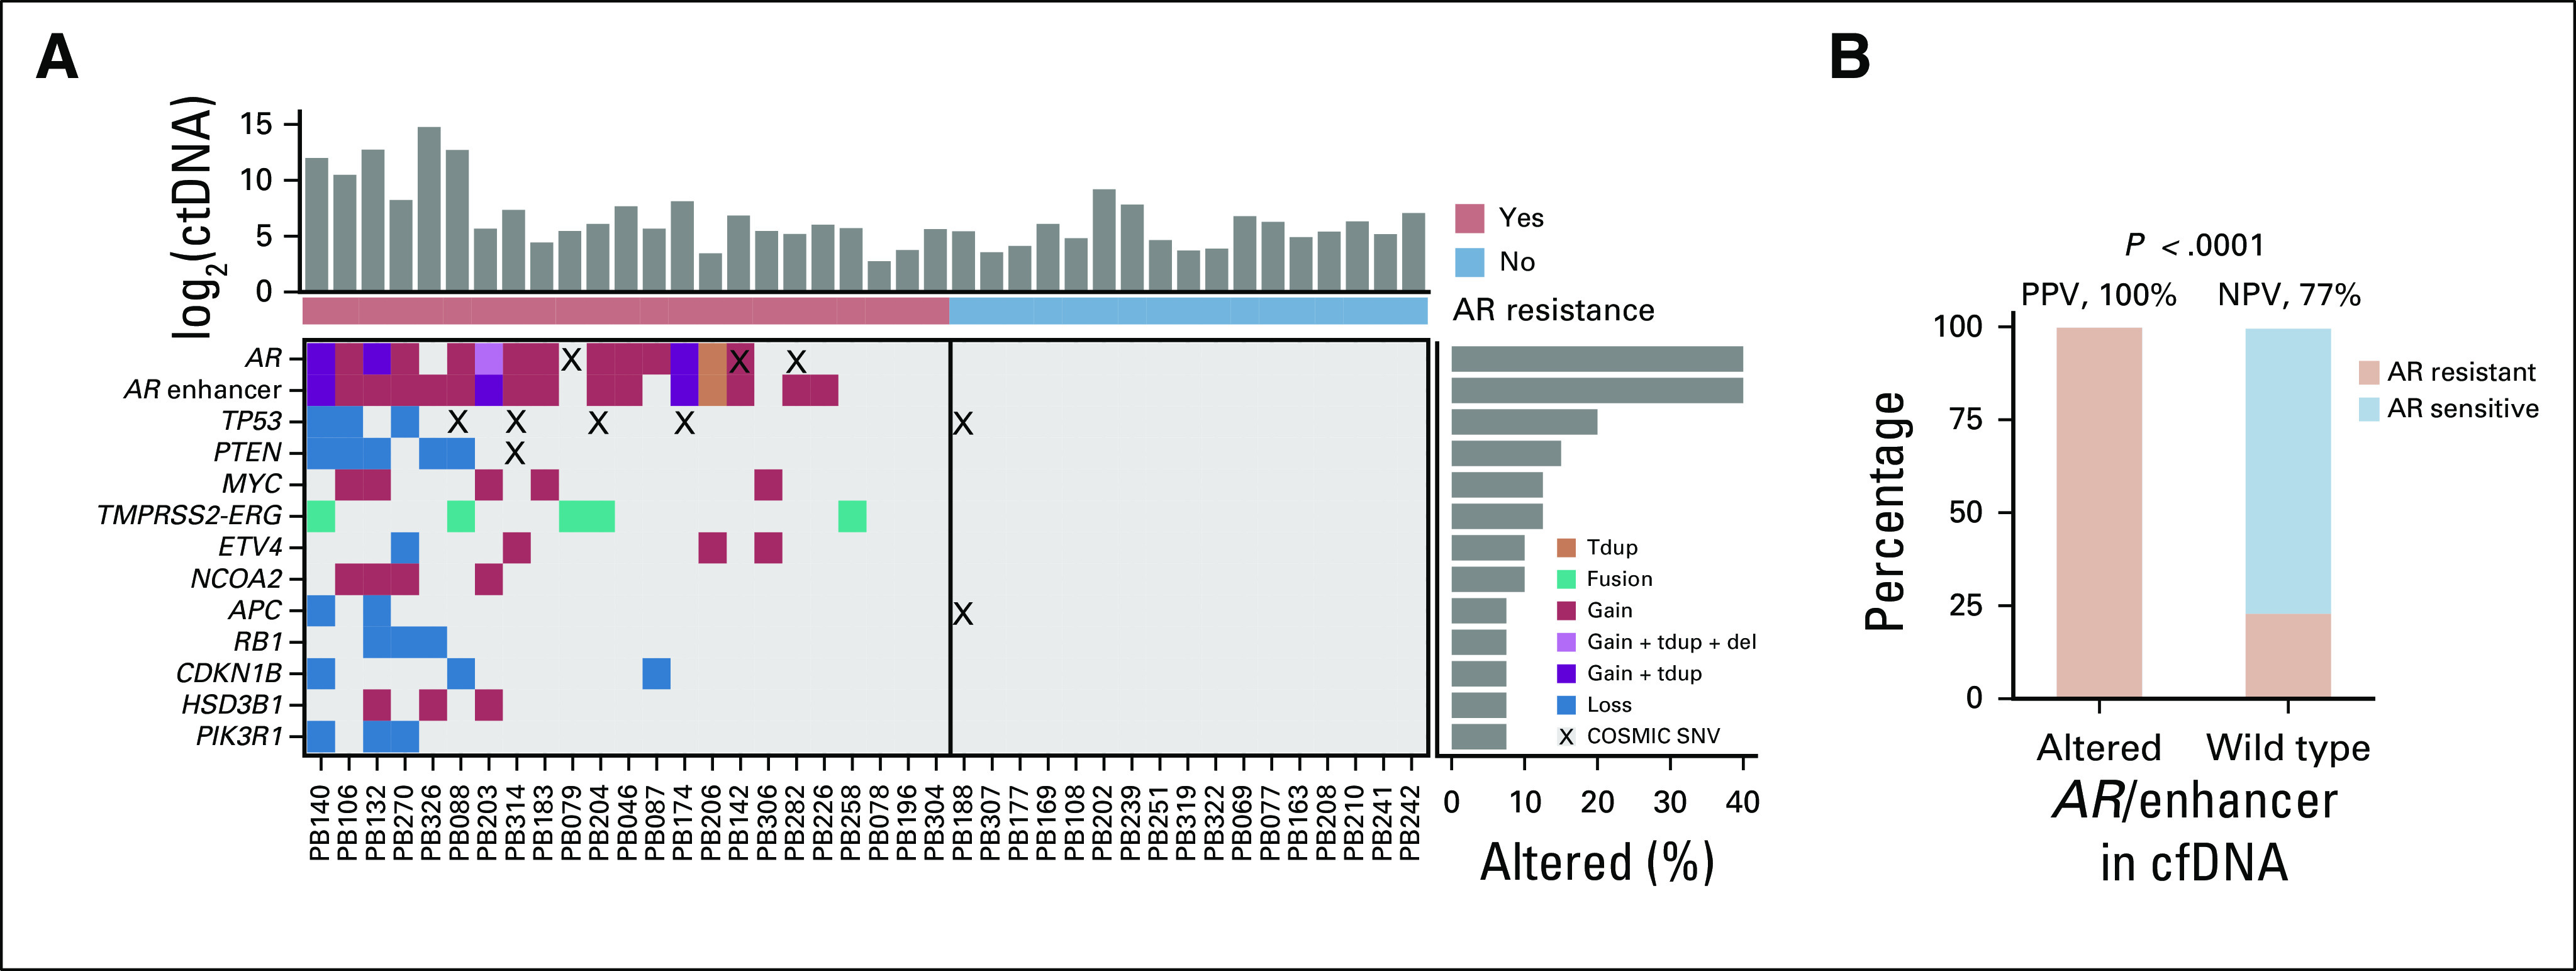
Genomic alterations in plasma cell-free DNA (cfDNA) in metastatic prostate cancer including the androgen receptor (AR)/enhancer locus. (A) Comutation plot based on cfDNA analysis of patients with metastatic prostate cancer treated with AR-directed therapy. Each column represents data from a single patient. Rates of queried genomic alterations are depicted by the bar graphs to the right. Only genes with > 5% alteration rate (considering tandem duplications, fusions, deletions, copy number changes, and Catalog of Somatic Mutations in Cancer [COSMIC]–indexed single-nucleotide variations [SNVs]) are displayed. Circulating tumor DNA (ctDNA) levels in haploid genome equivalents per milliliter of plasma are represented in the bar graph on top in log2 space. Resistance to AR-directed therapy is indicated below the bar graph as red (resistant) versus blue (sensitive). (B) Proportion of patients with AR/enhancer genomically altered (n = 18) or wild type (n = 22) in cfDNA, who developed resistance (n = 23) or not (n = 17) to AR-directed therapy. P value was calculated by Fisher’s exact test. del, deletion; NPV, negative predictive value; PPV, positive predictive value; tdup, tandem duplication.
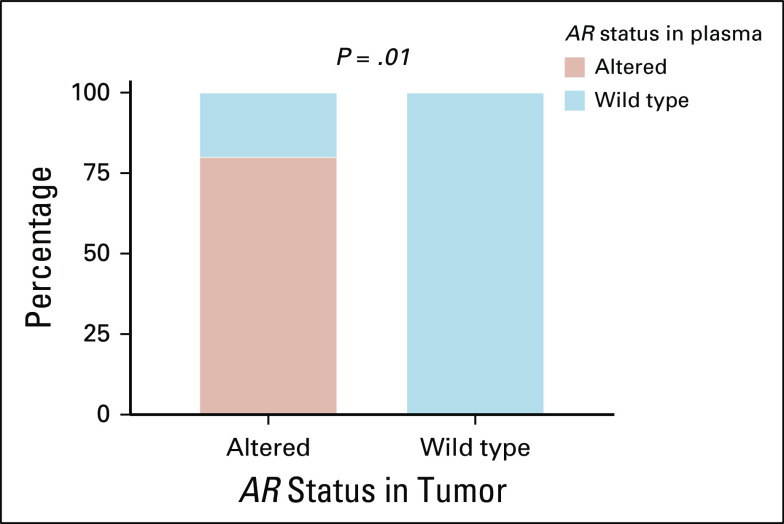
Ten patients consented to additional tissue-based analyses using metastatic biopsy samples. These samples were analyzed by targeted next-generation sequencing using the Tempus sequencing platform, which includes the AR gene body but not the enhancer.23,24 Five patients had evidence of AR gene body alteration in tumor, with 4 of those having the same genomic changes evident in plasma. Overall, genomic alterations in AR were 80% concordant between tissue and plasma (Appendix Fig A2; Appendix Table A11), consistent with work published by others.25
AR/Enhancer Alterations in cfDNA Are Associated With Clinical Resistance
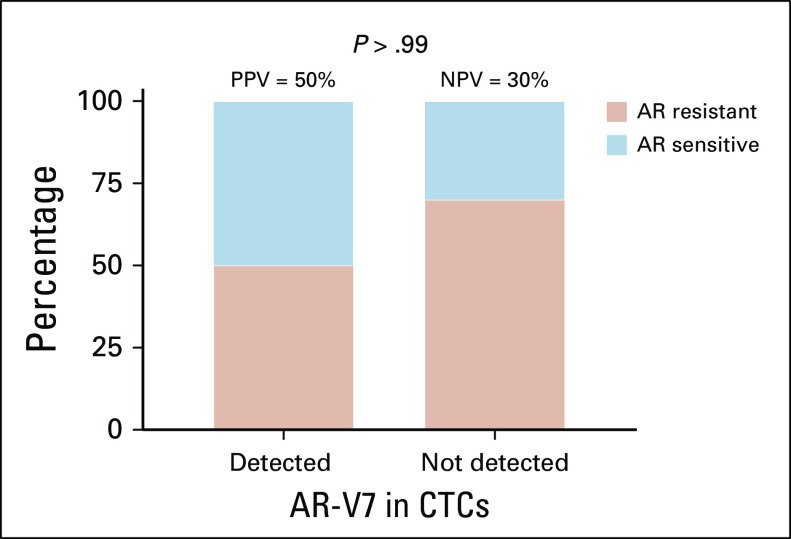
We observed the greatest concordance between genomic events and clinical resistance to AR-directed therapy for alterations in the AR locus including the enhancer (Fig 2). Alterations in the AR/enhancer locus predicted resistance with 78% sensitivity and 100% specificity (Fig 2B). There was a highly significant correlation between alterations detected in AR/enhancer in cfDNA and resistance to AR-directed therapy (P < .0001). Interestingly, all three patients with AR enhancer amplification in cfDNA in the absence of AR gene body amplification had disease progression to resistance at a median of 5.3 months (range, 0.6-8.0 months), indicative of improved sensitivity in identifying resistance when tracking the AR enhancer in addition to the gene body. The AR-V7 Nucleus Detect CTC assay was run at a median of 16 days from cfDNA analysis in 25 patients, including within 24 hours of cfDNA testing for 10 patients. AR-V7 was detected in CTCs from two patients (8%) and was negative in the remaining 23 (Appendix Fig A3; Appendix Table A3).
AR/Enhancer Alterations in cfDNA Portend Poor PFS
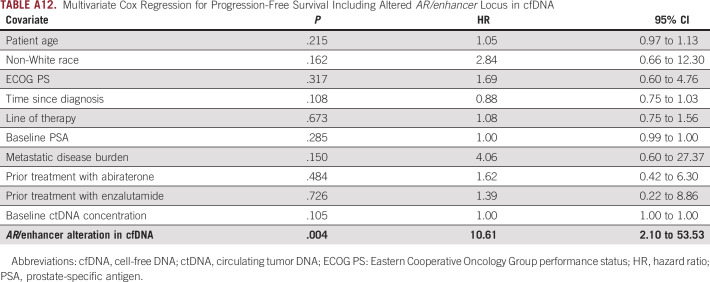
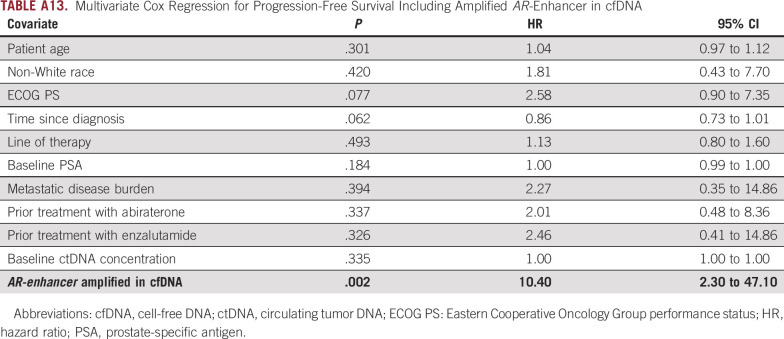
PFS was significantly shorter among men with detected AR/enhancer alterations in plasma cfDNA (18 patients) compared to those without (22 patients; hazard ratio [HR], 6.8; 95% CI, 2.5 to 18.6; P = .0002; Fig 3A). PFS remained significantly shorter with similar HR when restricting our analysis to just the AR enhancer region (HR, 8.1; 95% CI, 2.8 to 23.6; P = .0001; Appendix Fig A4A). cfDNA-detected alterations in the AR/enhancer locus or the AR enhancer alone remained highly significant by multivariate Cox proportional hazards regression, which included important baseline characteristics such as PSA concentration, circulating tumor DNA (ctDNA) level, number of lines of therapy received in the metastatic setting, prior enzalutamide versus abiraterone treatment, metastatic disease burden, and time since diagnosis (Appendix Tables A12-A15). We also found that overall ctDNA levels and mutational burden did not correlate with clinical outcomes, nor were they significantly different between patients who developed AR resistance versus those who remained AR sensitive (Appendix Fig A5; Appendix Table A16).
FIG 3.
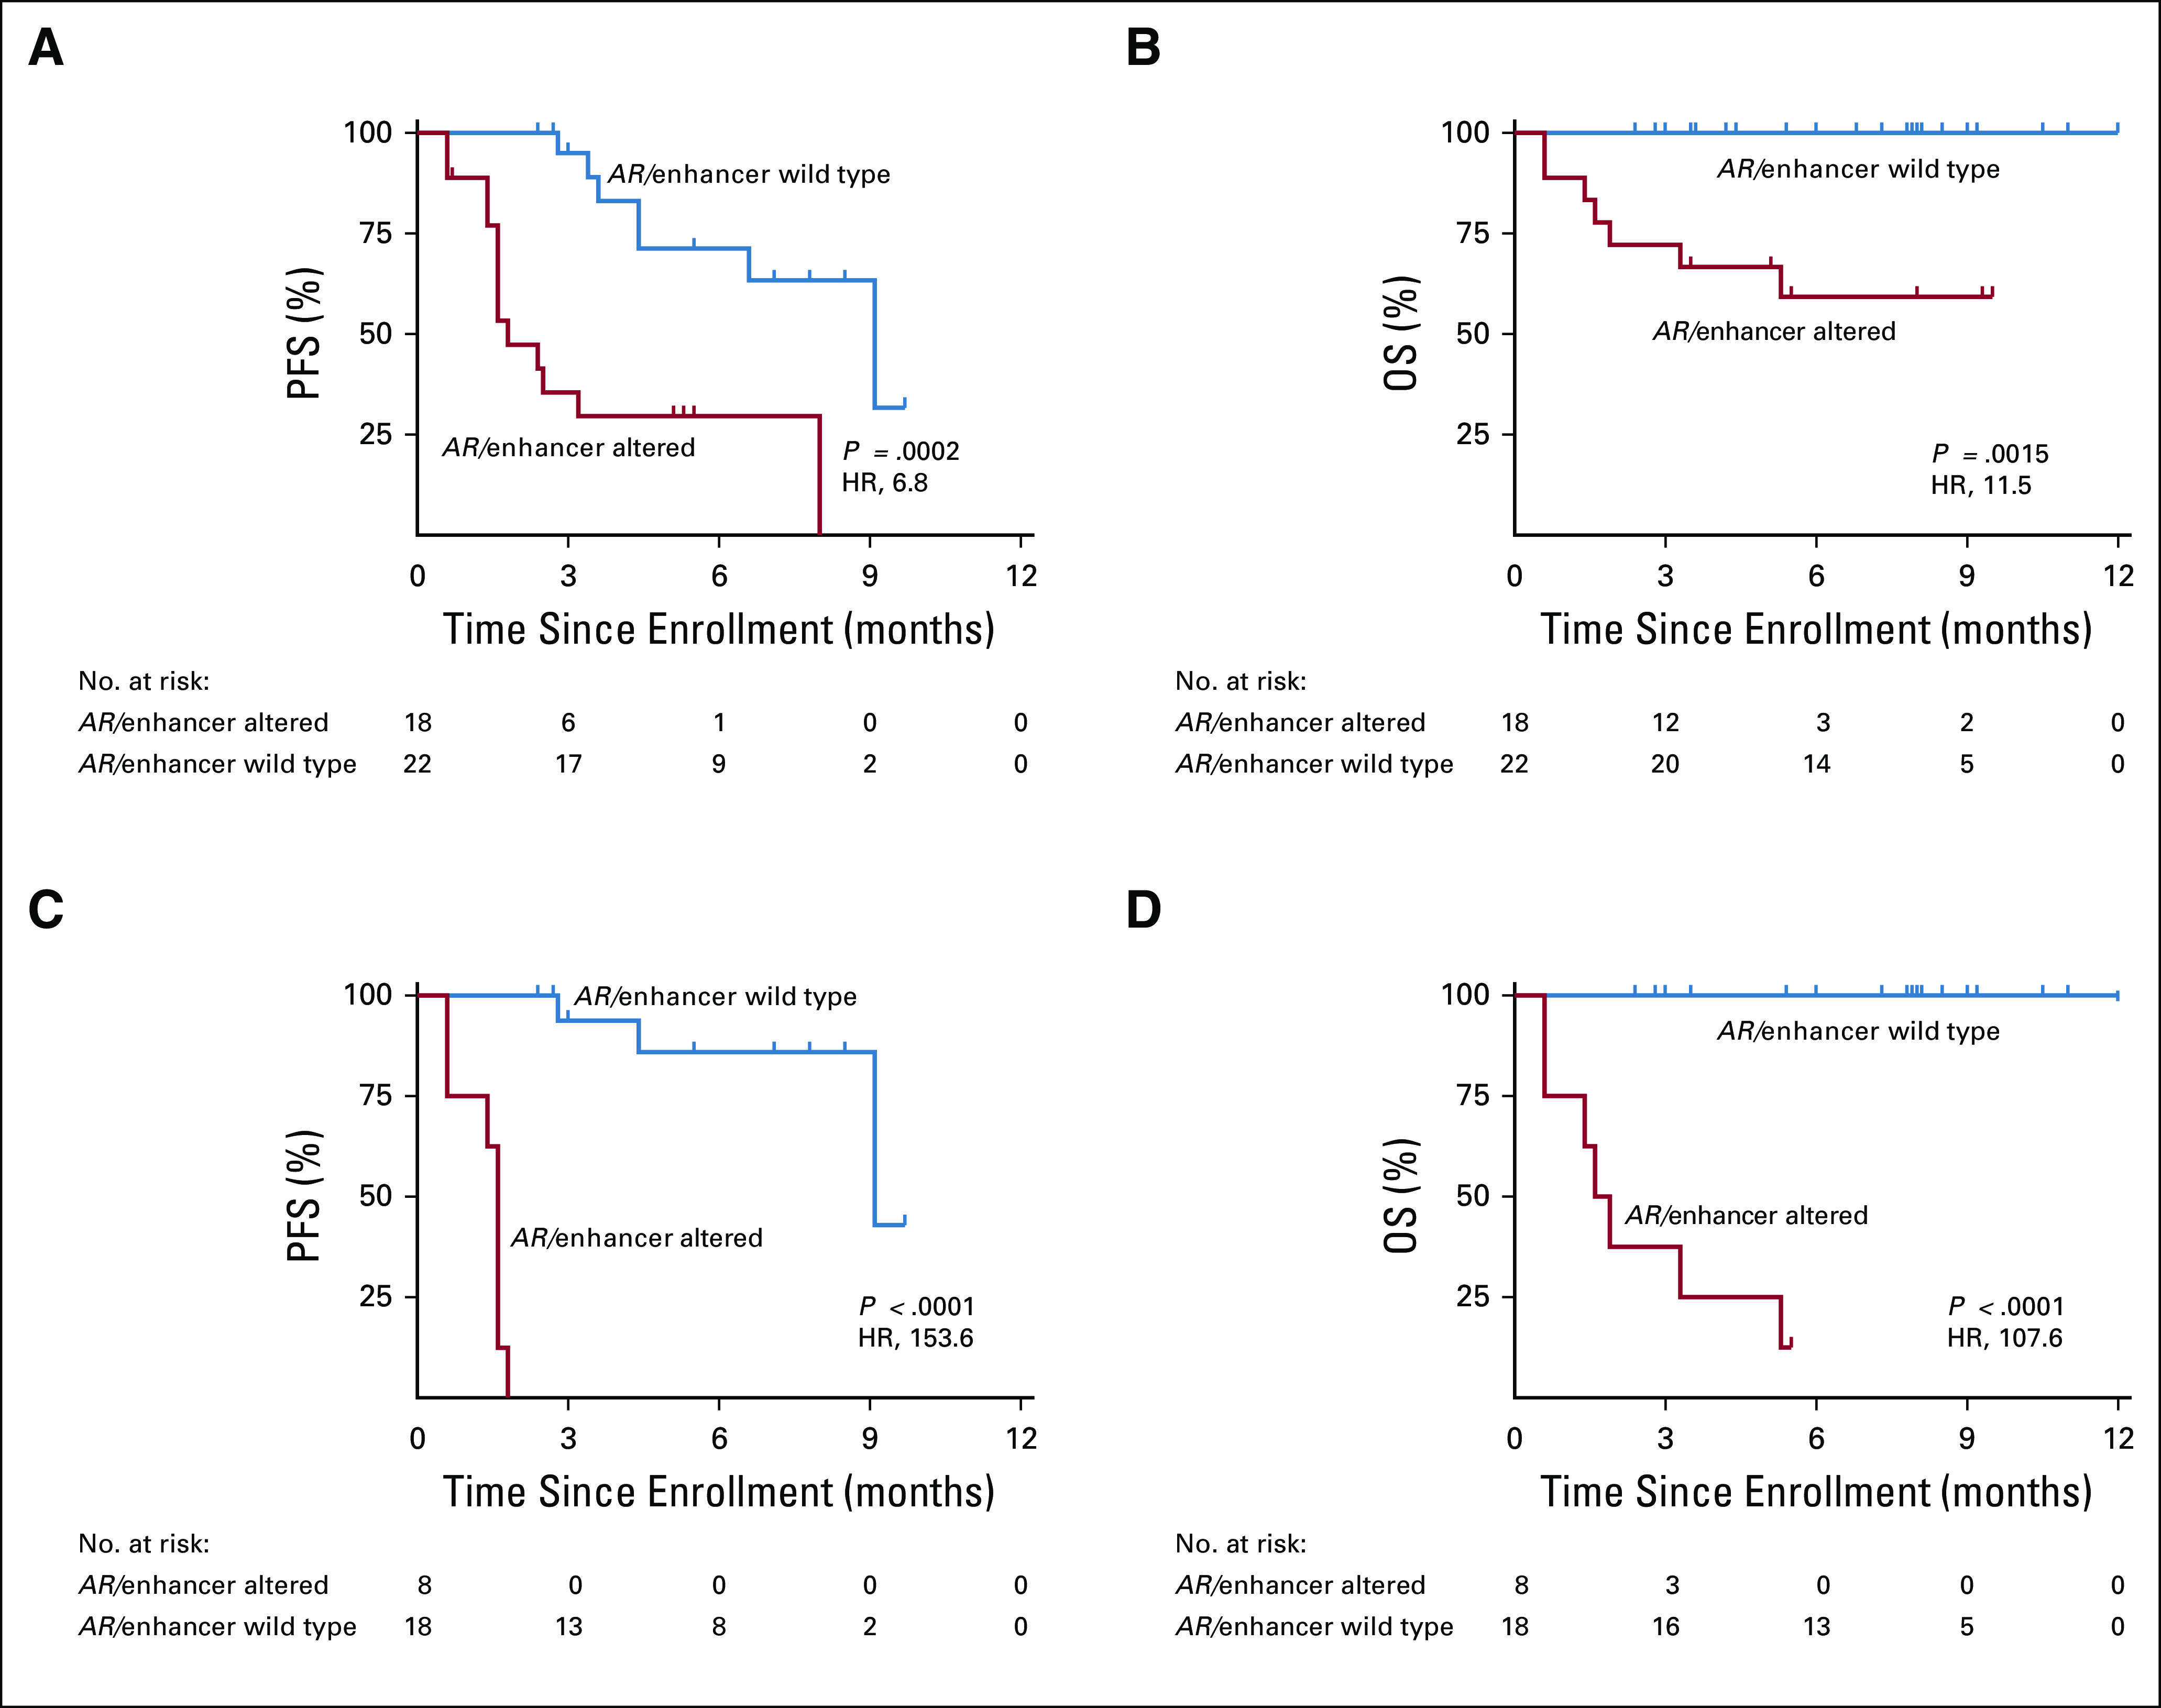
Progression-free survival (PFS) and overall survival (OS) according to androgen receptor (AR)/enhancer alteration status in cell-free DNA (cfDNA). (A) PFS, and (B) OS represent the full 40-patient cohort; (C) PFS, and (D) OS after excluding patients with secondary resistance to AR-directed therapy. Kaplan-Meier analyses were performed from the time of sample collection (time of enrollment), stratified based on the genomic alteration status of AR/enhancer measured in cfDNA. P values were calculated by the log-rank test and hazard ratios (HRs) by the Mantel-Haenszel method.
AR/Enhancer Alterations in cfDNA Portend Poor OS
Although median follow-up of our cohort from time of enrollment was only 6.0 months, we performed a preliminary OS analysis. OS was significantly shorter among men with detected AR/enhancer alterations in plasma cfDNA compared to those without (HR, 11.5; 95% CI, 2.5 to 52.1; P = .0015; Fig 3B). OS remained significantly shorter with a high HR when ignoring AR gene body alterations and restricting our analysis to just the AR enhancer region (HR, 16.4; 95% CI, 3.5 to 77.2; P = .0004; Appendix Fig A4B).
AR/Enhancer Alterations in cfDNA in Primary Versus Secondary Resistance
Our cohort included 9 cases of primary resistance and 14 cases of secondary resistance to AR-directed therapy. In all cases of primary resistance, patients experienced no response, whereas in cases of secondary resistance, patients experienced a temporary treatment response before ultimately experiencing disease progression on AR-directed therapy. Notably, the previously published AR-V7 assay has only been shown to be capable of identifying primary resistance, albeit with limited sensitivity.5,6 We thus decided to test EnhanceAR-Seq more exclusively in this space. Positive predictive value of cfDNA-derived AR/enhancer alterations for primary resistance was 100%, with every positive case progressing within 3 months and all but one patient dying within 6 months of study enrollment (Figs 3C and 3D). The sensitivity of our assay for detecting primary resistance was 89%, higher than the 71% we observed for secondary resistance, whereas specificity remained 100%.
We obtained serial samples from four patients with at least one time point being during AR-directed therapy (Fig 4). For patient PB078 (Fig 4A), EnhanceAR-Seq detected no evidence of AR/enhancer alterations at enrollment, and AR-V7 detection in CTCs was also negative. At 19 and 45 weeks later, EnhanceAR-Seq revealed significantly elevated copy number amplification of both the AR gene body and enhancer, while the patient was actively developing resistance to enzalutamide followed by abiraterone. The CTC AR-V7 assay also became positive at approximately 45 weeks. Patients PB087 and PB203 similarly showed rapid increases in AR/enhancer copy number on enzalutamide and abiraterone, respectively, while AR-V7 testing remained negative (Figs 4B and 4C). Cell-free AR/enhancer amplification preceded increases in PSA and clinician-recognized resistance leading to therapy change. For patient PB140 (Fig 4D), AR/enhancer copy number increased more subtly on serial analysis; however, in this case the baseline copy numbers for AR and its enhancer were already > 8-fold elevated; reflective of this, the patient’s disease progressed rapidly 6 weeks after study enrollment, and the patient died as a result of mCRPC at 22 weeks. These vignettes demonstrate the potential value of using cfDNA-based AR/enhancer analysis as a precision modality to monitor treatment resistance in patients with metastatic prostate cancer undergoing AR-directed therapy.
FIG 4.
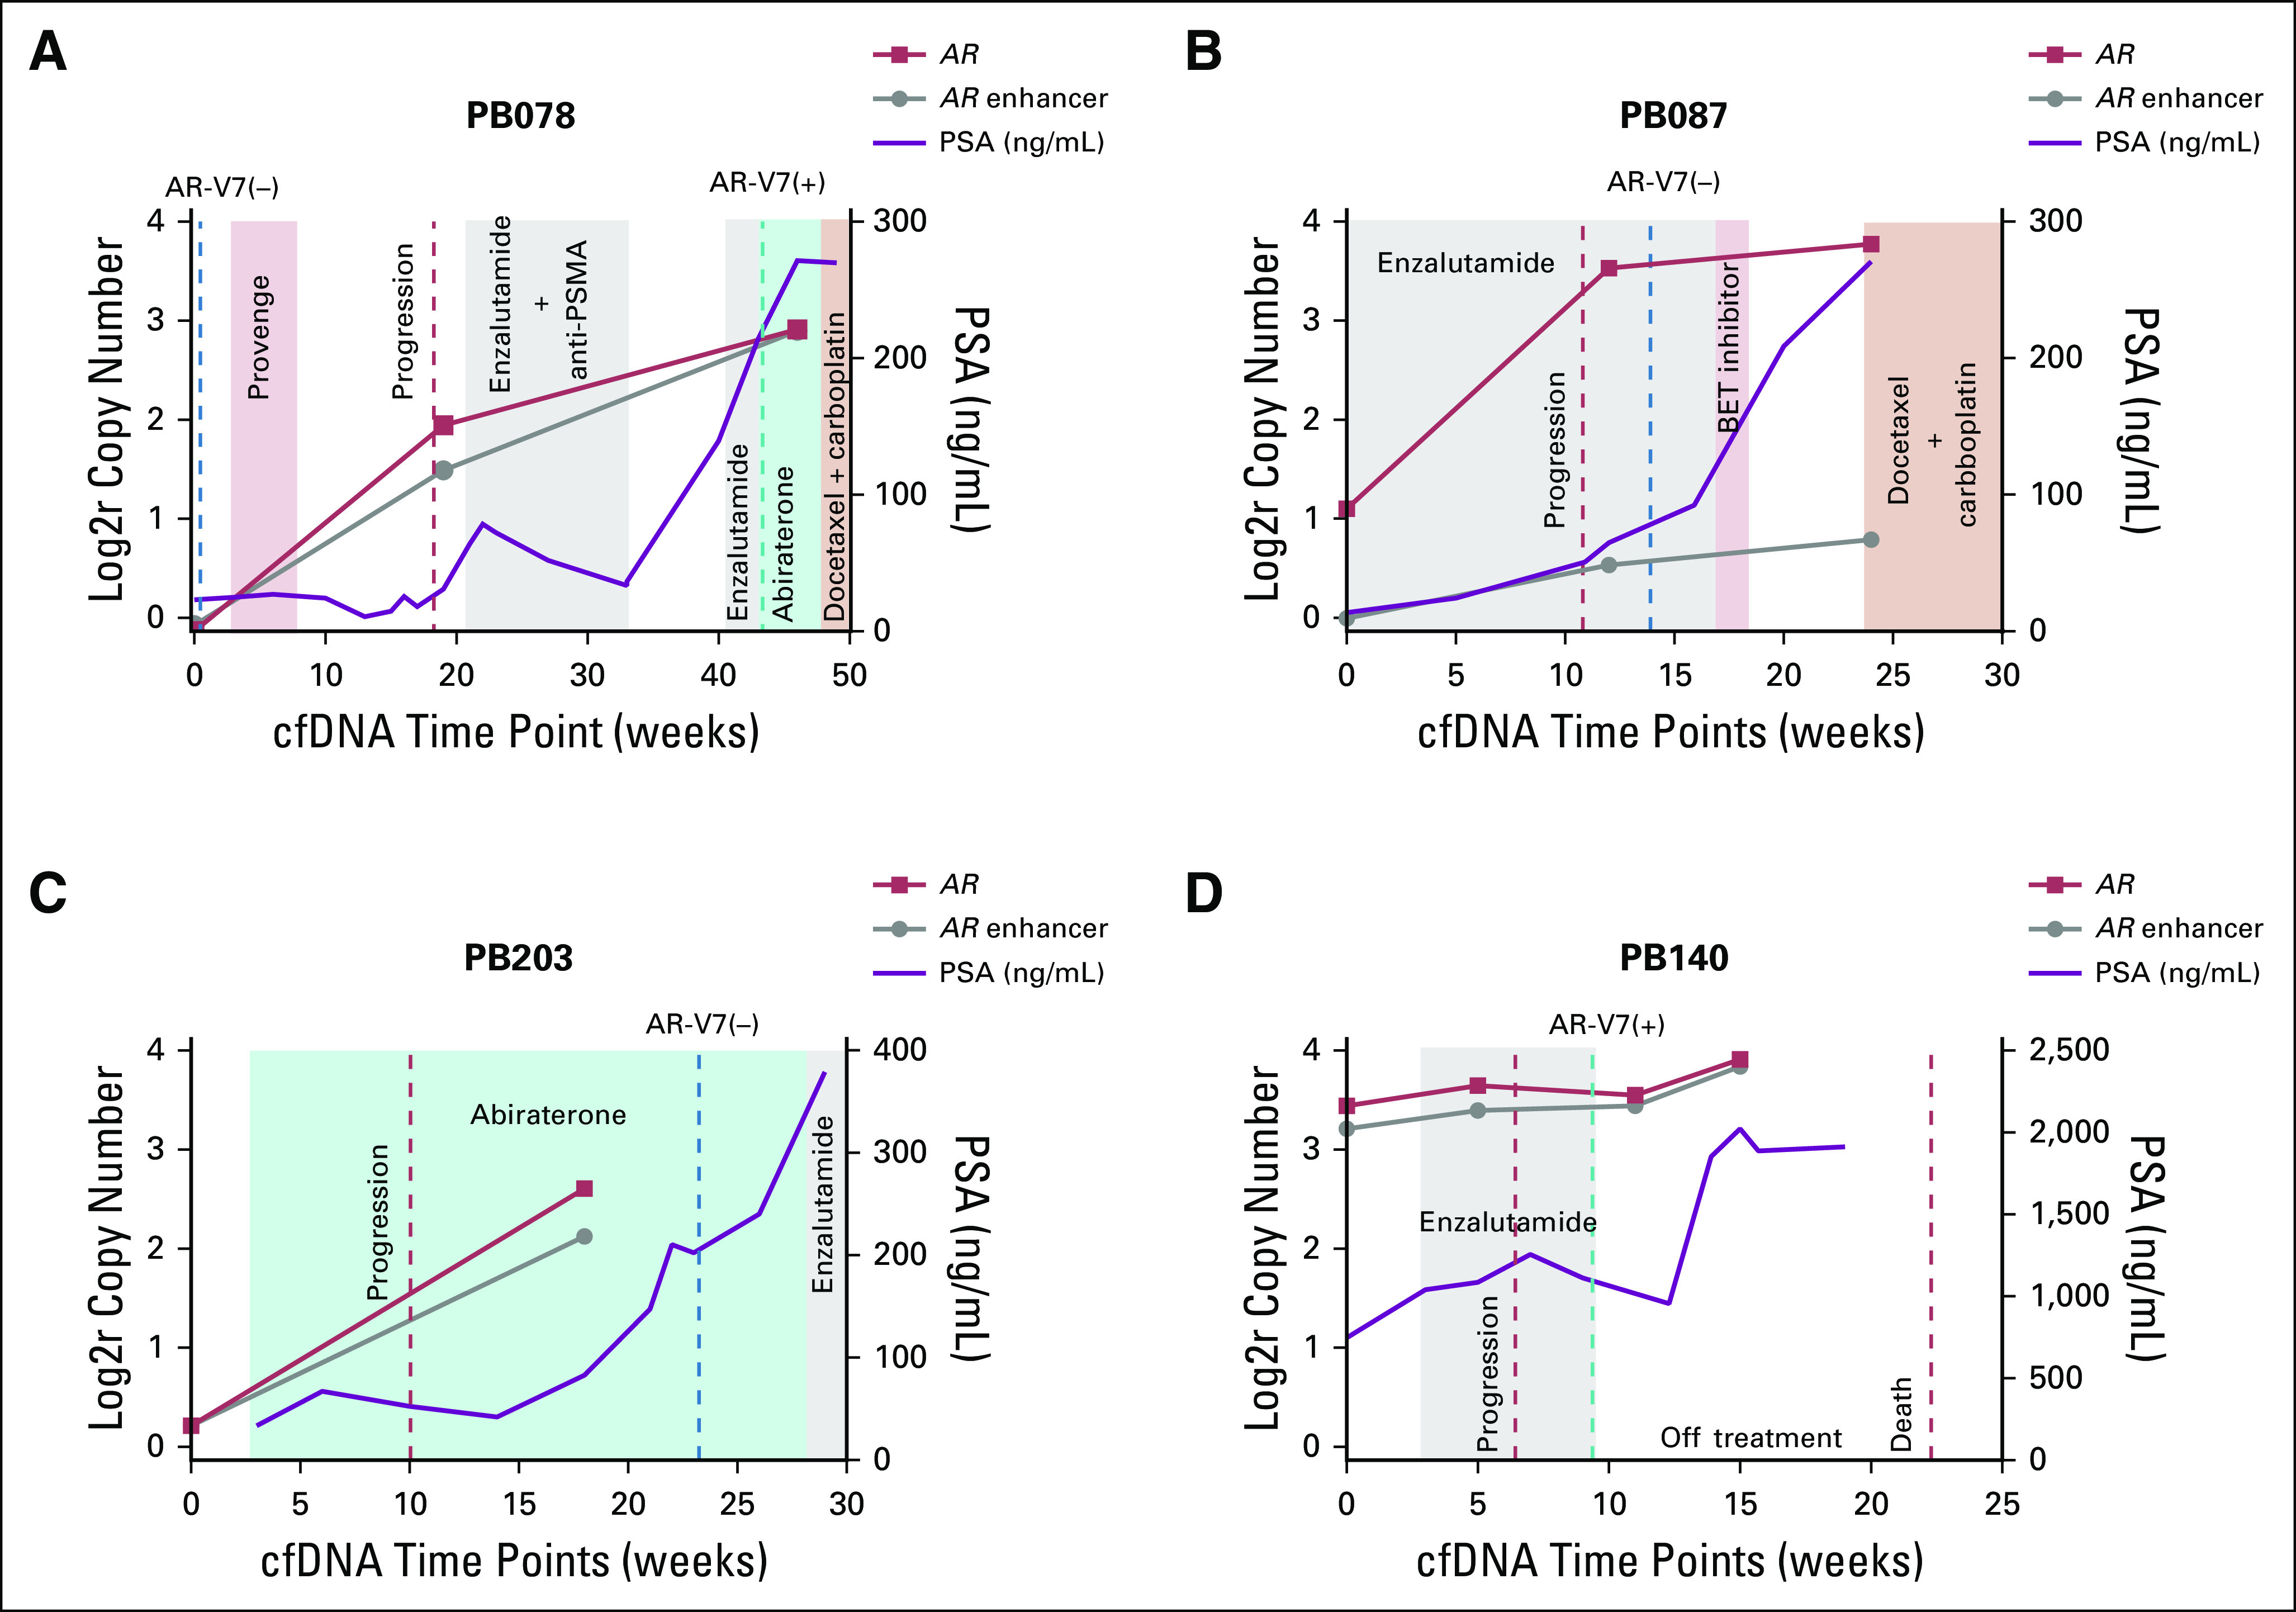
Serial time point liquid biopsy analyses of patients on androgen receptor (AR)-directed treatment. (A) The patient was negative for circulating tumor cell (CTC) AR-V7 and cell-free DNA (cfDNA) AR/enhancer alteration at the time of enrollment. At week 19, shortly before receiving enzalutamide and anti–prostate-specific membrane antigen (PSMA), he tested positive for amplifications in AR and its enhancer in cfDNA. The patient initially responded, then after a treatment break experienced rapid progression on both enzalutamide and abiraterone. Repeat testing at this final time point (approximately 45 weeks postenrollment) was positive, with additional amplification observed in AR and its enhancer in cfDNA and AR-V7 detected in CTCs. (B-D) Clinical vignettes of three more patients with metastatic castration-resistant prostate cancer (mCRPC) with serial cfDNA collected over time, with at least 1 time point occurring during AR-directed therapy. AR and AR enhancer copy number ratios in cfDNA are shown over time in log2 space, and prostate-specific antigen (PSA) concentrations in blood are shown in ng/mL. Treatments are indicated in colored boxes, time of progression or death as dashed red lines, and AR-V7 test results as dashed green lines (if positive) or dashed blue lines (if negative). Weeks since study enrollment are shown on the x-axis. BET, bromodomain and extraterminal domain; Log2r, logarithm base 2 ratio.
DISCUSSION
In this study, we developed and tested a cfDNA analysis method for assessing treatment resistance in metastatic prostate cancer, which we call EnhanceAR-Seq. Our results indicate that cfDNA analysis is a promising approach for detecting resistance to AR-directed therapy, with 100% positive predictive value and 78% sensitivity. Sensitivity increased to 89% when considering only primary-resistant cases. EnhanceAR-Seq outperformed the CTC AR-V7 test used clinically, which was performed for a subset of patients in our study. In available cases, we also performed tumor sequencing and observed 80% concordance between AR genomic alterations in tumor and plasma.
We also factored in baseline ctDNA level in multivariate Cox regression analyses to determine if it might be a confounding variable, which we found did not correlate with clinical outcomes and was not significantly different between AR-resistant and AR-sensitive patients. Although other baseline differences between patients could have influenced our study’s outcomes, we accounted for them through four separate multivariate Cox regression analyses (Appendix Tables A12-A15), where we found that only AR/enhancer alterations, including in the AR enhancer alone, were highly significantly associated with resistance to AR-directed therapy (HR > 10; P < .005).
Within our cohort, every patient with detectable alterations in AR or its enhancer in cfDNA developed resistance and experienced progression despite a relatively short follow-up period. AR/enhancer alterations were associated with statistically significantly worse PFS and OS. In contrast, the Genomic Health (Redwood City, CA) CTC AR-V7 assay was positive in only 8% of tested cases and did not correlate significantly with outcomes. It is important to note, however, that larger studies have shown correlations of CTC AR-V7 detection with outcomes,5,6,8 which may not have been evident here because of small cohort size, heterogeneous nature of our cohort, and CTC AR-V7 testing being performed in only 63% of our cohort. Still, the 8% positivity rate for the Genomic Health CTC AR-V7 assay in our cohort is similar to the 10% positivity rate of this assay in high-risk patients with mCRPC in the recently published PROPHECY trial,26 suggesting our results may be in line with other prospective data.
Five cases of resistance to AR-directed treatment were not detected using our cfDNA assay. However, four of these represent secondary resistance to AR-directed therapy, where patients initially responded to treatment before eventually developing resistance. In this regard, we performed a serial time point analysis in a patient (PB078), where both EnhanceAR-Seq and CTC AR-V7 were negative at the initial responsive time point, but both assays became positive as the patient evolved resistance to enzalutamide followed by abiraterone. Serial time point analysis of two other patients without significant AR/enhancer amplification at baseline (PB087 and PB203), including one who received abiraterone followed by enzalutamide, also demonstrated dramatically increasing AR/enhancer copy numbers over time, which anticipated clinical progression and increasing PSA during AR-directed treatment. In contrast, a fourth case (PB140) of primary resistance demonstrated > 8-fold amplification of AR and its enhancer at baseline, which remained highly elevated on serial analysis. This correlated with rapid early progression on enzalutamide and death from mCRPC at 22 weeks. These data support the potential value of serial time point analysis, especially in the secondary resistance setting where AR/enhancer amplification may not be apparent at baseline. These clinical vignettes also suggest that our assay could potentially inform clinicians when to trial a different AR-directed treatment (when AR/enhancer copy numbers remain low) or switch to a different therapy type altogether (when AR/enhancer copy numbers have risen high).
Resistant patients identified by AR/enhancer alterations may be completely distinct from those with AR-V7 messenger RNA splice variation.27 Given assessment of different mechanisms of resistance, one at the DNA level (detected by EnhanceAR-Seq) and the other at the mRNA/protein level26 (detected by CTC-based assays), it may be valuable to run both methods to more comprehensively assess multiple mechanisms of resistance in certain cases. In our cohort, CTC AR-V7 results did not improve on the sensitivity achieved with EnhanceAR-Seq; however, we note that AR-V7 testing was performed in only a subset of our patients.
To our knowledge, our assay is the first to monitor the AR enhancer in the cell-free compartment. In addition to showing that AR enhancer amplification can be detected in plasma cfDNA from patients with metastatic prostate cancer, we observed that 13% of resistant patients had AR enhancer amplification detectable in plasma cfDNA independent of gene body amplification. Although our cohort is small, the prevalence of independent AR enhancer amplification is consistent with prior studies.18,20 Highlighting its clinical importance, AR enhancer amplification stratified patients by both resistance to AR-directed therapy and survival outcomes. All patients with independent AR enhancer amplification progressed to treatment resistance at a median of 5.3 months, highlighting the importance of monitoring the AR enhancer in addition to the gene body.
In addition to genomic alterations in AR and its enhancer, we assessed 84 other genes shown to be important in mCRPC.9,18 In several cases, we observed multiple alterations involving different genes, including TP53 and PTEN, consistent with prior work.18 We also targeted a 13kb fusion hotspot in the TMPRSS2 intronic region, on the basis of analysis of previously published whole-genome sequencing data in mCRPC.18 This enabled us to identify a subset of TMPRSS2-ERG fusion events in our cohort. To monitor TMPRSS2-ERG fusions more comprehensively, we would have needed to target full lengths of TMPRSS2 and ERG gene bodies and introns, which would have required a much larger targeted space and limited our sequencing depth of coverage.
Limitations of our study include a short follow-up period, reducing our ability to assess long-term clinical outcomes such as PFS and OS. Despite this, hazard ratios for survival outcomes were high on Kaplan-Meier analysis. It is possible that with longer follow-up time, we would observe an even greater predictive and prognostic value of measuring AR/enhancer alterations in cfDNA. In addition, patients were enrolled while on different lines of therapy, leading to cohort heterogeneity, similar to clinical studies involving the CTC AR-V7 assay.5,6,8 CTC AR-V7 testing was performed on only a subset of patients, which could have biased our ability to compare it to cfDNA analysis.
In conclusion, we developed a novel cfDNA assay, EnhanceAR-Seq, to detect genomic alterations in the AR locus including the enhancer. Our method effectively detected resistance to AR-directed therapy and stratified patients on the basis of PFS and OS despite short follow-up time. Assay performance improved further when considering only primary-resistant disease. Our results remained highly significant when accounting for baseline characteristics such as PSA concentration, ctDNA level, and metastatic disease burden. Serial time point analysis in four patients demonstrated the potential value of using our assay to monitor for AR resistance during treatment. Although our cohort was relatively small, EnhanceAR-Seq applied to a single time point predicted resistance to AR-directed therapy with high sensitivity and specificity. Our results suggest that cfDNA analysis through EnhanceAR-Seq can help improve risk stratification and clinical decision making for metastatic prostate cancer. Future clinical trials should be performed to validate our findings before clinical implementation.
ACKNOWLEDGMENT
We thank the patients and their families for study participation. We also thank Timothy Ley, MD, for providing critical feedback on the manuscript.
Appendix
Study Design
Our study was designed to determine whether assessment of genomic alterations in the AR enhancer and gene body (collectively referred to as AR/enhancer) in cell-free DNA (cfDNA) could predict resistance to AR-directed systemic therapy. The sample size of 40 was justified to achieve 90% power by a 2-sided normal test at a 5% α to detect a difference of 75% versus 25% rate of resistance for patients with positive versus negative cfDNA results, assuming a 50% rate of AR/enhancer alteration in cfDNA15 and a 5% attrition rate. We obtained peripheral blood at the time of enrollment, which was processed within 6 hours of phlebotomy for cfDNA analysis. A separate blood sample was submitted for circulating tumor cell (CTC) AR-V7 analysis (Genomic Health) in a subset of patients at the discretion of the treating oncologist. Laboratory research investigators were unaware of the AR-V7 status of study participants at the time of cfDNA analysis. For 4 patients, blood was drawn serially for cfDNA analysis with time points being at least 2 weeks apart and at least 1 time point occurring during AR-directed treatment.
Specimen Collection and Processing
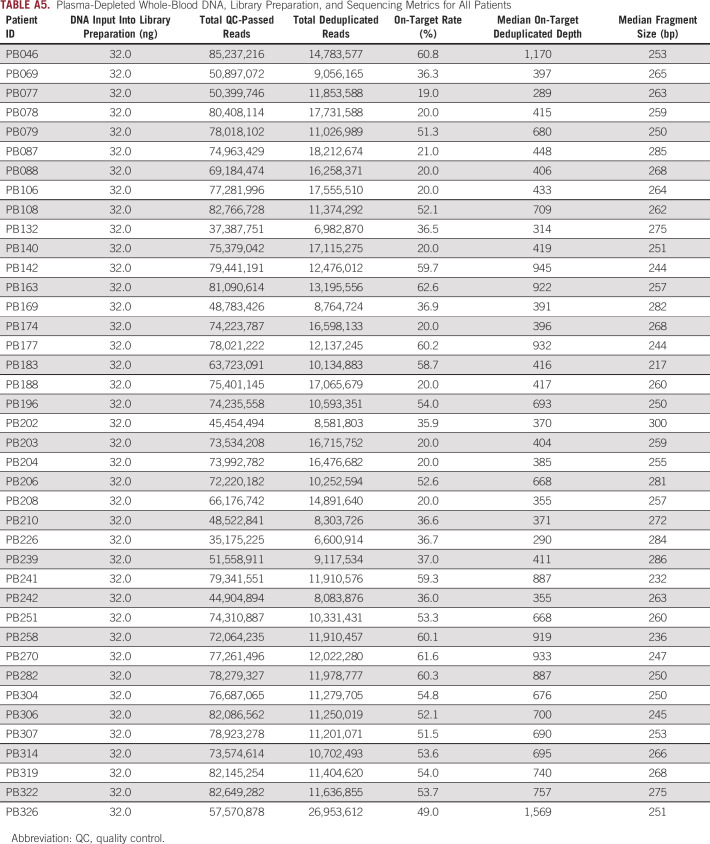
Between 10 and 20 mL of peripheral blood was collected in K2EDTA Vacutainer tubes (Becton Dickinson, Franklin Lakes, NJ) at the time of study enrollment. Tubes were centrifuged at 1,200g for 10 minutes, then plasma separated and centrifuged for another 5 minutes at 1,800g. Plasma was then frozen at −80°C before cfDNA processing and analysis. Leukocyte-enriched plasma-depleted whole blood (PDWB) was also collected and frozen at −80°C for isolation of germline genomic DNA as previously described.14,17 Peripheral blood was separately collected in a subset of patients using collection tubes provided by Genomic Health (Redwood City, CA) for the Oncotype DX AR-V7 Nucleus Detect CTC assay. After collection, tubes were immediately sent to Genomic Health for analysis following their protocol.
DNA Isolation and Quantification
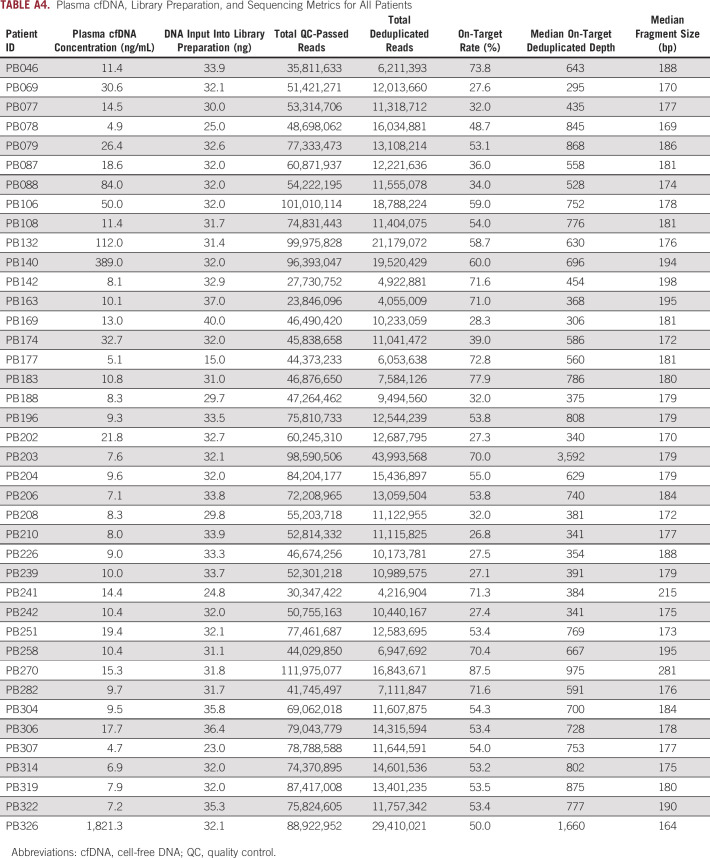
cfDNA was extracted from plasma using the QiaAmp Circulating Nucleic Acid Kit (Qiagen, Venlo, the Netherlands) according to the manufacturer’s instructions. cfDNA concentration was measured with a Qubit 4.0 Fluorometer using the dsDNA High Sensitivity Assay Kit (Thermo Fischer Scientific, Waltham, MA). cfDNA fragment size was determined using an Agilent 2100 Bioanalyzer with the High Sensitivity DNA Kit (Agilent Technologies, Santa Clara, CA). A median of 32 ng was inputted into sequencing library preparation on the basis of the percentage of cfDNA in the 70-450 bp region of the bioanalyzer electropherogram. The QIAamp DNA Micro Kit (Qiagen) was used to extract genomic DNA from 100 μL of PDWB. Genomic DNA from PDWB was fragmented before library preparation using an LE220 focused ultrasonicator (Covaris, Woburn, MA).
Development of EnhanceAR-Seq Gene Panel
To develop a next-generation sequencing (NGS) assay for metastatic prostate cancer cfDNA analysis, we designed a hybrid-capture gene panel to target the complete AR gene body (including introns), 30 kb of the AR enhancer, and exons of 84 other genes that have been shown to harbor genomic alterations in metastatic castration-resistant prostate cancer (mCRPC).9,18 To gain finer detail for copy number analysis in the full AR/enhancer locus, we evenly placed 500-bp targeted regions (50 kb apart) between ∼500 kb upstream of the AR enhancer and ∼500 kb downstream of the AR gene body. Our panel also included the TMPRSS2-ERG gene fusion hotspot intronic region (13 kb) in the TMPRSS2 gene to detect a subset of TMPRSS2-ERG gene fusions. In addition, 12 genes least frequently affected by copy number alteration in mCRPC (surveyed in prior whole-genome sequencing data18) were included in the panel as controls for copy number analysis, and three genes were included to assess clonal hematopoiesis (Genovese G, et al: N Engl J Med 371:2477-2487, 2014; Jaiswal S, et al: N Engl J Med 371:2488-2498, 2014). NimbleDesign was used to convert our desired gene panel into a SeqCap EZ Prime Choice probe set (Roche, Basel, Switzerland).
DNA Processing and Analysis
We performed cfDNA and PDWB DNA library preparation using the Cancer Personalized Profiling by deep Sequencing (CAPP-Seq) workflow14 with duplex barcoded adapters,17 then performed NGS on an Illumina HiSeq4000 with 2 × 150 bp paired-end reads, with 12 samples sequenced per lane, dedicating approximately 60 million reads per sample. We then applied a custom bioinformatics pipeline detailed in the sections below.
cfDNA Single-Nucleotide Variant and Indel Analysis
cfDNA sequencing results were analyzed for single-nucleotide variants (SNVs) and insertions/deletions (indels) using the CAPP-Seq bioinformatic pipeline.10,14,17 Briefly, cfDNA sequencing reads were demultiplexed using sample-level index barcodes, mapped to the human reference genome, filtered for properly paired reads, filtered for bases with Phred quality score ≥ 30, then deduplicated using unique molecular identifiers. Background polishing using 12 healthy donor plasma samples was performed to reduce stereotypical base substitution errors as previously described using the integrated digital error suppression method.17 Variant calling using the CAPP-Seq pipeline was then performed to call SNVs and indels from patient plasma using matched PDWB as the background reference, filtered further to remove potential single-nucleotide polymorphisms with variant allele fraction (vAF) > 45%, loci with deduplicated depth < 100, and mutations in the canonical clonal hematopoiesis genes ASXL1, DNMT3A, and TET2 (Genovese G, et al: N Engl J Med 371:2477-2487, 2014; Jaiswal S, et al: N Engl J Med 371:2488-2498, 2014). Nonsynonymous SNVs and indels ≥ 2 bp in plasma, not present in matched PDWB, not present in the Genome Aggregation Database (gnomAD; Karczewski KJ, et al: bioRxiv 531210, 2019) at a > 0.0001 frequency, and indexed in the Catalogue of Somatic Mutations in Cancer (COSMIC)22 were reported in the final data set shown in Figure 2 and Appendix Table A10. Mutations in AR that met these criteria were considered positive by EnhanceAR-Seq. An additional SNV analysis using the filters described above but not requiring COSMIC indexing was performed to measure overall circulating tumor DNA (ctDNA) SNV burden (number of SNVs detected per patient) and levels (on the basis of mean vAF and cfDNA concentration), shown in Appendix Figure A5 and Appendix Table A16.
cfDNA Copy Number Analysis
Cell-free DNA sequencing results were demultiplexed using sample-level index barcodes, mapped to the human reference genome, then deduplicated using Picard (https://github.com/broadinstitute/picard) on the basis of identical start/end coordinates. Copy number analysis was performed based on a read depth approach. First, the genome was binned (larger bins for nontargeted regions and smaller bins for targeted regions) and read depth ratios for bins between plasma cfDNA and matched PDWB control samples were calculated and corrected for biases in GC content, sequence repeats, and target density using CNVkit (Talevich E, et al: PLOS Comput Biol 12:e1004873, 2016).
Subsequently, read depth ratios were centralized by subtracting the mean log2 ratios of all bins across chromosomes and normalized using read depth ratios from bins overlapping with copy number control genes. Copy number segmentation was performed using DNACopy (Seshan VE, et al: R package version 1.60.0, 2019). To obtain the background read depth ratios for individual genes/loci, we performed the same analysis on 24 pairs of plasma and matched PDWB control DNA samples from male healthy donors. Finally, a gain (or loss) event in patient plasma was called when the calculated log2 ratio was four standard deviations above (or below) the median log2 ratio of that locus in healthy plasma. Genes whose log2 ratios showed high variability or deviation from 0 in healthy plasma samples (median > 0.2 or standard deviation > 0.2) were excluded from the copy number analysis.
cfDNA Structural Variation Analysis
Our targeted panel was designed to capture structural variation (SV) breakpoints targeting full-length AR (including intronic regions) and the TMPRSS2-ERG fusion hotspot in an intron of TMPRSS2. SVs including tandem duplications were called using Lumpy (Layer RM, et al: Genome Biol 15:R84, 2014) and Manta (Chen X, et al: Bioinformatics 32:1220-1222, 2016), using plasma samples with matched PDWB control samples. Subsequently, SVs with breakpoints overlapping the blacklist and low complexity regions (Li H: Bioinformatics 30:2843-2851, 2014) or those with both breakpoints falling in nontargeted regions were removed. Additional filtering was applied to retain only SVs with at least two supporting discordant read pairs or split reads and with high confidence regarding breakpoint positions (on the basis of the width of the confidence interval provided by Manta or Lumpy being < 5 bases) and filtering out SVs with abnormally high read support (> 150 discordant read pairs or split reads) in patient plasma cfDNA.
Tissue Molecular Analysis
For some cases, at the discretion of the treating oncologist, matched formalin-fixed paraffin embedded tumor tissue of a metastatic site was available for molecular analysis. Tissue was submitted to Tempus Laboratories, where DNA was isolated and targeted NGS performed with approximately 500× coverage using one of two panels—Tempus xO (Beaubier N, et al: Oncotarget 9:25826-25832, 2018; 1,714 genes) or Tempus xT (Beaubier N, et al: Oncotarget 10:2384-2396, 2019; 596 genes). Both panels included the AR coding region.
Clinical Outcomes and Statistical Analysis
The primary clinical end point, primary or secondary resistance to AR-directed therapy, was scored by a board-certified academic medical oncologist specializing in genitourinary cancers. Primary resistance was defined as prostate-specific antigen (PSA) progression, change of therapy or death within 4 months of treatment initiation, or radiographic progression within 6 months. Secondary resistance was defined as PSA progression, change of therapy, or radiographic progression or death outside of this time frame. PSA progression was defined as an increase of ≥ 25% above nadir and ≥ 2 ng/mL, with confirmation ≥ 3 weeks later (Prostate Cancer Clinical Trials Working Group 3 [PCWG3]; Scher HI, et al: J Clin Oncol 34:1402-1418, 2016). Secondary end points for our study were progression-free survival (PFS) defined as the time to PSA progression by PCWG3 criteria or death, or last known date of PSA measurement in nonprogressors, and overall survival (OS) defined as time to death or to last follow-up for alive patients. PFS and OS were calculated from the time of study enrollment.
We performed survival and statistical analyses using R version 3 (http://www.rproject.org) and Prism 8 (Graphpad Software, San Diego, CA). Fisher’s exact test was used to assess the significance level of associations between assay results and resistance to AR-directed therapy. For PFS and OS Kaplan-Meier analyses, the log-rank test was used to estimate P values and the Mantel-Haenszel method used to estimate hazard ratios. Multivariate Cox proportional hazards models were fitted with incorporation of important baseline covariates including PSA concentration, ctDNA levels, number of lines of prior therapy, prior abiraterone versus enzalutamide treatment, metastatic disease burden, and time since diagnosis to further assess the independent impact of AR/enhancer alterations detected in cfDNA. Proportional hazards assumptions were confirmed for these analyses by evaluating the Schoenfeld residuals.
FIG A1.
Examples of copy number determination in the androgen receptor (AR) enhancer and gene body from cell-free DNA (cfDNA). Each panel depicts the log2 copy number ratio of the AR locus and surrounding genomic space, from patient cfDNA normalized to matched plasma-depleted whole blood targeted next-generation sequencing. (A) Example of a patient with no copy number alterations in the AR enhancer or gene body. (B) cfDNA from a patient with copy number gain in the AR gene body but not enhancer. (C) Patient with cfDNA amplification of both the AR enhancer and gene body. (D) Patient with cfDNA copy number gain in the AR enhancer but not gene body. CN, copy number; chrX, chromosome X; log2, logarithm base 2; Mb, megabase.
FIG A2.
Comparison of androgen receptor (AR) gene body alterations detected by tumor and plasma cell-free DNA (cfDNA) sequencing. Ten patients had samples available for this analysis. Targeted next-generation sequencing (NGS) was performed on tumor DNA (extracted from formalin-fixed paraffin-embedded tissue) and plasma cfDNA. AR genomic alterations were detected in 5 cases by tumor NGS with these same alterations present in 4 cases by plasma NGS. P value was calculated by the Fisher’s exact test.
FIG A3.
AR-V7 detection in circulating tumor cells (CTCs) and its association with resistance to androgen receptor (AR)–directed therapy in the present cohort. Proportion of patients with AR-V7 detected (n = 2) or not (n = 23) in circulating tumor cells who developed resistance or not to AR-directed therapy are shown. The positive predictive value (PPV) and negative predictive value (NPV) are displayed in each panel. P values were calculated using Fisher’s exact test. AR, androgen receptor.
FIG A4.
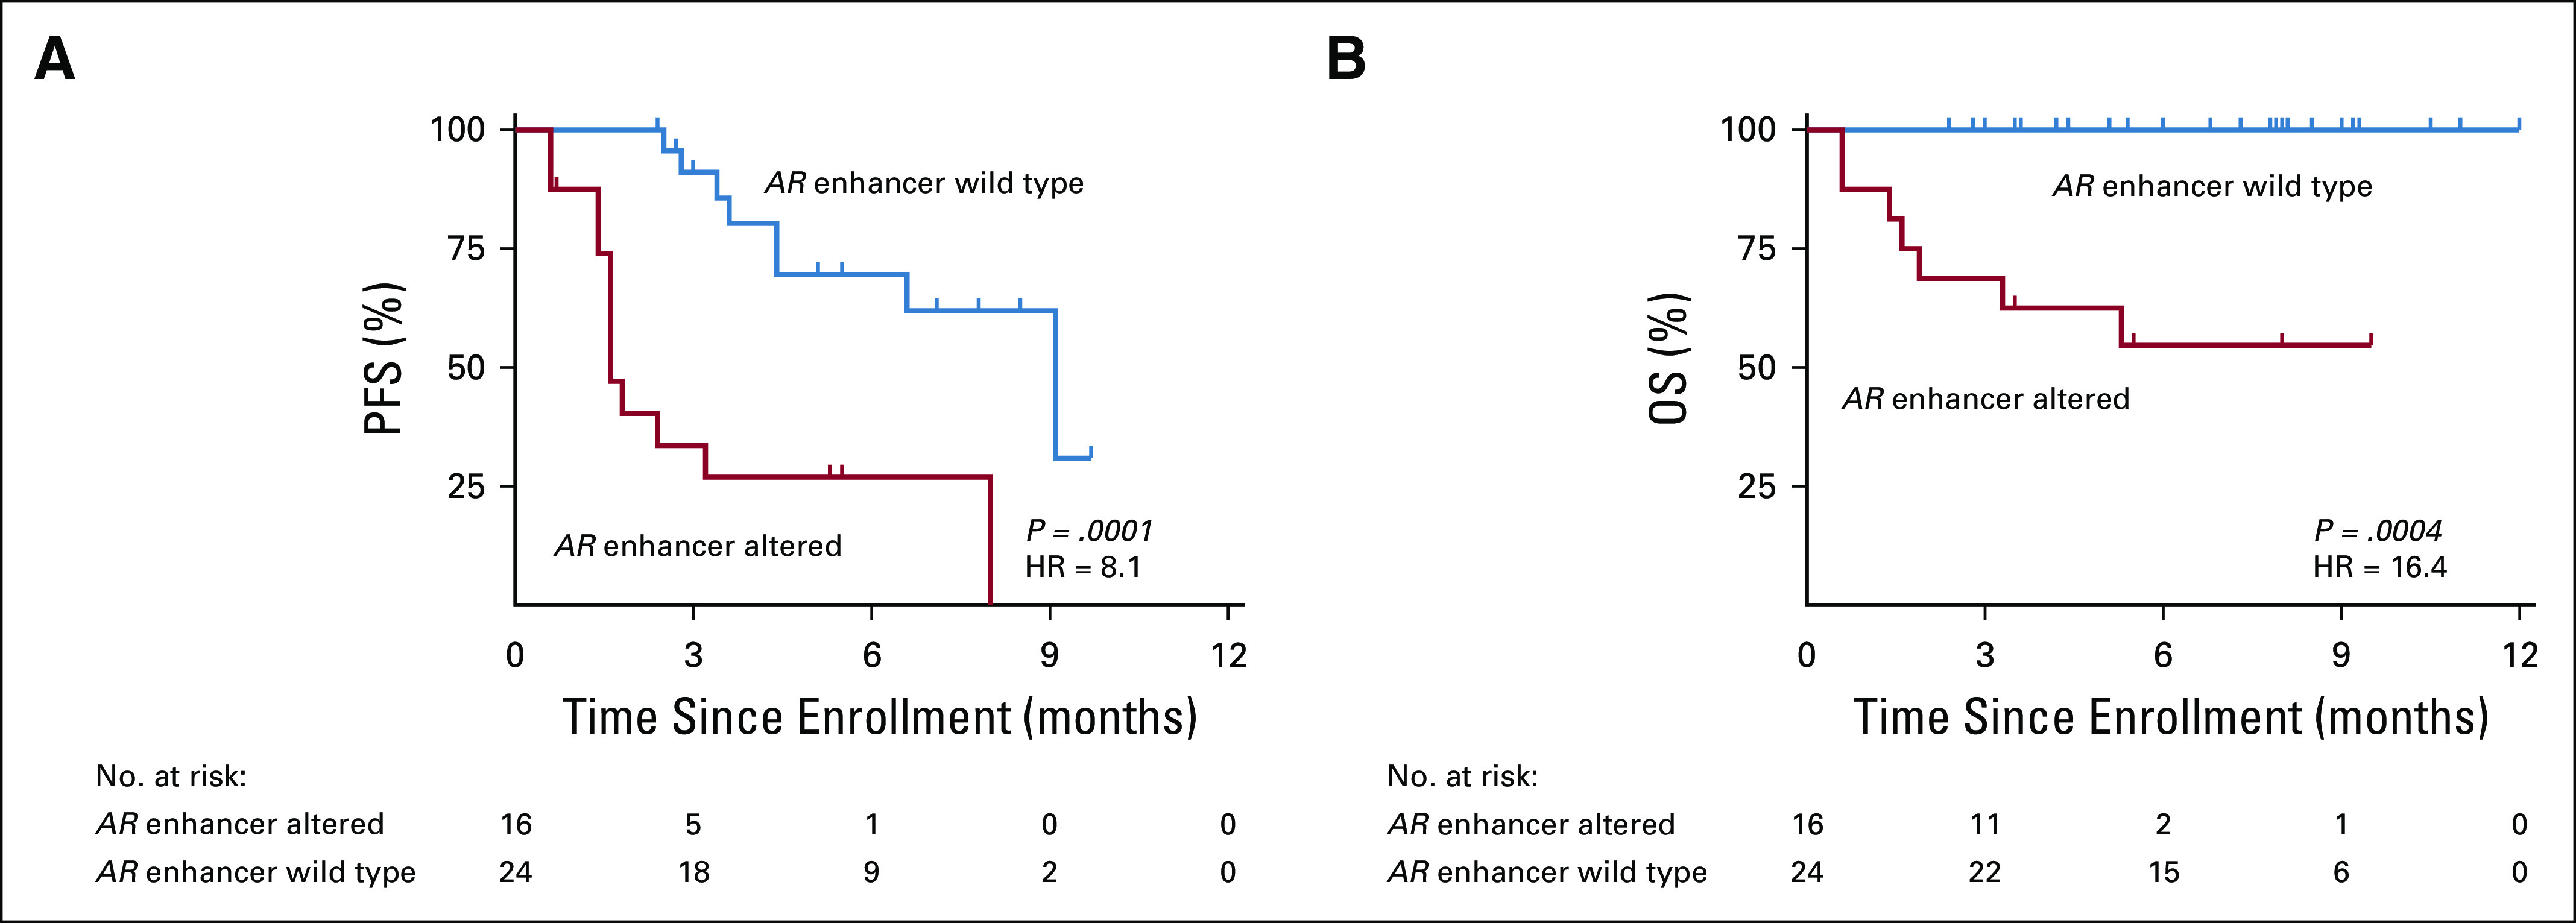
(A) Progression-free survival (PFS), and (B) overall survival (OS) according to androgen receptor (AR) enhancer status in cell-free DNA (cfDNA). For PFS, median was 1.6 months in patients with AR enhancer altered and 9.1 months in patients with wild-type AR enhancer in cfDNA. For OS, median was not reached in either arm. Hazard ratio (HR) for PFS was 8.1 (95% CI, 2.8 to 23.6; P = .0001) and 16.4 (95% CI, 3.5 to 77.2; P = .0004) for OS. P values were calculated by the log-rank test and HRs by the Mantel-Haenszel method.
FIG A5.
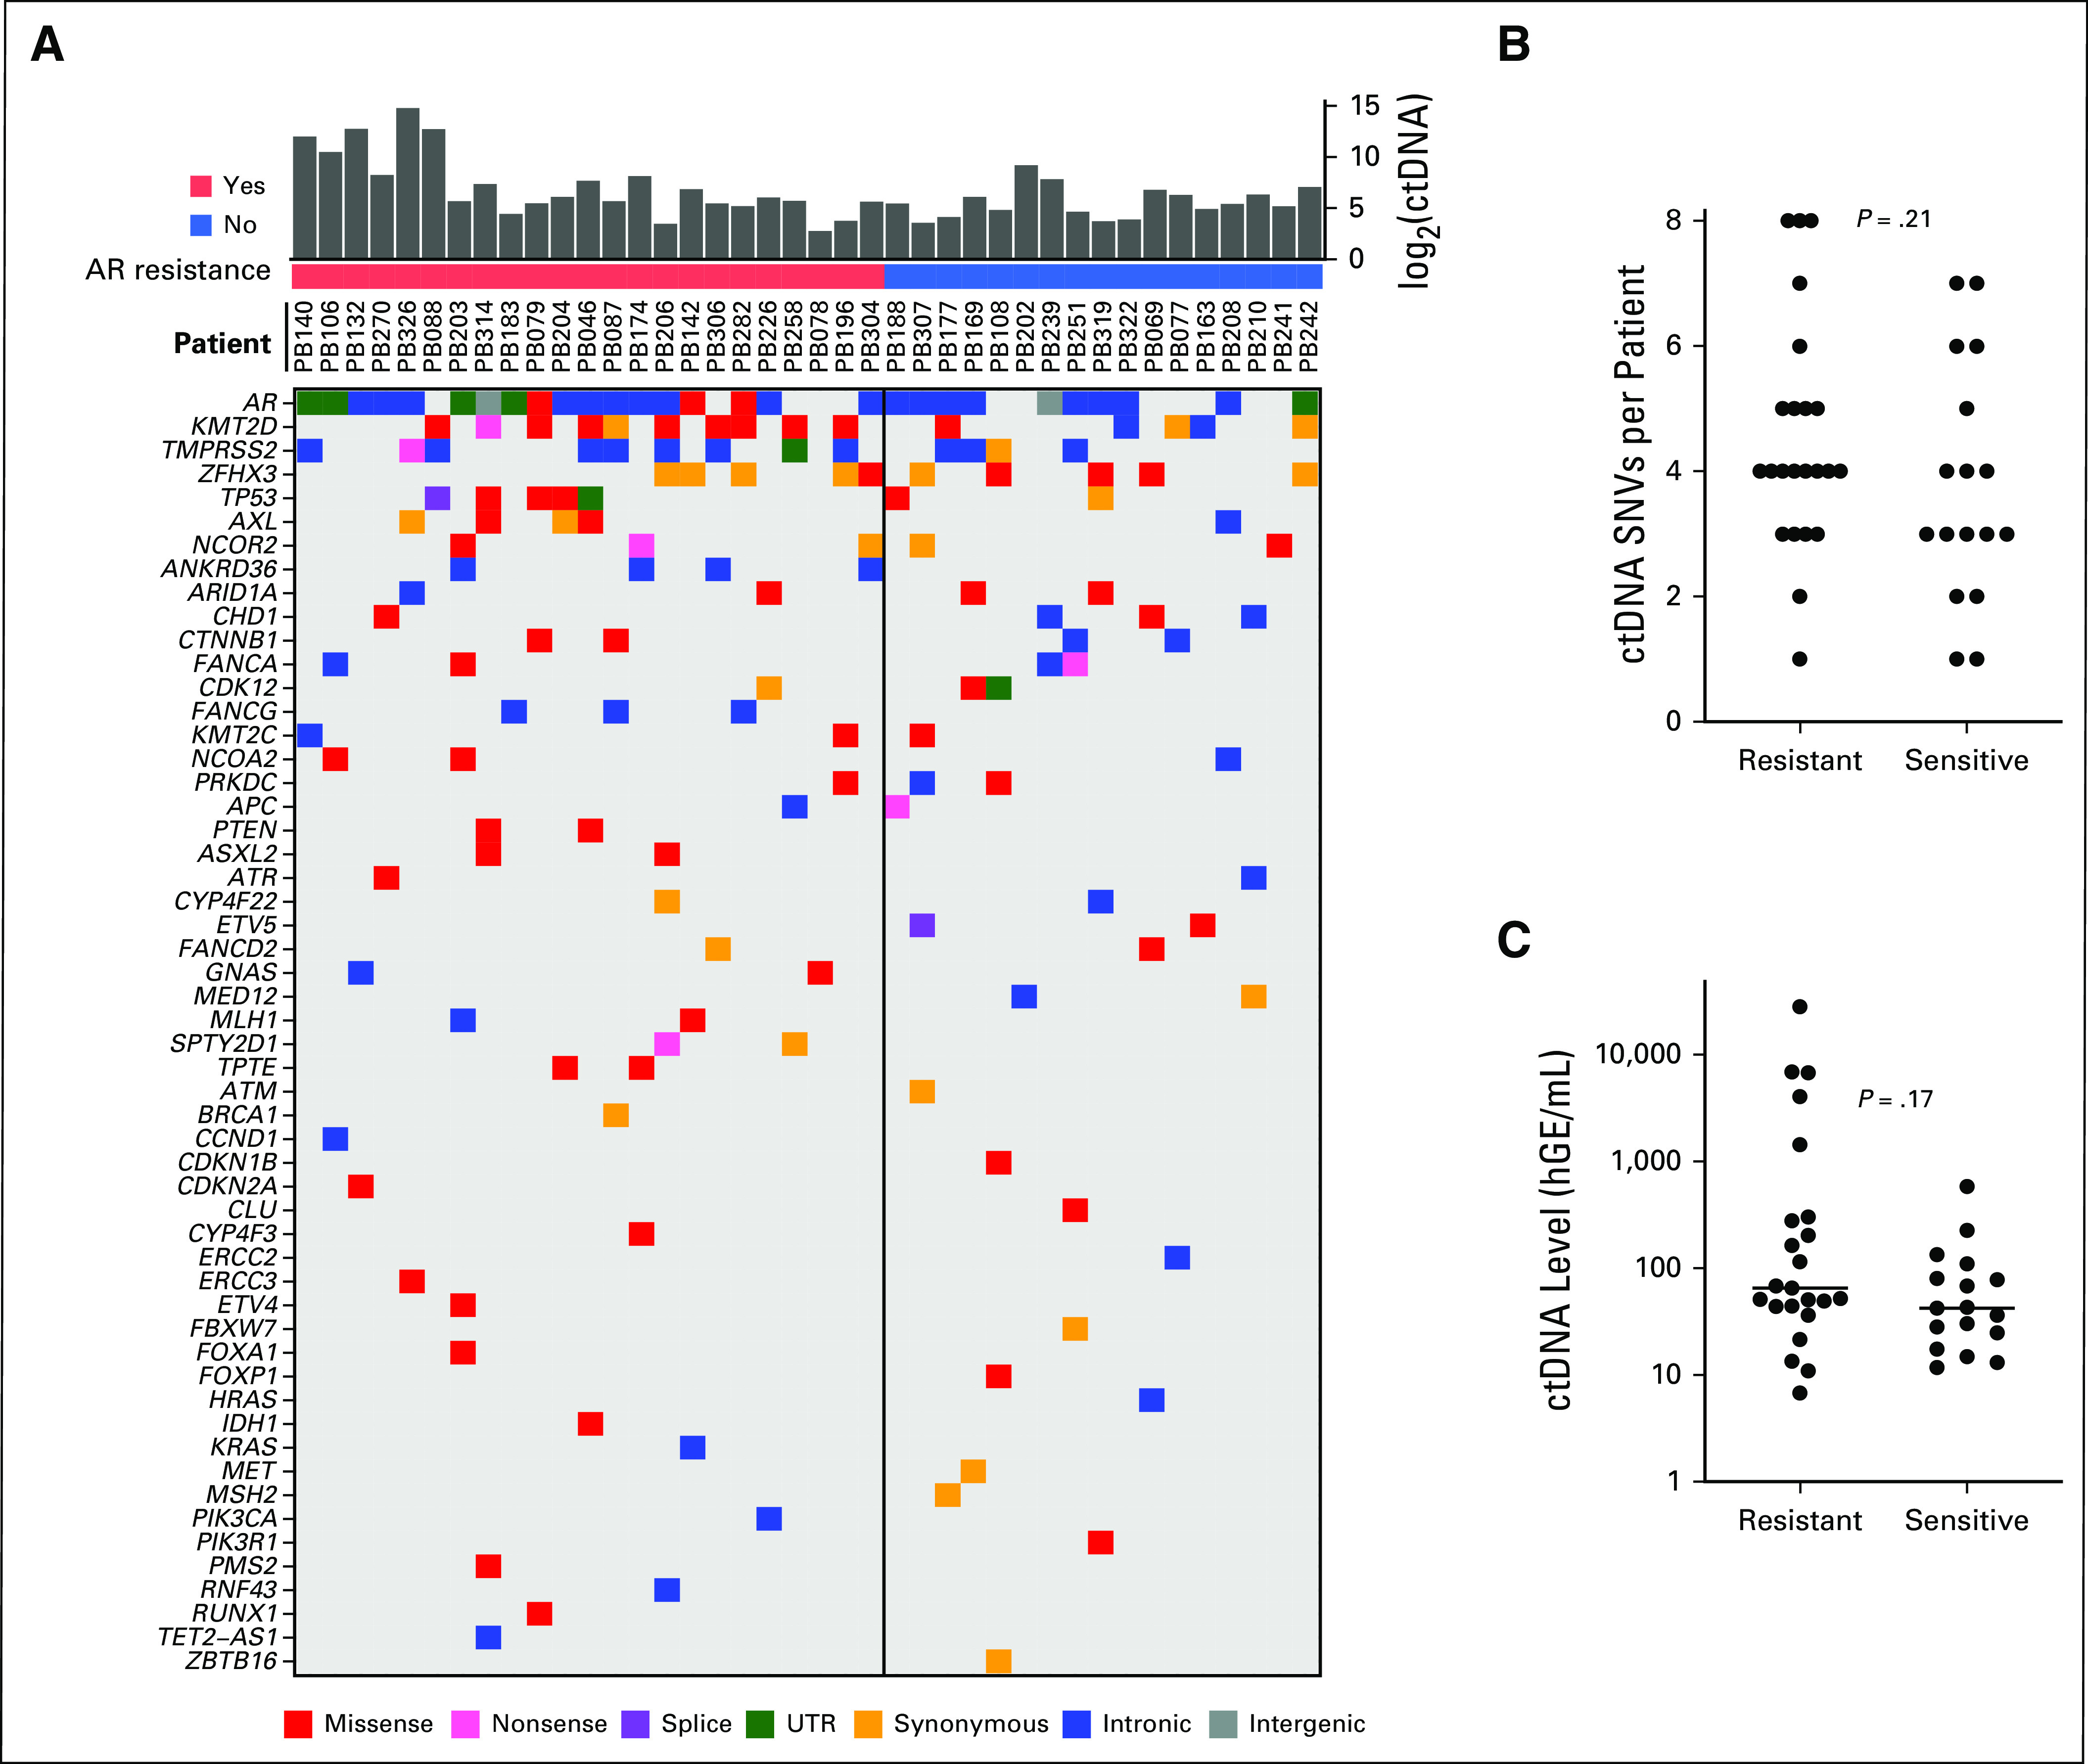
Single-nucleotide variant (SNV)–based analyses of mutational burden and circulating tumor DNA (ctDNA) levels at baseline. (A) Heat map of all somatic SNVs detected in cell-free DNA from each patient at time of enrollment. Genes are shown on the left and mutation types are indicated by color in the legend below. ctDNA levels are represented in the bar graph on top in log2 space. Resistance to AR-directed therapy is indicated below the bar graph as red (resistant) versus blue (sensitive). (B) Comparison of the number of SNVs and (C) ctDNA levels in AR-resistant versus AR-sensitive patients. ctDNA levels are in haploid genome equivalents (hGE) per milliliter; P values were calculated by Student’s t test. UTR, untranslated region.
TABLE A1.
Genes Included in the EnhanceAR-Seq Targeted Sequencing Panel
TABLE A2.
Patient Characteristics
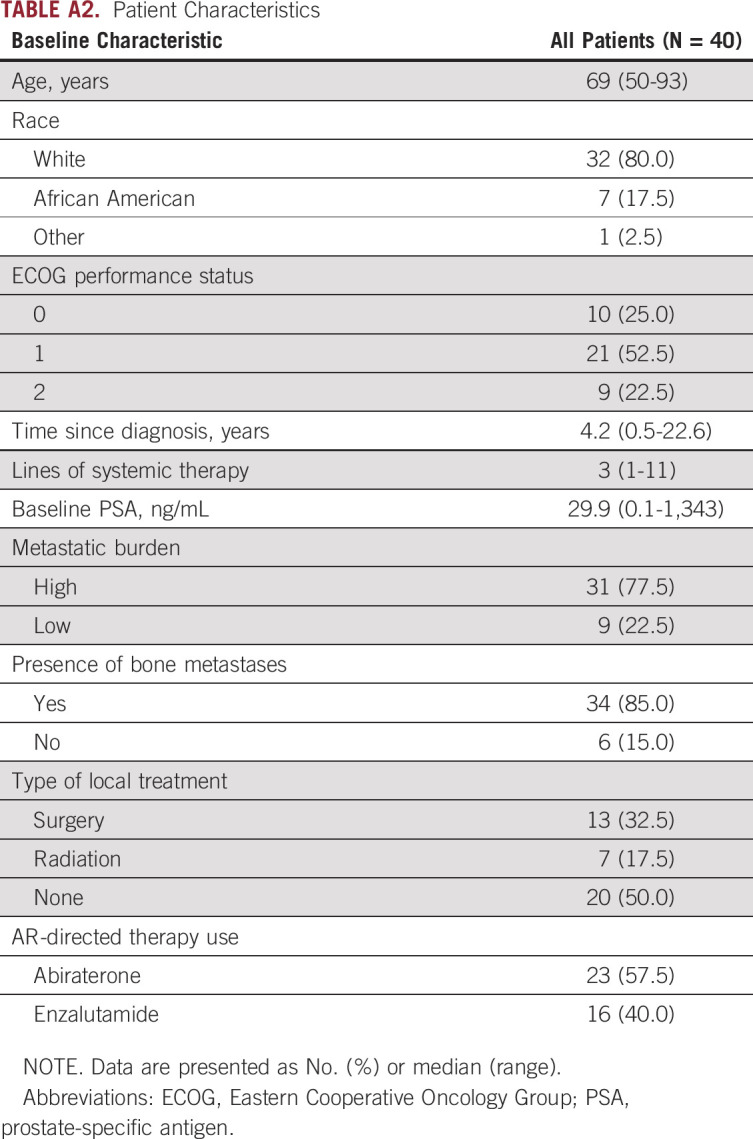
TABLE A3.
Clinical, Treatment, and Outcome Details for All Patients
TABLE A4.
Plasma cfDNA, Library Preparation, and Sequencing Metrics for All Patients
TABLE A5.
Plasma-Depleted Whole-Blood DNA, Library Preparation, and Sequencing Metrics for All Patients
TABLE A6.
Plasma cfDNA, Library Preparation, and Sequencing Metrics for Healthy Donors
TABLE A7.
Plasma-Depleted Whole Blood DNA, Library Preparation, and Sequencing Metrics for Healthy Donors
TABLE A8.
Copy Number Alterations Detected in Patient cfDNA by EnhanceAR-Seq

TABLE A9.
Structural Variations Detected in Patient Cell-Free DNA by EnhanceAR-Seq
TABLE A10.
COSMIC-Indexed Single Nucleotide Variants and Insertions/Deletions Detected in Patient Plasma, Not Detected in Matched Plasma-Depleted Whole Blood
TABLE A11.
AR Alterations Detected by Tumor Sequencing and Plasma Cell-Free DNA Sequencing
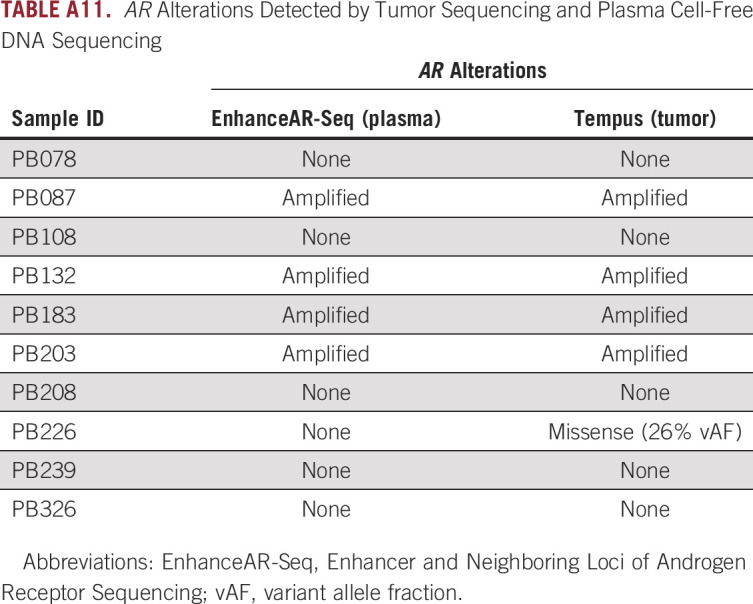
TABLE A12.
Multivariate Cox Regression for Progression-Free Survival Including Altered AR/enhancer Locus in cfDNA
TABLE A13.
Multivariate Cox Regression for Progression-Free Survival Including Amplified AR-Enhancer in cfDNA
TABLE A14.
Cox Regression for Progression-Free Survival With Baseline Covariates Including Altered AR/enhancer Locus in cfDNA
TABLE A15.
Cox Regression for Progression-Free Survival With Baseline Covariates Including Amplified AR-enhancer in cfDNA
TABLE A16.
Single-Nucleotide Variants Detected in Patient cfDNA, Not Detected in Matched Plasma-Depleted Whole Blood
SUPPORT
Supported by the Alvin J. Siteman Cancer Research Fund at Washington University in St Louis (A.A.C., C.A.M., R.K.P.), the National Cancer Institute of the National Institutes of Health under award number K08CA238711 (A.A.C.), the Cancer Research Foundation Young Investigator Award (A.A.C.), the American Cancer Society Institutional Research Grant under award number IRG-18-158-61 (H.X.D.), the Prostate Cancer Foundation Young Investigator Award (R.K.P.), the Sidney Kimmel Scholar Award (R.K.P.), and the Galen Hoskin and Dina Wolkoff Giving Fund (R.K.P.).
AUTHOR CONTRIBUTIONS
Conception and design: Ha X. Dang, Pradeep S. Chauhan, Jeff M. Michalski, Russell K. Pachynski, Christopher A. Maher, Aadel A. Chaudhuri
Financial support: Ha X. Dang, Christopher A. Maher, Aadel A. Chaudhuri
Administrative support: Andrew Atkocius, Aadel A. Chaudhuri
Provision of study material or patients: Rachel Beck, Andrew Atkocius, Jeff M. Michalski, Joel Picus, Christopher A. Maher, Russell K. Pachynski, Aadel A. Chaudhuri
Collection and assembly of data: Ha X. Dang, Pradeep S. Chauhan, Haley Ellis, Peter K. Harris, Grace Smith, Mark Qiao, Katherine Dienstbach, Rachel Beck, Andrew Atkocius, Joel Picus, Russell K. Pachynski, Christopher A. Maher, Aadel A. Chaudhuri
Data analysis and interpretation: Ha X. Dang, Pradeep S. Chauhan, Haley Ellis, Wenjia Feng, Faridi Qaium, Jingqin Luo, Joel Picus, Russell K. Pachynski, Christopher A. Maher, Aadel A. Chaudhuri
Manuscript writing: All authors
Final approval of manuscript: All authors
Accountable for all aspects of the work: All authors
AUTHORS' DISCLOSURES OF POTENTIAL CONFLICTS OF INTEREST
The following represents disclosure information provided by authors of this manuscript. All relationships are considered compensated unless otherwise noted. Relationships are self-held unless noted. I = Immediate Family Member, Inst = My Institution. Relationships may not relate to the subject matter of this manuscript. For more information about ASCO's conflict of interest policy, please refer to www.asco.org/rwc or ascopubs.org/po/author-center.
Open Payments is a public database containing information reported by companies about payments made to US-licensed physicians (Open Payments).
Grace Smith
Research Funding: Novartis Institutes for BioMedical Research, Amgen
Faridi Qaium
Stock and Other Ownership Interests: Centene
Jeff M. Michalski
Stock and Other Ownership Interests: ViewRay (I)
Consulting or Advisory Role: Augmenix, Mevion, Boston Scientific, Merck Sharp & Dohme
Travel, Accommodations, Expenses: Augmenix, Boston Scientific, Mevion, Merck Sharp & Dohme
Joel Picus
Consulting or Advisory Role: Novo Nordisk, Sanofi
Research Funding: BioClin Therapeutics (Inst), Agensys (Inst), Mirati Therapeutics (Inst), Innocrin Pharma (Inst), Rexahn Pharmaceuticals (Inst), Endocyte (Inst), Seattle Genetics (Inst), BioClin Therapeutics (Inst), TRACON Pharma (Inst), eFFECTOR Therapeutics (Inst)
Russell K. Pachynski
Consulting or Advisory Role: EMD Serono, Bristol Myers Squibb, Pfizer/EMD Serono, Sanofi, Jounce Therapeutics, Dendreon, Bayer, Genomic Health
Speakers' Bureau: Dendreon, Merck, Genentech/Roche, AstraZeneca, Sanofi, Genomic Health
Research Funding: Janssen Oncology
Travel, Accommodations, Expenses: Genentech/Roche
Aadel A. Chaudhuri
Stock and Other Ownership Interests: Geneoscopy
Honoraria: Foundation Medicine, Roche
Consulting or Advisory Role: Geneoscopy, Roche, Fenix Group International, Tempus
Patents, Royalties, Other Intellectual Property: US Patent No. US8685727B2
Travel, Accommodations, Expenses: Roche, Foundation Medicine
Other Relationship: Roche
No other potential conflicts of interest were reported.
REFERENCES
- 1.Lowrance WT, Murad MH, Oh WK, et al. Castration-resistant prostate cancer: AUA guideline amendment 2018. J Urol. 2018;200:1264–1272. doi: 10.1016/j.juro.2018.07.090. [DOI] [PubMed] [Google Scholar]
- 2.de Bono JS, Logothetis CJ, Molina A, et al. Abiraterone and increased survival in metastatic prostate cancer. N Engl J Med. 2011;364:1995–2005. doi: 10.1056/NEJMoa1014618. [DOI] [PMC free article] [PubMed] [Google Scholar]
- 3.Ryan CJ, Smith MR, de Bono JS, et al. Abiraterone in metastatic prostate cancer without previous chemotherapy. N Engl J Med. 2013;368:138–148. doi: 10.1056/NEJMoa1209096. [DOI] [PMC free article] [PubMed] [Google Scholar]
- 4.Scher HI, Fizazi K, Saad F, et al. Increased survival with enzalutamide in prostate cancer after chemotherapy. N Engl J Med. 2012;367:1187–1197. doi: 10.1056/NEJMoa1207506. [DOI] [PubMed] [Google Scholar]
- 5.Antonarakis ES, Lu C, Wang H, et al. AR-V7 and resistance to enzalutamide and abiraterone in prostate cancer. N Engl J Med. 2014;371:1028–1038. doi: 10.1056/NEJMoa1315815. [DOI] [PMC free article] [PubMed] [Google Scholar]
- 6.Scher HI, Lu D, Schreiber NA, et al. Association of AR-V7 on circulating tumor cells as a treatment-specific biomarker with outcomes and survival in castration-resistant prostate cancer. JAMA Oncol. 2016;2:1441–1449. doi: 10.1001/jamaoncol.2016.1828. [DOI] [PMC free article] [PubMed] [Google Scholar]
- 7.Chandrasekar T, Yang JC, Gao AC, et al. Targeting molecular resistance in castration-resistant prostate cancer. BMC Med. 2015;13:206. doi: 10.1186/s12916-015-0457-6. [DOI] [PMC free article] [PubMed] [Google Scholar]
- 8.Scher HI, Graf RP, Schreiber NA, et al. Assessment of the validity of nuclear-localized androgen receptor splice variant 7 in circulating tumor cells as a predictive biomarker for castration-resistant prostate cancer. JAMA Oncol. 2018;4:1179–1186. doi: 10.1001/jamaoncol.2018.1621. [DOI] [PMC free article] [PubMed] [Google Scholar]
- 9.Annala M, Vandekerkhove G, Khalaf D, et al. Circulating tumor DNA genomics correlate with resistance to abiraterone and enzalutamide in prostate cancer. Cancer Discov. 2018;8:444–457. doi: 10.1158/2159-8290.CD-17-0937. [DOI] [PubMed] [Google Scholar]
- 10.Chaudhuri AA, Chabon JJ, Lovejoy AF, et al. Early detection of molecular residual disease in localized lung cancer by circulating tumor DNA profiling. Cancer Discov. 2017;7:1394–1403. doi: 10.1158/2159-8290.CD-17-0716. [DOI] [PMC free article] [PubMed] [Google Scholar]
- 11.Chin RI, Chen K, Usmani A, et al. Detection of solid tumor molecular residual disease (MRD) using circulating tumor DNA (ctDNA) Mol Diagn Ther. 2019;23:311–331. doi: 10.1007/s40291-019-00390-5. [DOI] [PMC free article] [PubMed] [Google Scholar]
- 12.Conteduca V, Wetterskog D, Sharabiani MTA, et al. Androgen receptor gene status in plasma DNA associates with worse outcome on enzalutamide or abiraterone for castration-resistant prostate cancer: A multi-institution correlative biomarker study. Ann Oncol. 2017;28:1508–1516. doi: 10.1093/annonc/mdx155. [DOI] [PMC free article] [PubMed] [Google Scholar]
- 13.Corcoran RB, Chabner BA. Application of cell-free DNA analysis to cancer treatment. N Engl J Med. 2018;379:1754–1765. doi: 10.1056/NEJMra1706174. [DOI] [PubMed] [Google Scholar]
- 14.Newman AM, Bratman SV, To J, et al. An ultrasensitive method for quantitating circulating tumor DNA with broad patient coverage. Nat Med. 2014;20:548–554. doi: 10.1038/nm.3519. [DOI] [PMC free article] [PubMed] [Google Scholar]
- 15.Vandekerkhove G, Struss WJ, Annala M, et al. Circulating tumor DNA abundance and potential utility in de novo metastatic prostate cancer. Eur Urol. 2019;75:667–675. doi: 10.1016/j.eururo.2018.12.042. [DOI] [PubMed] [Google Scholar]
- 16.Wan JCM, Massie C, Garcia-Corbacho J, et al. Liquid biopsies come of age: Towards implementation of circulating tumour DNA. Nat Rev Cancer. 2017;17:223–238. doi: 10.1038/nrc.2017.7. [DOI] [PubMed] [Google Scholar]
- 17.Newman AM, Lovejoy AF, Klass DM, et al. Integrated digital error suppression for improved detection of circulating tumor DNA. Nat Biotechnol. 2016;34:547–555. doi: 10.1038/nbt.3520. [DOI] [PMC free article] [PubMed] [Google Scholar]
- 18. doi: 10.1016/j.cell.2018.06.039. Quigley DA, Dang HX, Zhao SG, et al: Genomic hallmarks and structural variation in metastatic prostate cancer. Cell 174:758-769.e9, 2018. [DOI] [PMC free article] [PubMed] [Google Scholar]
- 19. doi: 10.1016/j.cell.2018.05.037. Takeda DY, Spisak S, Seo JH, et al: A somatically acquired enhancer of the androgen receptor is a noncoding driver in advanced prostate cancer. Cell 174:422-432.e13, 2018. [DOI] [PMC free article] [PubMed] [Google Scholar]
- 20.Viswanathan SR, Ha G, Hoff AM, et al. Structural alterations driving castration-resistant prostate cancer revealed by linked-read genome sequencing.Cell 174:433-447.e19, 2018 [DOI] [PMC free article] [PubMed] [Google Scholar]
- 21.Scher HI, Morris MJ, Stadler WM, et al. Trial design and objectives for castration-resistant prostate cancer: Updated recommendations from the Prostate Cancer Clinical Trials Working Group 3. J Clin Oncol. 2016;34:1402–1418. doi: 10.1200/JCO.2015.64.2702. [DOI] [PMC free article] [PubMed] [Google Scholar]
- 22.Tate JG, Bamford S, Jubb HC, et al. COSMIC: The Catalogue of Somatic Mutations in Cancer. Nucleic Acids Res. 2019;47:D941–D947. doi: 10.1093/nar/gky1015. [DOI] [PMC free article] [PubMed] [Google Scholar]
- 23.Beaubier N, Tell R, Huether R, et al. Clinical validation of the Tempus xO assay. Oncotarget. 2018;9:25826–25832. doi: 10.18632/oncotarget.25381. [DOI] [PMC free article] [PubMed] [Google Scholar]
- 24.Beaubier N, Tell R, Lau D, et al. Clinical validation of the tempus xT next-generation targeted oncology sequencing assay. Oncotarget. 2019;10:2384–2396. doi: 10.18632/oncotarget.26797. [DOI] [PMC free article] [PubMed] [Google Scholar]
- 25.Wyatt AW, Annala M, Aggarwal R, et al. Concordance of circulating tumor DNA and matched metastatic tissue biopsy in prostate cancer. J Natl Cancer Inst. 2017;109:djx118. doi: 10.1093/jnci/djx118. [DOI] [PMC free article] [PubMed] [Google Scholar]
- 26.Armstrong AJ, Halabi S, Luo J, et al. Prospective multicenter validation of androgen receptor splice variant 7 and hormone therapy resistance in high-risk castration-resistant prostate cancer: The PROPHECY study. J Clin Oncol. 2019;37:1120–1129. doi: 10.1200/JCO.18.01731. [DOI] [PMC free article] [PubMed] [Google Scholar]
- 27.Ho Y, Dehm SM. Androgen receptor rearrangement and splicing variants in resistance to endocrine therapies in prostate cancer. Endocrinology. 2017;158:1533–1542. doi: 10.1210/en.2017-00109. [DOI] [PMC free article] [PubMed] [Google Scholar]


