Abstract
Objective
Indications for the treatment of cerebral aneurysms with flow diversion stents are expanding. The current aneurysm occlusion rate at six months ranges between 60 and 80%. Predictability of complete vs. partial aneurysm occlusion is poorly defined. Here, we evaluate the angiographic contrast time-density as a predictor of aneurysm occlusion rate at six months’ post-flow diversion stents.
Methods
Patients with unruptured cerebral aneurysms proximal to the internal carotid artery terminus treated with single flow diversion stents were included. 2D parametric parenchymal blood flow software (Siemens-Healthineers, Forchheim, Germany) was used to calculate contrast time-density within the aneurysm and in the proximal adjacent internal carotid artery. The area under the curve ratio between the two regions of interests was assessed at baseline and after flow diversion stents deployment. The area under the curve ratio between completely vs. partially occluded aneurysms at six months’ follow-up was compared.
Results
Thirty patients with 31 aneurysms were included. Mean aneurysm diameter was 8 mm (range 2–28 mm). Complete occlusion was obtained in 19 aneurysms. Younger patients (P = 0.006) and smaller aneurysms (P = 0.046) presented higher chance of complete obliteration. Incomplete occlusion of the aneurysm was more likely if the area under the curve contrast time-density ratio showed absolute (P = 0.001) and relative percentage (P = 0.001) decrease after flow diversion stents deployment. Area under ROC curve was 0.85.
Conclusion
Negative change in the area under the curve ratio indicates less contrast stagnation in the aneurysm and lower chance of occlusion. These data provide a real-time analysis after aneurysm treatment. If validated in larger datasets, this can prompt input to the surgeon to place a second flow diversion stents.
Keywords: Aneurysm occlusion, cerebral aneurysm, contrast time-density, flow diversion, pipeline embolization device
Introduction
Flow diverting stents (FDSs) have become an important part in the treatment of intracranial aneurysms.1 By limiting blood flowing into and out of the aneurysm and by redirecting main blood flow along the path of the parent vessel, these low-porous stents induce thrombosis of aneurysms over time.2 This intervention makes FDSs, in large number of cases, curative. However, FDS may still allow residual flow into the aneurysm sac, determining sometimes incomplete occlusion on follow-up imaging.3,4 Reported rate of incomplete aneurysm occlusion after FDS deployment is about 25% on follow-up angiograms.3,5–9 Several studies have investigated factors able to predict aneurysm occlusion rate at follow-up; predictors associated with poor aneurysm occlusion include larger aneurysm size, larger ostium or neck ratios, shorter follow-up time, patient age >70 years, and fusiform morphology.10–12 Smoking, instead, is associated with higher rate of aneurysm thrombosis.10 The identification of risk factors for incomplete aneurysm occlusion after FDS treatment is still an ongoing investigation, and hemodynamic evaluation is recently gaining attention.
Digital subtraction angiography (DSA) is the gold standard imaging for intracranial aneurysm diagnosis and provides guidance for endovascular intervention, but the image acquisition in frames limits a reliable assessment of hemodynamic information.
Multiple computational algorithms have been studied over the past decades to obtain flow quantification on DSA, and recently contrast time-density analysis has been validated to evaluate cerebral blood flow hemodynamics in patients with intracranial aneurysms and arteriovenous malformations. With this DSA post-processing analysis, blood flow is indirectly extrapolated through the computation of the curve obtained by plotting contrast density against time during the angiographic cycle.13–17
In this study, we used a DSA-based post-processing software, SyngoiFlow™ (Siemens Healthineers, Forchheim, Germany) for a 2D parametric parenchymal blood flow analysis, to study the relative changes in contrast time-density in a cohort of patient with anterior circulation cerebral aneurysms proximal to the ICA terminus treated with FDS. We assess the software’s capacity to detect any hemodynamic difference at baseline and immediately after FDS deployment between the aneurysm groups that showed complete vs. incomplete occlusion at six months’ follow-up.
Methods
Patient selection
After institutional review board approval was obtained, a retrospective analysis of all patients with intracranial aneurysms treated with FDS at our single institution between July 2013 and January 2019 was performed.
Patients with unruptured internal carotid artery (ICA) aneurysm proximal to the ICA terminus treated with FDS and with six months cerebral DSA imaging follow-up were included. Previously treated aneurysms with coiling, clip, or treated with multiple FDS were excluded.
DSA and medical charts were reviewed. Patient demographics (age, sex, comorbidities, smoking status) and aneurysm characteristics (size, aneurysm type, and location) were collected at baseline prior to aneurysm treatment. All follow-up, angiograms at six months were reviewed for aneurysm obliteration assessment by two different neurosurgeons at our institution. The study cohort was divided into two subgroups according to the treatment outcome at six months follow-up (complete vs. incomplete aneurysm occlusion).
All patients were treated with a standard method using tri-axial system. Antiplatelet therapy was started at least one week prior to the aneurysm treatment (aspirin 325 mg and clopidogrel 75 mg PO daily). Platelet function assay (Verify Now, Accumetrics; San Diego, CA) was performed the same day prior to the beginning of procedure, and non-responders were additionally loaded and treated with alternative antiplatelet therapy (prasugrel or ticagrelor). Both aspirin and plavix were continued for a six-month period.
Image acquisition
All angiograms were performed using the same protocol for each patient. Specifically, a total of 12 mL of the iodine-based contrast agent iohexol (300 mg/mL, Omnipaque, GE Healthcare, Chicago, IL) was injected into the cervical ICA through a trans-femoral approach. The catheter was generally positioned at the mid third of the cervical ICA in its straight segment, whenever possible, as a standard acquisition technique. Contrast was injected by a power-contrast injector (Medrad, Bayer HealthCare, Whippany, NJ) over 2 s. The power-contrast injector was synchronized to a fluoroscopy angiographic machine with a 1.2-s delay in the contrast injection. DSA images at a rate of 3 frames/s were acquired in anterior-posterior, lateral, and oblique trans-orbital projections using a biplane neuro-angiography suite (Artis zee, Siemens Healthineers, Forchheim, Germany). DSA images were routinely saved to the PACS, and the entire unprocessed DSA was archived on a separate DVD in DICOM format.
2D angiographic contrast time-density
DSA images were downloaded onto a central computer for analysis. Individual DSA runs were analyzed for contrast image intensity throughout the angiogram cycle with the 2D parametric parenchymal blood flow software. This technique identifies various contrast intensity plots, including the maximum gray intensity, in consecutive DICOM images for each pixel.
DSA at baseline and post-FDS were analyzed. Regions of interest (ROIs) were selected at the most central portion of the aneurysm sac that avoided parent vessel or aneurysm inflow and outflow contrast overlapping. For the post-processing analysis, the selection of the DSA projection among the standardly performed anterior-posterior, lateral or oblique was also based on the best visualization of the aneurysm sac offered, without vessel overlapping. Being a color-coded 2D parametric map based on contrast intensity and time, the software is unable to distinguish the direction of the flow and, if the higher intensity of a pixel is determined by the additive flow of two different overlapping and simultaneous sources or by a unique source, it is unable to differentiate form an increased flow from a single source. The inherent bias was controlled by the examiner with attentive selection of the ROI on the best DSA projection that displayed the aneurysm without overlapping vessels in order to avoid possible confounders to the post-processing computation.
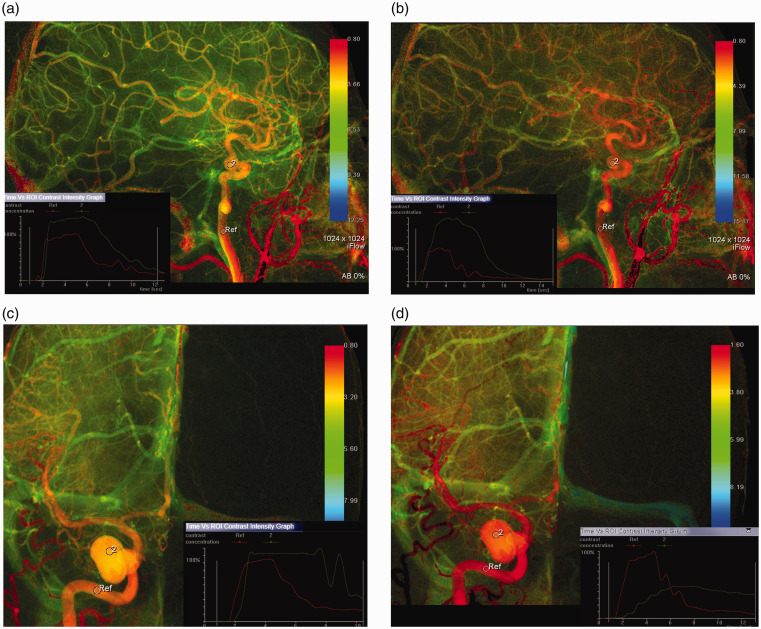
Analyses were performed for arrival to peak, width at half peak, mean transit time, and area under the curve (AUC). The AUC was controlled by selecting a control ROI on the parent vessel proximal to the aneurysm (petrous ICA) (see illustrative case, Figure 1).
Figure 1.
Illustrative case. Comparison of 2D parametric angiographic data change before and after FDS deployment. (a) and (b) pre and post-FDS deployment color-coded time density relationship map, respectively, for an eventually completely occluded ICA aneurysm on six months’ follow-up angiogram. (c) and (d) pre and post-FDS deployment, respectively, for an eventually incompletely occluded ICA aneurysm on six months’ follow-up angiogram. Corner graphs show contrast concentration in reference (ICA) vs. aneurysm. Corner graph in (d) shows that contrast concentration post-FDS move faster in incompletely occluded patient unlike the faster contrast clearance concentration post-FDS in the patient that fully occluded (b).
Statistical analysis
Statistical analysis was performed using Stata (version 12. StataCorp; College Station, TX). Study cohort was dichotomized based on aneurysm occlusion at six months’ follow-up (complete vs. incomplete occlusion).
Patient demographics and aneurysm baseline characteristics were compared between the two groups. Arrival to peak, width at half peak, and mean transit time before and after FDS and their absolute and relative change were also analyzed. The AUC within the aneurysm was divided by a reference AUC within the petrous ICA to control for change in contrast injection rate, location, or contrast volume.
Continuous and categorical variables were compared using Student’s t-test or Mann-Whitney U test and Pearson’s χ2 or Fisher’s exact test, respectively, when appropriate. Statistical significance was defined as P < 0.05.
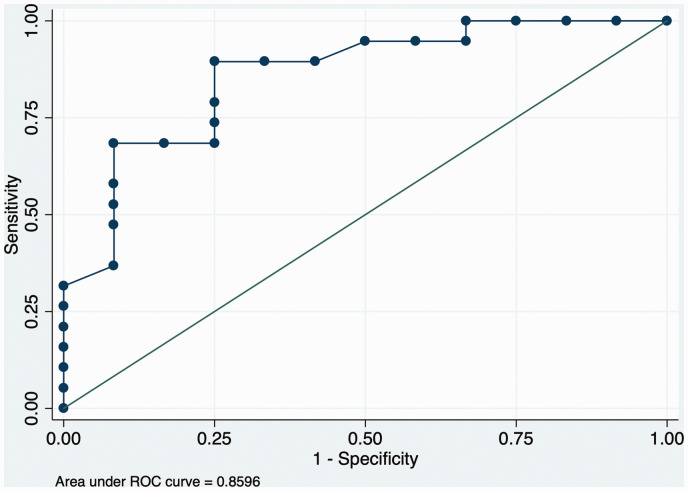
To assess the performance of the 2D AUC in predicting aneurysm occlusion, a parametric receiver-operating characteristic (ROC) curve was generated, and the areas under the ROC (AUC) curve was calculated. An AUC of 0.5 indicates no discrimination, while an AUC of 1.0 indicates perfect discrimination. Significant accuracy was defined for AUC > 0.80.
Results
Patient demographics and aneurysm characteristics
The study included 30 patients, with 31 aneurysms treated with flow diverters between July 2013 and January 2019. One patient had two adjacent aneurysms treated with the same FDS. All patients were treated with a single Pipeline flow diverting stent (Medtronic, Minneapolis, MN).
Mean patient age was 58.1 years; 24 patients (80%) were female. Mean aneurysm size was 8 mm (2–28 mm). All patient demographics and aneurysms characteristics are summarized in Table 1. Nineteen patients (61%) had complete aneurysm occlusion at six months’ follow-up. There was no statistically significant difference in patient gender, smoking, hypertension, and hyperlipidemia history between the complete and incomplete occlusion groups nor for aneurysm location and morphology (Table 1). Patient mean age and mean aneurysm size were significantly higher in the group with incomplete aneurysm occlusion (respectively, P = 0.006 and P = 0.046, see Table 1).
Table 1.
Demographic data between complete and incomplete occluded groups.
| Variable | Complete occlusion (n = 19) | Incomplete occlusion (n = 12) | P |
|---|---|---|---|
| Mean age, years (range) | 53.4 (42–69) | 65.5 (41–79) | 0.006 |
| Sex | 16 | 9 | 0.527 |
| F | 3 | 3 | |
| M | |||
| Smoking | 6 | 3 | 0.56 |
| Hypertension | 10 | 8 | 0.67 |
| Dyslipidemia | 4 | 7 | 0.62 |
| Mean aneurysm size, mm (range) | 6.29 | 10.83 | 0.046 |
| Aneurysm morphology | 16 | 10 | 0.9 |
| • Saccular | 1 | 1 | |
| • Fusiform | 2 | 1 | |
| • Multilobed/irregular | |||
| Aneurysm location | 0.7 | ||
| • Cavernous | 3 | 3 | |
| • Clinoid | 4 | 4 | |
| • Ophthalmic | 8 | 4 | |
| • SHA | 2 | ||
| • Others | 2 | 1 |
2D angiographic contrast time-density parameters
2D parametric parameters analysis is summarized in Table 2.
Table 2.
2D parametric data.
| 2D parametric data | Complete occlusion (n = 19) | Incomplete occlusion (n = 12) | P | |
|---|---|---|---|---|
| Aneurysm size mm, mean | 6.29 mm | 10.8 mm | 0.046 | |
Arrival to peak, s (20%–100%) 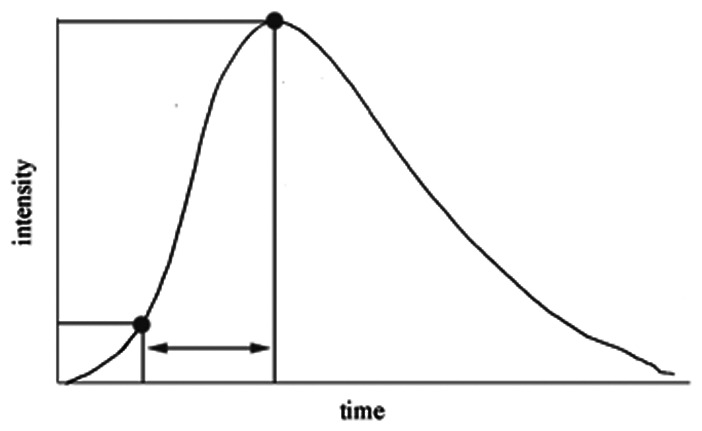
|
• Pre | 0.556 s | 0.72 s | 0.0728 |
| • Post | 0.54 s | 1.06 s | 0.007 | |
| • Absolute | −0.13 s | 0.34 s | 0.089 | |
| • % Change | 0.1 | 0.71 | 0.11 | |
Width, s (50%–50%) 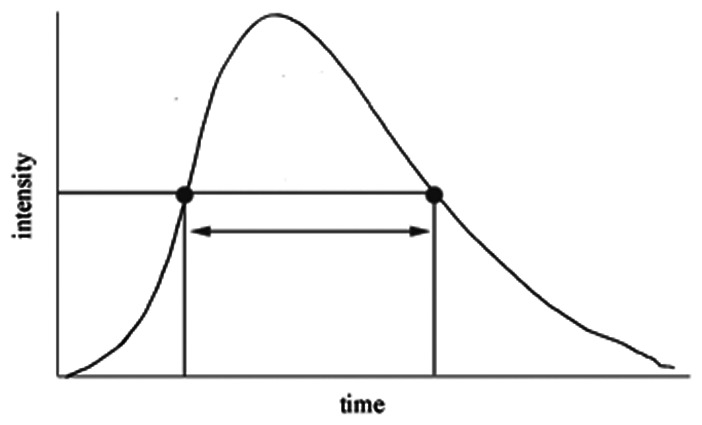
|
• Pre | 5.39 s | 5.86 s | 0.56 |
| • Post | 5.84 s | 8.17 s | 0.13 | |
| • Absolut | 0.45 s | 2.31 s | 0.22 | |
| • % Change | 0.05 | 0.68 | 0.04 | |
Mean TT (s) 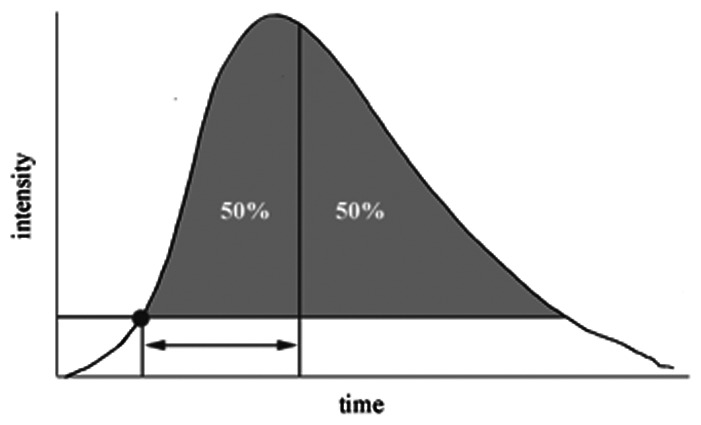
|
• Pre | 4.88 | 5.35 | 0.24 |
| • Post | 5 | 6.38 | 0.063 | |
| • Absolute | 0.122 | 1.03 | 0.106 | |
| • % Change | 0.011 | 0.213 | 0.056 | |
AUC ratio (Aneurysm/Cavernous ICA) 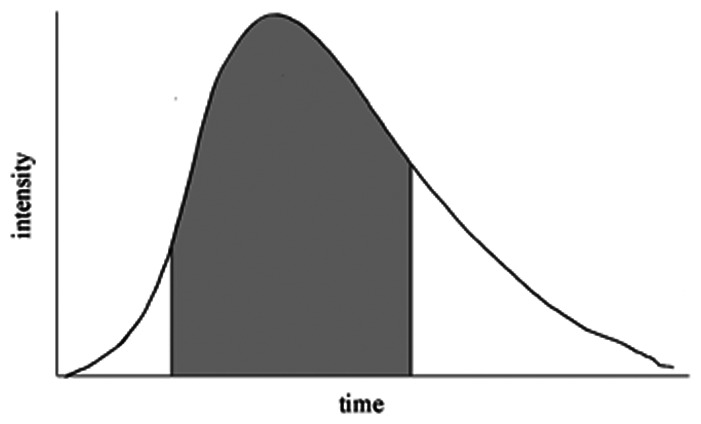
|
• Pre | 1.38 | 1.78 | 0.014 |
| • Post | 1.47 | 1.43 | 0.84 | |
| • Absolute | 0.92 | −0.48 | 0.001 | |
| • % Change | 0.62 | −0.28 | 0.001 |
TT: transit time; ICA: internal carotid artery; AUC: area under the curve.
Arrival to peak was significantly longer after FDS deployment in patients that showed incomplete aneurysm occlusion at six months’ follow-up (1.06 vs. 0.54 s, P = 0.007), but absolute and relative change were not statistically different compared to patients with complete occlusion (P = 0.089 and P = 0.11, respectively).
Width at half peak showed significant relative increase after FDS deployment in aneurysms with incomplete occlusion (68%) compared to completely occluded aneurysms (5%; P = 0.04).
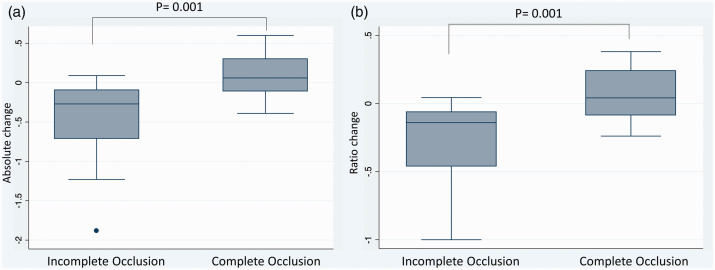
The AUC ratio at baseline was significantly different between the two groups of our study cohort (1.38 in complete occlusion group vs. 1.78 in incomplete occlusion group, P = 0.014), and patients with complete occlusion presented higher absolute and relative ratio increase after stent deployment (0.92 vs. −0.48, P = 0.001; 62% vs. −28%, P = 0.001, respectively). Data also revealed a visual cutoff of around 0 for AUC ratio change between the incomplete and complete occlusion groups. Positive change (increased aneurysmal contrast time-density time) was associated with complete occlusion, while negative change (reduced contrast time-density time) was associated with incomplete occlusion (Figure 2).
Figure 2.
(a) Box plot comparing Absolute change between complete and incomplete aneurysm occlusion groups for the aneurysmal area under the curve (AUC) contrast time-density analysis controlled by the proximal ICA. (b) Box plot comparing Ratio change between complete and incomplete occlusion groups for the aneurysmal area under the curve (AUC) contrast time-density analysis controlled by the proximal ICA.
Area under receiver operating characteristic curve for 2D parametric AUC ratio resulted significantly accurate in predicting aneurysm occlusion rate at six months’ follow-up (ROC = 0.85) (Figure 3).
Figure 3.
Area under ROC curve for the aneurysmal AUC contrast time-density analysis controlled by the proximal ICA.
Discussion
In this study, we examined the predictability of complete vs. partial occlusion of cerebral aneurysms treated with single flow diverter on six months’ follow-up using a 2D parametric time density analysis based on DSA. Incomplete occlusion of the aneurysm was more likely to occur if the 2D AUC contrast time-density ratio showed absolute and relative percentage decrease after FDS deployment.
Multiple mathematical models have been created for the prediction of intracranial aneurysm occlusion post-FDS.3,5–7 These models attempt to predict the occlusion rate based on aneurysm geometry, location, size, degree of initial aneurysm occlusion, and presence of contrast stasis after FDS deployment.6 In a study by Maragkos et al.,12 aneurysms were plotted by size in 5-mm increments to determine incomplete occlusion rates. They found a sharp decrease in occlusion rates in aneurysms ≥ 15 mm in diameter, which served as an independent negative predictor of occlusion.12 Other predictive factors have also been studied, including the number of FDS, follow-up duration, and ostium or neck ratio.
The entire concept of the flow diversion is to create a flow stagnation within the aneurysm itself.18,19 The DSA time density analysis provides a mathematical model to calculate the contrast stagnation within the intracranial aneurysm based on how fast the contrast passes within the ROI. For example, one study found that contrast time-density time decreased post-FDS treatment in the distal vascular bed and was even more decreased with larger aneurysms.16
Our study utilized DSA time density analysis to visualize the hemodynamic changes within the aneurysm. Since the early part of time-density curve is generally affected by the hemodynamic artifact caused by contrast power injector and synchronization to the starting point of image acquisition may be inconsistent, we selected our 2D angiographic parameters starting from 20 to 50% of contrast intensity (Table 2) in order to reduce the inherent bias.
The petrous ICA was used as a control for the analysis of the AUC in order to standardize the analysis pre- and post-FDS. The entire cohort was selected to be homogeneous with respect to aneurysm location to avoid a possible confounder to the analysis. The advantage of using the AUC of the time density curve controlled with the adjacent proximal ICA in the analysis is the minimization of confounders related to the site of the contrast injection, vessel size, or volume of contrast administered.13–17 Our study shows that the contrast stagnation can be quantified based on the AUC in the aneurysm controlled by the petrous ICA. Patients with incomplete aneurysm occlusion tended to have a paradoxical faster contrast clearance from the aneurysm sac post-FDS compared to baseline, while aneurysms that showed complete occlusion did have a prolonged contrast clearance in the AUC ratio after stent deployment. These data might give the operator an early indication about the long-term occlusion chance post-FDS and, if the data are reproducible in larger studies, faster aneurysm contrast clearance post-FDS could suggest the need for a second FDS during the same procedure. Multiple stents, indeed, have been shown to further reduce hemodynamic activity within the aneurysm.20
Decreased aneurysms occlusion rate may be due to increased intra-aneurysmal flow. A study by Cebral et al. utilized computational fluid dynamic (CFD) models and Doppler ultrasound (DUS) in animals and measured flow velocity in aneurysms. They found that incomplete occlusion in the presence of an FDS is associated with higher aneurysmal flow activity.21 This result suggests that faster intra-aneurysmal flow is associated with lower rates of aneurysm occlusion22 providing support to our findings. After stent deployment in our cohort, aneurysms with complete occlusion at six months’ follow-up showed significant absolute and relative increase in the 2D parametric AUC ratio, namely reduced aneurysmal contrast time-density curve in the aneurysm sac compared to baseline pre-FDS. Interestingly, patients with incomplete aneurysm occlusion presented at baseline smaller contrast time-density curve (1.78 vs. 1.38), but what most importantly affected treatment outcome was the direction change in intra-aneurysmal flow velocity (positive vs. negative AUC ratio change) rather than baseline or post-FDS absolute AUC ratio values. The baseline difference in the AUC ratio is probably also related to the significant difference in baseline aneurysm size.
The phenomenon of paradoxical increased intra-aneurysmal flow post-FDS has been associated with the different locations of pipeline landing and the size of the device itself.23–25 Devices that are in locations that alter the structure of the stent, such as bends in the vessel, may modify the stent’s flow diversion capabilities. Additionally, oversizing can cause the cells of the stent to expand, allowing more fluid transudation.24 These factors may provide additional explanation to the paradoxical increase in intra-aneurysmal flow post-FDS in certain patients and further justify the long-term partial occlusion.
Although the use of contrast transit times seems as a surrogate in predicting post-FDS aneurysm occlusion likelihood seems promising, the results are controversial and studies are not standardized.26
Sadasivan et al., in their work, failed to show any significant difference in angiographic time-density curve parameters between patients with partial and complete aneurysm occlusion after FDS treatment. However, a good portion of their sample size included patients with multiple FDSs, and an inner control for the analysis (such as petrous ICA) was lacking, causing their data to be subject to injection rates, catheter location, and injected contrast volume variability.26
In our cohort, patients treated with multiple FDS were excluded, and the selection of a second ROI proximal to the aneurysm (petrous ICA) allowed minimization of technical variability among different patients.
Limitations of our study include the retrospective design, the relatively small number of the cohort, and DSA limitations, as image motion artifacts within the same angiographic run that might introduce confounders in the post-processing analysis. Additionally, our study based the treatment outcome on a six-months follow-up period that does not necessarily represent the definitive FDS result.
Nonetheless, our study provides an additional insight to the hemodynamic change after FDS deployment and its effect on treatment outcome. Prediction of long-term results with real-time DSA post-processing software seems promising, and it might provide additional support to the indication for immediate placement of a second FDS. Additional studies are needed to further validate our findings on a larger scale.
Conclusion
Intracranial aneurysms with negative change in the contrast time-density AUC post-FDS have less chance of aneurysm occlusion at follow-up. The decreased AUC ratio after stent indicates reduced contrast stagnation in the aneurysm and less chance of aneurysm occlusion. These data provide a real-time analysis at the end of the aneurysm treatment. If validated in larger datasets, this can provide a useful input to the surgeon to place an immediate second FDS in case of faster contrast time-density after the first stent deployment, avoiding a possible future reintervention.
Further validation is needed to determine if contrast time-density time reflects true flow velocity.
Declaration of conflicting interests
The authors declared no potential conflicts of interest with respect to the research, authorship, and/or publication of this article.
Funding
The authors received no financial support for the research, authorship, and/or publication of this article.
ORCID iD
Ali Alaraj https://orcid.org/0000-0002-1491-4634
References
- 1.Martinez-Galdamez M, Romance A, Vega P, et al. Pipeline endovascular device for the treatment of intracranial aneurysms at the level of the circle of Willis and beyond: multicenter experience. J Neurointerv Surg 2015; 7: 816–823. [DOI] [PubMed] [Google Scholar]
- 2.Kulcsar Z, Houdart E, Bonafe' A, et al. Intra-aneurysmal thrombosis as a possible cause of delayed aneurysm rupture after flow-diversion treatment. AJNR Am J Neuroradiol 2011; 32: 20–25. [DOI] [PMC free article] [PubMed] [Google Scholar]
- 3.O'Kelly CJ, Krings T, Fiorella D, et al. A novel grading scale for the angiographic assessment of intracranial aneurysms treated using flow diverting stents. Interv Neuroradiol 2010; 16: 133–137. [DOI] [PMC free article] [PubMed] [Google Scholar]
- 4.Cebral JR, Mut F, Raschi M, et al. Aneurysm rupture following treatment with flow-diverting stents: computational hemodynamics analysis of treatment. AJNR Am J Neuroradiol 2011; 32: 27–33. [DOI] [PMC free article] [PubMed] [Google Scholar]
- 5.Kamran M, Yarnold J, Grunwald IQ, et al. Assessment of angiographic outcomes after flow diversion treatment of intracranial aneurysms: a new grading schema. Neuroradiology 2011; 53: 501–508. [DOI] [PubMed] [Google Scholar]
- 6.Grunwald IQ, Kamran M, Corkill RA, et al. Simple measurement of aneurysm residual after treatment: the SMART scale for evaluation of intracranial aneurysms treated with flow diverters. Acta Neurochir (Wien) 2012; 154: 21–26. [DOI] [PubMed] [Google Scholar]
- 7.Park MS, Mazur MD, Moon K, et al. An outcomes-based grading scale for the evaluation of cerebral aneurysms treated with flow diversion. J Neurointerv Surg 2017; 9: 1060–1063. [DOI] [PubMed] [Google Scholar]
- 8.Becske T, Brinjikji W, Potts MB, et al. Pipeline for uncoilable or failed aneurysms: results from a multicenter clinical trial. Radiology 2013; 267: 858–868. [DOI] [PubMed] [Google Scholar]
- 9.Kallmes DF, Brinjikji W, Boccardi E, et al. Aneurysm Study of Pipeline in an Observational Registry (ASPIRe). Interv Neurol 2016; 5: 89–99. [DOI] [PMC free article] [PubMed] [Google Scholar]
- 10.Adeeb N, Moore JM, Wirtz M, et al. Predictors of incomplete occlusion following pipeline embolization of intracranial aneurysms: is it less effective in older patients? AJNR Am J Neuroradiol 2017; 38: 2295–2300. [DOI] [PMC free article] [PubMed] [Google Scholar]
- 11.Paliwal N, Tutino VM, Shallwani H, et al. Ostium ratio and neck ratio could predict the outcome of sidewall intracranial aneurysms treated with flow diverters. AJNR Am J Neuroradiol 2019; 40: 288–294. [DOI] [PMC free article] [PubMed] [Google Scholar]
- 12.Maragkos GA, Ascanio LC, Salem MM, et al. Predictive factors of incomplete aneurysm occlusion after endovascular treatment with the Pipeline embolization device. J Neurosurg 2019; 26: 1–8. [DOI] [PubMed] [Google Scholar]
- 13.Brunozzi D, Shakur SF, Charbel FT, et al. Intracranial contrast transit times on digital subtraction angiography decrease more in patients with delayed intraparenchymal hemorrhage after pipeline. Interv Neuroradiol 2018; 24: 140–145. [DOI] [PMC free article] [PubMed] [Google Scholar]
- 14.Hussein AE, LInninger A, Shakur SF, et al. Changes in contrast transit times on digital subtraction angiography post-Pipeline Embolization Device deployment. Interv Neuroradiol 2017; 23: 137–142. [DOI] [PMC free article] [PubMed] [Google Scholar]
- 15.Ivanov A, Linninger A, Hsu CY, et al. Correlation between angiographic transit times and neurological status on admission in patients with aneurysmal subarachnoid hemorrhage. J Neurosurg 2016; 124: 1093–1099. [DOI] [PubMed] [Google Scholar]
- 16.Brunozzi D, Hussein AE, Shakur SF, et al. Contrast time-density time on digital subtraction angiography correlates with cerebral arteriovenous malformation flow measured by quantitative magnetic resonance angiography, angioarchitecture, and hemorrhage. Neurosurgery 2018; 83: 210–216. [DOI] [PubMed] [Google Scholar]
- 17.Shakur SF, Brunozzi D, Hussein AE, et al. Validation of cerebral arteriovenous malformation hemodynamics assessed by DSA using quantitative magnetic resonance angiography: preliminary study. J Neurointerv Surg 2018; 10: 156–161. [DOI] [PubMed] [Google Scholar]
- 18.Tsang AC, Lai SS, Chung WC, et al. Blood flow in intracranial aneurysms treated with Pipeline embolization devices: computational simulation and verification with Doppler ultrasonography on phantom models. Ultrasonography 2015; 34: 98–108. [DOI] [PMC free article] [PubMed] [Google Scholar]
- 19.Damiano RJ, Tutino VM, Paliwal N, et al. Compacting a single flow diverter versus overlapping flow diverters for intracranial aneurysms: a computational study. AJNR Am J Neuroradiol 2017; 38: 603–610. [DOI] [PMC free article] [PubMed] [Google Scholar]
- 20.Tremmel M, Xiang J, Natarajan SK, et al. Alteration of intra-aneurysmal hemodynamics for flow diversion using enterprise and vision stents. World Neurosurg 2010; 74: 306–315. [DOI] [PMC free article] [PubMed] [Google Scholar]
- 21.Cebral JR, Mut F, Raschi M, et al. Strategy for analysis of flow diverting devices based on multi-modality image-based modeling. Int J Numer Method Biomed Eng 2014; 30: 951–968. [DOI] [PMC free article] [PubMed] [Google Scholar]
- 22.Brunozzi D, Shakur SF, Ismail R, et al. Correlation between contrast time-density time on digital subtraction angiography and flow: an in vitro study. World Neurosurg 2018; 110: e315–e320. [DOI] [PubMed] [Google Scholar]
- 23.Cattaneo GFM, Ding A, Jost T, et al. In vitro, contrast agent-based evaluation of the influence of flow diverter size and position on intra-aneurysmal flow dynamics using syngo iFlow. Neuroradiology 2017; 59: 1275–1283. [DOI] [PubMed] [Google Scholar]
- 24.Mut F, Cebral JR. Effects of flow-diverting device oversizing on hemodynamics alteration in cerebral aneurysms. AJNR Am J Neuroradiol 2012; 33: 2010–2006. [DOI] [PMC free article] [PubMed] [Google Scholar]
- 25.Aurboonyawat T, Blanc R, Schmidt P, et al. An in vitro study of silk stent morphology. Neuroradiology 2011; 53: 659–667. [DOI] [PubMed] [Google Scholar]
- 26.Sadasivan C, Dholakia R, Peeling L, et al. Angiographic assessment of the efficacy of flow diverter treatment for cerebral aneurysms. Interv Neuroradiol 2019; 25: 655–663. [DOI] [PMC free article] [PubMed] [Google Scholar]


