

Abstract
Deaths from the COVID-19 pandemic have disproportionately affected older adults and residents in nursing homes. Although emerging research has identified place-based risk factors for the general population, little research has been conducted for nursing home populations. This GIS-based spatial modeling study aimed to determine the association between nursing home-level metrics and county-level, place-based variables with COVID-19 confirmed cases in nursing homes across the United States. A cross-sectional research design linked data from Centers for Medicare & Medicaid Services, American Community Survey, the 2010 Census, and COVID-19 cases among the general population and nursing homes. Spatial cluster analysis identified specific regions with statistically higher COVID-19 cases and deaths among residents. Multivariate analysis identified risk factors at the nursing home level including, total count of fines, total staffing levels, and LPN staffing levels. County-level or place-based factors like per-capita income, average household size, population density, and minority composition were significant predictors of COVID-19 cases in the nursing home. These results provide a framework for examining further COVID-19 cases in nursing homes and highlight the need to include other community-level variables when considering risk of COVID-19 transmission and outbreaks in nursing homes.
Keywords: Nursing homes, COVID-19, Spatial analysis, Multilevel models
Graphical abstract
Highlights
-
•
Nursing home COVID-19 cases are clustered in the Northeast and Southeast US.
-
•
Community-level factors had the strongest association with nursing home cases.
-
•
Nursing home quality did not predict COVID-19 cases.
1. Introduction
The emerging coronavirus disease 2019 (COVID-19), caused by the severe acute respiratory syndrome coronavirus 2 (SARS-CoV-2), is an on-going global pandemic. In February 2020, community transmission of COVID-19 was first detected in the United States. The virus spread quickly often through asymptomatic carriers and by mid-July 2020 the US Center for Disease and Prevention (CDC) reported 138,000 deaths and 3.47 million confirmed cases (CDC, 2020). Severe complications from COVID-19 disproportionally affect specific demographic categories, including older adults, minorities, and those with compromised immune systems and coexisting morbidities (Jordan et al., 2020; CDC COVID Team, 2020). The CDC urged vulnerable locations like nursing homes, who provide care and services for older adults and those with compromised health, to be vigilant in the prevention and spread of COVID-19 (McMichael et al., 2020a, McMichael et al., 2020b). Yet, nursing homes account for approximately 40% of COVID-19 deaths in the U.S., upwards of 70–80% in Minnesota, Rhode Island, Connecticut, and New Hampshire (Lau-Ng et al., 2020), and are “ground zero” for the COVID-19 pandemic (Barnett and Grabowski, 2020). These COVID-19 outbreaks and resulting deaths among nursing home residents have persisted despite federal visitor restrictions beginning in mid-March (Chen et al., 2020).
Presently, approximately 1.3 million people are residing in 15,483 nursing homes in the US. As of July 13, the Centers for Medicare and Medicaid Services (CMS) reported 126,402 confirmed cases and 35,517 deaths in US nursing homes (Centers for Medicare and Medicaid Services, 2020). The residents living in nursing homes are one of the most vulnerable groups due to living in small double occupancy rooms, with little to no space between resident beds; they also often have multiple comorbid conditions, diminished physical, cognitive and immune systems, and many need assistance with activities of daily living. Residents are in close contact with staff who provide bathing, dressing, toileting, transferring, and eating support. Nursing assistants often provide care for approximately ten residents during their shift, which increases the probability of transmission due to the asymptomatic spread of COVID-19. In fact, one study reported 74% of the residents, and half of the staff were asymptomatic when tested (Dora et al., 2020). Nursing homes with a high census, and therefore higher resident density, may be at higher risk for the faster spread of COVID-19 (KFF, 2020). These factors make physical distancing almost impossible in nursing homes.
Nursing homes staffs' noncompliance with infection control and prevention practices contributed to infection control deficiencies being the most common deficiency nursing homes receive. Between the 2013–2017, 13,299 (82%) of the nation's nursing homes received at least one infection control deficiency (U.S. Government Accountability Office, 2020). Adequate infection control practices are paramount in preventing, mitigating, and controlling the spread of COVID-19 in nursing homes (CDC, 2020). Yet, personal protective equipment (PPE) - gowns, gloves, and masks - was limited for nursing homes during April and May of 2020. Supplies were limited due to the disruption of the supply chain and hospitals' prioritization to receive the available PPE, making it almost impossible for nursing homes to obtain PPE for staff (Brown, 2020).
As COVID-19 cases and associated deaths in the United States continue to rise, very few have examined the spatial distribution of COVID-19 cases and underlying disparities driving these patterns for the general population (e.g., Mollalo et al., 2020; Baum and Henry, 2020). And to the authors' knowledge, no studies have focused on the spatial patterning of COVID-19 cases in a nursing home setting, and the underlying risk factors driving these patterns. This analysis aims to examine the spatial distribution of nursing home COVID-19 cases and how nursing home level indicators and community-level variables influence the incidence of hotspots in COVID-19 infection rates across the nation to address this critical research gap. The use of geographic information systems (GIS) and spatial analysis lends an important perspective on clustering of COVID-19 cases that can be leveraged for community action by identifying the underlying factors driving disparate risk and adverse outcomes in vulnerable populations (Franch-Pardo et al., 2020). We hypothesize that community-based or place-based factors, such as racial disparities, will be significantly associated with nursing home outbreaks across the U.S. Given the absence of a vaccine or known treatment, prevention is the primary mitigation measure against COVID-19 outbreaks. The results from this study will illuminate factors responsible for geographic disparities that can be leveraged for targeted interventions and pinpoint the most effective strategies to eliminate outbreaks in nursing homes.
2. Background
The COVID-19 pandemic presents a critical and evolving case study of infection control for some of the most fragile individuals in the U.S. healthcare system, residents in nursing homes, who are older adults with multiple chronic comorbidities or are immunocompromised and individuals with disabilities (Barnett and Grabowski, 2020). Infectious disease outbreaks are frequent in these facilities, particularly seasonal influenza and norovirus. Reports indicate that infectious disease outbreaks in the United States, such as non-foodborne norovirus, occurred predominantly in long-term care facilities (Hall et al., 2014, Loeb et al., 2000 Barnett and Grabowski, 2020). Unlike a home residence, nursing home residents live in close proximity with caregivers moving throughout the nursing home, increasing the spread of infection. As the COVID-19 virus is a contagious respiratory virus with asymptomatic spread, congregate settings like nursing homes, jails, and homeless shelters are particularly vulnerable to COVID-19 outbreaks (Baggett et al., 2020, Barnett and Grabowski, 2020). In addition, staffing shortages, frequent staff turnover, and supply shortages are well-documented and were common before the COVID-19 pandemic (Dorritie et al., 2020) The combination of these factors makes the COVID-19 pandemic a crisis for nursing homes, that will require immediate support from policymakers and clinicians (Grabowski and Mor, 2020).
Early studies have suggested that facility characteristics, staffing, and demographic makeup of residents have influenced the number of cases that nursing homes have reported. One study of nursing home related COVID-19 cases in 38 states found facility characteristics such as larger size, urban location, not being part of a multi-facility corporation and having a higher percentage of Black/African American residents was associated with the probability of having at least one COVID-19 case, and larger facilities and for-profit facilities had more COVID-19 cases (Abrams et al., 2020). A study of COVID-19 in Connecticut nursing homes indicated that lower RN staffing, lower quality scores (star rating system - fewer stars) and having more socio-demographic disadvantaged residents was associated with having more confirmed cases (Li et al., 2020). Figueroa et al. (2020) found that among eight U.S. states, there was no significant difference in the burden of COVID-19 cases between high and low performing nursing homes. Instead, factors such as nursing staffing shortages play a more substantial role in COVID-19 infectious spread; warranting swift public policies that motivate immediate staffing support.
Geographic Information Systems (GIS) and spatial analysis can quickly map the distribution and diffusion of diseases and have been recently applied to COVID-19 data to understand the distribution and place-based or contextual risk factors for increased COVID-19 incidence among the general population. These studies have found that selected socioeconomic factors, including population density, proportions of older adults, poverty, and testing at the state level, increase the incidence of COVID-19 (Zhang and Schwartz, 2020). Moreover, GIS provides spatial clustering analysis capability to identify areas with high COVID-19 cases (Baum and Henry, 2020) and have yet to be applied to specific-vulnerable populations like older adults, those with disabilities, or nursing home populations.
Globally, over 63 studies worldwide have examined COVID-19 using geographic information systems (GIS), with studies focusing on spatiotemporal analysis, data mining, environmental variables, and health and social geography (Franch-Pardo et al., 2020). Predictive modeling or studies that evaluate place-based risk factors have frequently focused on climatic variables rather than socio-demographic and economic variables (Franch-Pardo et al., 2020). In the U.S, Mollalo et al. (2020) found that place-based factors like median household income, income inequality, percentage of nurse practitioners, and the percentage of Black female population explain significant variation in COVID-19 incidence at the county-level. Others have shown strong evidence of the spatial effects of COVID-19 with county-level socioeconomic factors in neighboring counties influencing incidence rates in the U.S. (Baum and Henry, 2020).
Community-level factors or neighborhood-level factors are the contextual effects of place that influence health outcomes. To date, these place-based factors have yet to be tied with nursing home level metrics to predict COVID-19 spread and occurrence. Unlike traditional neighborhood-level studies that examine human health in the context of community-level factors after controlling for compositional (individual-level) characteristics, we will control for nursing home metrics as a compositional variable to understand the spread of COVID-19 (Duncan and Kawachi, 2018). This research design is conventional in “neighborhoods and health” research and a necessary precursor to leverage more robust research designs, including experimental, quasi-experimental, and longitudinal design, which allow for a better understanding of how dimensions of place influence COVID-19 outbreaks (Schmidt et al., 2018). It is imperative that we understand which nursing homes are more likely to experience COVID-19 cases and outbreaks to prevent and mitigate future COVID-19 deaths.
3. Data
3.1. Nursing home and community data
Data on nursing home characteristics were collected from the Centers for Medicare and Medicaid Services (CMS), including COVID-19 infection data for staff and residents. CMS nursing homes compare facility files and CMS nursing home COVID-19 infection files (as of June 30, 2020) were merged using the CMS provider number given to each nursing home (CMS, 2020). CMS nursing home compare facility files were initially compiled for facility files annually from 2015 to 2018 and monthly archives for January 2019 to April 2020 since annual records were not yet available. The final data set included only nursing homes that reported every year since 2015 (n = 14,886 nursing homes) to reduce potential problems related to new nursing homes. Approximately 92% (n = 13,709 nursing homes) reported whether they had a confirmed or suspected COVID-19 case. Nursing home variables for 2020 included: number of beds, number of residents, number of health deficiencies, number of fire deficiencies, number of deficiencies related to infection, number of deficiencies related to facility closure, overall rating, survey rating, quality rating, staffing rating, RN staffing level (adjusted to be comparable across the US), LPN staffing levels (adjusted to be comparable across the US), nurse aide staffing level (adjusted to be comparable across the US), total staffing level (adjusted to be comparable across the US), number of fines, the number of penalties for the year, whether the facility changed ownership in the last 12 months, and the ownership type (e.g., for-profit, not for profit). CMS infection files included information on cumulative COVID-19 resident cases (suspected and confirmed) and COVID-19 resident deaths, as well as, COVID-19 staffing cases/deaths. In this study, a COVID-19 case among a nursing home resident was defined as suspected and confirmed COVID-19 cases in a nursing home setting.
Data on the housing, socioeconomic, and demographics of the county's population were extracted from the 2012–2016 American Community Survey (5-year estimates) to identify contextual socio-environmental relationships. Variables included: % female, % of each age group, % Hispanic, average household size, % unemployed over 16, per capita income, average gross rent, % families below poverty level, % of households with no vehicle, % of each nationality/country foreign-born population. The population density was calculated per square mile and used as a proxy for rurality from this data using the 2010 Census. These variables were selected based on a prior literature on the underlying social vulnerability in a community setting (e.g., SoVI, Cutter et al., 2003) and the potential impact to nursing home populations in the context of a disaster (Wilson et al., 2019; Wilson et al., 2020).
4. Methods
4.1. Cluster analysis
Exploratory spatial data analysis examined spatial autocorrelation of COVID-19 cases. Spatial autocorrelation is a measure of similarity (correlation) between nearby observations (Li et al., 2020). Hot spot analysis (Getis-Ord Gi*) was applied to identify statistically significant hot spots of COVID-19 cases adjusted for underlying population at the county-level and among nursing homes (Getis and Ord, 1992). Spatial relationships between neighbors were conceptualized by the contiguity of edges and corners, known as Queen's Case. The Getis-Ord statistic results are presented at the 95% confidence level using Environmental System Research Institute's software ArcGIS Pro 2.5 (ESRI, 2019).
4.2. Variable selection and multilevel modeling
A two-stage regression approach was applied. First, variables were selected based on backward stepwise regression, using a general linear model and Poisson distribution for the nursing home facility data and the county-level data. Final variables for the nursing home data included: Quality Rating (QUALITY_RATING_2020), Staffing Rating (STAFFING_RATING_2020), LPN staffing level (ADJ_LPN_STF_2020), Total Staff (ADJ_TOTAL_STF_2020), Number of fines for the year (FINE_CNT_2020) and Ownership (OWNERSHIP_2020). Final variables for the county-level data included: % Total Population: Hispanic or Latino (PCT_SE_A04001_010), Average Household Size (SE_A10003_001), % Civilian Population in Labor Force 16 Years and Over: Unemployed (PCT_SE_A17005_003), Per Capita Income (SE_A14024_001), Average Gross Rent for renter-occupied Housing Units (SE_A18005_001), Population per Square Mile (POP10_SQMI), Percentage of African American (PERCENT_AA), Percentage of Native American (PERCENT_AMERI_ESI), Percentage of Asain (PERCENT_ASIA), and the COVID-19 county rate for the general population (COVID_COUNTY_RATE). Multicollinearity among variables was addressed using tolerance and variance inflation factor (VIF) analysis as VIF signifies if the variance is inflated due to collinearity among independent variables (Craney and Surles, 2002). VIF values were high for Average Gross Rent for renter-occupied Housing Units (SE_A18005_001, VIF = 6.47); therefore, this variable was removed from the regression. All other VIF values among variables were less than five, indicating no significant multicollinearity. Correlation matrices and VIF values can be found in the supplementary materials (Table S1, Fig. S1, Fig. S2).
Supplemental Fig. 1.

Correlation matrix between nursing home metrics.
Supplemental Fig. 2.

Correlation matrix between county-level variables.
Secondly, Generalized Linear Mixed-Effect models with random effect were applied to determine the factors responsible for cumulative COVID-19 nursing home cases at both spatial scales (e.g., county and nursing home-level) using a Poisson distribution. Nursing home-level data was matched to county-level data by geocoding nursing home locations and spatially joining nursing homes within their respective counties. Models included a random effect term allowing for nesting of nursing homes within their respective county (random intercepts model). The highest p-values were removed from the models one at a time until all variables remaining were significant at alpha = 0.10. Marginal R squared values were used to assess model fit for fixed effects and overall model fit and describe the variance explained by the fixed effects (Orelien and Edwards, 2008). To examine regional differences in geographic clustering of nursing home and county-level factors on COVID-19 transmission, we stratified results by CMS region. We calculated rate ratios (cumulative incidence rate of COVID-19 cases in counties with a nursing home outbreak/incidence rate of COVID-19 cases in counties without a nursing home outbreak) and standard deviation with 95% confidence intervals and p-values for the fixed part of the model and standard deviation with 95% confidence intervals for the random effects. The analysis was conducted in R and the packages lme4 (Bates et al. 2018) and tables were created using sjPlot (Lüdecke, 2018). Spatial analysis, map creation, and nursing home geocoding was performed in ArcGIS Pro 2.5 (ESRI, 2019).
5. Results
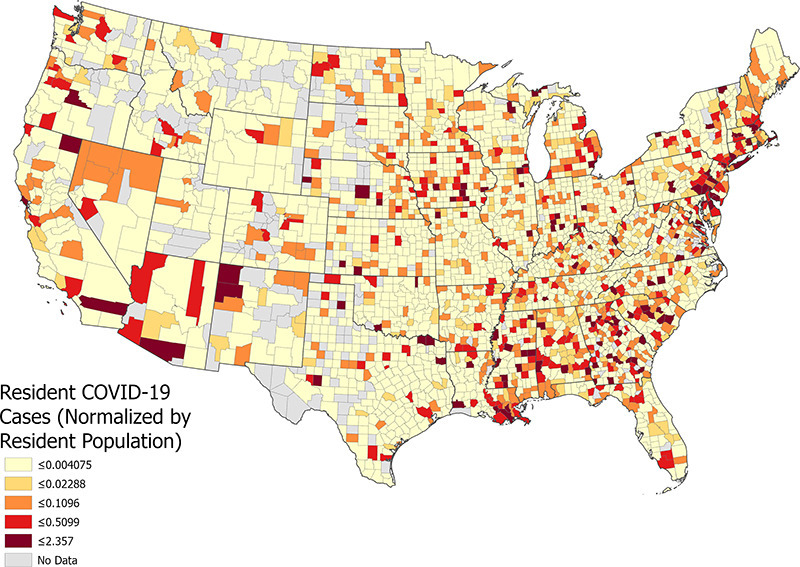
The 13,709 nursing homes in the US, had on average, 11.32 confirmed cases per nursing home as of June 30, 2020, with 60.7% (n = 8319) of the nursing homes reporting no cases and 39.3% (n = 5390) reporting at least one COVID-19 case. On average, nursing homes with COVID-19 cases had a significantly larger resident population, higher number of penalties, more health deficiencies, and lower total staff and aid staff. Nursing homes with COVID-19 cases also were found in high-density communities (higher population density) and counties with a more significant proportion of minority residents (e.g., African American Hispanic, Asian) (Table 1 ). Fig. 1 shows the distribution of COVID-19 cases and deaths among nursing home residents, staff, and the general population in counties across the United States.
Table 1.
Descriptive table comparing nursing homes with at least one COVID-19 cases (suspected or confirmed) to nursing homes with no COVID-19 cases.
| Nursing home | COVID-19 case |
p | |
|---|---|---|---|
| No n = 8319 |
Yes n = 5390 |
||
| Total residents (mean (SD)) | 74.10 (38.06) | 107.98 (64.54) | <0.001 |
| Survey rating (%)a | |||
| (Low quality) 1 | 1539 (18.6) | 1093 (20.4) | <0.001 |
| 2 | 1873 (22.6) | 1406 (26.2) | |
| 3 | 1942 (23.5) | 1219 (22.7) | |
| 4 | 2003 (24.2) | 1167 (21.8) | |
| (High quality) 5 | 916 (11.1) | 474 (8.8) | |
| Quality rating (%)b | |||
| (Low quality) 1 | 558 (6.7) | 238 (4.4) | <0.001 |
| 2 | 1202 (14.5) | 615 (11.5) | |
| 3 | 1692 (20.5) | 1066 (19.9) | |
| 4 | 2090 (25.3) | 1371 (25.6) | |
| (High quality) 5 | 2725 (33.0) | 2069 (38.6) | |
| Staffing rating (%)c | |||
| (Low quality) 1 | 1205 (14.6) | 589 (11.0) | <0.001 |
| 2 | 2019 (24.5) | 1444 (27.1) | |
| 3 | 2273 (27.6) | 1574 (29.5) | |
| 4 | 1774 (21.5) | 1168 (21.9) | |
| (High quality) 5 | 975 (11.8) | 562 (10.5) | |
| Adjusted RN staff (mean (SD)) | 0.71 (0.47) | 0.69 (0.42) | 0.079 |
| Adjusted LPN staff (mean (SD)) | 0.86 (0.34) | 0.87 (0.32) | 0.236 |
| Adjusted aide staff (mean (SD)) | 2.33 (0.56) | 2.27 (0.53) | <0.001 |
| Adjusted total staff (mean (SD)) | 3.89 (0.89) | 3.81 (0.80) | <0.001 |
| Number of fines (mean (SD)) | 0.45 (0.80) | 0.50 (0.86) | <0.001 |
| Total dollar fines (mean (SD)) | 14,726.65 (51,627.97) | 14,978.95 (46,659.96) | 0.772 |
| The number of penalties (mean (SD)) | 0.56 (1.00) | 0.59 (1.01) | 0.087 |
| Weighted all cycles score (mean (SD)) | 60.47 (67.52) | 61.49 (64.95) | 0.384 |
| Special focus facility (mean (SD)) | 0.01 (0.07) | 0.01 (0.08) | 0.865 |
| Changed ownership in the last 12 months (%) | |||
| 0 | 8074 (97.1) | 5269 (97.8) | 0.015 |
| 1 | 245 (2.9) | 121 (2.2) | |
| The type of organization that owns facility (%) | |||
| Corporation | 4288 (51.5) | 2798 (51.9) | <0.001 |
| Individual | 416 (5.0) | 252 (4.7) | |
| Limited liability company | 657 (7.9) | 454 (8.4) | |
| Partnership | 390 (4.7) | 326 (6.0) | |
| City | 63 (0.8) | 22 (0.4) | |
| City/County | 53 (0.6) | 18 (0.3) | |
| County | 230 (2.8) | 138 (2.6) | |
| Federal | 10 (0.1) | 3 (0.1) | |
| Hospital district | 153 (1.8) | 40 (0.7) | |
| State | 86 (1.0) | 52 (1.0) | |
| Church related | 250 (3.0) | 166 (3.1) | |
| Corporation | 1543 (18.5) | 956 (17.7) | |
| Other | 180 (2.2) | 165 (3.1) | |
| Number of health deficiencies (mean (SD)) | 20.55 (13.16) | 21.93 (14.45) | <0.001 |
| Number of fire deficiencies (mean (SD)) | 9.11 (7.29) | 9.04 (7.80) | 0.569 |
| Number of deficiencies related to infection (mean (SD)) | 10.94 (6.87) | 11.26 (7.35) | 0.012 |
| County level | |||
| Total County population (mean (SD)) | 566,021.71 (1,398,166.52) | 1,098,431.35 (2,024,708.15) | <0.001 |
| - % Civilian population in labor force 16 years and over: unemployed (mean (SD)) | 8.88 (2.86) | 9.25 (2.67) | <0.001 |
| Per capita income (in 2012 inflation-adjusted dollars) (mean (SD)) | 25,400.70 (5506.11) | 28,679.15 (7308.97) | <0.001 |
| Average gross rent for renter-occupied housing units (mean (SD)) | 749.24 (250.12) | 897.75 (278.91) | <0.001 |
| Families: income in 2012 below poverty level (mean (SD)) | 11.24 (4.40) | 10.72 (4.71) | <0.001 |
| % Occupied housing units: no vehicle available (mean (SD)) | 7.06 (3.96) | 9.39 (8.46) | <0.001 |
| 2010 census: % population in nursing facilities (mean (SD)) | 0.67 (0.41) | 0.59 (0.32) | <0.001 |
| Population per square mile (mean (SD)) | 661.64 (1947.35) | 2017.47 (5638.04) | <0.001 |
| Percent of African American (mean (SD)) | 0.09 (0.11) | 0.12 (0.13) | <0.001 |
| Percent of American Indian (mean (SD)) | 0.01 (0.03) | 0.01 (0.03) | <0.001 |
| Percent of Asian (mean (SD)) | 0.02 (0.04) | 0.04 (0.04) | <0.001 |
| Percent Hispanic (mean (SD)) | 0.09 (0.10) | 0.11 (0.09) | <0.001 |
| COVID County rate (mean (SD)) | 0.01 (0.01) | 0.01 (0.01) | <0.001 |
Measures based on outcomes from state health inspections: Nursing homes that participate in the Medicare or Medicaid programs have an unannounced, onsite comprehensive inspection, also called a survey, about once per year. CMS bases facility ratings for the health inspection domain on the number, scope, and severity of deficiencies identified during the three most recent annual standard inspections, as well as on substantiated findings from complaint investigations during the most recent 36 months. The cut points are based on facility health inspection scores and are set separately for each state to achieve this distribution: • 5 stars: ≤10th percentile • 4 stars: >10th percentile and ≤ 33.33rd percentile • 3 stars: >33.33rd percentile and ≤ 56.667th percentile • 2 stars: >56.667th percentile and ≤ 80th percentile • 1 star: >80th percentile.
Measures based on resident-level quality measures (QMs): Facility ratings for the quality measures are based on performance on 11 (8 long-stay and 3 short-stay) of the 18 QMs that CMS currently posts on the Nursing Home Compare website. The QMs use data from the Minimum Data Set (MDS), which each nursing home submits as part of a federally mandated process for clinical assessment of all residents in Medicare or Medicaid certified nursing homes.
Measures based on nursing home staffing levels: CMS bases facility staffing ratings on two components: 1) Registered nurse (RN) hours per resident day; and 2) total staffing hours (RN+ licensed practical nurse (LPN) + Nurse aide hours) per resident day. The staffing measures are case mix adjusted for different levels of resident care needs across nursing homes. The cut points are based on adjusted staff hours per resident per day with higher staffing levels earning more stars.
Fig. 1.

Geographic distribution of Confirmed COVID-19 Cases (upper, far left), Nursing Home Resident COVID-19 cases (upper, far right), Staff Covid-19 Cases (lower, far left), Nursing Home Resident COVID-19 Deaths (lower, far right).
5.1. Geographic clustering results
Of the 13,709 nursing homes, 3% (n = 85 counties) of them resided in locations identified as having a significantly high level of COVID-19 cases at the 95% confidence level (Fig. 2 ). We found statistically significant clustering of COVID-19 cases in nursing homes in South Carolina, Georgia, Kentucky, and parts of Mississippi and southern Louisiana. Significant clustering of COVID-19 cases were also found in the Northeastern United States (New Jersey, Massachusetts, Connecticut, and New York), locations that were early emergers in the epidemic. Nursing home COVID-19 clustering was similar to county-level COVID-19 clustering among the general population in the Northeast and limited parts of the Southeastern US (e.g., southwestern GA and southern LA). In comparison, high COVID-19 clustering for the general population was found in Arizona and did not correspond to nursing home resident cases.
Fig. 2.

Hot Spot Analysis (Spatial Clustering) of Nursing Home COVID-19 cases (top) and general population COVID-19 cases (bottom).
5.2. Modeling analysis
Table 2 illustrates the model results, which examine the effects of nursing home-level variables and county-level variables on COVID-19 cases in a nursing home setting. In general, we observed that COVID-19 transmission in US nursing homes was positively associated with facility-based factors such as staffing levels, the number of nursing home fines in 2020, as well as the following community-level factors: county rates of COVID-19, civilian labor force, percent of the total population that is African American, and per capita income. The fixed effects predicted up to 18.3% of the variation in COVID-19 cases (Table 2). The relatively low adjusted R2 suggests that nearly 87.3% of COVID-19 cumulative incidence rates across the U.S. are related to unknown variables not included in the model and may be due to local variations that are not captured. However, our results provide a good baseline for regional model exploration. To further explore the role of per capita income, counties were subdivided into income quantiles to improve interpretation. A separate model was run for only per-capita income and nursing home COVID-19 cases. The risk of transmission in nursing homes located in counties characterized by higher income quartiles was 0.85 times the COVID-19 rate for nursing homes in lower-income counties.
Table 2.
Multilevel mixed-effects Poisson regression models predicting cumulative COVID-19 cases in Nursing Homes across US counties. The first model (left) includes all variables from the subset regression model and the second model (right) includes only significant independent variables.
| Predictors | U.S. COVID-19 cases in nursing homes |
|||||
|---|---|---|---|---|---|---|
| Rate ratios | CI | p | Rate ratios | CI | p | |
| (Intercept) | 0.38 | 0.28–0.50 | <0.001 | 0.53 | 0.53–0.53 | <0.001 |
| OWNERSHIP - GOVERNMENT | 1.26 | 1.00–1.60 | 0.051 | |||
| OWNERSHIP- NON-PROFIT | 1.02 | 0.89–1.17 | 0.775 | |||
| QUALITY_RATING- 2 | 1.04 | 0.80–1.36 | 0.748 | |||
| QUALITY_RATING - 3 | 1.26 | 0.98–1.62 | 0.073 | |||
| QUALITY_RATING - 4 | 1.21 | 0.94–1.56 | 0.133 | |||
| QUALITY_RATING - 5 | 1.26 | 0.98–1.61 | 0.075 | |||
| STAFFING RATING - 2 | 1.35 | 1.12–1.64 | 0.002 | |||
| STAFFING RATING – 3 | 1.24 | 1.02–1.52 | 0.035 | |||
| STAFFING RATING – 4 | 1.09 | 0.86–1.38 | 0.481 | |||
| STAFFING RATING – 5 | 0.85 | 0.62–1.18 | 0.336 | |||
| LPN staffing levels | 1.07 | 1.00–1.15 | 0.054 | 1.16 | 1.16–1.16 | <0.001 |
| Total staff | 0.86 | 0.78–0.94 | 0.001 | 0.78 | 0.78–0.78 | <0.001 |
| COVID-19 rate (County) | 1.83 | 1.70–1.97 | <0.001 | 1.86 | 1.86–1.86 | <0.001 |
| Number of fines for 2020 | 1.13 | 1.07–1.19 | <0.001 | 1.13 | 1.13–1.13 | <0.001 |
| % Civilian population in labor force 16 years and over: unemployed | 1.26 | 1.16–1.36 | <0.001 | 1.32 | 1.32–1.32 | <0.001 |
| % Total population: Asian | 1.08 | 0.96–1.20 | 0.190 | |||
| % Total population: American Indian | 0.93 | 0.87–1.00 | 0.044 | |||
| % Total population: African American | 1.30 | 1.20–1.41 | <0.001 | 1.27 | 1.27–1.27 | <0.001 |
| Population per sq. mile (2010) | 1.10 | 1.00–1.20 | 0.042 | 1.12 | 1.12–1.12 | <0.001 |
| Average household size | 1.18 | 1.07–1.31 | 0.001 | 1.26 | 1.26–1.26 | <0.001 |
| Per capita income | 2.20 | 2.00–2.42 | <0.001 | 2.48 | 2.48–2.49 | <0.001 |
| Random effects | ||||||
| σ2 | 7.52 | 7.64 | ||||
| τ00 | 6.02 PROVNUM:FIPS | 6.13 PROVNUM:FIPS | ||||
| 0.66 FIPS | 0.69 FIPS | |||||
| ICC | 0.08 | 0.08 | ||||
| N | 13,294 PROVNUM | 13,367 PROVNUM | ||||
| 2758 FIPS | 2764 FIPS | |||||
| Observations | 13,294 | 13,367 | ||||
| Marginal R2/conditional R2 | 0.171/0.238 | 0.183/0.250 | ||||
CI = confidence intervals; Marginal R2 = proportion of variance explained by the fixed effects in the model; Conditional R2 = proportion of variance explained by the fixed and random effects combined in the model; ICC = intraclass correlation coefficient; Sigma2 = within-group (residual) variance; Tau 00 = between-group variance (variation between individual intercepts and average intercepts) (Hox, 2002).
Bolded p-values represent significant values.
5.3. Modeling analysis by geographic location
The US was subdivided into the ten CMS regions to identify the underlying risk factors for COVID-19 in nursing homes (Fig. 3 ). Table 3 shows the results for each CMS region. Results revealed that county-level COVID-19 and per-capita income were the most significant predictors of COVID-19 outbreaks within nursing homes and identified for each of the ten regions. The model explained the most variation for Region 2 (0.316), Region 3 (0.277), Region 1 (0.231), Region 5 (0.197), and Region 8 (0.157).
Fig. 3.
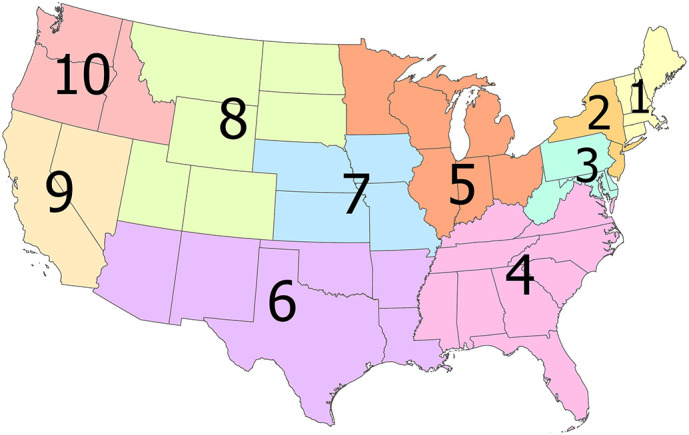
Centers for Medicare and Medicaid (CMS) Regions used for stratified analysis by geography.
Table 3.
Multilevel mixed-effect Poisson regression models predicting cumulative COVID-19 cases by CMS Region. CMS Regions are found in Fig. 3.
| Predictors | Region 1 |
Region 2 |
Region 3 |
Region 4 |
Region 5 |
||||||||||
|---|---|---|---|---|---|---|---|---|---|---|---|---|---|---|---|
| RR | CI | p | RR | CI | p | RR | CI | p | RR | CI | p | RR | CI | p | |
| (Intercept) | 4.33 | 3.54–5.28 | <0.001 | 5.63 | 4.29–7.37 | <0.001 | 1.37 | 1.10–1.70 | 0.004 | 0.44 | 0.36–0.54 | <0.001 | 0.47 | 0.40–0.56 | <0.001 |
| LPN staffing levels | 1.36 | 1.13–1.63 | 0.001 | 1.14 | 0.95–1.38 | 0.166 | 1.20 | 1.00–1.44 | 0.050 | 1.19 | 1.02–1.39 | 0.030 | 1.17 | 1.03–1.33 | 0.013 |
| Total staff | 0.74 | 0.62–0.88 | 0.001 | 0.70 | 0.59–0.83 | <0.001 | 0.56 | 0.46–0.67 | <0.001 | 0.89 | 0.76–1.04 | 0.134 | 1.01 | 0.89–1.14 | 0.888 |
| COVID-19 rate (County) | 2.19 | 1.48–3.23 | <0.001 | 1.62 | 0.90–2.92 | 0.105 | 2.45 | 1.96–3.05 | <0.001 | 1.56 | 1.35–1.79 | <0.001 | 1.46 | 1.24–1.73 | <0.001 |
| Number of fines for 2020 | 1.05 | 0.89–1.25 | 0.535 | 1.26 | 1.08–1.46 | 0.003 | 1.19 | 1.03–1.38 | 0.016 | 1.20 | 1.05–1.37 | 0.009 | 1.26 | 1.13–1.41 | <0.001 |
| Unemployed | 0.97 | 0.69–1.37 | 0.871 | 1.30 | 0.90–1.88 | 0.164 | 1.29 | 0.96–1.73 | 0.089 | 0.89 | 0.76–1.05 | 0.168 | 1.65 | 1.39–1.97 | <0.001 |
| % Total population: African American | 1.40 | 0.95–2.06 | 0.093 | 1.60 | 1.06–2.40 | 0.025 | 0.89 | 0.68–1.17 | 0.405 | 1.26 | 1.07–1.48 | 0.007 | 1.03 | 0.81–1.31 | 0.808 |
| Population per sq. mile (2010) | 0.74 | 0.54–1.01 | 0.059 | 0.97 | 0.65–1.44 | 0.880 | 1.26 | 0.93–1.72 | 0.142 | 1.21 | 0.97–1.50 | 0.087 | 1.60 | 1.20–2.14 | 0.001 |
| Average household size | 1.02 | 0.76–1.36 | 0.900 | 1.30 | 0.78–2.16 | 0.317 | 1.25 | 1.02–1.53 | 0.029 | 1.37 | 1.18–1.60 | <0.001 | 1.14 | 0.99–1.31 | 0.077 |
| Per capita income | 1.36 | 1.01–1.84 | 0.046 | 2.71 | 1.92–3.84 | <0.001 | 2.04 | 1.53–2.72 | <0.001 | 1.21 | 0.99–1.49 | 0.059 | 2.00 | 1.69–2.38 | <0.001 |
| Random effects | |||||||||||||||
| σ2 | 5.10 | 4.26 | 5.84 | 8.81 | 8.27 | ||||||||||
| τ00 | 4.60 PROVNUM:FIPS | 3.88 PROVNUM:FIPS | 4.94 PROVNUM:FIPS | 7.53 PROVNUM:FIPS | 6.65 PROVNUM:FIPS | ||||||||||
| 0.07 FIPS | 0.57 FIPS | 0.41 FIPS | 0.24 FIPS | 0.16 FIPS | |||||||||||
| ICC | 0.01 | 0.12 | 0.07 | 0.03 | 0.02 | ||||||||||
| N | 813 PROVNUM | 843 PROVNUM | 1261 PROVNUM | 2407 PROVNUM | 2933 PROVNUM | ||||||||||
| 65 FIPS | 81 FIPS | 252 FIPS | 683 FIPS | 508 FIPS | |||||||||||
| Observations | 813 | 843 | 1261 | 2407 | 2933 | ||||||||||
| Marginal R2/conditional R2 | 0.231/0.242 | 0.316/0.396 | 0.277/0.324 | 0.065/0.090 | 0.197/0.212 | ||||||||||
| Predictors | Region 6 |
Region 7 |
Region 8 |
Region 9 |
Region 10 |
||||||||||
|---|---|---|---|---|---|---|---|---|---|---|---|---|---|---|---|
| RR | CI | p | RR | CI | p | RR | CI | p | RR | CI | p | RR | CI | p | |
| (Intercept) | 0.13 | 0.09–0.18 | <0.001 | 0.16 | 0.12–0.22 | <0.001 | 0.25 | 0.17–0.38 | <0.001 | 0.71 | 0.57–0.88 | 0.002 | 0.39 | 0.39–0.39 | <0.001 |
| LPN staffing levels | 1.17 | 0.93–1.48 | 0.169 | 1.01 | 0.81–1.25 | 0.931 | 1.18 | 0.88–1.58 | 0.280 | 1.09 | 0.89–1.34 | 0.399 | 1.12 | 1.12–1.12 | <0.001 |
| Total staff | 0.74 | 0.59–0.94 | 0.012 | 0.99 | 0.80–1.22 | 0.905 | 1.05 | 0.78–1.42 | 0.735 | 0.69 | 0.56–0.85 | <0.001 | 0.95 | 0.94–0.95 | <0.001 |
| COVID-19 rate (County) | 1.68 | 1.37–2.06 | <0.001 | 1.92 | 1.56–2.36 | <0.001 | 2.10 | 1.52–2.90 | <0.001 | 1.84 | 1.50–2.26 | <0.001 | 1.99 | 1.99–1.99 | <0.001 |
| Number of fines for 2020 | 0.88 | 0.73–1.05 | 0.163 | 1.17 | 0.96–1.42 | 0.113 | 0.91 | 0.69–1.20 | 0.504 | 1.15 | 0.97–1.36 | 0.117 | 0.90 | 0.90–0.90 | <0.001 |
| Unemployed | 1.04 | 0.82–1.31 | 0.754 | 1.59 | 1.18–2.14 | 0.002 | 1.41 | 0.99–2.02 | 0.056 | 1.00 | 0.76–1.31 | 0.975 | 1.36 | 1.36–1.36 | <0.001 |
| % Total population: African American | 1.85 | 1.46–2.36 | <0.001 | 0.70 | 0.44–1.11 | 0.129 | 1.48 | 0.99–2.23 | 0.058 | 1.16 | 0.96–1.40 | 0.134 | 1.27 | 1.27–1.27 | <0.001 |
| Population per sq. mile (2010) | 0.87 | 0.64–1.18 | 0.371 | 1.68 | 1.04–2.70 | 0.033 | 0.86 | 0.59–1.27 | 0.454 | 1.45 | 1.19–1.77 | <0.001 | 0.98 | 0.98–0.98 | <0.001 |
| Average household Size | 1.17 | 0.94–1.47 | 0.158 | 0.80 | 0.63–1.01 | 0.057 | 0.94 | 0.68–1.32 | 0.727 | 1.39 | 1.13–1.71 | 0.002 | 1.24 | 1.23–1.24 | <0.001 |
| Per capita income | 2.08 | 1.65–2.64 | <0.001 | 2.18 | 1.67–2.86 | <0.001 | 1.95 | 1.41–2.68 | <0.001 | 1.42 | 1.05–1.92 | 0.024 | 1.77 | 1.77–1.78 | <0.001 |
| Random effects | |||||||||||||||
| σ2 | 11.92 | 10.18 | 8.57 | 8.90 | 6.64 | ||||||||||
| τ00 | 8.78 PROVNUM:FIPS | 7.94 PROVNUM:FIPS | 6.51 PROVNUM:FIPS | 7.54 PROVNUM:FIPS | 5.14 PROVNUM:FIPS | ||||||||||
| 0.45 FIPS | 0.03 FIPS | 0.10 FIPS | 0.00 FIPS | 0.00 FIPS | |||||||||||
| ICC | 0.04 | 0.00 | 0.01 | 0.00 | 0.00 | ||||||||||
| N | 1669 PROVNUM | 1261 PROVNUM | 531 PROVNUM | 1272 PROVNUM | 377 PROVNUM | ||||||||||
| 425 FIPS | 374 FIPS | 200 FIPS | 80 FIPS | 97 FIPS | |||||||||||
| Observations | 1669 | 1261 | 531 | 1272 | 377 | ||||||||||
| Marginal R2/conditional R2 | 0.099/0.131 | 0.115/0.118 | 0.157/0.167 | 0.103/0.103 | 0.121/0.121 | ||||||||||
CI = confidence intervals; Marginal R2 = proportion of variance explained by the fixed effects in the model; Conditional R2 = proportion of variance explained by the fixed and random effects combined in the model; ICC = intraclass correlation coefficient; Sigma2 = within-group (residual) variance; Tau 00 = between-group variance (variation between individual intercepts and average intercepts) (Hox, 2002).
Bolded p-values represent significant values.
6. Discussion
Our spatial-based approach compiled nearly 130 variables from multiple sources to capture geographic variability in nursing homes, community-level socioeconomic characteristics, and cumulative COVID-19 incidence. Results demonstrated that county-level COVID-19 rates, per-capita income, average household size, population square miles, unemployment, and a higher percentage of African Americans, in combination with nursing home staffing levels (LPNs and total staff) and number of fines issued in 2020 were associated with an increased risk of COVID-19 transmission in nursing homes. Findings from regional models suggested a robust positive relationship between cumulative COVID-19 incidence and county-level per capita income and COVID-19 rates. Our spatial results are confirmed with prior research, which found a higher risk of COVID-19 among nursing home residents in the Northeastern US and parts of the Southeastern US, all locations that were early epidemic emergers in the U.S. (Abrams et al., 2020).
To date, our study is one of the first to examine multiple data sets to understand COVID-19 risk factors among nursing home residents across the entire United States. We generally found that lower quality rating and staffing rating increased COVID-19 risks, but results were not statistically significant. This result parallels with previous work, which also demonstrated no statistical significant relationship between nursing home quality metrics and COVID-19 cases in select US states (Abrams et al., 2020, Figueroa et al., 2020) and contrasts with research findings in California that found a significant relationship with star ratings and COVID-19 cases (He et al., 2020).
Overall, we found that COVID-19 outbreaks in nursing homes are related to other geographic-based factors (e.g., community factors such as % minority) rather than traditional nursing home quality metrics such as star rating. Surprisingly, we found that per capita income at the county-level had the strongest association with COVID-19 nursing home cases (RR: 1.86). This finding has been found in other literature for COVID-19 cases in the general population but with lower incomes predicting higher cases (e.g., Zhang and Schwartz, 2020). Yet this has not been shown as a reason for COVID-19 cases among nursing homes. Regionally, per capita income was a high predictor for Region 2 (NY, NJ), which may reflect that COVID-19 first impacted higher-income communities as their residents are more likely to travel and introduce COVID-19 into communities (Bailey et al., 2020). As the pandemic has continued to escalate, we hypothesize that high per-capita income will be less of a driver in the COVID-19 cases among nursing home residents.
Other nursing home quality measures, like the total number of fines received in the first quarter of 2020, were significant predictors of COVID-19 in our model and implied that nursing homes that received more fines for non-compliance resulted in increases of COVID-19 transmission among residents. Regionally, models found that as the total number of the fines increased, COVID-19 transmission within a nursing home increased in the northeast (CMS Regions 2,3,5) and the southeast US (CMS Region 4), but not the western regions (CMS Regions 6,7, 8, 9,10).
In contrast, a higher proportion of total staffing was a protective factor for COVID-19 transmission (RR: 0.78). This finding aligns with other nurse staffing and quality of care research (Bostick et al. 2006, Abbasi, 2020). Inadequate nurse staffing has plagued nursing homes for decades and has been related to adverse events, substandard care, inadequate monitoring, and poorer resident outcomes. Studies showing higher nurse staffing while accounting for resident acuity found increases the quality of care (Backhaus et al., 2014; Dellefield et al., 2015). Although quality of care metrics have yet to be identified as significant predictors of COVID-19 cases in nursing home locations (e.g., Abrams et al., 2020, Figueroa et al., 2020), our study found that higher total staffing was a protective factor for COVID-19 outbreaks and parallels recent work across 8 states (California, Connecticut, Florida, Illinois, Maryland, Massachusetts, New Jersey, and Pennsylvania) that found high nurse staffing was found in nursing homes with less than 30 cases of COVID-19.
Surprisingly, higher LPN staffing rates were associated with a significant increase in the incidence of COVID-19 cases in nursing homes in our study. This difference could be due to the fact that LPNs care for approximately 25–30 residents each day while passing medications and completing treatments, such as wound care or dressing changes. More LPNs in a nursing home would be more people going in and out of nursing homes providing opportunities for the virus to get into the nursing home. Unlike RNs in nursing homes who provide oversight and infection control guidance, LPNs have less training, lower pay, and complete practical or vocational tasks interacting with more residents than RNs or nursing assistants who shoulder more administrative burden. Our finding is unlike other research on COVID-19 and staffing in nursing homes that showed higher total nursing, nurse aide, and RN hours resulted in a lower probability of an outbreak (Harrington et al., 2020; Gorges and Konetzka, 2020) and could be attributable to the high number of contract or agency LPNs that nursing homes use. This finding deserves further study and analysis, including whether having employed versus contract or agency LPNs contributes to infectious agents' spread.
Nursing homes with a higher percentage of Medicaid and racial and ethnic minority residents tend to have fewer resources (financial and clinical), often leading to reduced quality and safety outcomes (Konetzka et al., 2015). We noted a strong relationship between the county-level population of African Americans (RR: 1.27), particularly in parts of the Southern US (CMS Regions: 4, 6), and cases of COVID-19 in nursing homes. Our results parallel other studies that found a significant association with minority nursing home residents and COVID-19 cases within facilities (Abrams et al., 2020; He et al., 2020). We hypothesize that locations with high African American populations at the county level also have nursing homes with a higher proportion of African American residents and recommend including racial information on documented COVID-19 cases in nursing homes. The percentage of county-level minorities is a significant predictor of COVID-19 as racial health disparities have been exacerbated during this pandemic, lending to subsequent higher COVID-19 cases and deaths in some racial and ethnic groups (Williams and Cooper, 2020). Our study highlights the substantial disparity of COVID-19 cases/deaths among African Americans in a nursing home setting, even in the absence of individual-level resident data. As nursing home resident-level data on COVID-19 isn't available at the national level, community-level variables like percent African Americans are a potential proxy for identifying nursing homes vulnerable to COVID-19 outbreaks.
Other place-based factors, like population density and average household size, were significant. A larger household size reflects more group quarters and an increased likelihood of COVID-19 transmission in the community (Chen et al., 2020). As COVID-19 is a respiratory virus, transmission can occur quickly for individuals who live in the same location and among individuals who work in industries such as meat-packing and nursing homes (i.e., high levels of interpersonal closeness). We also found a high risk of COVID-19 within nursing homes in urban locations (using population density as a proxy for urban) compared to rural areas, which aligns with the Abrams et al., 2020 study. However, when examining the results regionally, county-level population density was associated with increased COVID-19 cases in nursing homes only for CMS Regions 5, 7, and 9.
Our study adds to a growing body of knowledge that COVID-19 rates within the broader community, predict high rates of COVID-19 within nursing homes (Gorges and Konetzka, 2020). The COVID-19 county rate was the only significant predictor of nursing home COVID-19 rate across all CMS Regions, except Region 2 (p-value = 0.105). These finding highlights that regardless of location, high community rates of COVID-19 significantly increase the risk of COVID-19 outbreaks in nursing homes and infection control protocols, and precautions are required to mitigate them.
Geographically, the predictors in our models best-predicted COVID-19 in the northern U.S. and poorly predicted COVID-19 in the southern states. Future analysis should focus on the southern region of the U.S., which may have a different risk landscape driving COVID-19 transmission than other regions of the U.S. At the time of writing this manuscript, the U.S. is currently experiencing a record increase in new COVID-19 cases.
7. Limitations
This study had several notable limitations. First, our analysis was limited to a short time period as COVID-19 is an on-going pandemic. Second, this study's ecological design limited our analysis to the county-level for community-level variables and census variables from previous years before the pandemic (2010, 2012–2017). However, unlike other spatial analysis research on COVID-19 (e.g., Mollalo et al., 2020), we included two scales of analysis by also incorporating nursing home data, thus reducing ecological fallacy and scale limitations (i.e., modifiable areal unit problem) (Swift et al., 2014). We also limited our analysis to cumulative COVID-19 cases and failed to examine the differences across time periods and recommend the future use of longitudinal studies that examine underlying risk factors and behavioral changes over time as the pandemic progresses. This research design may highlight significant predictors that increase or decrease COVID-19 expansion in nursing homes. We also recommend implementing retrospective research designs that investigates individual nursing homes with large COVID19 outbreaks to find the exact cause of an outbreak using interviews or survey designs.
8. Conclusions
The COVID-19 pandemic is on-going. As cases increase in the U.S., new research is needed to understand disparities in COVID-19 cases among nursing homes and the underlying risk factors for these disparities in new outbreak locations like the southern US. Our results provide a framework for additional work on COVID-19 in nursing home populations and can be replicated for different time periods and geographic locations. Nursing homes are particularly vulnerable to the COVID-19 pandemic. However, we found specific geographic areas and underlying risk factors at higher risk for COVID-19 transmission, particularly factors in the community, such as income and the proportion of minority populations. Further research into the factors determining successful prevention and containment of COVID-19 outbreaks is needed to protect nursing home residents and their surrounding communities.
The following are the supplementary data related to this article.
Variance Inflation Factors for final variables used in multilevel models.
CRediT authorship contribution statement
MS conttributed to the formation of the study idea, study design, data analysis, data interpretation, and writing of this manuscript. SL contributed to the writing and literature review. LI and AS contributed to review and design. TS contributed to data prepartion and SH ontributed to clustering and map analysis. JR contributed to data interpretation, research design, and methodological approach. All authors had full access to all the data in the study and reviewed the manuscript. MS is the study guarantor. The corresponding author attests that all listed authors meet authorship criteria and that no others meeting the criteria have been omitted.
Declaration of competing interest
The authors declare that they have no known competing financial interests or personal relationships that could have appeared to influence the work reported in this paper.
Acknowledgments
We thank the Office of Research at Appalachian State University that funded our research through a unique COVID-19 internal funding support mechanism.
Editor: Jay Gan
References
- Abbasi J. “Abandoned” nursing homes continue to face critical supply and staff shortages as COVID-19 toll has mounted. JAMA. 2020 doi: 10.1001/jama.2020.10419. Advance online publication. doi.org/10.1001/jama.2020.10419. [DOI] [PubMed] [Google Scholar]
- Abrams H.R., Loomer L., Gandhi A., Grabowski D.C. Characteristics of US nursing homes with COVID-19 cases. J. Am. Geriatr. Soc. 2020;68:1653–1656. doi: 10.1111/jgs.16661. [DOI] [PMC free article] [PubMed] [Google Scholar]
- Backhaus R., Verbeek H., van Rossum E., Capezuti E., Hamers J.P. Nurse staffing impact on quality of care in nursing homes: a systematic review of longitudinal studies. J. Am. Med. Dir. Assoc. 2014;15(6):383–393. doi: 10.1016/j.jamda.2013.12.080. [DOI] [PubMed] [Google Scholar]
- Baggett T.P., Keyes H., Sporn N., Gaeta J.M. Prevalence of SARS-CoV-2 infection in residents of a large homeless shelter in Boston. JAMA. 2020;323(21):2191–2192. doi: 10.1001/jama.2020.6887. 2020. [DOI] [PMC free article] [PubMed] [Google Scholar]
- Bailey M., Farrell P., Kuchler T., Stroebel J. Social connectedness in urban areas. J. Urban Econ. 2020;118 doi: 10.1016/j.jue.2020.103264. [DOI] [Google Scholar]
- Barnett M.L., Grabowski D.C. Nursing homes are ground zero for COVID-19 pandemic. JAMA Health Forum. 24 March 2020;1(3) doi: 10.1001/jamahealthforum.2020.0369. [DOI] [PubMed] [Google Scholar]
- Bates D., Maechler M., Bolker B., Walker S., Christensen R.H.B., Singmann H.…Green P. Package ‘lme4’. Version. 2018;1:17. [Google Scholar]
- Baum C.F., Henry M. Socioeconomic factors influencing the spatial spread of COVID-19 in the United States. SSRN Electron. J. 2020 doi: 10.2139/ssrn.3614877. [DOI] [Google Scholar]
- Bostick J.E., Rantz M.J., Flesner M.K., Riggs C.J. Systematic review of studies of staffing and quality in nursing homes. J. Am. Med. Dir. Assoc. 2006;7:366–376. doi: 10.1016/j.jamda.2006.01.024. [DOI] [PubMed] [Google Scholar]
- Brown D. Leading Age Calls for Ample PPE, as Providers ‘Scrounge’ for Supplies in Indescribable Places. McKnight's Long Term Care News. 13 May 2020. www.mcknights.com/news/leadingage-calls-for-ample-ppe-as-providers-scrounge-for-supplies-in-indescribable-places
- CDC COVID-19 Response Team Geographic differences in COVID-19 cases, deaths, and incidence—United States, February 12–April 7, 2020. MMWR Morb. Mortal. Wkly Rep. 2020;69:465–471. doi: 10.15585/mmrw.mm6915e4. 2020. [DOI] [PMC free article] [PubMed] [Google Scholar]
- Centers for Medicare and Medicaid Services Nursing homes. 2020. https://www.cms.gov/Medicare/Provider-Enrollment-and-Certification/CertificationandComplianc/NHs Available at. Accessed June 30 2020.
- Chen M.K., Chevalier J.A., Long E.F. National Bureau of Economic Research; 2020. Nursing Home Staff Networks and COVID-19 (No. w27608) [DOI] [PMC free article] [PubMed] [Google Scholar]
- Cutter S.L., Boruff B.J., Shirley W.L. Social vulnerability to environmental hazards. Soc. Sci. Q. 2003;84(2):242–261. doi:10.111/1540-6237.8402002. [Google Scholar]
- Dellefield M.E., Castle N.G., McGilton K.S., Spilsbury K. The relationship between registered nurses and nursing home quality: an integrative review (2008–2014) Nurs. Econ. 2015;33(2):95–108. (116) [PubMed] [Google Scholar]
- Dora A.V., Winnett A., Jatt L.P., et al. (2020). Universal and serial laboratory testing for SARS-CoV-2 at a Long-term care skilled nursing facility for Veterans — Los Angeles, California, 2020. MMWR Morb. Mortal. Wkly Rep. 2020;69:651–655. doi: doi:10.15585/mmwr.mm6921e1external icon. [DOI] [PMC free article] [PubMed]
- Dorritie R., Quigley D.D., Agarwal M., Tark A., Dick A., Stone P.W. Support of nursing homes in infection management varies by US State Departments of Health. J. Hospital Infect. 2020;105(2):258–264. doi: 10.1016/j.jhin.2020.02.007. [DOI] [PMC free article] [PubMed] [Google Scholar]
- Duncan D.T., Kawachi I., editors. Neighborhoods and Health. Oxford University Press; Oxford, UK: 2018. pp. 57–90. [Google Scholar]
- ESRI . Environmental Systems Research Institute; Redlands, CA: 2019. ArcGIS Desktop: Release 10. [Google Scholar]
- Figueroa J.F., Wadhera R.K., Papanicolas I., Riley K., Zheng J., Orav E.J., Jha A.K. Association of nursing home ratings on health inspections, quality of care, and nurse staffing with COVID-19 cases. JAMA. 2020 doi: 10.1001/jama.2020.14709. [DOI] [PMC free article] [PubMed] [Google Scholar]
- Franch-Pardo I., Napoletano B.M., Rosete-Verges F., Billa L. Spatial analysis and GIS in the study of COVID-19. A Review Science of The Total Environment. 2020;140033 doi: 10.1016/j.scitotenv.2020.140033. [DOI] [PMC free article] [PubMed] [Google Scholar]
- Getis A., Ord J.K. The analysis of spatial association by use of distance statistics. Geogr. Anal. 1992;24:189–206. [Google Scholar]
- Gorges R.J., Konetzka R.T. Staffing levels on COVID-19 cases and outbreaks in US nursing homes. J. Am. Geriatr. Soc. 2020 doi: 10.1111/jgs.16787. [DOI] [PMC free article] [PubMed] [Google Scholar]
- Grabowski D.C., Mor V. Nursing home care in crisis in the wake of COVID-19. JAMA. 2020;324(1):23–24. doi: 10.1001/jama.2020.8524. 2020. [DOI] [PubMed] [Google Scholar]
- Hall A.J., Wikswo M.E., Pringle K., Gould L.H., Parashar U.D. Vital signs: foodborne norovirus outbreaks—United States, 2009–2012. MMWR. Morb. Mortal. Wkly Rep. 2014;63(22):491. [PMC free article] [PubMed] [Google Scholar]
- Harrington C., Ross L., Chapman S., Halifax E., Spurlock B., Dekerjian D. Nurse staffing and coronavirus infections in California nursing homes. Policy Polit. Nurs. Prac. 2020;21(3):174–186. doi: 10.1177/1527154420938707. [DOI] [PubMed] [Google Scholar]
- He M., Li Y., Fang F. Is there a link between nursing home reported quality and COVID-19 cases? Evidence from California skilled nursing facilities. J. Am. Med. Dir. Assoc. 2020;21(7):905–908. doi: 10.1016/j.jamda.2020.06.016. [DOI] [PMC free article] [PubMed] [Google Scholar]
- Hox J. Lawrence Erlbaum Associates Inc., Publishers; Mahwah, NJ: 2002. Multilevel Analysis: Techniques and Applications. [Google Scholar]
- Jordan R.E., Adab P., Cheng K.K. Covid-19: risk factors for severe disease and death. BMJ (Clinical Research Ed.) 2020;368 doi: 10.1136/bmj.m1198. [DOI] [PubMed] [Google Scholar]
- KFF Rising Cases in Long-term Care Facilities Are Cause for Concern. 2020. https://www.kff.org/coronavirus-covid-19/issue-brief/rising-cases-in-long-term-care-facilities-are-cause-for-concern/
- Konetzka R.T., Grabowski D.C., Perraillon M.C., Werner R.M. Nursing home 5-star rating system exacerbates disparities in quality, by payer source. Health Affairs (Project Hope) 2015;34(5):819–827. doi: 10.1377/hlthaff.2014.1084. [DOI] [PMC free article] [PubMed] [Google Scholar]
- Lau-Ng R., Caruso L.B., Perls T.T. COVID-19 deaths in long term care facilities: a critical piece of the pandemic puzzle. J. Am. Geriatr. Soc. 2020 doi: 10.1111/jgs.16669. [DOI] [PMC free article] [PubMed] [Google Scholar]
- Li Y., Temkin-Greener H., Shan G., Cai X. COVID-19 infections and deaths among Connecticut nursing home residents: facility correlates. J. Am. Geriatr. Soc. 2020 doi: 10.1111/jgs.16689. [DOI] [PMC free article] [PubMed] [Google Scholar]
- Loeb M., McGeer A., McArthur M., Peeling R.W., Petric M., Simor A.E. Surveillance for outbreaks of respiratory tract infections in nursing homes. Canadian Med. Assoc. J. 2000;162(8):119–1137. [PMC free article] [PubMed] [Google Scholar]
- Lüdecke D. sjPlot: Data visualization for statistics in social science. R Package Version. 2018;2(1) [Google Scholar]
- McMichael T.M., Clark S., Pogosjans S. COVID-19 in a long-term care facility—King County, Washington, February 27–March 9, 2020. MMWR Morb. Mortal. Wkly Rep. 2020;69(12):339–342. doi: 10.15585/mmwr.mm6912e1. [DOI] [PMC free article] [PubMed] [Google Scholar]
- McMichael T.M., Currie D.W., Clark S., Pogosjans S., Kay M., Schwartz N.G., Ferro J. Epidemiology of Covid-19 in a long-term care facility in King County, Washington. N. Engl. J. Med. 2020;382(21):2005–2011. doi: 10.1056/NEJMoa2005412. [DOI] [PMC free article] [PubMed] [Google Scholar]
- Mollalo A., Vahedi B., Rivera K.M. GIS-based spatial modeling of COVID-19 incidence rate in the continental United States. Sci. Total Environ. 2020;728 doi: 10.1016/j.scitotenv.2020.138884. [DOI] [PMC free article] [PubMed] [Google Scholar]
- Orelien J.G., Edwards L.J. Fixed-effect variable selection in linear mixed models using R2 statistics. Computational Statistics & Data Analysis. 2008;52(4):1896–1907. [Google Scholar]
- Schmidt N.M., Nguyen Q.C., Osypuk T.L. Neighborhoods and Health. Oxford University Press; 2018. Experimental and quasi-experimental designs in neighborhood health effects research: strengthening causal inference and promoting translation; pp. 155–191. [Google Scholar]
- Swift A., Liu L., Uber J. MAUP sensitivity analysis of ecological bias in health studies. GeoJournal. 2014;79(2):137–153. doi: 10.1007/s10708-013-9504-z. [DOI] [Google Scholar]
- U.S. Government Accountability Office Infection Control Deficiencies Were Widespread and Persistent in Nursing Homes Prior to COVID-19 Pandemic. 2020. https://www.gao.gov/products/GAO-20-576R
- Williams D.R., Cooper L.A. COVID-19 and health equity—a new kind of “herd immunity”. JAMA. 2020;323(24):2478–2480. doi: 10.1001/jama.2020.8051. 2020. [DOI] [PubMed] [Google Scholar]
- Wilson M.J., Sugg M.M., Lane S.J. Identifying multivariate vulnerability of nursing home facilities throughout the southeastern United States. International Journal of Disaster Risk Reduction. 2019;36:101106. [Google Scholar]
- Wilson M., Lane S., Mohan R., Sugg M. Internal and external validation of vulnerability indices: a case study of the Multivariate Nursing Home Vulnerability Index. Nat. Hazards. 2020;100(3):1013–1036. [Google Scholar]
- Zhang C.H., Schwartz G.G. Spatial disparities in coronavirus incidence and mortality in the United States: an ecological analysis as of May 2020. J. Rural. Health. 2020;36:433–445. doi: 10.1111/jrh.12476. doi:10.111/jrh.12476. [DOI] [PMC free article] [PubMed] [Google Scholar]
Associated Data
This section collects any data citations, data availability statements, or supplementary materials included in this article.
Supplementary Materials
Variance Inflation Factors for final variables used in multilevel models.