

Abstract
Cellular energy homeostasis is a crucial function of oxidative tissues but becomes altered with obesity, a major health problem that is rising unabated and demands attention. Maintaining cardiac lipid homeostasis relies on complex processes and pathways that require concerted actions between lipid droplets (LDs) and mitochondria to prevent intracellular accumulation of bioactive or toxic lipids while providing an efficient supply of lipid for conversion into ATP. While cardiac mitochondria have been extensively studied, cardiac LDs and their role in heart function have not been fully characterized. The cardiac LD compartment is highly dynamic and individual LD is small, making their study challenging. Here, we describe a simple procedure to isolate cardiac LDs that provide sufficient amounts of highly enriched material to allow subsequent protein and lipid biochemical characterization. We also present a detailed protocol to image cardiac LDs by conventional transmission electronic microscopy to provide two-dimensional (2D) analyses of cardiac LDs and mitochondria. Finally, we discuss the potential advantages of dual ion beam and electron beam platform (FIB–SEM) technology to study the cardiac LDs and mitochondria by allowing 3D imaging analysis.
INTRODUCTION AND RATIONALE
Maintaining appropriate cellular lipid homeostasis is crucial to heart function, and numerous studies have established that lipid homeostasis is compromised in obesity-induced cardiomyopathy, a rapidly rising health problem (Cornier et al., 2008; Lopaschuk, Ussher, Folmes, Jaswal, & Stanley, 2010; Szczepaniak, Victor, Orci, & Unger, 2007). To better understand molecular underpinnings of cardiomyopathy and develop targeted preventive and therapeutic treatments, we need to identify the pathways and genes regulating cardiac cellular lipid homeostasis. Distinct among features of cardiomyopathy in obese and diabetic patients are association of increased incidence of heart failure with the accumulation of cardiomyocyte lipid droplets (LDs) (Borradaile & Schaffer, 2005; Khan, Drosatos, & Goldberg, 2010; Lopaschuk et al., 2010; Wende & Abel, 2010). Ample evidence indicates that LDs play a critical, cardioprotective role in lipid homeostasis by mediating transient storage of excess fatty acid (FA) in the form of triglycerides (Listenberger et al., 2003; Liu et al., 2007). Cardioprotection by LD from accumulation of bioactive lipids or production of toxic lipid species occurs at times when FA supply exceeds demand, for example, fasting, as demonstrated in both rodent and human heart tissue (Jacob, 1987; Reingold et al., 2005). However, role of LDs in cardiomyopathy remains underappreciated and controversial (Brindley, Kok, Kienesberger, Lehner, & Dyck, 2010; Park, Yamashita, Blaner, & Goldberg, 2007). Excess fat in cardiomyocytes is associated with cardiac lipotoxicity/dysfunction in mice models with specific heart overexpression or downregulation of genes involved in lipid metabolism (Chiu et al., 2001, 2005; Son et al., 2007; Zimmermann et al., 2004), while other transgenic models display similar amounts of cardiomyocyte LDs but are free of cardiac function abnormalities (Liu et al., 2007; Pollak et al., 2013; Wang et al., 2013). Overall, it is clear that development of cardiac tissue lipotoxicity/dysfunction is not due to the simple presence of ectopic fat in this tissue but rather due to alterations in LD function as they attempt to manage appropriately excess energy. This has also been shown clinically by the recent observation that myocardium from patients with dilated cardiomyopathy has decreased cardiac triglycerides (TG) but increased diacylglycerols and ceramides, implied defects in cardiac LD packaging associated with human heart failure (Chokshi et al., 2012). Directly examining cardiomyocyte LD function will address the nature of link(s) between excess cardiomyocyte LDs, LD dysfunction, and disease state.
LDs are now recognized as bona fide cellular organelles, and work supporting their importance in cellular and whole body energy homeostasis has been recently reviewed (Coen & Goodpaster, 2012; Greenberg et al., 2011). They are composed of a core of neutral esterified lipids, uniquely surrounded by a monolayer of phospholipids where LD-associated proteins dock and regulate the LD function. LD biogenesis is a fundamental cellular function; most mammalian cells store nonesterified fatty acid (NEFA) as triglyceride (TG) in LDs when grown in the presence of FA (Listenberger et al., 2003). LD accumulation in “normal” cells maintains low intracellular NEFA levels but sufficient for essential purposes, for example, betaoxidation, membrane phospholipid synthesis, and steroid production, depending on cell type and developmental state. Cardiac and skeletal muscle cells mainly use NEFA for energy, while liver uses them for very low density lipoprotein production, mammary epithelial cells for milk production, and specialized lung cells make surfactant. These cell-specific uses imply that the LD compartment where TG accumulates must be highly dynamic, absorbing excess NEFA and releasing NEFA to accommodate individual cell requirements. Thus, the LD compartment interacts with other cellular compartments where TG is formed (presumably endoplasmic reticulum, ER) and where NEFA is utilized (cytosol, mitochondria, endosomes).
Cardiomyocytes have high and fluctuating energy demands and are therefore prime cellular models to investigate mechanisms responsible for efficient coupling between energy storage in LDs and utilization in mitochondria (Marín-García & Goldenthal, 2008). Mitochondrial dysfunction results in prominent lipid accumulation and cardiomyopathy in both mice and humans (Marín-García & Goldenthal, 2008). Conversely, lack of some LD-associated proteins has been associated with increased mitochondrial β-oxidation of FA in adipose cells (Beller et al., 2008; Nishino et al., 2008; Saha, Kojima, Martinez-Botas, Sunehag, & Chan, 2004). New studies are revealing an emerging relationship between cardiac LD hydrolysis and levels of peroxisome proliferator-activated receptor gamma coactivator 1-alpha expression, an important transcription factor for mitochondrial function (Haemmerle et al., 2011). In addition, spatial interaction between these two organelles has been anecdotally reported in electron microscopic studies of adipocytes, heart and liver (Blanchette-Mackie & Scow, 1983; Liu et al., 2007; Shaw, Jones, & Wagenmaker, 2008). In skeletal muscle cells where lipids are utilized for energy, interaction between LDs and mitochondria is enhanced by exercise (Tarnopolsky et al., 2007). More recently, it was shown that perilipin 5, a LD-associated protein, stabilizes LDs in close proximity to mitochondria (Bosma et al., 2012; Wang et al., 2011). Therefore, continuing work is required to elucidate mechanisms underlying physical and metabolic relationships between cardiac LDs and mitochondria as well as its physiological and pathological relevance.
Development of robust techniques is important to analyze the cardiac LD-associated proteins and the spatial organization of the network of mitochondria and LDs from heart tissues; determination of content and distribution could provide crucial information. Major limitations to study cardiac LDs are their relative small size and low abundance in the heart. While the remarkable lipid storage capacity of white adipocyte LDs can be readily visualized by microscopic observation, cardiac LDs are best visualized by electron microscopy under the most physiological conditions possible. Mature adipocytes have a single LD whose size can range from 25 to 150 μm diameter occupying most of the cell volume; steatotic liver can contain LD with a size reaching 10 μm, while cardiac LD size usually averages less than 1 μm in diameter and are always in close association to mitochondria. Here, we provide detailed protocols that are the basis for our published methods for isolating cardiac LDs and for analyzing cardiac LD proteins by western blot. Also included is a protocol we have used to image cardiac LDs by conventional transmission electronic microscope. In addition, we discuss the potentiality of novel three-dimensional (3D) methodologies for imaging and quantifying cardiac LD and mitochondrial size using Dual beam FIB–SEM.
8.1. ISOLATION OF CARDIAC LD PROTEINS AND PREPARATION OF CARDIAC LDs FOR ANALYSIS BY WESTERN BLOT
There are many published techniques to isolate LDs from cells and tissues of different organisms (Brasaemle & Wolins, 2006; Ding et al., 2013; Harris, Shew, Skinner, & Wolins, 2012). All these techniques rely on fractionation by differential centrifugation, benefiting from the relative low density of these organelles that makes them float in aqueous solution. A major and common caveat of LD fractionation is the remaining level of unwanted membranes/proteins from other cellular organelles in the low density LD fraction, especially from ER and mitochondria. Conditions used for cell lysis or tissue homogenization are likely to be the main factor determining the levels of these unwanted contaminants. Attempts to remediate have commonly included additional washes at similar or increased pH (carbonate wash buffer at pH 10). However, these additional steps run a risk for loss of the scarce amounts of extractable LDs from the heart. Cardiac LDs are in low abundance and are very labile upon nutritional conditions. For example, they are almost undetectable in mice studied in fed conditions, but their presence increases with increasing time of fasting (Pollak et al., 2013; Wang et al., 2013). In addition, the abundance of fibrillar material in heart muscle makes LD isolation particularly challenging. We developed a simplified protocol for isolating cardiac LDs that has been shown to be effective to study some of the LD-associated proteins by providing sufficient yield and quality as assessed by a secondary measurement of western blot. A schematic for the isolation procedure is presented in Fig. 8.1.
FIGURE 8.1.
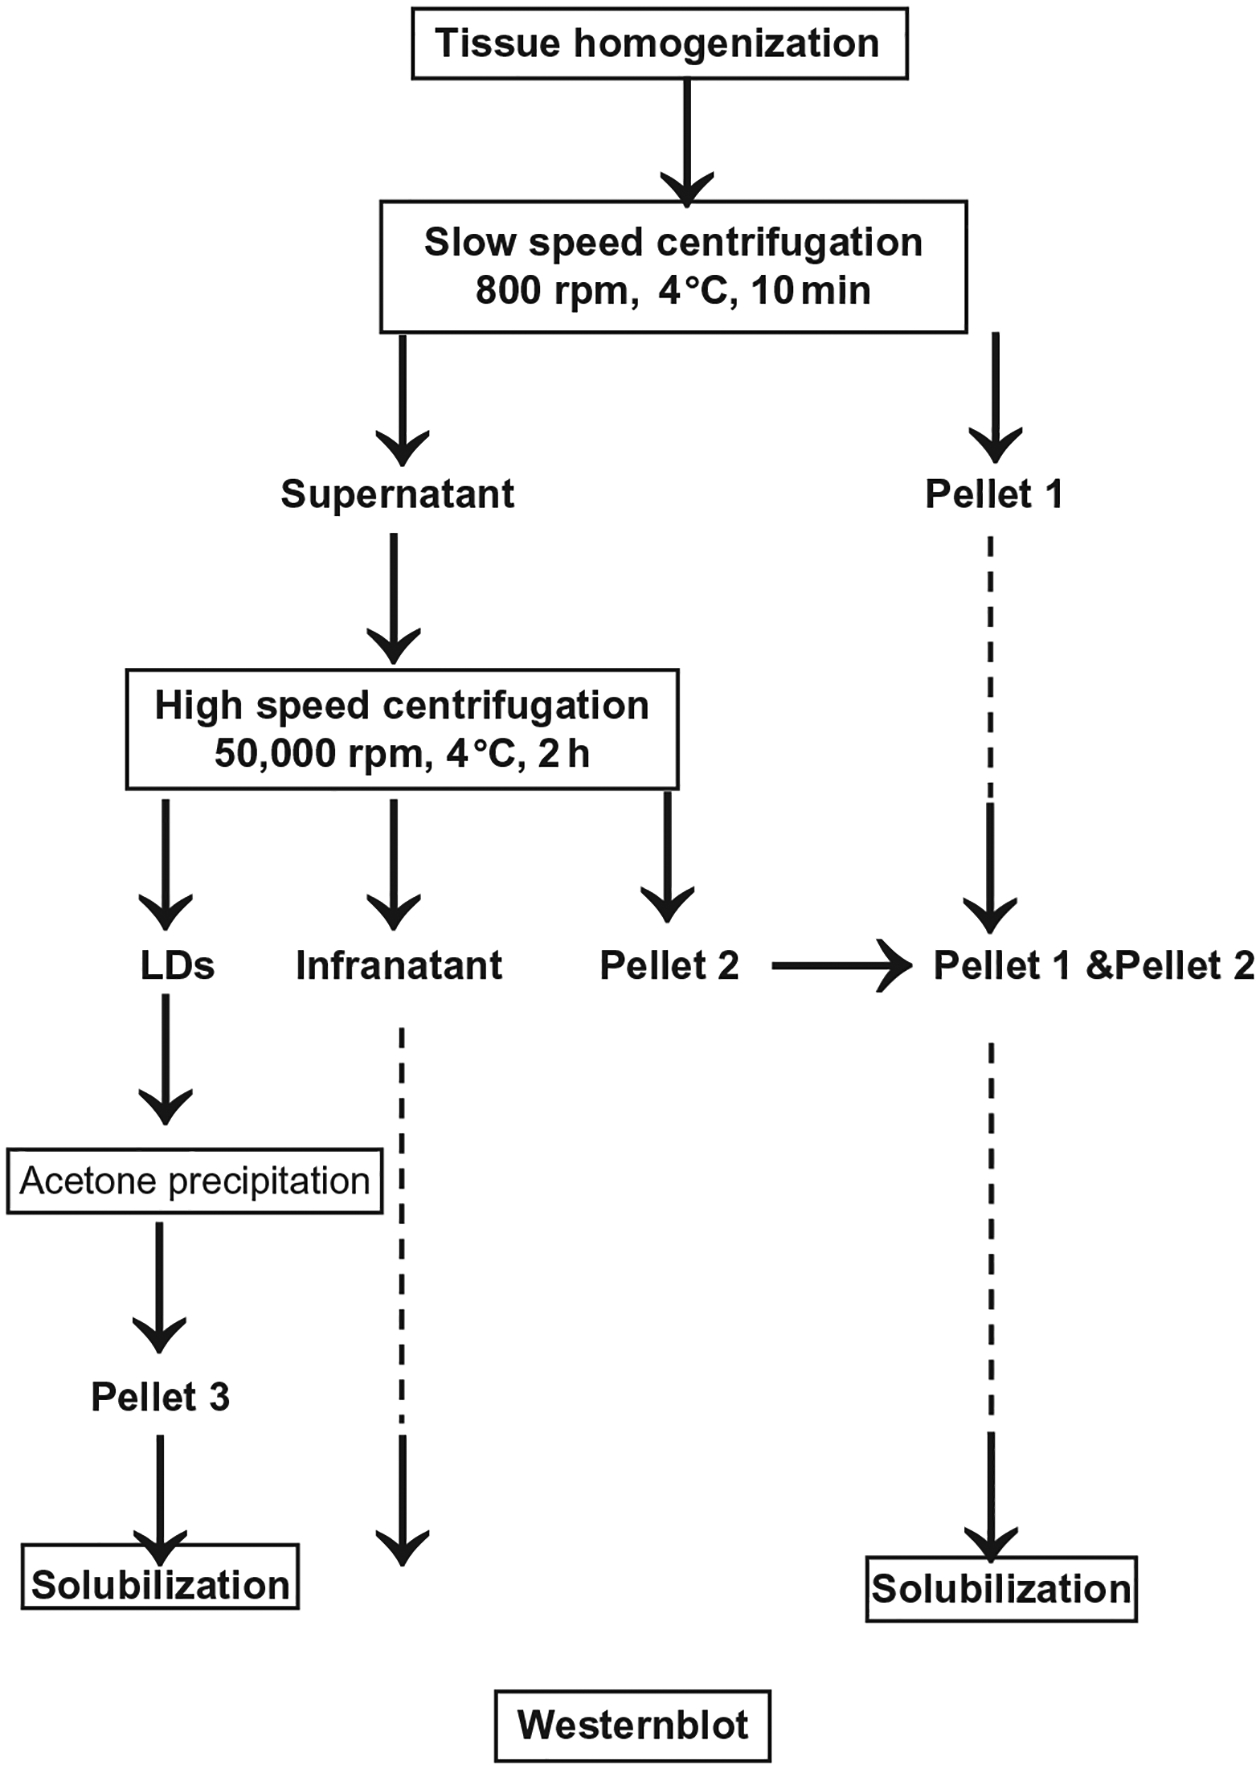
Schematic of the key steps in the fractionation method used to isolate cardiac LDs.
8.1.1. Materials
8.1.1.1. Reagents
Protease inhibitor cocktail tablet (Roche, cat. no. 11873580001)
Tris HCl (Sigma-Aldrich, cat. no. T1503)
NaCl (Sigma-Aldrich, cat. no. S7653)
KCl (Sigma-Aldrich, cat. no. P9333)
Na2HP04 (Sigma-Aldrich, cat. no. S5136)
KH2PO4 (Sigma-Aldrich, cat. no. P5655)
Sodium dodecyl sulfate (Sigma-Aldrich, cat. no. L3771)
8.1.1.2. Buffers
Tris–EDTA–sucrose buffer (10 mM Tris, pH 7.4, 1 mM EDTA) supplemented the day of the experiment with 1 tablet of protease inhibitor cocktail for 50 ml buffer and 10% final sucrose.
PBS, pH 7.4.
2× concentrate Laemmli sample buffer containing 4% SDS, 20% glycerol, 10% 2-mercaptoethanol, 0.004% bromphenol blue, and 0.125 M Tris HCl, pH ~6.8 (Sigma-Aldrich, cat. no. S3401).
8.1.2. Equipment
Refrigerated table top Microfuge (Beckman 22R)
Refrigerated Centrifuge (Beckman Allegra 22X-R)
Ultracentrifuge (Bekman Optima L 90K)
200 μl pipet tips with large orifice (VWR, cat. no. 53503–612)
SW55 Ti rotor (Beckman Coulter, cat. no. 331302)
5 ml Ultracentrifuge Tube (Beckman, cat. no. 326819)
1 ml syringe (BD, cat. no. 309602) and 27G1/2 needle (BD, cat. no. 305109) cut to provide a blunt end
Glass Dounce homogenizer and fitted pestle (Wheaton, cat. no. 357542)
50 ml conical centrifuge tube (Corning, cat. no. 430828)
Liquid nitrogen cryogenic container
Biosqueeze cryogenic tissue clamping (Fisher Scientific, cat. no. 200489)
4–12% pre-poured gels for protein analysis (Life Technologies, CA, cat. no. NP0330)
Nitrocellulose membrane (GE Healthcare, NJ, cat. no. RPN203D)
Enhanced chemiluminescence (ECL) system (GE Healthcare, cat. no. RNP2232)
Super Signal West Dura (Pierce Biotechnology, cat. no. 37071) or West Femto (Pierce Biotechnology, cat. no. 34094)
8.1.3. Experimental design
Mice are euthanized by cervical dislocation, heart tissue is then excised and immediately snap-frozen using cryogenic tissue clamps. Frozen tissues are quickly weighed, reduced to powder using a small ceramic mortar cooled with liquid nitrogen, and maintained on dry ice. Frozen powered tissues are carefully collected and set in a glass bounce homogenizer (ratio 100 mg heart tissue/1 ml ice-cold Tris–EDTA buffer pH 7.4 with cocktail inhibitors) on ice.
Individual mouse heart is manually homogenized using the fitted glass pestle, and keeping the homogenizer and tissue on ice until the tissue is completely homogenized.
Homogenates are obtained and pooled from five mouse hearts together into a 50 ml conical centrifuge tube.
Homogenates are centrifuged at 100 gavg. at 4 °C for 10 min (Refrigerated Centrifuge, Allegra 22 X-R), collect 10 μl twice for later protein determination, and then transfer the supernatant to a 5 ml ultracentrifuge tube. Pellets are kept on ice to be later processed.
Supernatant is centrifuged at 237,020 gavg. for 2 h at 4 °C (Ultracentrifuge, Beckman Optima).
The LDs will concentrate in a thin white band at the top of the tube. LDs are collected using a 200 μl pipette tip with large orifice and transferred to an Eppendorf tube, trying to obtain the most LDs with the least amount of buffer.
Collect remaining infranatant, add 1:1 amount of 2× concentrate Laemmli gel sample buffer solution, and freeze at −80 °C.
Wash pellets collected after the low-speed centrifugation and high-speed centrifugation steps by resuspending pellets with 200 μl of Tris–EDTA buffer pH 7.4 and centrifugation at 18,000 gavg. for 30 min at 4 °C (Microfuge, Beckman 22R). Finally, pellets are solubilized in 200 μl of Tris–EDTA buffer pH 7.4 containing 10% SDS and 200 μl 2× sample buffer solution.
LDs are separated from the remaining buffer by centrifuging at 18,000 gavg. for 30 min at 4 °C (Microfuge, Beckman 22R).
Working rapidly to avoid warming the layer of LDs, the solution underlying the LDs is removed using a 1 ml syringe fitted with a 27G1/2 needle cut with a blunt end.
200 μl of Tris–EDTA buffer pH 7.4 is added to the LDs by releasing the buffer close to where the lipid layer is sticking to the plastic centrifuge tube and LDs are resuspended by gentle tapping on the tube. Two 10 μl aliquots of LDs containing solution are taken and frozen at −20 °C to be used later for LDs protein determination.
Proteins are then acetone-precipitated from the remaining LD containing solution by adding 1:3 (v/v) of acetone, vortex and freeze at −20 °C overnight.
The following day, collect the LD acetone-precipitated proteins by centrifuging the Eppendorf tubes for 1 h at 18,000 gavg. at 4 °C and decant the tube. Let the tube dry briefly on ice in the hood.
Add 80 μl of 10% SDS, 20 μl of 10 mM DTT, and 100 μl of 2× concentrate Laemmli sample buffer to solubilize the precipitated proteins.
8.1.4. Analysis of LDs by western blot
Separate the LD proteins using 4–12% Bis–Tris gels according to the standard methods.
Transfer the proteins to a nitrocellulose membrane (Amersham Biosciences, NJ) by following the standard procedures.
Blot the target proteins using appropriate antibodies according to the standard methods.
Detect the signals using an ECL system (GE Healthcare, cat. no. RNP2232) according to the manufacturer’s instructions. For low abundant proteins, we use Super Signal West Dura (Pierce Biotechnology, cat. no. 37071), or West Femto (Pierce Biotechnology, cat. no. 34094).
8.1.5. Results and discussion
To assess the effectiveness of this method, heart tissues from fed or 12 h fasted mice were homogenized. To determine the extent of the purity of the LDs obtained, the cardiac LD fraction was analyzed with an immunoblot with antibodies against proteins reported to be restricted to specific organelles (Fig. 8.2). Organelle-specific markers for cardiac LDs used are the following: the LD-associated protein perilipin 2, member of the perilipin protein family; for cytosolic proteins, lactate dehydrogenase; for ER transmembrane protein, calnexin; for mitochondria protein, ATP synthase α. Due to the difficulty to homogenize heart and its small amount of cardiac LDs, it is not possible to directly assess the distribution of organelles across other fractions due to a limitation to resuspend the isolated LDs in a small volume. The figure provided is indicative that the selected antibodies against protein-specific organelles are working. As fractionations are never pure, it is always recommended for each preparation to be assessed for the level of specific organelle markers in the LD fraction. We also used two additional members of the LD protein, perilipin 5, a LD-associated protein previously shown to be nutritionally regulated and also to be a major cardiac LD protein, as well as perilipin 3, another member of the perilipin protein family whose expression by contrast has been shown not affected by fed and fasted conditions (Dalen et al., 2007). Both perilipin 5 and perilipin 3 are termed exchangeable LD-associated proteins as they can be in the cytosol or bound the surface of LDs (Brasaemle & Bickel, 2006). In contrast, perilipin 2 is only found bound to LDs and thus its expression can be used as a LD-specific marker (Straub et al., 2013; Xu et al., 2005). These organelle-specific markers show that this method produces highly enriched in LDs from heart tissue (Fig. 8.2). Perilipin 2 signal is only detected in the LD fraction, while perilipin 5 and specifically perilipin 3 can be detected in all three fractions. Perilipin 5 content increases highly with starvation; however, there is no change in the detected signals for calnexin and LDH in the other fractions. ATPase is found essentially in the pellet but is also found associated with the LD fraction in fasting conditions. We and others have previously shown that perilipin 5 mediates physical interactions between LDs and mitochondria by a yet unknown mechanism (Pollak et al., 2013; Wang et al., 2013). The increased presence of mitochondria proteins in the LD fraction may be due to increased presence of perilipin 5 in this fraction.
FIGURE 8.2.
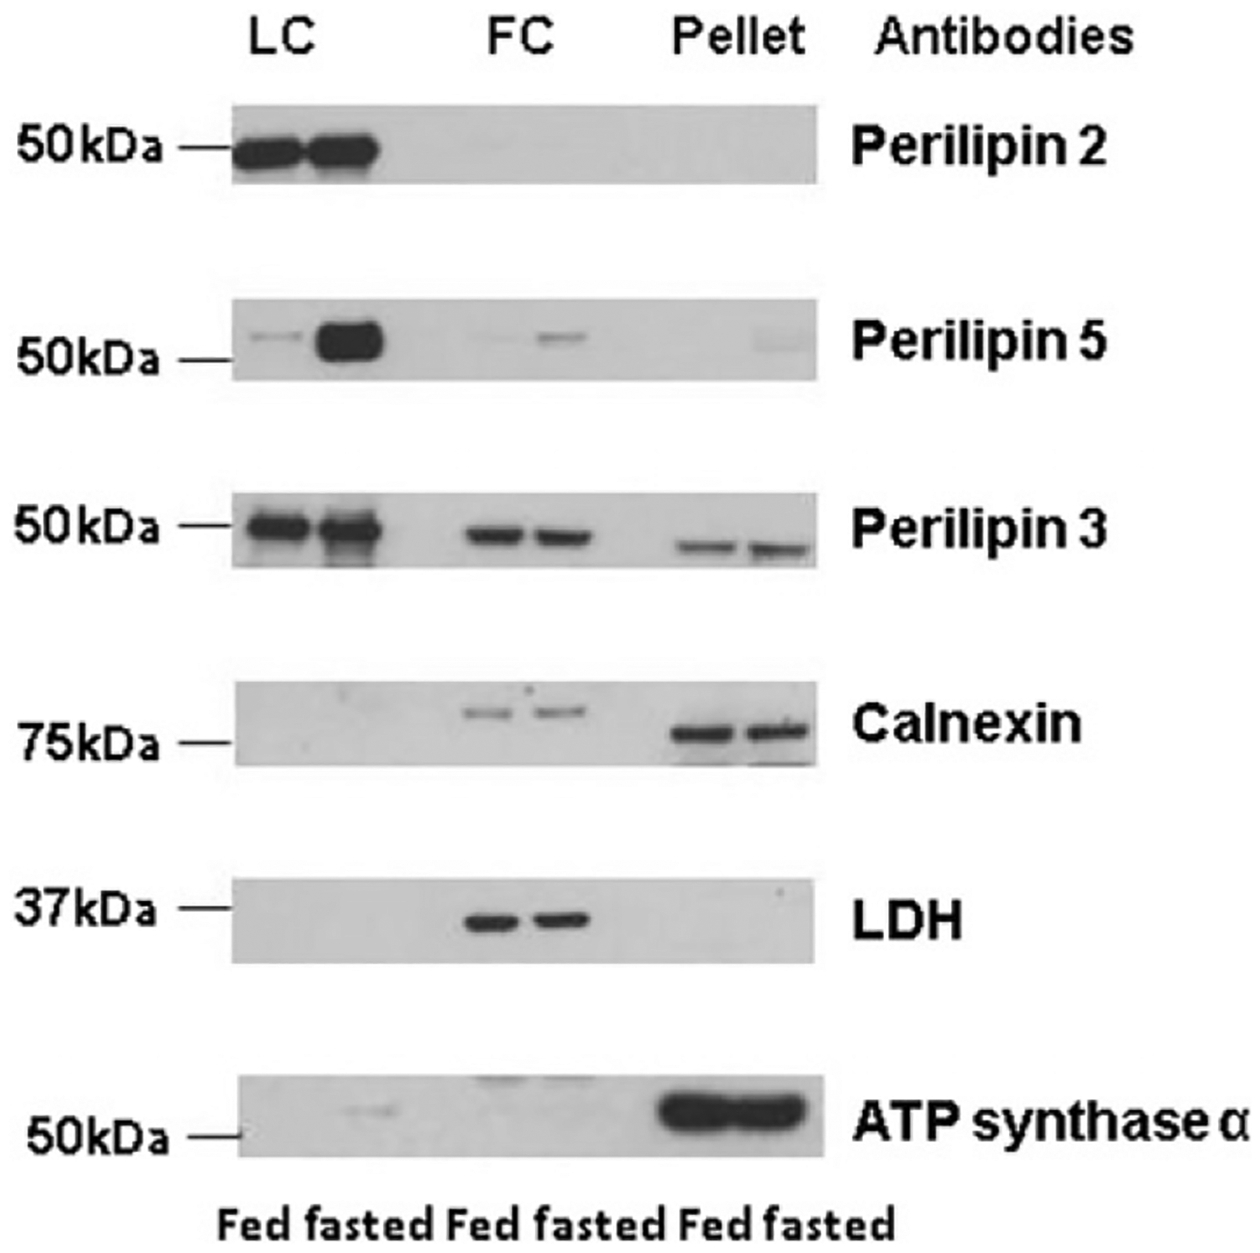
Selected protein expression of specific organelle markers in LD, infranatant, and pellet fractions isolated by differential centrifugation from heart of fed or overnight fasted mice. Each lane contains equal volume 20 μl of sample loaded for perilipin 2 (Progen Biotechnik, cat. no. GP4), perilipin 5 (Progen Biotechnik, cat. no. GP31), perilipin 3 (Progen Biotechnik, cat. no. GP36), calnexin (Abcam, cat. no. 191–100), LDH (Cell Signaling Technology, cat. no. 2012), and ATP synthase α (MtioSciences, cat. no. MS502) from fed and fasted mice. One representative experiment is shown.
To normalize sample loading and allow comparison between cardiac LDs samples isolated from different physiological conditions, samples loaded on the gel can be normalized by the amount of proteins measured in the samples or the amount of starting tissue when volume used remained in equal proportions. In our hands, we have experienced more variation from sample to sample when measuring the amount of proteins using a commercial Bradford commercial assay, likely due to the high lipid content. We are now routinely normalizing our samples by initial heart weights and maintaining volumes in proportion to allow comparison between samples (Fig. 8.2).
Here, we demonstrate the feasibility to isolate cardiac LDs, a particularly challenging task due to the low abundance of LDs and the difficulty to isolate them due to the fibrous nature of the tissue. This methodology is compatible with secondary assays such as proteomics, lipids, and proteins determination that will provide necessary information to understand the role of the LDs in the heart.
8.2. ANALYSIS OF CARDIAC LDS BY 2D ANALYSIS OF LDs BY CONVENTIONAL TEM
Light microscopy analysis of LDs in heart histological sections has been fairly limited to visualize the total amount of neutral lipid content by using common lipid stains such as Oil Red O (Christoffersen et al., 2003; Kuramoto et al., 2012; Sharma et al., 2004). Recently, visualization by histocytochemistry of a very number of LD-associated proteins, restricted to the LD coat proteins perilipins 2, 3, and 5, have been published and still do not offer quality resolution and information (Kuramoto et al., 2012; Wang et al., 2013). Conventional TEM has been commonly used to image cardiac LDs (Chiu et al., 2001, 2005; Chokshi et al., 2012; Liu et al., 2007; Pollak et al., 2013; Son et al., 2007; Wang et al., 2013; Zimmermann et al., 2004) and revealed the close physical association between LDs and mitochondria. We are describing here an optimized protocol to allow imaging of these organelles and morphometry analyses of LDs and mitochondria.
8.2.1. Materials
8.2.1.1. Reagents and buffers
Mixture of 4% paraformaldehyde and 1% glutaraldehyde in phosphate buffer: mix 2.5 ml 16% paraformaldehyde (Electron Microscopy Sciences, cat. no. 15710), 1 ml 10% glutaraldehyde (Electron Microscopy Sciences, cat. no. 16120), 5 ml 200 mM phosphate buffer and adjust final volume to 10 ml with water.
Mixture of 2% paraformaldehyde and 2.5% glutaraldehyde in phosphate buffer: mix 1.25 ml 16% paraformaldehyde (MP Biomedical, USA, cat. no. 0219998320), 2.5 ml 10% glutaraldehyde (MP Biomedical, USA, cat. no. 02189659510), 5 ml 200 mM phosphate buffer, and adjust final volume to 10 ml with water.
Uranyl acetate: 3% solution in water, stored in the dark at 4 °C.
Ethanol (C2H5OH): 30%, 50%, 70%, 90%, 100% solutions in water.
Spurr’s resin (EMS): mix 8.0 g DER 736 (diglycidyl ether of propylene glycol), 10.0 g ERL 4221, 25.0 g NSA (nonenyl succinic anhydride), and 0.3 g DMAE (dimethylaminoethanol), for a total volume of ~40 ml.
Toluidine blue stain: mix one part deionized water, one part 5% (w/v) toluidine blue, and one part 2% (w/v) sodium borate, filter, and store at room temperature. Phosphate buffer: 200 mM solution, pH 6.8. Prepare solution A (200 mM monobasic sodium phosphate) and solution B (200 mM dibasic sodium phosphate). Mix 190 ml of solution A with 810 ml of solution B and adjust pH to 7.4 by using additional Solution A or B.
8.2.2. Equipment
Transmission electron microscope, 120 keV (Tecnai T12, FEI Co.)
8.2.3. Experimental design
Mice are euthanized by cervical dislocation before dissection. Left heart ventricle tissue is excised quickly and soaked immediately in 4% paraformaldehyde and 1% glutaraldehyde in phosphate buffer (Trump’s Fixative) and cut into roughly 5 mm2 pieces using a razor blade and stored at 4 °C in fixative.
Within 24 h, the tissue is being processed. Small pieces of heart tissue are transferred on a glass slide and further trimmed under the dissecting microscope in a fume hood. The orientation of the heart muscle bundle is discernible at 10–20× magnification. Using a sharp surgical blade, heart muscle tissue is trimmed into 1 mm × 1 mm × 2 mm pieces with the long axis parallel with the direction of the myofibril bundles. A transparency film printed with 1 mm2 gridded pattern can be placed underneath the glass slide as a size guide. A drop of fixative containing 2% paraformaldehyde and 2.5% glutaraldehyde in phosphate buffer is added onto the muscle piece to prevent drying during trimming.
After trimming, tissue pieces left in 2% paraformaldehyde and 2.5% glutaraldehyde for another 30 min, washed with two changes of 100 mM phosphate buffer, 2 min each time, quenched in 100 mM glycine in 100 mM phosphate buffer for 15 min, and washed with phosphate buffer three times, 5 min each time. It is important to completely remove traces of aldehyde solution before the osmium staining step.
After washing, specimens are postfixed with 1% osmium tetroxide in 100 mM phosphate buffer for 1 h and washed three times in water (10 min each wash).
After washing, specimens are postfixed with 1% osmium tetroxide in 100 mM phosphate buffer for 1 h and washed three times in water (10 min each wash).
Specimens are then en bloc stained with 3% UA in deionized water for 1 h at room temperature and washed three times in deionized water (10 min each wash).
This is followed by dehydration in a graded ethanol series including incubation in 30, 50, 70, 90% ethanol (10 min each), and two successive 10 min incubations in 100% ethanol. Care should be taken that incubation of the specimen in ethanol is not prolonged to minimize the chances of lipid extraction.
Tissue pieces are then infiltrated with 1:1 ethanol/spurs resin, 2:1 ethanol/spurs resin for 1 h each, and pure spurs resin overnight.
The following morning, specimens are transferred to a new tube containing pure spurs resin for 1 h and then transferred with a wooden toothpick into a flat embedding mold with either the long side of the specimen placed perpendicular or parallel to the tip of the mold.
Polymerization of the resin is achieved at 60 °C for 24–48 h. The embedded blocks are trimmed as a trapezoid with the parallel sides at ~0.5–1 mm in size. Survey sections of 150–250 nm thickness are collected onto glass slides, and stained with toluidine blue to confirm the orientation of the myofibrils: longitudinal or transversal.
Judging from the orientation of the myofibrils, the angle of the resin block can be adjusted in order to obtain the largest possible area of sections with a longitudinal cut of the muscle fibers. Silver-colored ultrathin sections at ~70 nm thickness are collected onto 200 mesh Cu grids and directly viewed in the electron microscope without further uranyl acetate or lead poststaining.
Morphometry analysis can be performed using collected 2D images. LD size and mitochondria measurement are performed on 20–30 (heart) fields containing longitudinally arrayed myofibrils, photographed from each section at the 3200× magnification. Scanned micrographs are analyzed using ImageJ software (http://rsb.info.nih.gov/ij) to manually generate masks of mitochondrial and LD contours that are used for the calculation of mitochondrial and LD areas maximum and total mitochondrial and LD numbers (Wang et al., 2013).
8.2.4. Results and discussion
In the preparation of specimens for TEM, the most common stain for LDs is osmium tetroxide (Hayat, 1970). Various modifications of the osmium staining procedure can enhance the electron density of LDs in TEM. These include ferrocyanide-reduced osmium (de Bruijn, Schellens, van Buitenen, & van der Meulen, 1980) or imidazole-buffered osmium tetroxide (Angermuller & Fahimi, 1982) as well as osmium-thiocarbohydrazine liganding, termed the OTO method (Guyton, Bocan, & Schifani, 1985). Inclusion of tannic acid and p-phenylenediamine as mordant after the initial osmium fixation step has also been reported to enhance the staining of LDs (Guyton & Klemp, 1988). However, some of these treatments may lead to artifactual staining or disruption of other cellular components (Neiss, 1983). Another important common consideration when designing EM preparation protocols for LDs is the risk of lipid loss and/or loss of the osmium stain during sample preparation. Depending on the degree of lipid or osmium extraction during preparation, LDs may exhibit an electron translucent center of various sizes, or, in the case of complete loss, may resemble empty vacuoles (Neiss, 1983). Although the loss of lipids/osmium most likely occurs during the dehydration steps, others have also reported that extraction may occur at poststaining steps with other heavy metals such as uranyl acetate and lead citrate (Neiss, 1983). Although the exact chemical reactions of these extractions of lipids and/or osmium are still unclear, it has been shown that the translucent center of the LDs is a result of the loss of osmium. It may be speculated that osmium oxidation in the center of the LDs may not be complete and thus is more prone to be extracted during the remaining of the embedding process. However, increasing the osmium concentration or extending the time of osmium treatment does not seem to increase the electron density of LDs (Guyton & Klemp, 1988). The depth of penetration may be a limiting factor.
Here, we compare LDs stain with or without additional poststain procedures: uranyl acetate and lead citrate or OTO (Fig. 8.3). LDs appear homogenously stained using the TEM preparation method we described earlier (Fig. 8.3A and (Wang et al., 2013)). Figure 8.3A and B shows marked differences in the appearances of LDs, mitochondria, and myofibrils of the ultrathin section collected from the same specimen preparation with (Fig. 8.3B) or without (Fig. 8.3A) uranyl acetate (10 min) and lead poststaining (5 min), a procedure routinely applied to TEM specimen to enhance the contrast (Hayat, 1970). While membranes are well contrasted by using the uranyl acetate and lead stain (Fig. 8.3B and B′), LDs are not uniformly stained and few LDs appear to be without any lipid content (Fig. 8.3B). Often, the extent of lipid extraction varies from one specimen to another but is always proportional to the staining time and number of heavy metal staining. Effort to enhance the staining of the LDs in TEM sample preparation may backfire too. The heart muscle TEM specimen stained by the OTO method exhibits greatly enhanced membrane of the LDs (Fig. 8.3C). However, the edges of the LD membrane show irregularities and pitting, an appearance not observed in the control specimen when LDs were stained with only osmium and uranyl acetate during the embedding process (Fig. 8.3B′).
FIGURE 8.3.
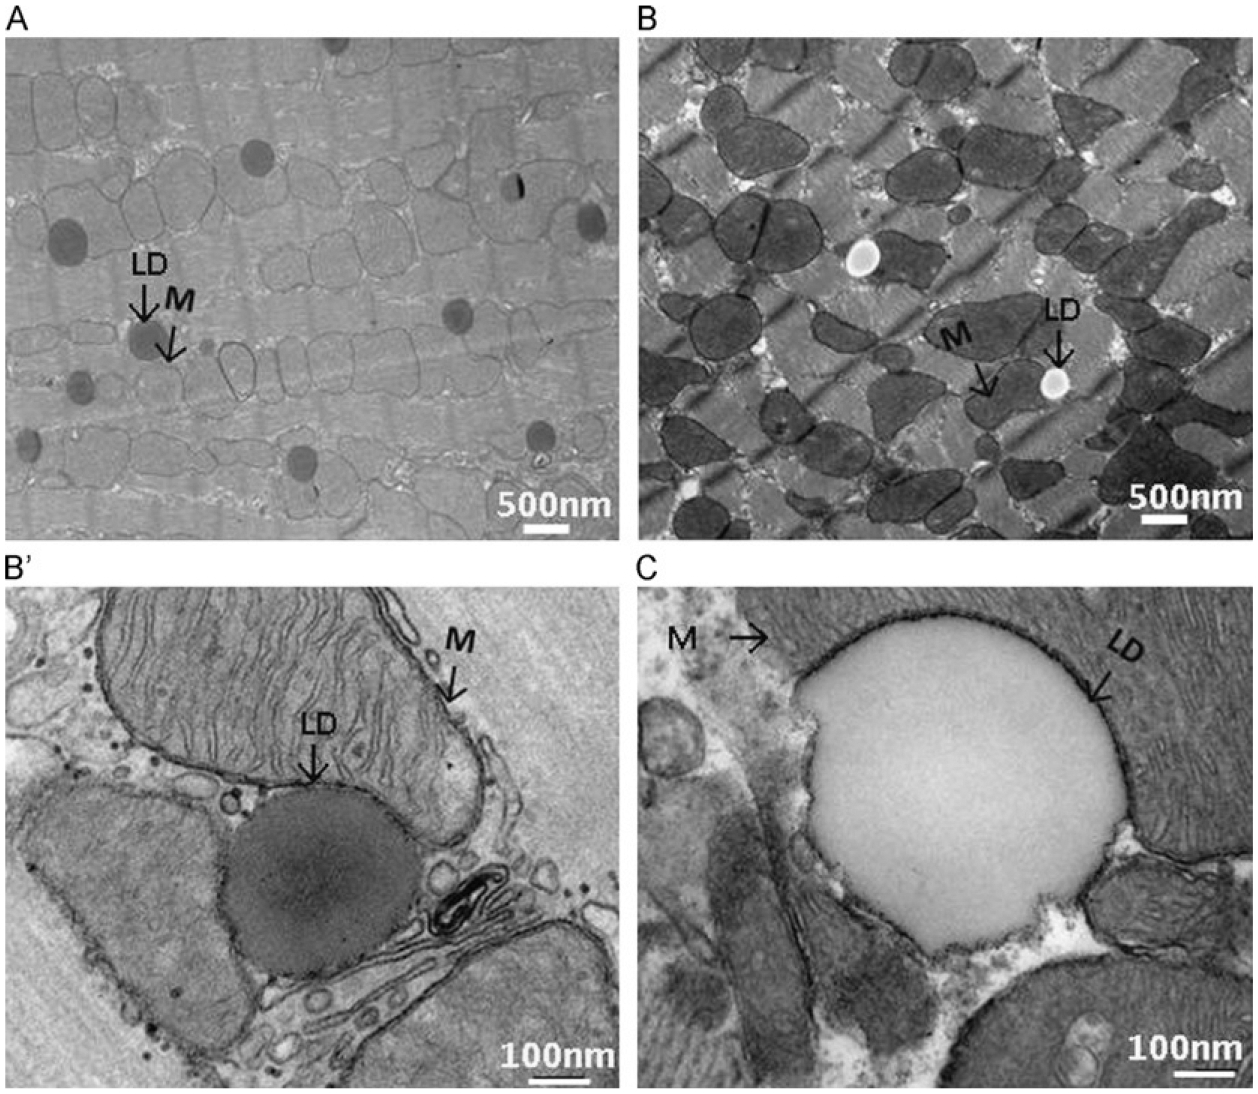
(A) Left heart ventricle from an overnight fasted mice was excised and fixed with Trump’s fixative, post-fixed in 1% osmium tetroxide, and investigated with transmission electron microscopy. (B) Thin sections were processed as (A) and stained with lead citrate and uranyl acetate and then investigated with transmission electron microscopy. (B′) Sample is processed as (B) but visualized with high magnification. (C) Sample is processed as (A) and further stained with OTO. Black arrows indicate mitochondria (M) and lipid droplets (LDs). Respective magnification is reported on the micrograph in white.
In order to maximize the ultrastructural preservation of not only the LDs but also of the aqueous cytoplasmic content as well as organelles such as mitochondria and myofibrils, we recommend here a more traditional TEM embedding protocol for heart muscle tissue to avoid LD lipid extraction. Special attention is given to the small size of the specimen to ensure optimal stain penetration, and to minimal dehydration and infiltration times required during the embedding process. This method consistently yields well-preserved LDs, mitochondria, myofibrils, and other subcellular components in the heart muscle tissue. Moreover, the method does not require expensive instrumentation.
8.3. PROGRESS IN 3D EM TECHNOLOGY MAY PROVIDE NEW TOOLS TO STUDY CARDIAC LDs AND MITOCHONDRIA INTERACTIONS
In heart muscle tissue, LDs are closely associated with mitochondria (Fig. 8.3). While traditional two-dimensional (2D) TEM imaging provides semiquantitative information as to the number and the size of LDs, it does not convey a spatial, 3D perspective that would allow a better appreciation of the interaction(s) between LDs and other cellular organelles, more specifically between LDs and mitochondria, an accurate determination of these organelles volume. For instance, branched or lobular mitochondria may appear as multiple small mitochondria when sectioned along different planes within the tissue. Similarly, two fused LDs may not appear as such unless the sectioning is perpendicular to the fusion plane.
Modern fluorescent microscopy and optical sectioning techniques provide tools to perform 3D imaging of cells or pieces of tissue. However, the resolution at best is limited to 100–200 nm in the x–y dimension and ~200–400 nm in the z dimension (Cox & Sheppard, 2004). This neither provides the resolution needed to investigate possible LD membrane fusion events nor the resolution to study the dynamic interactions between LDs and mitochondria or other organelles. High-resolution 3D imaging of tissue or cell specimens has been achieved by electron tomography (McIntosh, Nicastro, & Mastronarde, 2005). In this method, the electron beam is directed through a specimen at incremental tilt angles. Images are collected and back-projected to generate a 3D image of the entire volume, called a tomogram. Some information will, however, be missing owing to the maximum allowable tilt angle in the TEM column being ~±60° or 70°, thus creating a missing wedge (McIntosh et al., 2005). Furthermore, specimen thickness increases at high tilt angles and is usually restricted to ~250–500 nm. Therefore, to obtain 3D imaging of tissues of larger sizes (>10 μm) would require collecting serial sections and building up a tomogram from each section (serial section TEM). This is a technically demanding and labor-intensive approach that is not suitable for routine analysis.
In recent years, new methodologies have been developed to collect back scattered (BSE) SEM images of serial sections of biological specimens in a electron microscope at a thickness beyond the reach of traditional TEM tomography (Murphy et al., 2010, 2011). Dual beam SEM uses alternating ion and electron beams to remove a thin layer of specimen and then record the image of the newly exposed surface. This milling and imaging sequence can be repeated using preset parameters in an automated fashion, thus allowing the collection of stacks of images for a whole cell or large volumes of tissue. The potential of this technique is illustrated by recent publication of 3D image analyses of a whole yeast cell (Wei et al., 2012), mammalian cell (Bennett et al., 2009; Heymann et al., 2006, 2009), and brain tissue (Knott, Marchman, Wall, & Lich, 2008, Knott, Rosset, & Cantoni, 2011). Furthermore, it has been used to demonstrate differences in the volume and surface curvature of mitochondria in diseased versus normal liver tissue, suggesting it may be possible to apply this technique in a clinical screening situation (Murphy et al., 2010). We present here our preliminary data on the 3D analysis of LDs in resin-embedded mouse heart tissue. Since this work is still in progress, the purpose of this section is not to provide the reader with a detailed protocol but to demonstrate the potential of this new methodology and to stimulate discussion with respect to the pros and cons and the challenges of this 3D imaging method.
To pilot the FIB–SEM application to the study of cardiac LDs, we used hearts specimen isolated from mice with cardiac myocyte targeted Plin5 expression (MHC-Plin5) (Wang et al., 2013). Increased perilipin 5 expression in these transgenic mice leads to storage of excessive triacylglycerol in LDs and cardiac steatosis (Pollak et al., 2013; Wang et al., 2013). A total of 219 FIB–SEM image series of heart muscle from a MHC-Plin5 transgenic mouse were collected at 20 nm thickness per slice using a Zeiss Auriga cross beam FIB/SEM platform. In Fig. 8.4, we present selected images progressing through an ~600 nm depth of the heart muscle specimen. These series of images clearly demonstrates the limitations of 2D viewing of individual slices. Only when examined in series can the extent of the interactions between mitochondria and LDs be truly revealed. Figure 8.4 also illustrates one of the challenges of EM analysis of LDs in a complex tissue, that is, the identification of a processing method that preserves all organelles and the cellular content in conditions most representative of their natural state and most suitable for imaging. In order to stabilize the specimen and increase signal strength, sample preparation for FIB–SEM imaging often requires additional heavy metal staining, a process known to cause the unwanted extraction of LD stains. Although mitochondria and myofibrils are well preserved and stained, staining of LDs in this particular specimen is not homogenous and as the stain may have been extracted during sample processing. 3D volume reconstruction of the image stack reveals that the stain loss occurs in the inner core of the LDs (Fig. 8.5) and allows to slice through the block of tissue at various angles so as to view the interaction of LDs and mitochondria in the xy, yz, and xz planes (Fig. 8.5). A region of interest can be identified (subvolume) and selected for segmentation of LDs and mitochondria to examine the spatial arrangement and interactions between these two organelles. Figure 8.6 shows the 3D segmentation of LDs in a subvolume of 31.2 μm3 as indicated in Fig. 8.5A (framed in blue line). It is estimated that 33.2% of this subvolume is filled by LDs. One mitochondrian is segmented in Fig. 8.6B to illustrate the spatial arrangement and interactions between these two organelles and the change of mitochondria morphology due to the presence of large volume of LDs in this particular heart muscle specimen.
FIGURE 8.4.
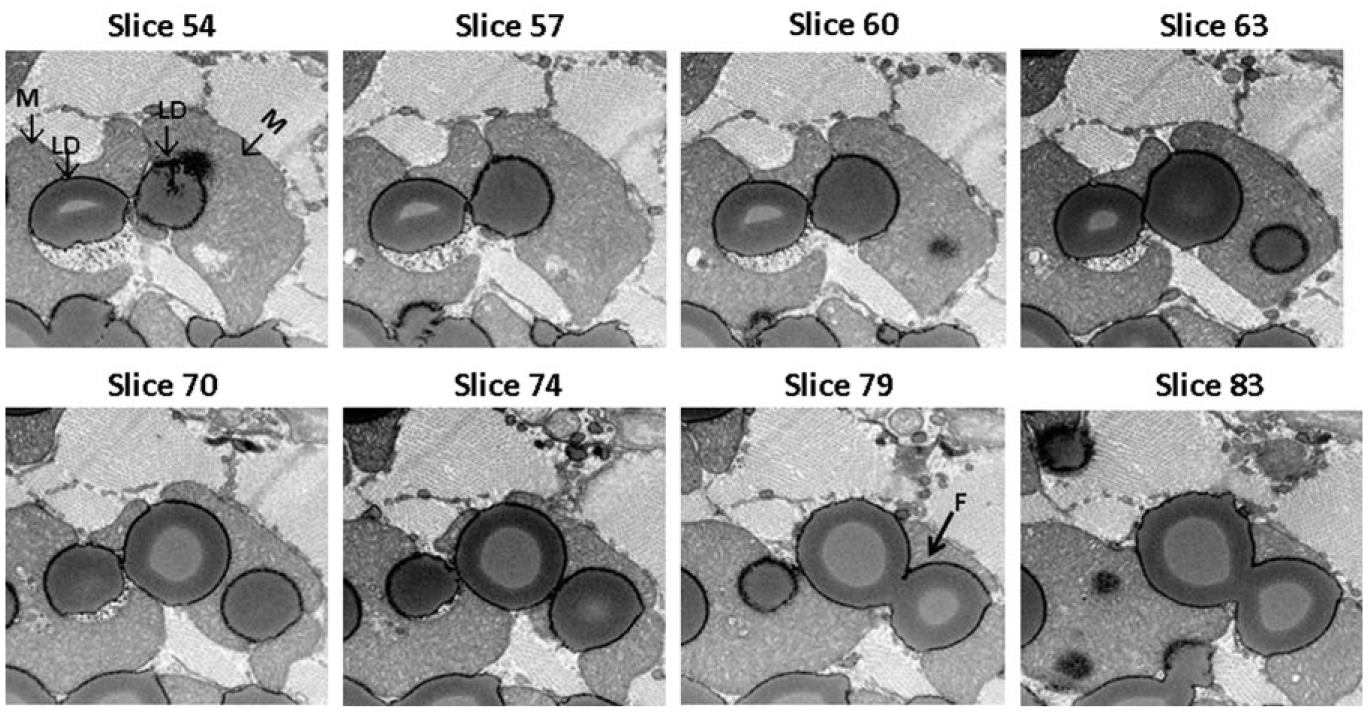
Selected FIB–SEM image slices. From slice 54 to slice 83 progressing through ~600 nm depth of the heart muscle specimen are presented. The fusion event between two LDs (white arrow) will most likely be missed by conventional TEM.
FIGURE 8.5.
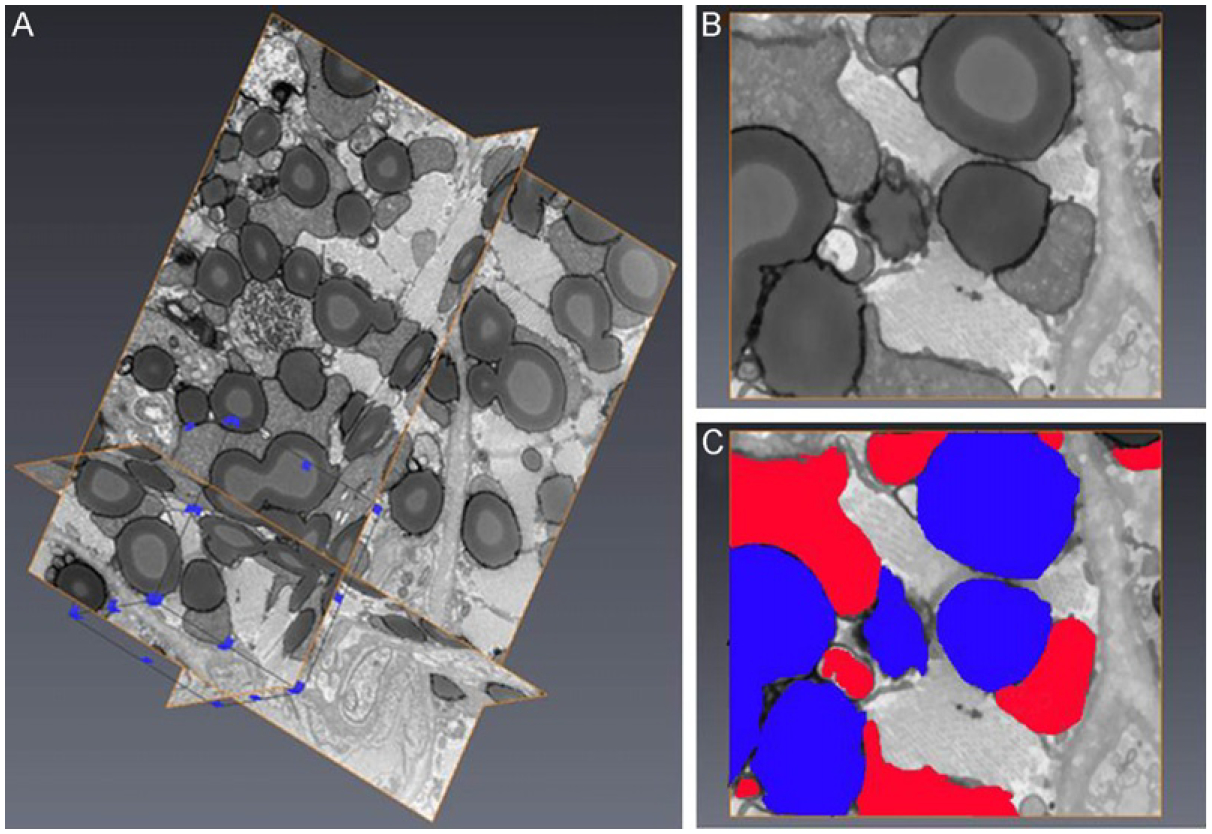
FIB–SEM image processing and reconstruction. (A) 3D visualization of a stack of 219 image slices from a transgenic mouse heart muscle embedded in Durcupan resin. Each slice thickness is 20 nm. A subvolume (framed in blue line) was selected for segmentation. (B) Example of one de-noised and shade corrected image slice before segmentation. (C) Segmentation of lipid droplets (blue) and mitochondria (red) of the image slice shown in (B).
FIGURE 8.6.
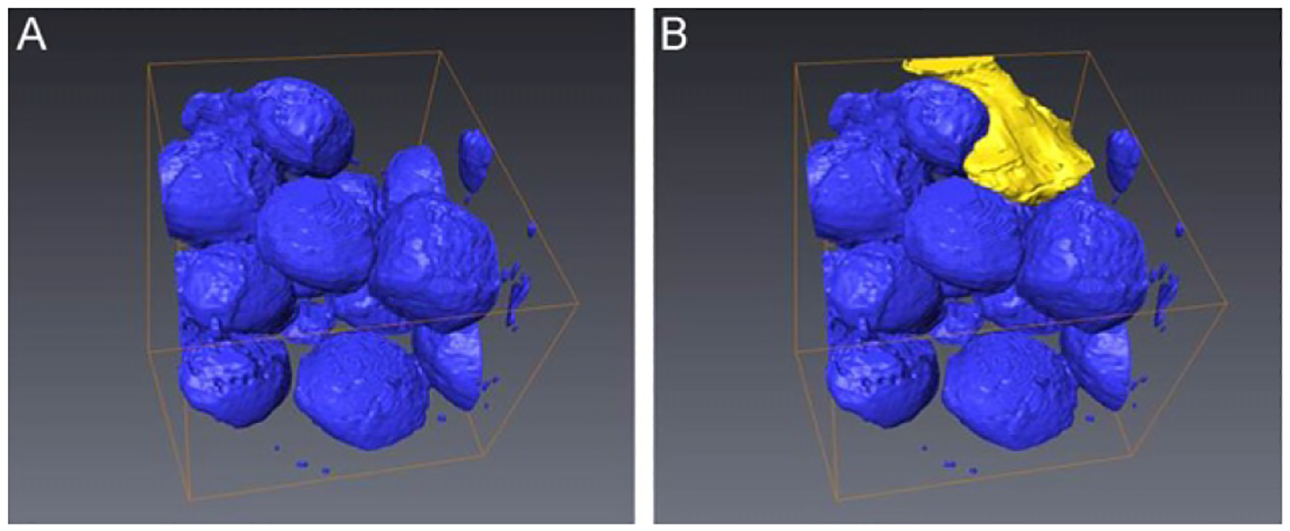
3D segmentation of a subvolume. (A) Segmentation of all LDs in the region of interest was performed and represented (blue) and (B), one single mitochondrian was selected to be segmented (yellow).
Although we are still in the process of improving the sample preparation method for FIB–SEM 3D analysis, we demonstrate the feasibility of studying LD fusions and LD–mitochondria interactions in cardiac muscle using FIB–SEM 3D imaging techniques. The automated image collection and relative easy sample preparation following traditional TEM sample processing will allow us to incorporate 3D EM for routine analysis of LDs in cardiac muscle tissue, study their interaction with mitochondria and its effect on the overall architecture of the heart muscle.
CONCLUSIONS
Elucidation of the mechanisms regulating cardiac LDs will continue to provide valuable information regarding the progression of cardiac dysfunction in metabolic diseases. The LD storage compartment is relatively small and is highly dynamic urging the needs to develop biochemical and imaging methodologies to better characterize the cardiac LD storage compartment and their interactions with mitochondria. Cardiac LD isolation and analysis of LD protein content are feasible but results will require confirmation by other in situ methodology that does not require organelles ex vivo fractionation.
While conventional TEM allows visualization and simple morphometric analysis of cardiac LDs, the 3D imaging approach using FIB–SEM may be a powerful and promising tool to study the dynamic interactions between LDs, mitochondria, and other organelles; especially because it can also be used to quantitatively analyze the interaction volume, surface area, and the architecture of heart muscle tissue. Combining FIB–SEM 3D imaging with immunolabeling or other antigen tagging techniques will allow us to study protein distribution and protein–protein interactions in a 3D volume and clearly validate or disprove a LD protein localization in various physiological or disease states. In addition, it may provide important information on cardiac LDs biogenesis and LD growth by localizing key proteins acting in these pathways.
Acknowledgments
We thank Dr Martin Woodle for careful review and helpful editing of the manuscript. We would like to thank Mr. Jeffrey Marshman of Carl Zeiss Microscopy, LLC for his help collecting the FIB–SEM data set; John Strong and Johanna Sotriris of Core Imaging Facility, University of Maryland for their help with specimen preparation; and Dr Tsengming (Alex) Chou of Laboratory for Multiscale Imaging of Stevens Institute of Technology for sharing his knowledge and experience of FIB–SEM. This work was supported by a career development award 1-05-CD-17 from the American Diabetes Association (to C. S.), a grant from NIH 1RO1 DK 075017 (to C. S.), a grant in aid 11GRNT7600027 from the American Heart Association (to C. S.), the Geriatric Research, Education and Clinical Center, Baltimore Veterans Affairs Health Care Center, the Clinical Nutrition Research Unit of Maryland (DK072488), and Intramural Research Programs of NIDDK.
References
- Angermuller S, & Fahimi HD (1982). Imidazole-buffered osmium tetroxide: An excellent stain for visualization of lipids in transmission electron microscopy. Histochemistry Journal, 14, 823–835. [DOI] [PubMed] [Google Scholar]
- Beller M, Sztalryd C, Southall N, Bell M, Jäckle H, Auld DS, et al. (2008). COPI complex is a regulator of lipid homeostasis. PLoS Biology, 6, e292. [DOI] [PMC free article] [PubMed] [Google Scholar]
- Bennett AE, Narayan K, Shi D, Hartnell LM, Gousset K, He H, et al. (2009). Ion-abrasion scanning electron microscopy reveals surface-connected tubular conduits in HIV-infected macrophages. PLoS Pathogens, 5, e1000591. [DOI] [PMC free article] [PubMed] [Google Scholar]
- Blanchette-Mackie EJ, & Scow RO (1983). Movement of lipolytic products to mitochondria in brown adipose tissue of young rats: An electron microscope study. Journal of Lipid Research, 24, 229–244. [PubMed] [Google Scholar]
- Borradaile NM, & Schaffer JE (2005). Lipotoxicity in the heart. Current Hypertension Reports, 7, 412–417. [DOI] [PubMed] [Google Scholar]
- Bosma M, Minnaard R, Sparks LM, Schaart G, Losen M, de Baets MH, et al. (2012). The lipid droplet coat protein perilipin 5 also localizes to muscle mitochondria. Histochemistry and Cell Biology, 137, 205–216. [DOI] [PMC free article] [PubMed] [Google Scholar]
- Brasaemle DL, & Bickel PE (2006). A proposed model of fat packaging by exchangeable lipid droplet proteins.Wolins NE. FEBS Letters, 580, 5484–5491. [DOI] [PubMed] [Google Scholar]
- Brasaemle DL, & Wolins NE (2006). Isolation of lipid droplets from cells by density gradient centrifugation. Current Protocols in Cell Biology, Chapter 3, Unit 3.15. [DOI] [PubMed] [Google Scholar]
- Brindley DN, Kok BP, Kienesberger PC, Lehner R, & Dyck JR (2010). Shedding light on the enigma of myocardial lipotoxicity: The involvement of known and putative regulators of fatty acid storage and mobilization. American Journal of Physioliogy-Endocrinology and Metabolism, 298, E897–E908. [DOI] [PubMed] [Google Scholar]
- Chiu HC, Kovacs A, Blanton RM, Han X, Courtois M, Weinheimer CJ, et al. (2005). Transgenic expression of fatty acid transport protein 1 in the heart causes lipotoxic cardiomyopathy. Circulation Research, 96, 225–233. [DOI] [PubMed] [Google Scholar]
- Chiu HC, Kovacs A, Ford DA, Hsu FF, Garcia R, Herrero P, et al. (2001). A novel mouse model of lipotoxic cardiomyopathy. The Journal of Clinical Investigation, 107, 813–822. [DOI] [PMC free article] [PubMed] [Google Scholar]
- Chokshi A, Drosatos K, Cheema FH, Ji R, Khawaja T, Yu S, et al. (2012). Ventricular assist device implantation corrects myocardial lipotoxicity, reverses insulin resistance, and normalizes cardiac metabolism in patients with advanced heart failure. Circulation, 125, 2844–2853. [DOI] [PMC free article] [PubMed] [Google Scholar]
- Christoffersen C, Bollano E, Lindegaard ML, Bartels ED, Goetze JP, Andersen CB, et al. (2003). Cardiac lipid accumulation associated with diastolic dysfunction in obese mice. Endocrinology, 144, 3483–3490. [DOI] [PubMed] [Google Scholar]
- Coen PM, & Goodpaster BH (2012). Role of intramyocellular lipids in human health. Trends in Endocrinology and Metabolism, 23, 391–398. [DOI] [PMC free article] [PubMed] [Google Scholar]
- Cornier MA, Dabelea D, Hernandez TL, Lindstrom RC, Steig AJ, Stob NR, et al. (2008). The metabolic syndrome. Endocrinology Reviews, 29, 777–822. [DOI] [PMC free article] [PubMed] [Google Scholar]
- Cox G, & Sheppard CJ (2004). Practical limits of resolution in confocal and non-linear microscopy. Microscope Research Technique, 63, 18–22. [DOI] [PubMed] [Google Scholar]
- Dalen KT, Dahl T, Holter E, Arntsen B, Londos C, Sztalryd C, et al. (2007). LSDP5 is a PAT protein specifically expressed in fatty acid oxidizing tissues. Biochimica et Biophysica Acta, 1771, 210–227. [DOI] [PubMed] [Google Scholar]
- de Bruijn WC, Schellens JP, van Buitenen JM, & van der Meulen J (1980). X-ray microanalysis of colloidal-gold-labelled lysosomes in rat liver sinusoidal cells after incubation for acid phosphatase activity. Histochemistry, 66, 137–148. [DOI] [PubMed] [Google Scholar]
- Ding Y, Zhang S, Yang L, Na H, Zhang P, & Zhang H (2013). Isolating lipid droplets from multiple species. Nature Protocols, 8, 43–51. [DOI] [PubMed] [Google Scholar]
- Greenberg AS, Coleman RA, Kraemer FB, McManaman JL, Obin MS, Puri V, et al. (2011). The role of lipid droplets in metabolic disease in rodents and humans. The Journal of Clinical Investigation, 121, 2102–2110. [DOI] [PMC free article] [PubMed] [Google Scholar]
- Guyton JR, Bocan TM, & Schifani TA (1985). Quantitative ultrastructural analysis of perifibrous lipid and its association with elastin in nonatherosclerotic human aorta. Arteriosclerosis, 5, 644–652. [DOI] [PubMed] [Google Scholar]
- Guyton JR, & Klemp KF (1988). Ultrastructural discrimination of lipid droplets and vesicles in atherosclerosis: Value of osmium-thiocarbohydrazide-osmium and tannic acid-paraphenylenediamine techniques. Journal of Histochemistry and Cytochemistry, 36, 1319–1328. [DOI] [PubMed] [Google Scholar]
- Haemmerle G, Moustafa T, Woelkart G, Büttner S, Schmidt A, van de Weijer T, et al. (2011). ATGL-mediated fat catabolism regulates cardiac mitochondrial function via PPAR-α and PGC-1. Nature Medicine, 17, 1076–1085. [DOI] [PMC free article] [PubMed] [Google Scholar]
- Harris LA, Shew TM, Skinner JR, & Wolins NE (2012). A single centrifugation method for isolating fat droplets from cells and tissues. Journal of Lipid Research, 53, 1021–1025. [DOI] [PMC free article] [PubMed] [Google Scholar]
- Hayat MA (1970). Principles and techniques of electron microscopy: biological applications (Vol. 1). New York and London: Van Nostrand Reinhold. [Google Scholar]
- Heymann JA, Hayles M, Gestmann I, Giannuzzi LA, Lich B, & Subramaniam S (2006). Site-specific 3D imaging of cells and tissues with a dual beam microscope. Journal of Structural Biology, 155, 63–73. [DOI] [PMC free article] [PubMed] [Google Scholar]
- Heymann JA, Shi D, Kim S, Bliss D, Milne JL, & Subramaniam S (2009). 3D imaging of mammalian cells with ion-abrasion scanning electron microscopy. Journal of Structural Biology, 166, 1–7. [DOI] [PMC free article] [PubMed] [Google Scholar]
- Jacob S (1987). Lipid droplet accumulation in the heart during fasting. Acta Histochemica, 82, 149–153. [DOI] [PubMed] [Google Scholar]
- Khan RS, Drosatos K, & Goldberg IJ (2010). Creating and curing fatty hearts. Current Opinion in Clinical Nutrition and Metabolism Care, 13, 145–149. [DOI] [PMC free article] [PubMed] [Google Scholar]
- Knott G, Marchman H, Wall D, & Lich B (2008). Serial section scanning electron microscopy of adult brain tissue using focused ion beam milling. Journal of Neuroscience, 28, 2959–2964. [DOI] [PMC free article] [PubMed] [Google Scholar]
- Knott G, Rosset S, & Cantoni M (2011). Focused ion beam milling and scanning electron microscopy of brain tissue. Journal of Visusalized Experiments, 53, e2588. [DOI] [PMC free article] [PubMed] [Google Scholar]
- Kuramoto K, Okamura T, Yamaguchi T, Nakamura TY, Wakabayashi S, Morinaga H, et al. (2012). Perilipin 5, a lipid droplet-binding protein, protects the heart from oxidative burden by sequestering fatty acid from excessive oxidation. The Journal of Biological Chemistry, 287, 23852–23863. [DOI] [PMC free article] [PubMed] [Google Scholar]
- Listenberger LL, Han X, Lewis SE, Cases S, Farese RV Jr., Ory DS, et al. (2003). Triglyceride accumulation protects against fatty acid-induced lipotoxicity. Proceedings of the National Academy of Sciences of the United States of America, 100, 3077–3082. [DOI] [PMC free article] [PubMed] [Google Scholar]
- Liu L, Zhang Y, Chen N, Shi X, Tsang B, & Yu YH (2007). Upregulation of myocellular DGAT1 augments triglyceride synthesis in skeletal muscle and protects against fat-induced insulin resistance. Journal of Clinical Investigation, 117, 1679–1689. [DOI] [PMC free article] [PubMed] [Google Scholar]
- Lopaschuk GD, Ussher JR, Folmes CD, Jaswal JS, & Stanley WC (2010). Myocardial fatty acid metabolism in health and disease. Physiology Reviews, 90, 207–258. [DOI] [PubMed] [Google Scholar]
- Marín-García J, & Goldenthal MJ (2008). Mitochondrial centrality in heart failure. Heart Failure Reviews, 13, 137–150. [DOI] [PubMed] [Google Scholar]
- McIntosh R, Nicastro D, & Mastronarde D (2005). New views of cells in 3D: An introduction to electron tomography. Trends in Cell Biology, 15, 43–51. [DOI] [PubMed] [Google Scholar]
- Murphy GE, Lowekamp BC, Zerfas PM, Chandler RJ, Narasimha R, Venditti CP, et al. (2010). Ion-abrasion scanning electron microscopy reveals distorted liver mitochondrial morphology in murine methylmalonic acidemia. Journal of Structural Biology, 171, 125–132. [DOI] [PMC free article] [PubMed] [Google Scholar]
- Murphy GE, Narayan K, Lowekamp BC, Hartnell LM, Heymann JA, Fu J, et al. (2011). Correlative 3D imaging of whole mammalian cells with light and electron microscopy. Journal of Structural Biology, 176, 268–278. [DOI] [PMC free article] [PubMed] [Google Scholar]
- Neiss WF (1983). Extraction of osmium-containing lipids by section staining for TEM. Histochemistry, 79, 245–250. [DOI] [PubMed] [Google Scholar]
- Nishino N, Tamori Y, Tateya S, Kawaguchi T, Shibakusa T, Mizunoya W, et al. (2008). FSP27 contributes to efficient energy storage in murine white adipocytes by promoting the formation of unilocular lipid droplets. The Journal of Clinical Investigation, 118, 2808–2821. [DOI] [PMC free article] [PubMed] [Google Scholar]
- Park TS, Yamashita H, Blaner WS, & Goldberg IJ (2007). Lipids in the heart: a source of fuel and a source of toxins. Current Opinion in Lipidology, 18, 277–282. [DOI] [PubMed] [Google Scholar]
- Pollak NM, Schweiger M, Jaeger D, Kolb D, Kumari M, Schreiber R, et al. (2013). Cardiac-specific overexpression of perilipin 5 provokes severe cardiac steatosis via the formation of a lipolytic barrier. Journal of Lipid Research, 54, 1092–1102. [DOI] [PMC free article] [PubMed] [Google Scholar]
- Reingold JS, McGavock JM, Kaka S, Tillery T, Victor RG, & Szczepaniak LS (2005). Determination of triglyceride in the human myocardium by magnetic resonance spectroscopy: reproducibility and sensitivity of the method. American Journal of Physiology-Endocrinololgy and Metabolism, 289, E935–E939. [DOI] [PubMed] [Google Scholar]
- Saha PK, Kojima H, Martinez-Botas J, Sunehag AL, & Chan L (2004). Metabolic adaptations in the absence of perilipin: increased beta-oxidation and decreased hepatic glucose production associated with peripheral insulin resistance but normal glucose tolerance in perilipin-null mice. The Journal of Biological Chemistry, 279, 35150–35158. [DOI] [PubMed] [Google Scholar]
- Sharma S, Adrogue JV, Golfman L, Uray I, Lemm J, Youker K, et al. (2004). Intramyocellular lipid accumulation in the failing human heart resembles the lipotoxic rat heart. The FASEB Journal, 18, 1692–1700. [DOI] [PubMed] [Google Scholar]
- Shaw CS, Jones DA, & Wagenmaker AJ (2008). Network distribution of mitochondria and lipid droplets in human muscle fibres. Histochemistry and Cell Biology, 129, 65–72. [DOI] [PubMed] [Google Scholar]
- Son NH, Park TS, Yamashita H, Yokoyama M, Huggins LA, Okajima K, et al. (2007). Cardiomyocyte expression of PPARgamma leads to cardiac dysfunction in mice. The Journal of Clinical Investigation, 117, 2791–2801. [DOI] [PMC free article] [PubMed] [Google Scholar]
- Straub BK, Gyoengyoesi B, Koenig M, Hashani M, Pawella LM, Herpel E, et al. (2013). Adipophilin/perilipin-2 as a lipid droplet-specific marker for metabolically active cells and diseases associated with metabolic dysregulation. Histopathology, 62, 617–631. [DOI] [PubMed] [Google Scholar]
- Szczepaniak LS, Victor RG, Orci L, & Unger RH (2007). Forgotten but not gone: the rediscovery of fatty heart, the most common unrecognized disease in America. Circulation Research, 101, 759–767. [DOI] [PubMed] [Google Scholar]
- Tarnopolsky MA, Rennie CD, Robertshaw HA, Fedak-Tarnopolsky SN, Devries MC, & Hamadeh MJ (2007). Influence of endurance exercise training and sex on intramyocellular lipid and mitochondrial ultrastructure, substrate use, and mitochondrial enzyme activity. American Journal of Physiology: Regulatory Integrative and Comparative Physiology., 292, R1271–R1278. [DOI] [PubMed] [Google Scholar]
- Wang H, Sreenevasan U, Hu H, Saladino A, Polster BM, Lund LM, et al. (2011). Perilipin 5, lipid droplet associated protein provides physical and metabolic linkage to mitochondria. Journal of Lipid Research, 52, 2159–2168. [DOI] [PMC free article] [PubMed] [Google Scholar]
- Wang H, Sreenivasan U, Gong DW, O’Connell KA, Dabkowski ER, Hecker PA, et al. (2013). Cardiomyocyte specific perilipin 5 over expression leads to myocardial steatosis, and modest cardiac dysfunction. Journal of Lipid Research, 54, 953–965. [DOI] [PMC free article] [PubMed] [Google Scholar]
- Wei D, Jacobs S, Modla S, Zhang S, Young CL, Cirino R, et al. (2012). High-resolution three-dimensional reconstruction of a whole yeast cell using focused-ion beam scanning electron microscopy. Biotechniques, 53, 41–48. [DOI] [PubMed] [Google Scholar]
- Wende AR, & Abel ED (2010). Lipotoxicity in the heart. Biochimica et Biophysica Acta, 1801, 311–319. [DOI] [PMC free article] [PubMed] [Google Scholar]
- Xu G, Sztalryd C, Lu X, Tansey JT, Gan J, Dorward H, et al. (2005). Post-translational regulation of adipose differentiation-related protein by the ubiquitin/proteasome pathway. The Journal of Biological Chemistry, 280, 42841–42847. [DOI] [PubMed] [Google Scholar]
- Zimmermann R, Strauss JG, Haemmerle G, Schoiswohl G, Birner-Gruenberger R, et al. (2004). Defective lipolysis and altered energy metabolism in mice lacking ATGL. Science, 306, 1383–1386.15550674 [Google Scholar]