

Abstract
Silver nanoparticles (AgNPs) are widely incorporated into consumer and biomedical products for their antimicrobial and plasmonic properties with limited risk-assessment of low-dose cumulative exposure in humans. To evaluate cellular responses to low-dose AgNP exposures across time, human liver cells (HepG2) were exposed to AgNPs with three different surface charges (1.2 μg mL−1) and complete gene expression was monitored across a 24-hour period. Time and AgNP surface chemistry mediate gene expression. In addition, time since cells were fed had marked effects on gene expression that should be considered. Surface chemistry of AgNPs alter gene transcription in a time-dependent manner, with the most dramatic effects in cationic AgNPs. Universal to all surface-coatings, AgNP-treated cells responded by inactivating proliferation and enabling cell cycle checkpoints. Further analysis of these universal features of AgNP cellular response, as well as more detailed analysis of specific AgNP treatments, time points, or specific genes is facilitated with an accompanying application. Taken together, these results provide a foundation for understanding hepatic response to low-dose AgNPs for future risk assessment
Keywords: Transcriptomics, nanotoxicity, silver nanoparticles
Graphical Abstract
Silver nanoparticles (AgNPs) are widely incorporated into consumer products and used medically for their biocidal properties,[1] with applications in biosensing, imaging, and therapies. As concerns of frequent and cumulative exposures increase, AgNP toxicity has drawn considerable attention.[2,3]Most exposure studies to date involve atypical high-dose concentrations of AgNPs. In an oral exposure study in rats (28 days, 90 mg AgNPs kg−1 body weight), the body burden of silver was primarily seen in liver and spleen, with substantial AgNP clearance 8 weeks post-treatment.[4] Yet, predicted exposure for a typical consumer is significantly lower. One report simulated AgNP exposure based on laboratory results to give a range around 10−5 mg AgNPs kg−1 body weight day−1.[5] In cellular studies, AgNPs trigger stress responses (e.g. oxidative stress, inflammation, hypoxic response) and initiate signaling cascades that eventually trigger organelle autophagy and apoptosis.[3] Lower dose studies also find significant differences in gene pathways. Human HaCaT keratinocyte cells[6] with daily exposures at pg mL−1 concentrations of AgNPs (50 nm) displayed no cytotoxic response, but showed upregulation of stress and signaling responses. Similarly, lung bronchial cells (BEA-2B)[7,8] exposed to μg mL−1 concentrations of AgNPs (10 nm) were pro-fibrotic, inducing epithelial-mesenchymal transition and cell transformation. Despite the fact that inhalation, oral ingestion, and injection routes of exposure at high doses typically show accumulation in the liver, kidneys, and/or spleen,[3] few low-dose studies have been performed to characterize changes in gene expression[9,10]. Increasing human AgNP exposures, combined with limited data on low-dose response, signal a need for additional low dose exposure research to aid risk assessment.
Conventional cellular response assays that rely on colorimetric or fluorescent indicators have posed issues with physiochemical NP properties and are limited in their ability to uncover how NPs affect biological systems. A transcriptomic approach allows for profiling of multifactorial experiments and for unrestricted and unbiased assessment of cellular responses to NPs without the use of dyes.[11–13] More recently, transcriptomics analyses have broadened insight into the molecular mechanisms of NP toxicity.[11–13] By monitoring changes in RNA and mRNA as a whole, transcriptomics experiments have identified new targets and markers for NP toxicity,[14–16] including the assessment of long-term effects of low-dose AgNP exposure on mammalian cells.[8,17]
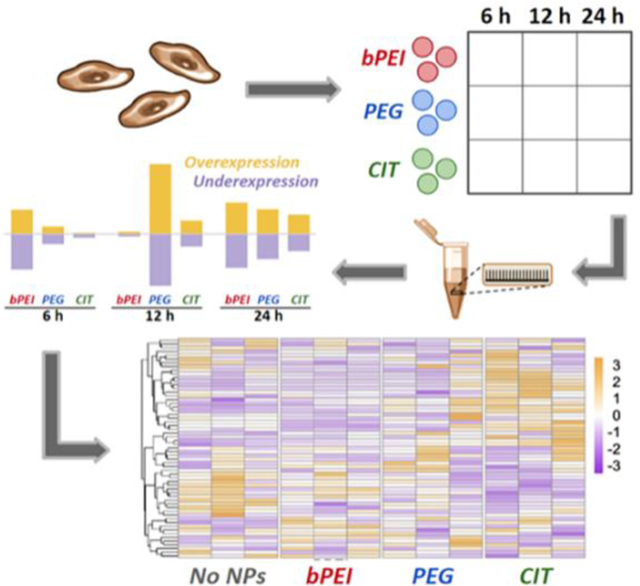
In the present work, we assessed the effects of time and AgNP (40 nm) surface coatings on whole-transcriptome gene expression in HepG2 (immortalized human liver cancer cell line) cells. Treatment samples (AgNPs with surfaces of positively charged branched polyethylenimine (bPEI), negatively charged citrate (CIT), and circumneutral polyethylene glycol (PEG)) and no-nanoparticle (NoNP) controls were collected for targeted gene expression sequencing at 6, 12, and 24 hours. With a focus on the initial 24 hours of exposure, we identified both temporal and surface-coating specific changes in gene expression, as well as surface-coating independent changes in gene expression.
Surface coating structures for the sample AgNP library are shown in Figure 1A. The average diameter, as characterized by transmission electron microscopy, was 39 ± 3, 41 ± 5, and 39 ± 4 nm for bPEI-, CIT- and PEG-coated AgNPs, respectively. Additional characterization of AgNPs in water (or 5 mM citrate for CIT-coated AgNPs) and media is available in Figure S1. Consistent with previous studies of noble metal NPs in complex media,[18] the hydrodynamic diameter for all three AgNPs increased in media, with the most significant agglomeration in CIT- and bPEI- coated AgNPs. Although the AgNPs were likely coated in a protein corona upon immersion in cell media,[19] full characterization of the corona is beyond the scope of this study.
Figure 1. (A).

(A) Chemical structure of AgNP surface-coatings. (B) Cellular proliferation from a WST-1 assay results for two doses of AgNPs at 24 and 72 h post-treatment (grey and black, respectively). Data corrected by subtracting background absorbance due to nanoparticles and normalized to non-treated controls. *P<0.05 for viability of cells exposed to 2 μg/mL bPEI-coated AgNPs compared with cells exposed to 2 μg/mL CIT- and PEG-coated AgNPs on day 3, and for viability of cells exposed to 20 μg/mL bPEI- coated AgNPs compared with cells exposed to 20 μg/mL CIT- and PEG-coated AgNPs on days 1 and 3, as determined by Student’s unpaired two-tailed t test. (C) Principal component analysis on the top 500 expressed transcripts (raw scaled counts) graphed for PC1 (33.4% explained variation) vs. PC2 (22.9% explained variation). (D) Venn diagram of differentially expressed genes (FDR = 10%) due to differences in time in non-AgNP treated controls.
To assess the proper AgNP dose for transcriptomics, cell viability was monitored with a WST-1 assay 24- and 72-hours post-treatment with 2 and 20 μg mL−1 AgNPs (Figure 1B). Neutral PEG- and negatively charged CIT-coated AgNPs were minimally toxic regardless of concentration or duration of exposure, while exposure to bPEI coated AgNPs reduced viability. The observed discrepancies in cell viability may be due to several factors, including differences in cellular uptake and intracellular trafficking, events highly dependent on NP physicochemical properties such as size, shape, transformations (e.g. agglomeration), and surface chemistry.[20,21] Given the compromised viability for cells treated with 2 μg mL−1 bPEI-coated AgNPs, a dose of 1.2 μg mL−1 was chosen for transcriptomics analyses, where no observable changes in viability vs. untreated were measured (Figure S2).
Low-dose AgNP-induced changes in gene expression were assessed at 6, 12, and 24 hours post-exposure using TempO-Seq (n=3). After removing extremely low expressing transcript counts across the sample space (Figure S3), we assessed 2–3 replicates for each condition (NoNP, bPEI, PEG, CIT) and time (6, 12, and 24 hour) combination across 13 133 genes.
Principal component analysis of scaled raw counts revealed a marked temporal effect, as well as differences between surface coatings of AgNP and gene expression (Figure 1C). Others have reported on the effects of AgNP surface coating on transformations in biofluids,[22] including colloidal stability, aggregation state, oxidative dissolution to form Ag(I) ions, and protein corona formation. Each of these AgNP transformations can impact bioavailability, response, and toxicity.[22] Surface coatings also impact cellular uptake, translocation, and accumulation of AgNPs, events that directly impact cell toxicity.[23] Results from gold NPs reinforce findings that NP surface chemistry not only determines NP uptake, but also affects relevant cellular pathways including proliferation, apoptosis, and oncogenesis as determined by transcriptomic analysis.[24]
For a deeper understanding of temporal changes in gene expression, we examined NoNP controls at each time point. Even within the controls, the differentially expressed genes (DEGs) at each time point are distinctly different (Figure 1D). To ensure these time-related changes were not an experimental artifact, we compared results from our 12 vs 24 hour data to differential gene expression of HepG2 control cells in a public dataset (GSE53216[25]). Consistent across both studies, pathways associated with cellular replication were enriched, likely reflecting changes due to time since cells were last fed (Figure S4).
Given the importance of post-treatment time for the controls, it is no surprise that both time and AgNP type elicited differences in gene expression across samples (Figures 1D and 2A). The greatest effect of AgNP treatment was seen at 12 hours post-treatment with CIT-coated AgNPs (840/618 up/down regulated). Interestingly, cells treated with bPEI-coated AgNPs exhibited a biphasic response with substantial differential gene regulation at 6 hours (n=797) and 24 hours (n=789), but very little at 12 hours (n = 60). Further examination of DEGs for the bPEI-treated samples reveals significant differences between 6- and 24-hour time points, with only 97 genes affected at both time points (Figure 2B). Clearly, time since last media replacement has a strong influence on DEG across treatments (Figures 1C, 2A, and S4). The importance of time post-treatment is particularly interesting, since it is often an overlooked variable.[6–8] Our study highlights the importance of separate controls for each treatment time point.
Figure 2. (A).
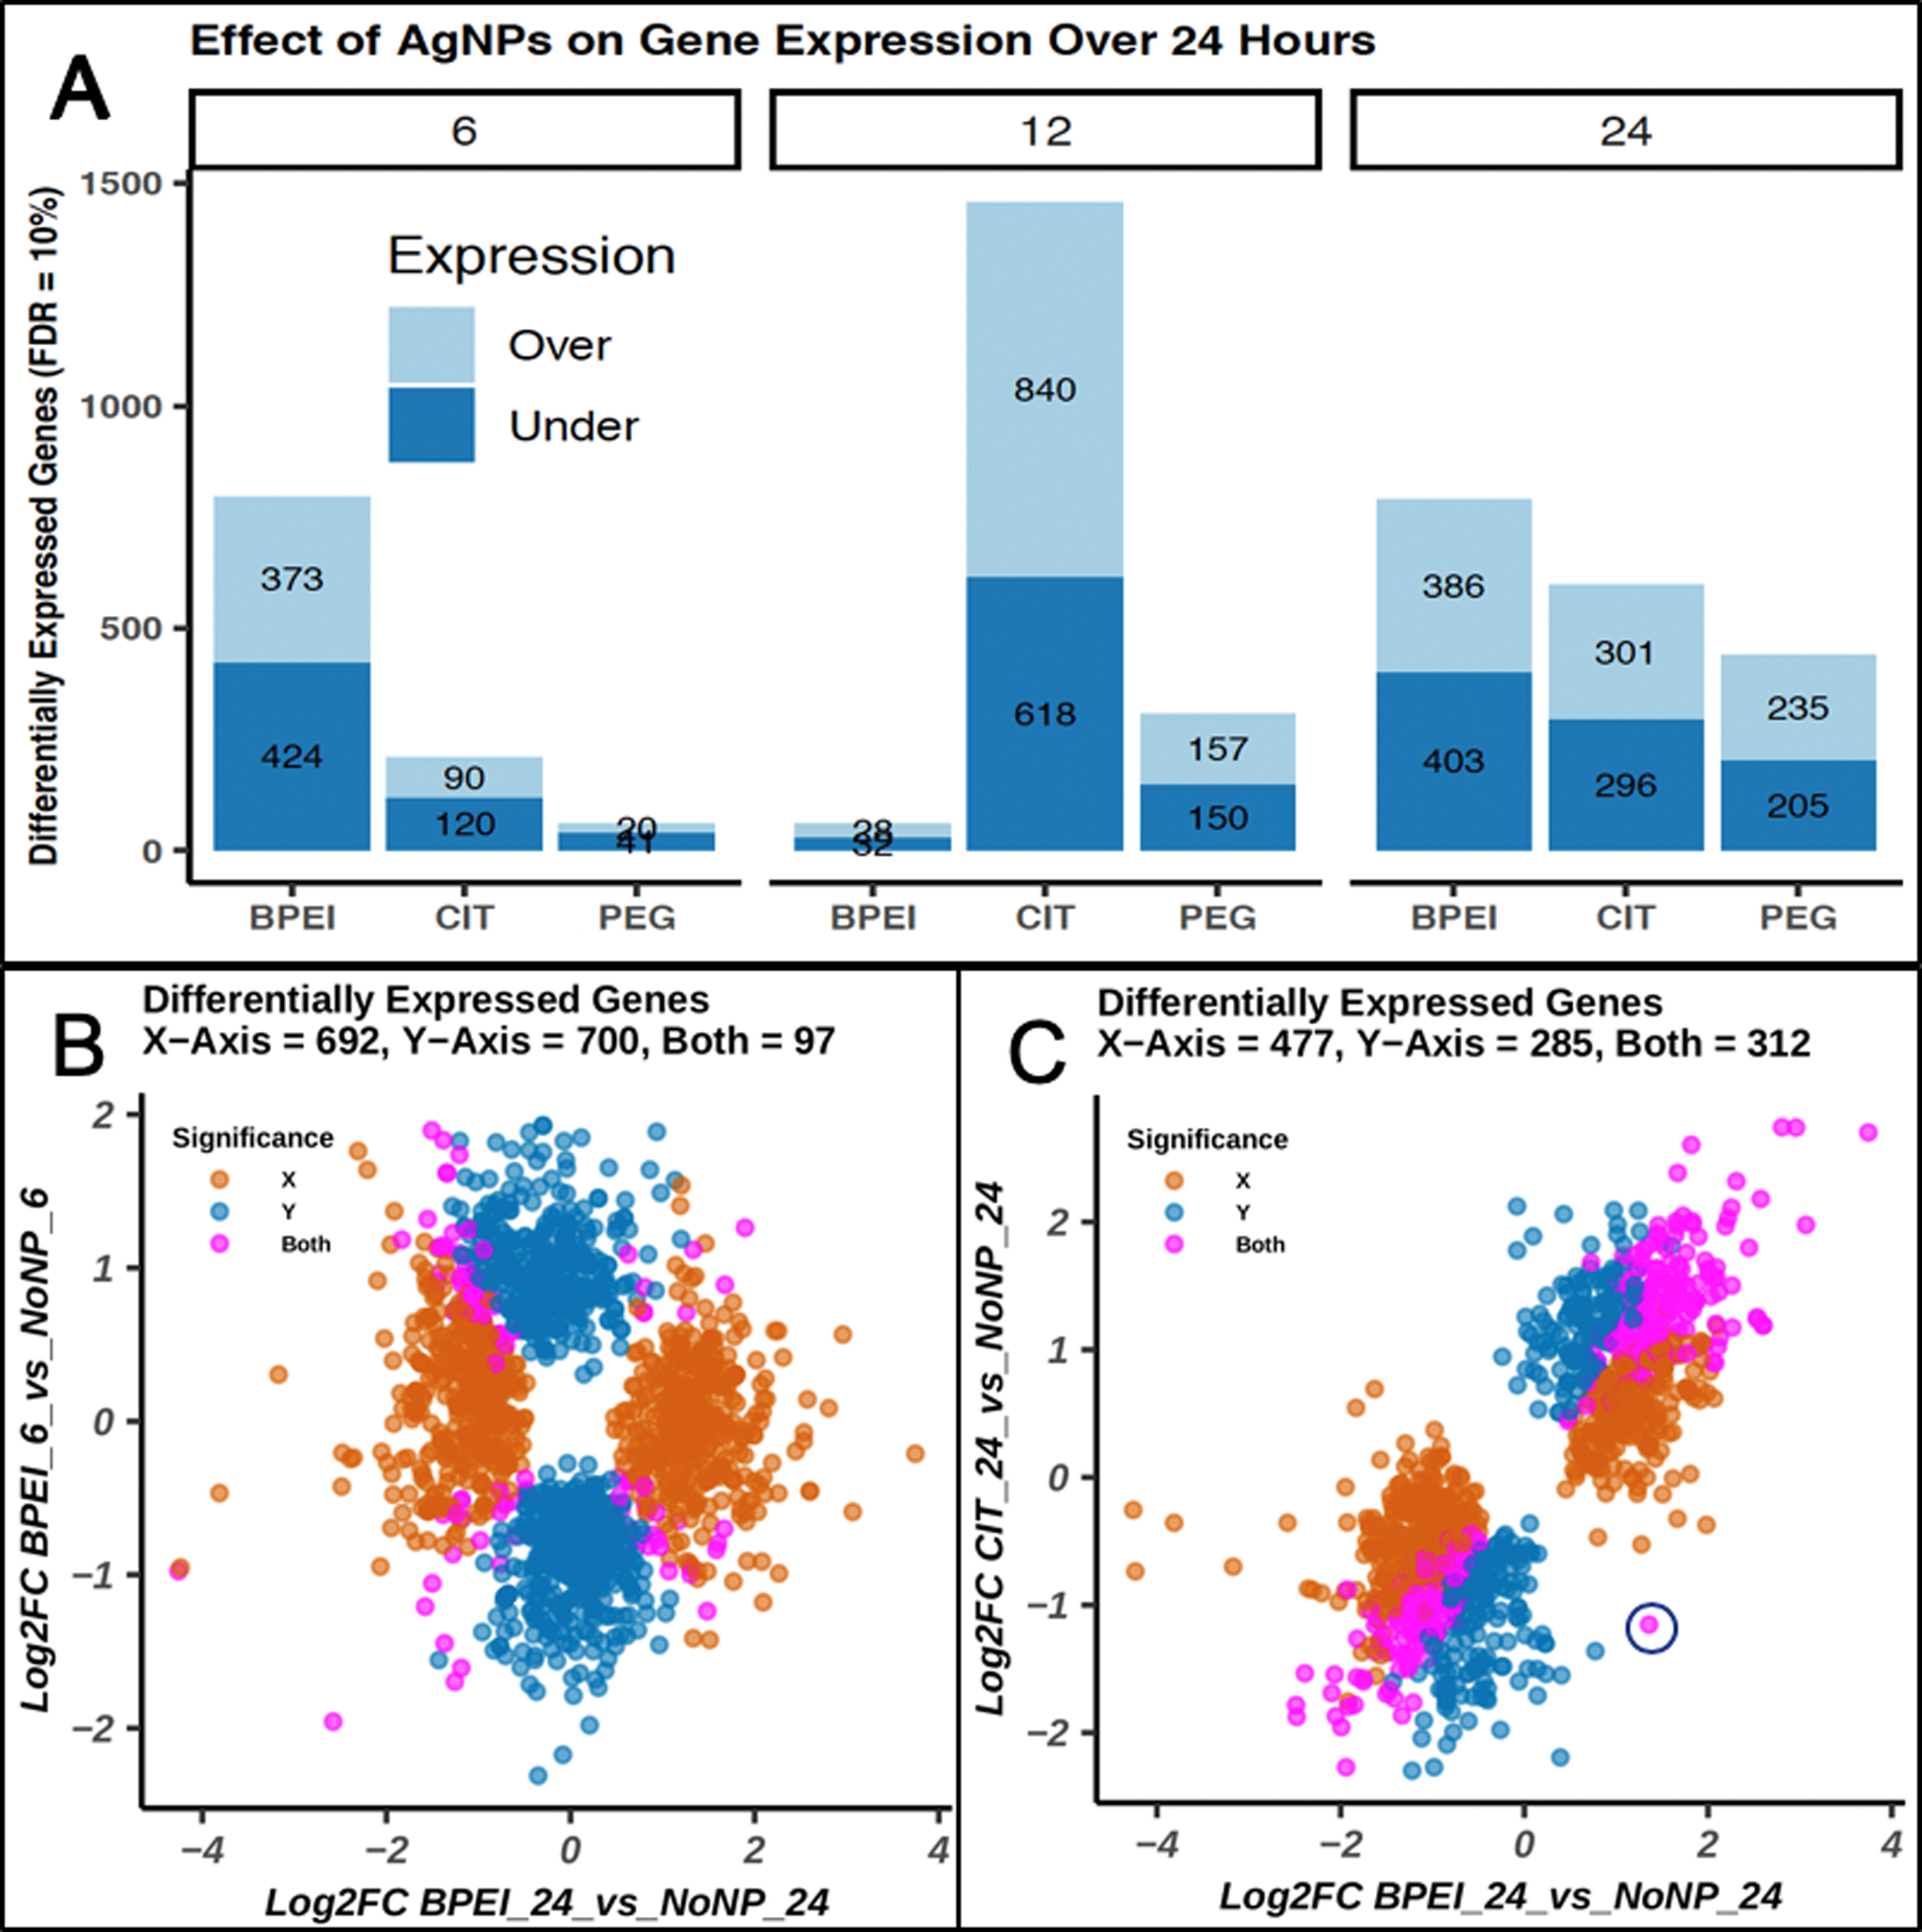
(A) Bars represent the number genes up- and down-regulated by NP treatment across time (FDR = 10%) (B-C) Log2(fold change) is plotted for two comparisons. (B) X-axis - BPEI 24 h vs. NoNP; Y-axis - BPEI 6 h vs NoNP, (C). X-axis - BPEI 24 h vs. NoNP; Y-axis - CIT 24 h vs. NoNP. Log2(fold change) values for genes with FDR < 10% for the X-axis comparison (orange) and Y-axis comparison (blue) are plotted. Genes significantly differentially expressed across both comparisons are shown in magenta. Blue circle represents discordant regulation of the Metallothionein 1M (MT1M) gene between two comparisons.
The role of AgNP surface coatings in toxicity and cellular response has received significant attention.[3,26–31] In our dataset, a comparison of DEGs across cells treated with bPEI or CIT-coated AgNPs at 24 hours have overlap in gene expression (n = 312 coordinately regulated DEGs; 1 discordantly regulated (Figure 2C circle)), as well as very distinct differences (n=477 unique DEGs (bPEI) and n=285 unique DEGs (CIT)). These figures are exemplars, but all contrasts and genes with annotation can be explored in our accompanying Rshiny application (https://www.niehs.nih.gov/research/resources/software/biostatistics/agnp/index.cfm)).
To evaluate genes with significant differential expression due solely to AgNP treatment (and not time), we incorporated an analysis of variance (ANOVA) model to correct for time and then tested for genes differing by treatment (n = 660/744 up/down-regulated genes (FDR = 10%)). These results were used for Reactome pathway analysis, and as expected, some cell-cycle specific pathways were temporal in nature (Figure S4, Supporting Information) and were no longer seen after ANOVA analysis. The resulting data reveal pathways enriched due to any treatment difference after experimental variation associated with time in culture since last feeding has been removed (Figure 3A). Many enriched pathways from this analysis are consistent with previous studies at higher AgNP doses, where DEGs are linked to inflammation and fibrosis (TGF-β/Smad signaling),[8,32] cellular metabolism (TCA cycle),[33] and platelet activation and aggregation (intracellular Ca2+).[34,35] While blood compatibility of AgNPs is unclear,[36] contradictory results are likely due to differences in AgNP surface chemistry[37] or due to differing protein corona compositions.[22,28] Finally, some studies report changes in metallothionein expression from AgNP exposure.[9,38] Despite differential expression of some metallothioneins in our analysis, we do not find global changes in expression of metallothioneins here (analysis available in the RShiny application).
Figure 3. (A).

(A) Reactome pathway analysis of treatment after removing effect of time. (B) Genes significant for differential expression due to any treatment after accounting for temporal variation (at FDR = 10%) were analyzed for Reactome pathway enrichment. The FDR for enrichment analysis is shown on X-axis. Row-scaled normalized count for 12 h time point for TGF-β Receptor Signaling (Reactome) (B). Columns are replicates.
As an exemplar, normalized feature-scaled counts are shown for the TGF-β signaling pathway at 12 hours (Figure 3B). Cells treated with CIT-coated AgNPs have an expression pattern in this pathway that differs from PEG, bPEI, and NoNP. Further, genes in the TBG-β pathway are differentially expressed by both time and treatment conditions (Figure S5). Interestingly, the TGF-β pathway has been highlighted in DEG studies in low dose, long term exposure to AgNPs in pulmonary cells as well.[8] Highlighted as important pro-fibrotic growth factor, this is consistent with other studies noting a fibrotic response to AgNPs with various coatings.[31] Even with variability between replicates within treatment (Figure 3B) substantial differences in gene expression and pathway analyses were still observed.
Given the prevalence of pathways involved in cell cycle checkpoints and proliferation across AgNP surface coatings (Figure S6), as well as temporally in NoNP controls (Figure S4), we utilized Ingenuity Pathways Analysis (IPA) to understand whether these pathways were differentially activated/inactivated. Not surprisingly, in the 24 hours after last feeding, HepG2 cells strongly activated pathways associated with proliferation, motility, and cancer (Figure 4A). Similarly, upstream effector analysis indicated signaling that results in cellular proliferation (Figure 4B). In contrast, all AgNP treatments, irrespective of surface coating, tended to exert the opposite effect, or an inactivation of pathways and processes associated with growth, while activating those associated with cell cycle checkpoints and DNA damage response (Figure 4). For example, the top predicted upstream regulator NUPR1, which is highly activated due to time in NoNP controls while highly inactivated in AgNP treatment at 24 hours, is implicated in cellular growth, migration, and metastasis in liver cancer cells, with overexpression in various malignancies.[39]
Figure 4.

IPA at 24 h of exposure. Log2(fold change) and adjusted p-values were uploaded to IPA for analysis of predicted activation/inactivation. The top 15 largest mean(abs(Z-score)) are displayed. The color represents the strength of IPA’s predicted (Z-score) activation (orange) or inactivation (purple) of respective Disease Ontology. Grey indicates non-significant calls for activation/inactivation (A) or upstream effector (B). Cell text corresponds to enrichment p-value.
Other reports have demonstrated that cationic NPs mediate increased toxicity.[3,22,30,31] We found similar results. Across both the IPA disease ontologies and upstream effectors analyses (Figure 4), treatment with bPEI-coated AgNPs showed a greater strength of activation or inactivation than other AgNP treatments. This suggests treatment with bPEI-coated AgNPs drives greater cellular response than other surface coatings, which is consistent with observations in Figures S6 and 2.
Differentially expressed genes from the ANOVA analysis are ideal targets for future studies to interrogate low-dose cellular responses across AgNPs. Extensive interrogation of the full expanse of this dataset is beyond our scope. As mentioned previously, all pathways in multiple ontology sets (Hallmark, GO:BP, Reactome) can be interrogated with the accompanying Rshiny application. By making the fully processed dataset freely accessible for analysis, other researchers can interrogate genes and pathways of interest for hypothesis generation. While resources like gene expression omnibus (GEO)[40] make datasets publicly available, it does not provide the tools for other investigators to immediately reproduce the analysis plan used, or to interactively interrogate the data further without building an independent bioinformatics and statistics pipeline. It is our hope that providing the tools for further investigation and interpretation maximizes the impact of the data collected here.
In summary, we characterize the effects of low dose AgNPs with different surface chemistries on whole genome transcriptional responses in human hepatocytes. Firstly, time in culture after treatment and appropriate controls are requisites for meaningful interpretation of treatments and our results highlight the importance of both time since treatment and surface coatings of AgNPs in mediating hepatic cellular responses. Secondly, independent of time, treatment with AgNPs functions to slow growth and proliferation 24 hours after treatment. Taken together, and with the provided application to interrogate all experimental data, these data will inform future targeted experiments and interpretation of hepatic responses to low-dose AgNPs for better future risk assessment. Lastly, these data are highly multi-variate, with a large number of potential comparisons. While AgNP research has been active, most studies to date have relied on fewer transcriptomic endpoints and our exploratory tool will enable future studies to drill down on specific genes or assays to interrogate the pathways and associates discovered here. Results can be used to design future studies to further push the boundaries toward realistic consumer exposure scenarios, including chronic exposure studies with longer terms, with extremely low-doses, and/or in whole organisms.
Material and Methods
Particles
Silver nanospheres (40 nm) surface coated with CIT, bPEI, and PEG (nanoComposix, San Diego, CA) were characterized by the manufacturer in 2 mM aqueous citrate (CIT-coated AgNPs) or Milli-Q water (bPEI- and PEG-coated) by the manufacturer for hydrodynamic diameter / zeta potential (Malvern Zetasizer Nano ZS), spectral properties (Agilent 8453 UV-Visible Spectrometer), and diameter (JEOL 1010 Transmission Electron Microscope). In house, hydrodynamic diameter measurements were obtained (ZetaPlus Particle Sizing instrument, Brookhaven Instruments Corp, NY). AgNPs were diluted to 0.125 μg mL−1 in Dulbecco’s Modified Eagle Medium (Mediatech, Manassas, VA). The media was filtered with a 0.02 μm inorganic membrane filter (Whatman) and was measured for refractive index of 1.335 (Reichert Abbe Mark II Plus) prior to AgNP addition. Measurements were performed in triplicate. AgNP characterization results are provided in Figure S.I.1.
Cytotoxicity and Transcriptomics Assays
Human hepatocellular carcinoma cells (HepG2) were cultured as described in Supplementary Methods. For the cytotoxicity and transcriptomics assays, cells were seeded in 96-well flat bottom plates (15 000 cells per well) and allowed to proliferate for 48 hours. Cells were then washed with culture media (50 μL) and treated with either culture media alone or with AgNPs coated with either bPEI, PEG, or CIT in triplicate (200 μL total volume/well) and incubated at 37 °C in a 5% CO2 humidified environment. For the cytotoxicity assays, cells were incubated in culture media containing 2.0 or 20 μg mL−1 AgNPs for 24 or 72 hours. At collection, AgNPs were removed with a media wash, and formazan-based WST cell proliferation assay (Donjindo Molecular Technologies, Rockville, MD) was performed per the manufacturer’s instructions (additional details in Supplemental Methods). Notably, conditions studied here are over an order of magnitude below AgNP concentrations known to cause interference in WST assays.[41,42] Sample preparation for the whole genome transcriptome assessment was carried out in an RNase free environment. Cells were incubated in culture media containing 1.2 μg mL−1 AgNPs for 6, 12, or 24 hours. At collection, AgNPs were removed with a media wash, and BioSpyder’s TempO-Seq (BioSpyder, Carlsbad, CA, USA) assay was carried out without modification following the protocol from the user manual provided with the kits, as described in detail previously[21,22] (additional details in Supplemental Methods).
Gene Count Preparation
BioSpyder (BioSpyder, Carlsbad, CA, USA) generated reads and provided raw read counts for 21 111 probes and 19 287 unique genes that passed their QC for their whole genome TempO- Seq TM (Templated Oligo assay with Sequencing readout) platform. Biospyder’s targeted sequencing technology (adapted initially from RASL-seq[43]) has some advantages over RNA- seq and some of the analysis pipeline has been described in detail previously.[44,45] Probe counts were summed to unique genes, and genes without at least 1 count in 4 or more samples were removed. Of the remaining 13 133 genes, samples with less than 100 counts/gene average read depth were removed (Figure S3).
Bioinformatic Analyses
Unless otherwise notated, all analyses were conducted using R statistical language.[46] DESeq2[47] was used to normalize count data and calculate shrunken log2-(fold change) estimates, adjusted p-values and normalized counts for each contrast of interest. Pathway analyses were conducted using the XGR[48] package in R which pulls ontology sets from the Broad Institute. XGR pulled from MSigDB Version 7 at the time of analyses which uses Reactome Version 69 and GO:BP ontology sets downloaded from the Gene Ontology (GO) project on February 21, 2019. The R packages ggplot2,[49] pheatmap,[50] and VennDiagram[51] were used for visualization. The full normalized count matrix and results can be interrogated at https://www.niehs.nih.gov/research/resources/software/biostatistics/agnp/index.cfm [52]
Differential Gene Expression and Pathway Analyses
For single comparisons of one treatment to another (or one time point to another), contrast statements were used in the DESeq2 package controlling for a false discovery rate of 10%. For any treatment difference after removing effect of time, the design matrix was designated by fitting a full model of ‘counts ~ Treatment + Time’ and conducting a likelihood ratio test of reduced model of ‘counts ~ Time’. Pathway analysis with XGR was conducted using DEGs at FDR of 10% and the background set to the 13 133 genes in the experiment. FDR rate in pathway analysis represents FDR for pathway enrichment. Activation/inactivation of pathways was examining using IPA (Ingenuity Systems Inc., Redwood City, CA). Log2(fold change) values and adjusted p-values were uploaded for the 24 hour AgNP comparisons to NoNP controls, as well as NoNP time comparisons with user supplied data set as background (FDR = 10%).
Replication of HepG2 Transcriptomics
Replication of the time-dependent effect of HepG2 cells in culture was done using data downloaded from NCBI gene expression omnibus (GEO) accession number GSE53216. Details for this experiment are previously described.[25] Data were downloaded for HepG2 control cells in their experiment for Affymetrix-array expression analysis at 12 (n = 3) and 24 (n =3) hours post media change but without treatment. Briefly, to assess transcriptomic and pathway changes due to time in culture since last media change, downloaded log-2 probe counts were exponentiated, rounded to the nearest integer, summed to unique gene, and run through the same differential gene expression and pathway analyses using DESeq2 and XGR.
Supplementary Material
Acknowledgements
Research reported in this publication was supported by the National Institute of Environmental Health Sciences of the National Institutes of Health awards R15ES025929, R01ES029911, and P42ES027704. E.B. was supported as a Clare Boothe Luce Scholar and Khueler Scholar; K.F. was supported as a Jean Dreyfus Research Scholar. K.E.W. and P.A. are also incredibly grateful to Christy L. Trejo, Peter J. Shepard, and Joel D. McComb at BioSpyder (USA) for initiating discussions on this work, providing guidance in the TempO-Seq assay, and connecting us to J.S.H, F.A.W., and A.A.M-R.
Footnotes
Conflicts of interest
There are no conflicts to declare.
References
- [1].Burdusel A-C, Gherasim O, Grumezescu AM, Mogoantă L, Ficai A, Andronescu E, Nanomaterials 2018, 8, 681. [DOI] [PMC free article] [PubMed] [Google Scholar]
- [2].Akter M, Sikder MT, Rahman MM, Ullah AKMA, Hossain KFB, Banik S, Hosokawa T, Saito T, Kurasaki M, J. Adv. Res 2018, 9, 2030. [DOI] [PMC free article] [PubMed] [Google Scholar]
- [3].Cameron SJ, Hosseinian F, Willmore WG, Int. J. Mol. Sci 2018, 19, 1. [DOI] [PMC free article] [PubMed] [Google Scholar]
- [4].van der Zande M, Vandebriel RJ, Van Doren E, Kramer E, Herrera Rivera Z, Serrano-Rojero CS, Gremmer ER, Mast J, Peters RJB, Hollman PCH, Hendriksen PJM, Marvin HJP, Peijnenburg AACM, Bouwmeester H, ACS Nano 2012, 6, 7427. [DOI] [PubMed] [Google Scholar]
- [5].Cushen M, Kerry J, Morris M, Cruz-Romero M, Cummins E, J. Agric. Food Chem 2014, 62, 1403. [DOI] [PubMed] [Google Scholar]
- [6].Comfort KK, Braydich-Stolle LK, Maurer EI, Hussain SM, ACS Nano 2014, 8, 3260. [DOI] [PubMed] [Google Scholar]
- [7].Choo WH, Park CH, Jung SE, Moon B, Ahn H, Ryu JS, Kim KS, Lee YH, Yu IJ, Oh SM, Toxicol. In Vitro 2016, 37, 41. [DOI] [PubMed] [Google Scholar]
- [8].Gliga AR, Di Bucchianico S, Lindvall J, Fadeel B, Karlsson HL, Sci. Rep 2018, 8, 6668. [DOI] [PMC free article] [PubMed] [Google Scholar]
- [9].Sahu SC, Zheng J, Yourick JJ, Sprando RL, Gao X, J. Appl. Toxicol 2015, 35, 1160. [DOI] [PubMed] [Google Scholar]
- [10].Kim YJ, Rahman MM, Lee SM, Kim JM, Park K, Kang JH, Seo YR, Int. J. Nanomedicine 2019, 14, 393. [DOI] [PMC free article] [PubMed] [Google Scholar]
- [11].Joseph P, Food Chem. Toxicol. Int. J. Publ. Br. Ind. Biol. Res. Assoc 2017, 109, 650. [DOI] [PMC free article] [PubMed] [Google Scholar]
- [12].Cui Y, Paules RS, Pharmacogenomics 2010, 11, 573. [DOI] [PMC free article] [PubMed] [Google Scholar]
- [13].Alexander-Dann B, Lorena Pruteanu L, Oerton E, Sharma N, Berindan-Neagoe I, Módos D, Bender A, Mol. Omics 2018, 14, 218. [DOI] [PMC free article] [PubMed] [Google Scholar]
- [14].Fröhlich E, J. Nanobiotechnology 2017, 15, 84. [DOI] [PMC free article] [PubMed] [Google Scholar]
- [15].Lorscheidt S, Lamprecht A, Expert Opin. Drug Deliv 2016, 13, 1545. [DOI] [PubMed] [Google Scholar]
- [16].Shin TH, Lee DY, Lee H-S, Park HJ, Jin MS, Paik M-J, Manavalan B, Mo J-S, Lee G, BMB Rep 2018, 51, 14. [DOI] [PMC free article] [PubMed] [Google Scholar]
- [17].Gurunathan S, Qasim M, Park C, Yoo H, Choi DY, Song H, Park C, Kim J-H, Hong K, Int. J. Mol. Sci 2018, 19, 3618. [DOI] [PMC free article] [PubMed] [Google Scholar]
- [18].Balog S, Rodriguez-Lorenzo L, Monnier CA, Obiols-Rabasa M, Rothen-Rutishauser B, Schurtenberger P, Petri-Fink A, Nanoscale 2015, 7, 5991. [DOI] [PubMed] [Google Scholar]
- [19].Lynch I, Cedervall T, Lundqvist M, Cabaleiro-Lago C, Linse S, Dawson KA, Adv. Colloid Interface Sci 2007, 134–135, 167. [DOI] [PubMed] [Google Scholar]
- [20].Foroozandeh P, Aziz AA, Nanoscale Res. Lett 2018, 13 339. [DOI] [PMC free article] [PubMed] [Google Scholar]
- [21].Panzarini E, Mariano S, Carata E, Mura F, Rossi M, Dini L, Int. J. Mol. Sci 2018,19, 1305. [DOI] [PMC free article] [PubMed] [Google Scholar]
- [22].Nel AE, Madler L, Velegol D, Xia T, Hoek EMV, Somasundaran P, Klaessig F, Castranova V, Thompson M, Nat. Mater 2009, 8, 543. [DOI] [PubMed] [Google Scholar]
- [23].Sharma VK, Siskova KM, Zboril R, Gardea-Torresdey JL, Adv. Colloid Interface Sci 2014, 204, 15. [DOI] [PubMed] [Google Scholar]
- [24].Grzincic EM, Yang JA, Drnevich J, Falagan-Lotsch P, Murphy CJ, Nanoscale 2015, 7, 1349. [DOI] [PMC free article] [PubMed] [Google Scholar]
- [25].Jiang J, Briede JJ, Jennen DGJ, Van Summeren A, Saritas-Brauers K, Schaart G, Kleinjans JCS, de Kok TMCM, Toxicol. Lett 2015, 234, 139. [DOI] [PubMed] [Google Scholar]
- [26].Brkić Ahmed L, Milić M, Pongrac IM, Marjanović AM, Mlinarić H, Pavičić I, Gajović S, Vinković Vrček I, Food Chem. Toxicol 2017, 107, 349. [DOI] [PubMed] [Google Scholar]
- [27].Silva RM, Anderson DS, Franzi LM, Peake JL, Edwards PC, Van Winkle LS, Pinkerton KE, Toxicol. Sci 2015, 144, 151. [DOI] [PMC free article] [PubMed] [Google Scholar]
- [28].Barbalinardo M, Caicci F, Cavallini M, Gentili D, Small 2018, 14, 1801219. [DOI] [PubMed] [Google Scholar]
- [29].Pavičić I, Milić M, Pongrac IM, Brkić Ahmed L, Matijević Glavan T, Ilić K, Zapletal E, Ćurlin M, Mitrečić D, Vinković Vrček I, Food Chem. Toxicol 2019, 110935. [DOI] [PubMed] [Google Scholar]
- [30].Makama S, Kloet SK, Piella J, van den Berg H, de Ruijter NCA, Puntes VF, Rietjens IMCM, van den Brink NW, Toxicol. Sci. Off. J. Soc. Toxicol 2018, 162, 79. [DOI] [PubMed] [Google Scholar]
- [31].Wang X, Ji Z, Chang CH, Zhang H, Wang M, Liao Y-P, Lin S, Meng H, Li R, Sun B, Van Winkle L, Pinkerton KE, Zink JI, Xia T, Nel AE, Small 2014, 10, 385. [DOI] [PMC free article] [PubMed] [Google Scholar]
- [32].Park EJ, Bae E, Yi J, Kim Y, Choi K, Lee SH, Yoon J, Lee BC, Park K, Environ. Toxicol. Pharmacol 2010, 30, 162. [DOI] [PubMed] [Google Scholar]
- [33].Babele PK, Singh AK, Srivastava A, Front. Pharmacol 2019, 10, 1016. [DOI] [PMC free article] [PubMed] [Google Scholar]
- [34].Laloy J, Minet V, Alpan L, Mullier F, Beken S, Toussaint O, Lucas S, Dogné JM, Nanobiomedicine 2014, 1, 4. [DOI] [PMC free article] [PubMed] [Google Scholar]
- [35].Jun EA, Lim KM, Kim K, Bae ON, Noh JY, Chung KH, Chung JH, Nanotoxicology 2011, 5, 157. [DOI] [PubMed] [Google Scholar]
- [36].Shrivastava S, Bera T, Singh SK, Singh G, Ramachandrarao P, Dash D, ACS Nano 2009, 3, 1357. [DOI] [PubMed] [Google Scholar]
- [37].Deb S, Raja SO, Dasgupta AK, Sarkar R, Chattopadhyay AP, Chaudhuri U, Guha P, Sardar P, Blood Cells. Mol. Dis 2012, 48, 36. [DOI] [PubMed] [Google Scholar]
- [38].Foldbjerg R, Irving ES, Hayashi Y, Sutherland DS, Thorsen K, Autrup H, Beer C, Toxicol. Sci 2012, 130, 145. [DOI] [PubMed] [Google Scholar]
- [39].Emma MR, Iovanna JL, Bachvarov D, Puleio R, Loria GR, Augello G, Candido S, Libra M, Gulino A, Cancila V, McCubrey JA, Montalto G, Cervello M, Cell Death Dis 2016, 7, e2269. [DOI] [PMC free article] [PubMed] [Google Scholar]
- [40].Edgar R, Nucleic Acids Res 2002, 30, 207. [DOI] [PMC free article] [PubMed] [Google Scholar]
- [41].Sthijns MMJPE, Thongkam W, Albrecht C, Hellack B, Bast A, Haenen GRMM, Schins RPF, Toxicol. In Vitro 2017, 40, 223. [DOI] [PubMed] [Google Scholar]
- [42].Park MVDZ, Neigh AM, Vermeulen JP, de la Fonteyne LJJ, Verharen HW, Briedé JJ, van Loveren H, de Jong WH, Biomaterials 2011, 32, 9810. [DOI] [PubMed] [Google Scholar]
- [43].Li H, Qiu J, Fu XD, Curr. Protoc. Mol. Biol 2012, 98, 4.13.1. [DOI] [PMC free article] [PubMed] [Google Scholar]
- [44].Yeakley JM, Shepard PJ, Goyena DE, VanSteenhouse HC, McComb JD, Seligmann BE, PLOS ONE 2017, 12, e0178302. [DOI] [PMC free article] [PubMed] [Google Scholar]
- [45].Trejo CL, Babić M, Imler E, Gonzalez M, Bibikov SI, Shepard PJ, VanSteenhouse HC, Yeakley JM, Seligmann BE, PLOS ONE 2019, 14, e0212031. [DOI] [PMC free article] [PubMed] [Google Scholar]
- [46].R Core Team R: A Language and Environment for Statistical Computing, R Foundation For Statistical Computing, Vienna, Austria, 2019. [Google Scholar]
- [47].Love MI, Huber W, Anders S, Genome Biol 2014, 15, 550. [DOI] [PMC free article] [PubMed] [Google Scholar]
- [48].Fang H, Knezevic B, Burnham KL, Knight JC, Genome Med 2016, 8, 129. [DOI] [PMC free article] [PubMed] [Google Scholar]
- [49].Wickham H, Ggplot2: Elegant Graphics for Data Analysis, Springer-Verlag; New York, 2016. [Google Scholar]
- [50].Kolde R, Pheatmap: Pretty Heatmaps, 2019, https://CRAN.R-project.org/package=pheatmap.
- [51].Chen H, VennDiagram Generate High-Resolution Venn Euler Plots 2018, https://CRAN.Rproject.org/package=VennDiagram.
- [52].Chang W, Cheng J, Allaire J, Xie Y, McPherson J, Shiny Web Appl. Framework for R 2019, https://CRAN.R-project.org/package=shiny.
Associated Data
This section collects any data citations, data availability statements, or supplementary materials included in this article.