

Abstract
Nineteen vobasinyl-ibogan-type bisindole alkaloids, including nine new compounds, taburnaemines A–I (1–9), were isolated from the twigs and leaves of Tabernaemontana corymbosa. The structures and absolute configurations of the new alkaloids were determined by a combination of MS, NMR, and ECD analyses. Alkaloids 1–5 contain a rare 1,3-oxazinane moiety in the vobasinyl unit, while 6 has an uncommon 1,3-oxazolidine moiety in the iboga unit. The absolute configurations of alkaloid 1 and the known alkaloid tabernaecorymbosine A (10) were confirmed by single-crystal X-ray diffraction analysis. All of the bisindole alkaloids, except 2 and 16′-decarbomethoxytabernaecorymbosine A (14), showed antiproliferative activity (IC50 2.6–9.8 μM) against several human cancer cell lines, including A-549, MDA-MB-231, MCF-7, KB, and P-glycoprotein-overexpressing multidrug-resistant KB cells. The preliminary structure–activity relationship correlations are also discussed.
Graphical Abstract

Monoterpene indole alkaloids are a major group of plant alkaloids, found mainly in the families Apocynaceae, Loganiaceae, and Rubiaceae.1 More than 3000 compounds of this type, including the anticancer drug vincristine and its derivatives, have been isolated and characterized.2 These natural products are notable due to their structural complexity and diverse pharmacological activities.3 Plants of the genus Tabernaemontana are rich in monoterpene indole alkaloids, especially dimeric representatives. Tabercorymine A,4 alasmontamine A,5 and ervatensine B6 are recently reported examples with interesting structural frameworks and significant potential anticancer activity. During an ongoing investigation of these structurally unique and bioactive compounds,4,7 we isolated 19 vobasinyl-ibogan-type bisindole alkaloids, including nine new compounds, taburnaemines A–I (1–9), from the twigs and leaves of Tabernaemontana corymbosa Roxb. (Apocynaceae). Alkaloids 1–6 are vobasinyl-iboga-type bisindole alkaloids characterized by 1,3-oxazinane and 1,3-oxazolidine moieties in the vobasinyl and iboga units, respectively. The 10 known bisindole alkaloids were identified as tabernaecorymbosine A (10),8 tabercorine B (11),7d tabernaricatine C (12),9 tabernaricatine D (13),9 16′-decarbomethoxytabernaecorymbosine A (14),8 tabernaecorymbosine B (15),8 tabernaricatine E (16),9 ervachinine C (17),7b 16′-decarbomethoxydihydrovocamine (18),10 and conodurine (19).11 Herein are discussed the isolation, structure elucidation, and antiproliferative activity against several human cancer cell lines of these isolated monoterpene indole alkaloids.
RESULTS AND DISCUSSION
Taburnaemine A (1) was obtained as colorless orthorhombic crystals (acetone) with −15.0 (c 0.25, MeOH). Its molecular formula, C47H56N4O8, with 22 degrees of unsaturation was established by HRESIMS (m/z 803.4022 [M − H]−, calcd 803.4022) and 13C NMR spectroscopic data (Table 2). Its UV spectrum showed the characteristic absorptions of an indole chromophore at 222 and 285 nm.12 The IR absorptions at 3446 and 1717 cm−1 implied the presence of amino or hydroxy group and ester carbonyl functions, respectively. The 13C NMR and DEPT spectroscopic data of 1 showed 47 carbon signals including seven methyls, nine methylenes, 15 methines, and 16 quaternary carbons, which indicated that 1 is a vobasinyl-ibogan-type bisindole alkaloid. Direct comparison of its NMR data with those of tabernaricatine A9 suggested 1 to be a 2-oxopropyl derivative of tabernaricatine A. From the HMBC correlations of H-21′ (δH 3.33, s) and H-22′b (δH 2.34, dd, J = 16.5, 8.5 Hz) to C-3′ (δC 54.8) the additional 2-oxopropyl group [C-23′ (δC 208.8), C-22′ (δC 46.7), and C-24′ (δC 31.0)] could be located at C-3′. Thus, the planar structure of 1 (taburnaemine A) was assigned and further verified by a combination analysis of the HSQC, 1H–1H COSY, and HMBC spectra (Figure 2).
Table 2.
13C NMR Data (δ) for Compounds 1–5
| position | 1a | 2b | 3c | 4d | 5c |
|---|---|---|---|---|---|
| 2 | 137.2 | 137.2 | 138.7 | 137.4 | 137.8 |
| 3 | 35.3 | 34.5 | 36.6 | 36.6 | 36.0 |
| 5 | 61.8 | 62.7 | 62.8 | 62.2 | 61.7 |
| 6 | 30.1 | 30.4 | 31.0 | 29.5 | 26.4 |
| 7 | 108.7 | 108.7 | 109.4 | 109.1 | 109.7 |
| 8 | 128.9 | 129.0 | 129.8 | 129.4 | 130.3 |
| 9 | 118.2 | 118.1 | 118.8 | 117.7 | 118.9 |
| 10 | 119.7 | 119.5 | 119.8 | 119.2 | 119.6 |
| 11 | 122.4 | 122.3 | 122.6 | 121.8 | 122.5 |
| 12 | 110.2 | 110.0 | 111.1 | 110.1 | 110.8 |
| 13 | 135.0 | 135.9 | 137.3 | 135.7 | 137.9 |
| 14 | 32.3 | 31.8 | 33.6 | 33.6 | 36.5 |
| 15 | 42.1 | 36.3 | 43.4 | 41.9 | 40.3 |
| 16 | 50.0 | 48.8 | 50.8 | 49.9 | 47.6 |
| 17 | 72.6 | 73.7 | 73.0 | 72.7 | 77.0 |
| 18 | 17.1 | 13.6 | 17.5 | 17.2 | 11.6 |
| 19 | 59.4 | 57.5 | 59.1 | 59.3 | 113.6 |
| 20 | 64.8 | 63.8 | 65.2 | 64.7 | 142.7 |
| 21 | 89.7 | 89.8 | 90.2 | 89.6 | 50.3 |
| 22 | 88.8 | ||||
| N-Me | 40.7 | 41.2 | 40.7 | 40.8 | |
| CO2Me | 171.7 | 171.5 | 172.1 | 171.3 | 174.0 |
| 50.5 | 50.9 | 53.1 | 50.4 | 50.5 | |
| 2’ | 136.1 | 136.2 | 134.1 | 190.5 | 136.8 |
| 3’ | 54.8 | 54.5 | 175.2 | 48.7 | 62.2 |
| 5’ | 51.3 | 51.3 | 42.6 | 49.0 | 52.7 |
| 6’ | 22.0 | 22.0 | 21.1 | 33.9 | 22.3 |
| 7’ | 108.9 | 108.9 | 108.6 | 88.2 | 109.7 |
| 8’ | 124.3 | 124.5 | 124.4 | 134.5 | 125.4 |
| 9’ | 117.0 | 117.2 | 117.4 | 120.5 | 117.5 |
| 10’ | 104.5 | 104.7 | 105.9 | 132.2 | 106.3 |
| 11’ | 152.1 | 152.0 | 153.1 | 156.6 | 152.9 |
| 12’ | 114.2 | 114.3 | 115.6 | 104.0 | 116.2 |
| 13’ | 135.9 | 135.1 | 135.9 | 150.8 | 136.1 |
| 14’ | 30.6 | 30.5 | 38.8 | 27.0 | 28.8 |
| 15’ | 26.7 | 26.8 | 31.7 | 31.9 | 27.2 |
| 16’ | 54.2 | 54.3 | 55.7 | 49.9 | 55.1 |
| 17’ | 35.6 | 35.9 | 34.4 | 35.1 | 37.0 |
| 18’ | 11.6 | 11.6 | 11.5 | 11.5 | 11.8 |
| 19’ | 26.7 | 26.7 | 28.2 | 26.5 | 27.5 |
| 20’ | 38.2 | 38.2 | 35.8 | 37.5 | 38.8 |
| 21’ | 58.5 | 58.8 | 56.2 | 58.0 | 58.2 |
| 22’ | 46.7 | 46.7 | 62.0 | ||
| 23’ | 208.8 | 208.8 | |||
| 24’ | 31.0 | 31.0 | |||
| CO2Me’ | 174.5 | 174.7 | 172.1 | 173.4 | 174.9 |
| 52.3 | 52.5 | 50.6 | 53.2 | 52.7 | |
| OMe-11’ | 56.4 | 56.7 | 56.9 | 55.8 | 57.5 |
125 MHz, CDCl3.
200 MHz, CDCl3.
200 MHz, acetone-d6.
150 MHz, CDCl3.
Figure 2.
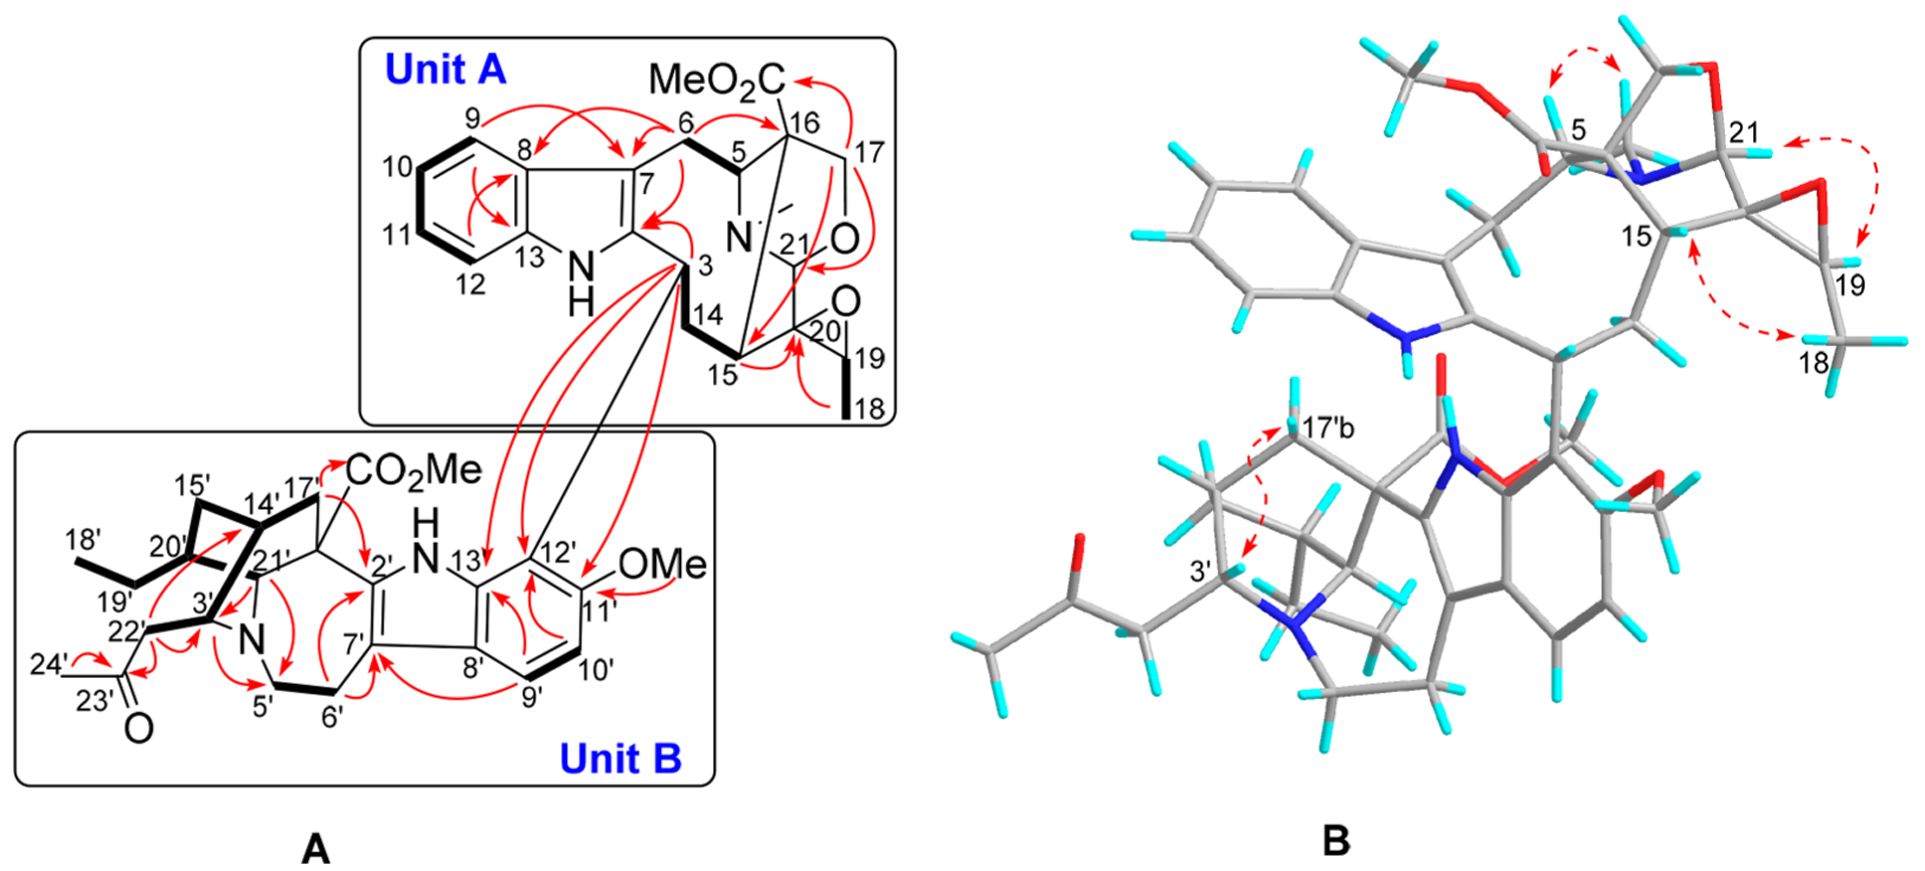
1H–1H COSY (A: bold lines), selected HMBC (A: →), and ROESY (B: ↔) correlations of 1.
The ROESY spectrum showed that 1 has the same relative configuration as tabernaricatine A, and the β-orientation of H-3′ was established by the ROESY correlation of H-3′ (δH 2.96) with H-17′b (δH 0.64, br d, J = 14.0 Hz). The absolute configuration of (3R,5S,15R,16S,19S,20R,21S,3′R,14′R,16′R,20′S,21′S)-1 was finally established by X-ray diffraction analysis with a Flack parameter of 0.05(4) (Figure 3).13
Figure 3.

Single-crystal X-ray structure of 1 drawn with 30% probability displacement ellipsoids (oxygen atoms are red, nitrogen atoms are blue, hydrogen atoms are cyan).
Taburnaemine B (2) and 1 gave the same molecular formula, as established by HRESIMS (m/z 805.4171 [M + H]+; calcd for C47H56N4O8, 805.4164) and 13C NMR spectroscopic data (Table 2). Comparison of the 1H and 13C NMR data (Tables 1 and 2) of 2 and 1 suggested that both compounds are similar and have the same basic skeleton. The upfield shifts of C-15 (δC 36.3, ΔδC −5.8) and C-18 (13.6, ΔδC −3.5) observed in 2 suggested a γ-steric compression effect,7d with the two compounds being epimeric at the C-19 and C-20 positions involving the oxirane ring. In 2, an α-orientation was assigned to the oxirane ring, and the complete structure of taburnaemine B (2) was assigned as shown in Figure 1.
Table 1.
1H NMR Data (δ) for Compounds 1–5
| position | 1a | 2b | 3c | 4d | 5c |
|---|---|---|---|---|---|
| 3 | 4.96 br d (12.0) | 5.07 br d (12.0) | 4.91 br d (12.0) | 4.76 br d (11.4) | 5.33 br d (13.6, 3.2) |
| 5 | 3.53 dd (9.5, 6.0) | 3.61 t (8.0) | 3.50 dd (9.6, 6.4) | 3.49 dd (10.2, 6.6) | 4.14 t (9.6) |
| 6a | 4.02 dd (15.5, 9.5) | 4.00 dd (15.2, 8.0) | 4.17 dd (15.2, 9.6) | 3.85 dd (15.0, 8.4) | 3.75 dd (15.2, 11.2) |
| 6b | 3.20 dd (15.5, 6.0) | 3.37 dd (15.2, 8.0) | 3.25 dd (15.2, 6.4) | 3.25 dd (15.0, 6.6) | 3.58 dd (15.2, 7.2) |
| 9 | 7.70 d (7.5) | 7.69 d (8.0) | 7.77 d (7.2) | 7.53 dd (7.2, 1.2) | 7.77 d (8.0) |
| 10 | 7.14 dt (7.5, 2.0) | 7.13 td (8.0, 1.6) | 7.11 td (7.2, 1.6) | 7.07 dd (7.2, 1.2) | 7.10 t (8.0) |
| 11 | 7.08 td (7.5, 2.0) | 7.08 td (8.0, 1.6) | 7.09 td (7.2, 1.6) | 7.08 dd (7.2, 1.2) | 7.06 t (8.0) |
| 12 | 7.07 td (7.5, 2.0) | 7.06 t (8.0) | 7.15 dd (7.2, 1.6) | 7.10 dd (7.2, 1.2) | 7.13 d (8.0) |
| 14a | 3.08e | 2.96 m | 3.04 m | 3.08 br d (15.0) | 2.61 (dt, 16.0, 12.8) |
| 14b | 2.27 dt (15.0, 3.0) | 1.89 m | 2.34 m | 2.21 br d (15.0) | 1.94 ddd (16.0, 7.2, 3.2) |
| 15 | 2.98e | 2.97 t (7.2) | 2.82 dd (15.2, 11.2) | 2.89 | 3.81 dd (10.4, 7.2) |
| 17a | 3.89 d (8.5) | 3.82 (d, 8.8) | 3.74 d (8.8) | 3.85 d (8.4) | 3.59 br d (14.4) |
| 17b | 3.78 d (8.5) | 3.68 d (8.8) | 3.70 d (8.8) | 3.76 d (8.4) | 3.59 br d (14.4) |
| 18 | 1.43 d (5.5) | 1.34 d (4.8) | 1.40 d (5.6) | 1.45 d (5.4) | 1.62 d (7.2) |
| 19 | 3.05 q (5.5) | 3.04 q (4.8) | 3.03 q (5.6) | 3.09 q (5.4) | 5.10 q (7.2) |
| 21a | 3.57 s | 3.50 s | 3.63 s | 3.61 s | 4.26 br d (16.0) |
| 21b | 3.21 br d (16.0) | ||||
| 22a | 4.66 d (9.6) | ||||
| 22b | 4.57 d (9.6) | ||||
| NH | 9.88 s | 9.72 s | |||
| N-Me | 2.67 s | 2.73 s | 2.66 s | 2.70 s | |
| CO2Me | 2.34 s | 2.39 br s | 2.34 s | 2.27 s | 2.47 s |
| 3’a | 2.96e | 3.02e | 2.72e | 2.48 m | |
| 3’b | 2.72e | ||||
| 5’a | 3.13 ddd (14.5, 9.0, 6.5) | 3.12 m | 4.21 dd (12.0, 4.0) | 3.39 t (13.8) | 3.15 ddd (16.8, 13.6, 7.2) |
| 5’b | 3.07e | 3.12 m | 3.05 m | 2.89 | 3.15 ddd (16.8, 13.6, 7.2) |
| 6’a | 2.98e | 3.00 ddd (16.0, 9.6, 5.2) | 3.03e | 1.87 br d (12.0) | 2.95 dt (16.8, 6.4) |
| 6’b | 2.83 dt (16.5, 5.5) | 2.82 dt (16.0, 5.2) | 3.03e | 1.82 br d (12.0) | 2.83e |
| 9’ | 7.23 d (9.0) | 7.22 d (8.8) | 7.31 d (8.8) | 6.85 s | 7.23 d (8.0) |
| 10’ | 6.80 d (9.0) | 6.79 d (8.8) | 6.88 d (8.8) | 6.86 d (8.0) | |
| 11’ | |||||
| 12’ | 7.11 s | ||||
| 14’ | 1.23 m | 1.26 m | 1.85 m | 1.89 m | 1.53 br s |
| 15’a | 1.43 m | 1.30 m | 1.73 ddd (12.8, 9.6, 3.2) | 1.75 m | 1.46 m |
| 15’b | 1.02 m | 1.04 m | 1.06 ddt (12.8, 6.4, 2.4) | 1.07 m | 1.30 m |
| 17’a | 1.67 br d (14.0) | 1.79 br d (13.6) | 0.54 br d (13.6) | 2.73 br d (13.2) | 1.85 br d (13.6) |
| 17’b | 0.64 br d (14.0) | 0.74 br d (13.6) | 1.55 br d (13.6) | 2.39 br d (13.2) | 0.64 br d (13.6) |
| 18’ | 0.78 t (7.0) | 0.79 t (7.2) | 0.90 t (8.0) | 0.83 t (7.2) | 0.82 t (7.2) |
| 19’a | 1.30 m | 1.45 m | 1.43 m | 1.41 m | 1.27 m |
| 19’b | 1.01 m | 1.30 m | 1.26 m | 1.41 m | 1.12 m |
| 20’ | 1.03 m | 1.05 m | 1.60 m | 1.35 m | 1.11 m |
| 21’ | 3.33 br s | 3.33 br s | 4.33 br s | 3.73 s | 3.42 s |
| 22’a | 2.53 dd (16.5, 5.5) | 2.56 dd (16.0, 4.0) | 3.46 br d (10.4) | ||
| 22’b | 2.34 dd (16.5, 8.5) | 2.36 dd (16.0, 8.8) | 3.25 br d (10.4) | ||
| 24’ | 2.03 s | 2.03 s | |||
| CO2Me’ | 3.67 s | 3.71 s | 3.77 s | 3.64 s | 3.70 s |
| OMe-11’ | 3.92 s | 3.93 s | 3.96 s | 3.94 s | 3.96 s |
500 MHz, CDCl3.
800 MHz, CDCl3.
800 MHz, acetone-d6.
600 MHz, CDCl3.
Overlapped, without designating multiplicity.
Figure 1.

Chemical structures of 1–10.
Taburnaemine C (3) was obtained as a white, amorphous powder with −33.3 (c 0.11, MeOH). HRESIMS data (m/z 761.3556 [M − H]−, calcd 761.3558) established its molecular formula as C44H50N4O8. The 13C NMR and DEPT spectroscopic data (Table 2) of 3 showed 44 carbon signals, including six methyls, eight methylenes, 14 methines, and 16 quaternary carbons. Detailed analysis of its NMR data indicated that 3 is analogous structurally to tabernaricatine A,9 except for the presence of an ester/amide carbonyl (δC 175.2) in the iboga unit of 3. The key HMBC correlations of protons H-5′a (δH 4.21, dd, J = 12.0, 4.0 Hz) and H-21′ (δH 4.33, br s) with the oxo carbon (δC 175.2) led to the assignment of the carbonyl group at C-3′. Detailed analysis of the 2D NMR spectra (HSQC, 1H–1H COSY, HMBC, and ROESY) confirmed the remaining molecular units to be the same as those of tabernaricatine A. The structure of alkaloid 3 was thereby characterized as shown in Figure 1.
Taburnaemine D (4) was obtained as a white, amorphous powder, and its HRESIMS signal at m/z 765.3785 ([M + H]+; calcd 765.3850) established the molecular formula C44H52N4O8 with 21 degrees of unsaturation. Detailed analysis of the NMR data (Tables 1 and 2) indicated that 4 is also a vobasinyl-ibogan bisindole alkaloid, similar to tabernaricatine A.9 The major difference was the presence of an iboga indolenine moiety (unit B) rather than the common iboga indole unit in 4, which was supported by the key carbon resonances for C-7′ (δC 88.2) and C-2′ (δC 190.5). Moreover, the presence of two singlets at δH 6.85 and 7.11 in the aromatic ring of the iboga unit indicated that the monomeric units in 4 are linked between C-3 and C-10′. This assignment was supported by the key HMBC correlations of H-3 (δH 4.76, br d, J = 11.4 Hz) to C-9′ (δC 120.5) and C-10′ (δC 132.2) and of H-9′ (δH 6.85) and H-12′ (δH 7.11) to C-11′ (δC 156.6). Furthermore, analysis of the 2D NMR spectra (HSQC, 1H–1H COSY, HMBC, and ROESY) verified the above structural conclusions. The relative configuration of 4 was identical to that of tabernaricatine A, and the α-orientation of OH-7′ was established by the ROESY correlation of H-21′ (δH 3.80, s) with OH-7′ (δH 5.49, br s) (Figure S35, Supporting Information).
Taburnaemine E (5) was obtained as a white, amorphous powder and gave a molecular formula of C45H54N4O7, as established by HRESIMS (m/z 763.3993 [M + H]+, calcd 763.4065). Its UV absorption maxima at 237, 261, and 284 nm were assigned as characteristic indole chromophores,12 while the IR spectrum indicated the presence of amino or hydroxy (3430 cm−1) and ester carbonyl (1725 cm−1) functional groups. The 13C NMR and DEPT spectra show 45 carbon signals, classified as five methyls, 11 methylenes, 14 methines, and 15 quaternary carbons. Detailed analysis of the NMR data (Tables 1 and 2) indicated that the structures of tabernaricatine B9 and 5 are closely comparable with the exception of an added hydroxymethyl group (δH 3.46, 3.25, br d, J = 10.4 Hz; δC 62.0) and a nitrogenated methine (δH 2.48, m; δC 62.2) in 5. These two groups were assigned as C-22′ and C-3′, respectively, based on the key 1H–1H COSY correlations of H-3′ (δH 2.48) with H-22′ (δH 3.46, 3.25), as well as the HMBC correlations of H-21′ (δH 3.42, s) to C-3′ (δC 62.2) and of H-3′ to C-5′ (δC 52.7). The remaining structural units were identical with those of tabernaricatine B and were verified from the 2D NMR spectra (HSQC, 1H–1H COSY, and HMBC) (Figure 4). The ROESY correlation of H-3′ with H-17′b (δH 0.64, br d, J = 13.6 Hz) established the α-orientation of the 3′-hydroxymethyl group.
Figure 4.

1H–1H COSY (A: bold lines), selected HMBC (A: →), and ROESY (B: ↔) correlations of 5.
Taburnaemine F (6) was assigned the molecular formula C44H52N4O7 with 21 degrees of unsaturation, as established by HRESIMS ([M + H]+ at m/z 749.3920, calcd 749.3836). Based on the 1D (1H and 13C) and 2D (1H–1H-COSY, HSQC, and HMBC) NMR data, the overall structure of 6 was found to be closely related to that of tabernaecorymbosine A,8 with both vobasinyl and iboga units. However, a striking difference was the presence of two oxygenated methines based on carbon resonances at δC 69.5 (δH 5.02, d, J = 6.0 Hz) and 93.9 (δH 4.75, d, J = 4.2 Hz)]. A 1H–1H COSY correlation between H-6′ (δH 5.02, d, J = 6.0 Hz) and H-5′a (δH 3.36, br d, 12.0 Hz) and a HMBC correlation between H-5′a and C-3′ (δC 93.9) supported the placement of the two oxygenated methines at C-6′ and C-3′, respectively. Although HMBC correlations were not observed between H-3′ (δH 4.75, d, J = 4.2 Hz) and C-6′ or between H-6′ and C-3′, the presence of an oxygen atom linking C-3′ and C-6′ was deduced from the higher molecular weight (14 mass units) and more degrees of unsaturation (one degree) in 6 compared with those of tabernaecorymbosine A. Thus, the structure of 6 was completely elucidated and characterized by a 1,3-oxazolidine moiety incorporating C-3′, N, C-5′, C-6′, and O in the iboga unit (Figure 5A). The ROESY correlation of H-21′ with H-5′ a suggested that CH2-5 is α-oriented and, thus, H-3′ and H-6′ also have α-orientations (Figure 5B).
Figure 5.

1H–1H COSY (A: bold lines), selected HMBC (A: →), and ROESY (B: ↔) correlations of 6.
Taburnaemine G (7) was obtained as a white, amorphous powder, −62.5 (c 0.22, MeOH), and its HRESIMS signal at m/z 765.4222 ([M + H]+, calcd 765.4222) established the molecular formula C45H56N4O7 with 20 degrees of unsaturation. Comparison of the NMR data of 8 with those of tabernaecorymbosine A8 showed that both alkaloids are closely related, but differ in the presence of an additional hydroxymethyl (δH 3.45, dd, J = 11.0, 3.5 Hz; 3.23, dd, J = 11.0, 8.0 Hz; δC 61.9) in 7. The key HMBC correlation from H-21′ (δH 3.41, s) to C-3′ (δC 62.1) as well as the 1H–1H COSY correlation of H-3′ (δH 2.48, dd, J = 8.0, 3.5 Hz) with H-22′ (δH 3.45, 3.23) indicated that the hydroxymethyl is located at C-3′, which was identical with the iboga unit in 5. Therefore, 7 (taburnaemine G) was elucidated as shown based on analysis of 2D NMR (HSQC, 1H–1H COSY, HMBC, and ROESY) data.
Taburnaemine H (8) was obtained as a white, amorphous powder, and its HRESIMS signal at m/z 705.4013 ([M + H]+, calcd 705.4010) established the molecular formula C43H52N4O5. The 13C NMR and DEPT spectra of 8 (Table 4) suggested that 8 possesses 43 carbons, including five methyls, 10 methylenes, 14 methines, and 14 quaternary carbons. Alkaloid 8 could be readily identified as the 11′-demethoxy derivative of ervachinine C by comparison of their NMR data.7b The observation of a 1H–1H COSY correlation between H-11′ (δH 6.86, d, J = 8.0 Hz) and H-12′ (δH 7.15, d, J = 8.0 Hz), in addition to the key HMBC correlations of H-9′ (δH 7.28, s) and H-11′ with C-3 (δC 46.2), verified the above conclusion. Thus, the structure of 8 (taburnaemine H) was fully elucidated.
Table 4.
13C NMR Data (δ) for Compounds 6–9
| position | 6a | 7b | 8c | 9d |
|---|---|---|---|---|
| 2 | 138.0 | 137.7 | 139.7 | 137.3 |
| 3 | 35.8 | 36.1 | 46.2 | 36.2 |
| 5 | 61.2 | 61.2 | 61.2 | 60.2 |
| 6 | 18.5 | 18.4 | 17.9 | 17.3 |
| 7 | 110.1 | 110.2 | 110.0 | 110.2 |
| 8 | 130.6 | 130.7 | 131.2 | 130.0 |
| 9 | 118.8 | 118.8 | 118.2 | 117.7 |
| 10 | 119.3 | 119.3 | 118.8 | 121.9 |
| 11 | 122.4 | 122.2 | 121.6 | 119.0 |
| 12 | 110.7 | 110.6 | 110.6 | 109.9 |
| 13 | 137.7 | 137.7 | 137.6 | 136.1 |
| 14 | 35.5 | 35.1 | 40.1 | 35.6 |
| 15 | 35.9 | 35.8 | 36.0 | 35.7 |
| 16 | 53.6 | 53.6 | 55.9 | 52.1 |
| 17 | 70.2 | 70.2 | 70.3 | 70.6 |
| 18 | 12.2 | 12.2 | 12.2 | 12.2 |
| 19 | 119.3 | 119.3 | 119.2 | 120.2 |
| 20 | 138.6 | 138.5 | 139.0 | 136.7 |
| 21 | 52.4 | 52.5 | 52.5 | 52.0 |
| N-Me | 42.5 | 42.5 | 42.4 | 42.1 |
| CO2Me | 174.6 | 173.5 | 173.5 | 173.9 |
| 53.0 | 49.8 | 49.6 | 50.2 | |
| 2’ | 138.3 | 136.2 | 138.9 | 190.4 |
| 3’ | 93.9 | 62.1 | 53.3 | 48.8 |
| 5’ | 60.9 | 52.8 | 54.3 | 49.0 |
| 6’ | 69.5 | 22.4 | 22.5 | 34.0 |
| 7’ | 117.9 | 109.6 | 110.4 | 88.2 |
| 8’ | 123.4 | 125.4 | 129.6 | 134.5 |
| 9’ | 116.5 | 117.4 | 117.6 | 120.1 |
| 10’ | 107.5 | 106.3 | 135.7 | 132.3 |
| 11’ | 152.9 | 152.8 | 122.3 | 156.9 |
| 12’ | 116.9 | 116.4 | 111.6 | 104.1 |
| 13’ | 134.0 | 136.8 | 138.2 | 150.9 |
| 14’ | 30.8 | 28.7 | 28.3 | 27.0 |
| 15’ | 30.4 | 27.5 | 32.9 | 32.0 |
| 16’ | 54.3 | 55.1 | 53.5 | 58.7 |
| 17’ | 31.6 | 37.0 | 36.8 | 35.1 |
| 18’ | 11.8 | 11.9 | 11.9 | 11.5 |
| 19’ | 27.2 | 27.1 | 27.8 | 26.6 |
| 20’ | 39.0 | 38.8 | 39.4 | 37.5 |
| 21’ | 60.7 | 58.3 | 57.8 | 58.1 |
| 22’ | 61.9 | |||
| CO2Me’ | 173.3 | 174.9 | 175.1 | 173.4 |
| 49.8 | 52.8 | 52.6 | 53.2 | |
| OMe-11’ | 57.6 | 54.7 | 56.0 |
150 MHz, acetone-d6.
125 MHz, acetone-d6.
200 MHz, acetone-d6.
125 MHz, CDCl3.
Taburnaemine I (9) was obtained as a white, amorphous powder, −23.0 (c 0.20, MeOH). The HRESIMS peak at m/z 751.4061 [M + H]+ (calcd 751.4065) established its molecular formula as C44H54N4O7. The IR absorptions at 3445 and 1722 cm−1 suggested the presence of NH/OH and ester carbonyl functions, respectively. Comparison of NMR data of compound 9 with those of ervachinine C indicated that these two bisindole alkaloids share the same carbon skeleton.7b The major difference was the replacement of the common iboga indole unit by an iboga indolenine unit in 9. HMBC correlations of H-5′b (δH 2.89, dd, J = 15.0, 3.0 Hz) and H-6′a (δH 1.90, br d, J = 13.0 Hz) with C-7′ (δC 88.2), as well as H-6′a with C-2′ (δC 190.4), verified the presence of the iboga indolenine unit. The 2D NMR spectra (HSQC, 1H–1H COSY, HMBC, and ROESY) confirmed that the remaining portion of the molecule was identical to tabernaricatine C (Figure 6A). The α-orientation of OH-7′ was established by the ROESY correlation of H-21′ (δH 3.78, s) with OH-7′ (δH 5.50, br s) (Figures 6B and S82, Supporting Information), and the structure of alkaloid 9 was thereby characterized as shown in Figure 1.
Figure 6.

1H–1H COSY (A: bold lines), selected HMBC (A: →), and ROESY (B: ↔) correlations of 9.
The absolute configurations of compounds 2–9 were identical to that of 1, as evidenced by similar curves in the ECD spectra (Figures S86 and S87, Supporting Information). Furthermore, the absolute configuration of (3R,5S,15S,16S,14′R,16′R,20′S,21′S)-10 was established initially on the basis of its similar ECD curve (Figures S86 and S87, Supporting Information), which was confirmed by X-ray diffraction analysis with a Flack parameter of 0.04(3) (Figure 7).13 Establishment of the absolute configurations of 1–10 provided solid evidence for those known vobasinyl-iboga-type alkaloids with unassigned absolute configurations.
Figure 7.

Single-crystal X-ray structure of 10 drawn with 30% probability displacement ellipsoids (oxygen atoms are red, nitrogen atoms are blue, hydrogen atoms are cyan).
All isolates were evaluated for antiproliferative activity against five human cancer cell lines, A-549, MDA-MB-231, KB, KB-VIN, and MCF-7, using the sulforhodamine B (SRB) method with vincristine (VIN) and paclitaxel (PXL) as positive controls.14 All of the compounds, except 2 and 14, exhibited antiproliferative activity (IC50 2.6–8.3 μM) against multidrug-resistant KB subline KB-VIN (Table 5). Based on the activities determined for 1 and 2, the absolute configurations of the 19,20-oxirane ring and 16′-carbomethoxy group appear to be critical factors contributing to the antiproliferative effects of such alkaloids.
Table 5.
Antiproliferative Activities of 1–19 (IC50 in μM) in Vitro
| A-549 | MDA-MB-231 | KB | KB-VIN | MCF-7 | |
|---|---|---|---|---|---|
| 1 | 8.6 ± 0.1 | 7.7 ± 0.1 | 7.4 ± 0.3 | 6.6 ± 0.1 | >10 |
| 2 | >10 | >10 | >10 | >10 | >10 |
| 3 | 5.9 ± 0.0 | 8.2 ± 0.1 | 5.7 ± 0.2 | 5.8 ± 0.2 | 8.3 ± 0.3 |
| 4 | 4.3 ± 0.2 | 4.5 ± 0.2 | 4.7 ± 0.0 | 4.8 ± 0.0 | 4.6 ± 0.1 |
| 5 | 4.7 ± 0.0 | 5.1 ± 0.1 | 4.8 ± 0.4 | 4.9 ± 0.3 | 6.0 ± 0.1 |
| 6 | 5.3 ± 0.0 | 4.8 ± 0.0 | 4.8 ± 0.1 | 4.7 ± 0.1 | 5.6 ± 0.2 |
| 7 | 4.3 ± 0.1 | 4.5 ± 0.2 | 4.5 ± 0.2 | 4.9 ± 0.0 | 4.9 ± 0.0 |
| 8 | 9.8 ± 0.0 | 5.2 ± 0.4 | 6.7 ± 0.4 | 8.3 ± 0.4 | >10 |
| 9 | 3.1 ± 4.4 | 2.8 ± 3.9 | 2.7 ± 3.8 | 2.6 ± 3.6 | 3.0 ± 4.3 |
| 10 | 4.5 ± 0.1 | 4.8 ± 0.1 | 4.2 ± 0.2 | 4.1 ± 0.0 | 5.3 ± 0.1 |
| 11 | 4.9 ± 0.0 | 8.2 ± 0.2 | 4.5 ± 0.1 | 4.7 ± 0.2 | 6.5 ± 0.0 |
| 12 | 4.3 ± 0.2 | 4.5 ± 0.0 | 4.3 ± 0.2 | 4.4 ± 0.3 | 4.8 ± 0.0 |
| 13 | 3.5 ± 0.1 | 4.8 ± 0.1 | 4.3 ± 0.1 | 4.7 ± 0.1 | 4.8 ± 0.1 |
| 14 | >10 | >10 | >10 | >10 | >10 |
| 15 | 4.2 ± 0.1 | 4.3 ± 0.1 | 4.1 ± 0.1 | 4.3 ± 0.1 | 4.9 ± 0.1 |
| 16 | 4.4 ± 0.0 | 3.2 ± 0.1 | 4.6 ± 0.1 | 4.4 ± 0.0 | 4.4 ± 0.1 |
| 17 | 5.6 ± 0.1 | 4.8 ± 0.1 | 5.0 ± 0.1 | 5.1 ± 0.0 | 6.1 ± 0.6 |
| 18 | 4.3 ± 0.0 | 4.5 ± 0.1 | 4.8 ± 0.1 | 4.4 ± 0.1 | 4.7 ± 0.3 |
| 19 | 4.4 ± 0.0 | 5.2 ± 0.0 | 5.0 ± 0.2 | 4.1 ± 0.2 | 5.6 ± 0.0 |
| VIN (nM)a | 23.0 ± 2.4 | 32.0 ± 0.5 | 4.4 ± 0.1 | 2480 ± 28.2 | 7.3 ± 0.2 |
| PXL (nM)b | 4.5 ± 0.9 | 7.0 ± 0.9 | 3.6 ± 1.1 | 2360 ± 59.5 | 8.8 ± 1.0 |
VIN = vinblastine.
PXL = paclitaxel. VIN and PXL were positive controls.
EXPERIMENTAL SECTION
General Experimental Procedures.
Melting points were measured using a Yuhua X-4 digital microdisplay melting point apparatus. Optical rotations were measured with a JASCO P-1020 polarimeter. UV spectra were obtained using a Shimadzu UV-2401A spectrophotometer. ECD spectra were recorded with an Applied Photophysics Chirascan spectrometer. IR spectra were recorded on a Tenor 27 spectrophotometer as KBr pellets. NMR spectra were performed on Bruker AV-500, 600, and 800 instruments with tetramethylsilane as the internal standard. Mass spectra were measured on VG Auto Spec-3000 or API-Qstar-Pulsar instruments. X-ray data were collected using a Bruker APEX DUO instrument. Semipreparative HPLC was performed on a Waters X-Bridge (5 μm; 10 mm × 150 mm) C18 reversed-phase column. Column chromatography (CC) was performed on silica gel (100–200, 200–300, and 300–400 mesh, Qingdao Marine Chemical Inc., Qingdao, People’s Republic of China), Sephadex LH-20 (40–70 μm, Amersham Pharmacia Biotech AB, Uppsala, Sweden), and MCI gel 20P (75–150 μm, Mitsubishi Chemical Corporation, Tokyo, Japan). The visualizing reagent was bismuth potassium iodide.
Plant Material.
The twigs and leaves of T. corymbosa were collected in December 2014 from Menglun County of Yunnan Province, People’s Republic of China, and were identified by Mr. Shun-Cheng Zhang, Xishuangbanna Tropical Plant Garden. A voucher specimen (no. 20141228) has been deposited at the State Key Laboratory of Phytochemistry and Plant Resources in West China, Kunming Institute of Botany, Chinese Academy of Science (CAS).
Extraction and Isolation.
The dried twigs and leaves of T. corymbosa (20 kg) were extracted with CH3OH, and the pH of the crude extract was adjusted to 2–3 with saturated HCl. The acidic mixture was then extracted three times with petroleum ether and ethyl acetate, respectively. The aqueous phase was basified to pH 9–10 with saturated sodium hydroxide and then extracted with CH2Cl2 to obtain the crude alkaloids present. The crude alkaloids (108 g) were subjected to silica gel CC (100–200 mesh; petroleum ether/acetone, 1:0 → 0:1), yielding five major fractions (A–E). Fraction A (17.9 g) was subjected to a series of silica gel CC eluting with petroleum ether/acetone (20:1–10:1, v/v) and then purified by Sephadex LH-20 (acetone) to give compounds 10 (65 mg), 17 (86 mg), and 19 (45 mg). Fraction B (32 g) was further purified by reversed-phase chromatography on a C18 column (MeOH/H2O, 30:70 → 100:0, v/v) to give three subfractions (BI–III). Subfraction BI (2.3 g) was chromatographed by silica gel CC (petroleum ether/acetone/Et2NH, 15:1:0.1, v/v) to afford 9 (190 mg), 11 (12 mg), and 13 (9 mg). Subfraction BII (3.2 g) was further separated using a Sephadex LH-20 column (MeOH), followed by semipreparative HPLC using a Waters X-Bridge C18 (10 × 150 mm, 5 μm) column with CH3CN/H2O (73:27, 0.1% v/v diethylamine), to give 1 (4.0 mg, tR = 45.6 min), 2 (1.8 mg, tR = 46.9 min), 4 (6 mg, tR = 31.5 min), 5 (9.8 mg, tR = 28.8 min), and 16 (22 mg, tR = 43.2 min). Fraction C (26 g) was subjected to silica gel CC eluting with petroleum ether/acetone (10:1–0:1, v/v) to give three subfractions (CI–III). Subfraction CI (2.6 g) was separated using a Sephadex LH-20 column (acetone) to give 6 (1.6 mg). Subfraction CII was separated by semipreparative HPLC using a Waters X-Bridge C18 (10 × 150 mm, 5 μm) column with CH3CN/H2O (57:43, 0.1% v/v diethylamine) to afford 3 (6 mg, tR = 48.6 min), 7 (1.5 mg, tR = 36.1 min), and 8 (3.0 mg, tR = 42.0 min). Subfraction CIII (900 mg) was separated using a Sephadex LH-20 column (acetone) followed by semipreparative HPLC using a Waters X-Bridge C18 (10 × 150 mm, 5 μm) column with CH3CN/H2O (63:37, 0.1% v/v diethylamine) to afford 12 (4.6 mg, tR = 53.2 min) and 18 (7 mg, tR = 59.6 min). Silica gel CC (petroleum ether/acetone/Et2NH, 8:1:0.1, v/v) of fraction D (22 g) gave three subfractions (I–III). Subfraction DII (1.3 g) was separated using a Sephadex LH-20 column (MeOH) followed by silica gel CC eluting with petroleum ether/acetone (10:1–0:1, v/v) to afford 14 (60 mg) and 15 (44 mg).
Taburnaemine A (1): white, amorphous powder; −15.0 (c 0.25, MeOH); UV (MeOH) λmax (log ε) 226 (3.80), 283 (3.11) nm; ECD (0.000 14 M, MeOH) λmax (Δε) 222 (−98.9), 237 (+97.6) nm; IR (KBr) νmax 3387, 1728, 1619 cm−1; 1H NMR and 13C NMR data, see Tables 1 and 2, respectively; ESIMS m/z 803 [M − H]−; HRESIMS m/z 803.4022 [M − H]− (calcd for C47H56N4O8, 803.4022).
Taburnaemine B (2): white, amorphous powder; −26.7 (c 0.14, MeOH); UV (MeOH) λmax (log ε) 226 (3.78), 283 (3.06) nm; ECD (0.000 13 M, MeOH) λmax (Δε) 222 (−87.4), 238 (+77.6) nm; IR (KBr) νmax 3384, 1726, 1619 cm−1; 1H NMR and 13C NMR data, see Tables 1 and 2, respectively; ESIMS m/z 805 [M + H]+; HRESIMS m/z 805.4171 [M + H]+ (calcd for C47H56N4O8, 805.4164).
Taburnaemine C (3): white, amorphous powder; −33.3 (c 0.11, MeOH); UV (MeOH) λmax (log ε) 222 (3.69), 286 (3.02) nm; ECD (0.000 11 M, MeOH) λmax (Δε) 221 (−102.3), 238 (+80.7) nm; IR (KBr) νmax 3431, 1729, 1630 cm−1; 1H NMR and 13C NMR data, see Tables 1 and 2, respectively; ESIMS m/z 761 [M − H]−; HRESIMS m/z 761.3556 [M − H]− (calcd for C44H50N4O8, 761.3558).
Taburnaemine D (4): white, amorphous powder; +7.4 (c 0.18, MeOH); UV (MeOH) λmax (log ε) 210 (3.66), 237 (3.87), 261 (3.27), 284 (3.27) nm; ECD (0.000 13 M, MeOH) λmax (Δε) 222 (−104.7), 242 (+78.9) nm; IR (KBr) νmax 3430, 2854, 1725, 1627 cm−1; 1H NMR and 13C NMR data, see Tables 1 and 2, respectively; ESIMS m/z 765 [M + H]+; HRESIMS m/z 765.3785 [M + H]+ (calcd for C44H52N4O8, 765.3850).
Taburnaemine E (5): white, amorphous powder; −96.7 (c 0.09, MeOH); UV (MeOH) λmax (log ε) 223 (3.84), 294 (3.13) nm; ECD (0.00009 M, MeOH) λmax (Δε) 223 (−161.8), 238 (+102.9) nm; IR (KBr) νmax 3431, 1724, 1627 cm−1; 1H NMR and 13C NMR data, see Tables 1 and 2, respectively; ESIMS m/z 763 [M + H]+; HRESIMS m/z 763.3993 [M + H]+ (calcd for C45H54N4O7, 763.4065).
Taburnaemine F (6): white, amorphous powder; −7.1 (c 0.17, MeOH); UV (MeOH) λmax (log ε) 205 (3.77), 224 (3.84), 383 (3.15) nm; ECD (0.00012 M, MeOH) λmax (Δε) 211 (−26.8), 223 (−110.6), 238 (+90.9) nm; IR (KBr) νmax 3431, 1729, 1630 cm−1; 1H NMR and 13C NMR data, see Tables 3 and 4, respectively; ESIMS m/z 749 [M + H]+; HRESIMS m/z 749.3920 [M + H]+ (calcd for C44H52N4O7, 749.3836).
Table 3.
1H NMR Data (δ) for Compounds 6–9
| position | 6a | 7b | 8c | 9d | position | 6a | 7b | 8c | 9d |
|---|---|---|---|---|---|---|---|---|---|
| 3 | 5.41 br d (12.6) | 5.34 dd (13.0, 3.0) | 4.66 br d (13.6) | 5.10 br d (12.5) | 5’a | 3.36 br d (12.0) | 3.71 m | 3.36 dd (13.6, 7.2) | 3.39 t (12.0) |
| 5 | 3.84 t (9.0) | 3.84 t (10.0) | 3.80 t (8.8) | 3.89 t (9.0) | 5’b | 3.27 dd (12.0, 4.8) | 3.15 m | 3.08 dd (13.6, 6.4) | 2.89 dd (15.0, 3.0) |
| 6a | 3.56 dd (14.4, 9.6) | 3.54 br d (8.0) | 3.65 dd (12.8, 8.0) | 3.52 dd (15.0, 9.5) | 6’a | 5.02 d (6.0) | 2.94 dd (16.0, 6.0) | 3.11 dd (9.6, 6.4) | 1.90 br d (13.0) |
| 6b | 3.43 dd (14.4, 8.4) | 3.49 br d (8.0) | 3.30e | 3.24 dd (15.0, 8.5) | 6’b | 2.82 dd (16.0, 6.0) | 2.91 dd (9.6, 7.2) | 1.81 br d (13.0) | |
| 9 | 7.64 d (7.2) | 7.68 d (7.5) | 7.55 d (7.2) | 7.52 d (7.0) | 9’ | 7.35 d (8.4) | 7.21 d (8.5) | 7.28 s | 6.89 s |
| 10 | 7.02 t (7.2) | 7.03 td (7.5, 2.0) | 6.96 t (7.2) | 7.07 t (7.0) | 10’ | 6.90 d (8.4) | 6.84 d (8.5) | ||
| 11 | 7.01 t (7.2) | 7.01 td (7.5, 2.0) | 6.96 t (7.2) | 7.06 t (7.0) | 11’ | 6.86 d (8.0) | |||
| 12 | 7.08 d (7.2) | 7.09 d (7.5) | 7.10 d (7.2) | 7.08 d (7.0) | 12’ | 7.15 d (8.0) | 7.11 s | ||
| 14a | 2.76 m | 2.70 dd (13.5, 13.0) | 2.83 m | 2.66 dd (15.0, 8.0) | 14’ | 1.94 m | 1.51 m | 1.86e | 1.89 |
| 14b | 1.85 m | 1.87 br d (13.5) | 1.94 m | 1.91 br d (15.0) | 15’a | 1.71 m | 1.26 m | 1.73 m | 1.75 m |
| 15 | 3.70 dd (10.8, 7.8) | 3.70 dd (11.5, 7.0) | 3.67 br d (12.0) | 3.50 t (15.0) | 15’b | 0.92 m | 1.10 m | 1.09 ddt (12.8, 6.4, 2.4) | 1.06 dd (12.5, 7.0) |
| 17a | 3.81 d (12.6) | 3.83 d (11.0) | 3.82 d (10.4) | 3.69 d (13.0) | 17’a | 1.92 br d (15.0) | 1.87 m | 2.71 dt (13.6, 2.4) | 2.73 br d (13.5) |
| 17b | 3.63 d (12.6) | 3.64 d (11.0) | 3.63 d (10.4) | 3.69 d (13.0) | 17’b | 1.50 br d (15.0) | 0.64 br d (13.5) | 1.86e | 2.39 br d (13.5) |
| 18 | 1.62 d (6.6) | 1.62 d (7.0) | 1.64 dd (6.4, 1.6) | 1.66 d (7.0) | 18’ | 0.79 t (7.2) | 0.80 t (7.0) | 0.87 t (8.0) | 0.83 t (7.0) |
| 19 | 5.33 q (6.6) | 5.32 q (7.0) | 5.35 q (6.4) | 5.41 q (7.0) | 19’a | 1.46 m | 1.27 m | 1.56 m | 1.40 m |
| 21a | 3.61 d (13.2) | 3.56 d (13.5) | 3.66 d (13.6) | 3.64 d (13.5) | 19’b | 1.27 m | 1.45 m | 1.41 m | 1.40 m |
| 21b | 2.92 d (13.2) | 2.90 d (13.5) | 2.91 d (13.6) | 2.98 d (13.5) | 20’ | 1.07 m | 1.09 m | 1.37 m | 1.34 m |
| NH | 9.60 br s | 9.23 br s | 7.69 br s | 21’ | 3.34 d (10.8) | 3.41 s | 3.54 br s | 3.72 s | |
| N-Me | 2.55 s | 2.57 br s | 2.54 s | 2.57 s | 22’a | 3.45 dd (11.0, 3.5) | |||
| CO2Me | 2.27 s | 2.33 s | 2.30 s | 2.37 s | 22’b | 3.23 dd (11.0, 8.0) | |||
| 3’a | 4.75 d (4.2) | 2.48 dd (8.0, 3.5) | 2.93 dt (8.0, 3.2) | 2.69 br d (18.5) | NH’ | 7.61 br s | 9.38 br s | ||
| 3’b | 2.83 br d (8.0) | 2.69 br d (18.5) | CO2Me’ | 3.79 s | 3.72 s | 3.65 s | 3.65 s | ||
| OMe-11’ | 3.96 s | 3.95 s | 3.98 s |
600 MHz, acetone-d6.
500 MHz, acetone-d6.
800 MHz, acetone-d6.
500 MHz, CDCl3.
Overlapped, without designating multiplicity.
Taburnaemine G (7): white, amorphous powder; −62.5 (c 0.22, MeOH); UV (MeOH) λmax (log ε) 225 (3.84), 286 (3.11) nm; ECD (0.000 08 M, MeOH) λmax (Δε) 223 (−161.9), and 239 (+ 87.3) nm; IR (KBr) νmax 3431, 1729, 1630 cm−1; 1H NMR and 13C NMR data, see Tables 3 and 4, respectively; ESIMS m/z 765 [M + H]+; HRESIMS m/z 765.4222 [M + H]+ (calcd for C45H56N4O7, 765.4222).
Taburnaemine H (8): white, amorphous powder; −99.2 (c 0.15, MeOH); UV (MeOH) λmax (log ε) 231 (3.74), 289 (3.16) nm; ECD (0.000 17 M, MeOH) λmax (Δε) 225 (−40.6), 243 (22.07) nm; IR (KBr) νmax 3429, 1723, 1638 cm−1; 1H NMR and 13C NMR data, see Tables 3 and 4, respectively; ESIMS m/z 705 [M + H]+; HRESIMS m/z 705.4013 [M + H]+ (calcd for C43H52N4O5, 705.4010).
Taburnaemine I (9): white, amorphous powder; −23.0 (c 0.20, MeOH); UV (MeOH) λmax (log ε) 211 (3.08), 237 (3.38), 262 (2.62), 286 (2.75) nm; ECD (0.000 37 M, MeOH) λmax (Δε) 229 (−30.6), 246 (+18.3) nm; IR (KBr) νmax 3428, 1728, 1625 cm−1; 1H NMR and 13C NMR data, see Tables 3 and 4, respectively; ESIMS m/z 751 [M + H]+; HRESIMS m/z 751.4061 [M + H]+ (calcd for C44H54N4O7, 751.4065).
X-ray Crystal Structure Analysis of Compounds 1 and 10.
Colorless crystals of 1 and 10 were recrystallized from acetone and MeOH, respectively. Intensity data were collected on a Bruker Apex Duo diffractometer equipped with an Apex II CCD using Cu Kα radiation. Cell refinement and data reduction were performed with Bruker SAINT software. The structure was solved by direct methods using SHELXL-97. Refinements were performed with SHELXL-97 using full-matrix least-squares, with anisotropic displacement parameters for all the non-hydrogen atoms. The H atoms were placed in calculated positions and refined using a riding model. Molecular graphics were computed with PLATON.
Crystal Data of 1. C47H56N4O8, M = 804.95, a = 9.4439(2) Å, b = 18.2011(3) Å, c = 24.5795(4) Å, V = 4224.95(13) Å3, T = 100(2) K, space group P212121, Z = 4, μ(Cu Kα) = 0.699 mm−1, 26 373 reflections measured, 7659 independent reflections (Rint = 0.0289). The final R1 values were 0.0315 (I > 2σ(I)). The final wR(F2) values were 0.0818 (I > 2σ(I)). The final R1 values were 0.0321 (all data), and the final wR(F2) values were 0.0824 (all data). The goodness of fit on F2 was 1.044. Flack parameter = 0.05(4). Crystallographic data (excluding structure factor tables) for compound 1 have been deposited with the Cambridge Crystallographic Data Center as supplementary publication (deposit number CCDC 1579166).
Crystal Data of 10. C44H54N4O6·CH4O, M = 766.95, a = 11.9273(2) Å, b = 15.9773(3) Å, c = 20.8434(4) Å, V = 3972.04(13) Å3, T = 100(2) K, space group P212121, Z = 4, μ(Cu Kα) = 0.695 mm−1, 24 297 reflections measured, 7217 independent reflections (Rint = 0.0282). The final R1 values were 0.0317 (I > 2σ(I)). The final wR(F2) values were 0.0811 (I > 2σ(I)), and the final R1 values were 0.0318 (all data). The final wR(F2) values were 0.0811 (all data). The goodness of fit on F2 was 1.088. Flack parameter = 0.04(3). Crystallographic data (excluding structure factor tables) for compound 10 were deposited with the Cambridge Crystallographic Data Center as supplementary publication (deposit number CCDC 1579167). Copies of the data can be obtained free of charge by application to CCDC, 12 Union Road, Cambridge CB 1EZ, UK [fax: Int. +44 (0) (1223) 336 033; e-mail: deposit@ccdc.cam.ac.uk].
Antiproliferative Activity Assay.
The antiproliferative activity of the compounds was determined by an SRB assay, as described previously.14 Briefly, cell suspensions were seeded on 96-well microtiter plates at a density of 4000–12 000 cells per well and treated with the test compounds. After a 72 h culture with the compounds, the cells were fixed in 10% trichloroacetic acid and then stained with 0.04% SRB. The absorbance at 515 nm of protein-bound dye solubilized with 10 mM Tris base was measured using a microplate reader (ELx800, BioTek) operated by Gen5 software (BioTek). Then, IC50 data were calculated statistically (MS Excel) from at least three independent experiments performed with duplication. The following human tumor cell lines were used in this study: A549 (lung carcinoma), MDA-MB-231 (triple-negative breast cancer), KB (originally isolated from epidermoid carcinoma of the nasopharynx), KB-VIN (vincristine-resistant KB subline showing MDR phenotype by overexpressing P-gp), and MCF-7 (estrogen receptor-positive and HER2-negative breast cancer). The four cell lines A549, MDA-MB-231, KB, and MCF-7 were obtained from the Lineberger Comprehensive Cancer Center (UNC-CH) or from ATCC (Manassas, VA, USA). The KB-VIN cell line was a generous gift from Prof. Y.-C. Cheng of Yale University. The cells were cultured in RPMI-1640 medium supplemented with 2 mM l-glutamine and 25 mM HEPES (Corning), containing 10% fetal bovine serum (Corning), 100 μg/mL streptomycin, and 100 IU penicillin (Corning). KB-VIN stock cells were maintained in the presence of 100 nM vincristine. Vincristine and paclitaxel were used as experimental controls.
Supplementary Material
ACKNOWLEDGMENTS
This research was financially supported by the National Natural Science Foundation of China (81473122 and 21432010), CAS “Light of West China” Program (to Y. Z.), the Youth Innovation Promotion Association of CAS (2015323), the Young Academic and Technical Leader Raising Foundation of Yunnan Province (to Y.Z.), and State Key Laboratory of Phytochemistry and Plant Resources in West China (P2016-ZZ08). This study was also supported in part by NIH grant CA177584 from the National Cancer Institute awarded to K.H.L. and the Eshelman Institute for Innovation, Chapel Hill, North Carolina, awarded to M.G.
Footnotes
Supporting Information
The Supporting Information is available free of charge on the ACS Publications website at DOI: 10.1021/acs.jnatprod.7b00949.
MS, HREIMS, IR, UV, ECD, and NMR spectra of new compounds 1–9 (PDF)
X-ray crystallographic data of compounds 1 and 10 (CIF) (CIF)
The authors declare no competing financial interest.
DEDICATION
Dedicated to Dr. Susan Band Horwitz, of Albert Einstein College of Medicine, Bronx, NY, for her pioneering work on bioactive natural products.
REFERENCES
- (1).Dewick PM Medicinal Natural Products: A Biosynthetic Approach, 3rd ed; John Wiley & Sons Ltd: Chichester, UK, 2009; pp 369–380. [Google Scholar]
- (2).Facchini PJ; De Luca V Plant J. 2008, 54, 763–784. [DOI] [PubMed] [Google Scholar]
- (3).De Luca V; Salim V; Atsumi SM; Yu F Science 2012, 336, 1658–1661. [DOI] [PubMed] [Google Scholar]
- (4).Yuan YX; Zhang Y; Guo LL; Wang YH; Goto M; Morris-Natschke SL; Lee KH; Hao XJ Org. Lett 2017, 19, 4964–4967. [DOI] [PMC free article] [PubMed] [Google Scholar]
- (5).Hirasawa Y; Miyama S; Hosoya T; Koyama K; Rahman A; Kusumawati I; Zaini NC; Morita H Org. Lett 2009, 11, 5718–5721. [DOI] [PubMed] [Google Scholar]
- (6).Lim KH; Raja VJ; Bradshaw TD; Lim SH; Low YY; Kam TS J. Nat. Prod 2015, 78, 1129–1138. [DOI] [PubMed] [Google Scholar]
- (7).(a) Wang L; He HP; Di YT; Zhang Y; Hao XJ Tetrahedron Lett. 2012, 53, 1576–1578. [Google Scholar]; (b) Guo LL; He HP; Di YT; Li SF; Cheng YY; Yang W; Li Y; Yu JP; Zhang Y; Hao XJ Phytochemistry 2012, 74, 140–145. [DOI] [PubMed] [Google Scholar]; (c) Fu YH; Di YT; He HP; Li SL; Zhang Y; Hao XJ J. Nat. Prod 2014, 77, 57–62. [DOI] [PubMed] [Google Scholar]; (d) Zhang Y; Guo LL; Yang GM; Guo F; Di YT; Li SL; Chen DZ; Hao XJ Fitoterapia 2015, 100, 150–155. [DOI] [PubMed] [Google Scholar]
- (8).Luo XD; Cai XH; Li Y Chin. Pat. ZL 2010. 101017336, 2012. [Google Scholar]
- (9).Bao MF; Yan JM; Cheng GG; Li XY; Liu YP; Li Y; Cai XH; Luo XD J. Nat. Prod 2013, 76, 1406–1412. [DOI] [PubMed] [Google Scholar]
- (10).Sim DSY; Teoh WY; Sim KS; Lim SH; Thomas NF; Low YY; Kam TS J. Nat. Prod 2016, 79, 1048–1055. [DOI] [PubMed] [Google Scholar]
- (11).Kam TS; Sim KM Phytochemistry 2003, 63, 625–629. [DOI] [PubMed] [Google Scholar]
- (12).Sheludko Y; Gerasimenko I; Kolshorn H; Stockigt JJ Nat. Prod 2002, 65, 1006–1010. [DOI] [PubMed] [Google Scholar]
- (13).Flack HD; Bernardinelli G Chirality 2008, 20, 681–690. [DOI] [PubMed] [Google Scholar]
- (14).(a) Nakagawa-Goto K; Oda A; Hamel E; Ohkoshi E; Lee KH; Goto MJ Med. Chem 2015, 58, 2378–2389. [DOI] [PMC free article] [PubMed] [Google Scholar]; (b) Suzuki A; Saito Y; Fukuyoshi S; Goto M; Miyake K; Newman DJ; O’Keefe BR; Lee KH; Nakagawa-Goto KJ Nat. Prod 2017, 80, 1065–1072. [DOI] [PMC free article] [PubMed] [Google Scholar]
Associated Data
This section collects any data citations, data availability statements, or supplementary materials included in this article.