PLOS One logoLink to PLOS One
. 2020 Aug 20;15(8):e0237601. doi: 10.1371/journal.pone.0237601

Impact of calculated plasma volume status on all-cause and cardiovascular mortality: 4-year nationwide community-based prospective cohort study

Yoichiro Otaki 1, Tetsu Watanabe 1,*, Tsuneo Konta 1, Masafumi Watanabe 1, Koichi Asahi 2, Kunihiro Yamagata 2, Shouichi Fujimoto 2, Kazuhiko Tsuruya 2, Ichiei Narita 2, Masato Kasahara 2, Yugo Shibagaki 2, Kunitoshi Iseki 2, Toshiki Moriyama 2, Masahide Kondo 2, Tsuyoshi Watanabe 2
Editor: Anderson Saranz Zago3
PMCID: PMC7446862  PMID: 32817643

Abstract

Background

Plasma volume status (PVS), a marker of plasma volume expansion and contraction, is gaining attention in the field of cardiovascular disease because of its role in the prevention and of the management of heart failure. However, it remains undetermined whether an abnormal PVS is a risk for all-cause and cardiovascular mortality in the general population.

Methods and results

We used a nationwide database of 230,882 subjects (age 40–75 years) who participated in the annual “Specific Health Check and Guidance in Japan” check-up between 2008 and 2011. There were 586 cardiovascular deaths, 2,552 non-cardiovascular deaths, and 3,138 all-cause deaths during the follow-up period of four years. Abnormally high and low PVS were identified from the results of 80% of all subjects (high and low PVS ≥ 7 and < -13.3, respectively). Multivariate Cox proportional hazard regression analysis demonstrated that high PVS was an independent risk factor for all-cause, cardiovascular and non-cardiovascular deaths. Although low PVS was a positive risk factor for cardiovascular deaths as well, it was a negative risk factor for non-cardiovascular deaths. The addition of PVS to cardiovascular risk factors significantly improved the C-statistic, net reclassification, and integrated discrimination indexes.

Conclusions

This is the first prospective report to reveal the impact of PVS on all-cause and cardiovascular mortality. PVS could be an additional risk factor for all-cause and cardiovascular mortality in the general population.

Introduction

Regulation of plasma volume is important in pregnancy and is a therapeutic target in sepsis and heart failure [13]. Heart failure remains a major and increasing public health problem, with a high mortality rate [4]. It was reported that imbalanced volume homeostasis causes systemic congestion and peripheral and pulmonary edema in heart failure [5]. Plasma volume expansion underlies systemic congestion, which is a well-known, clinically, and prognostically relevant complication of heart failure [6]. Since accurate measurement of plasma volume is technically difficult and invasive as its determination requires pulmonary artery catheterization or administration of tracer molecules [79], several formulae have been derived from routinely collected clinical data to calculate estimates of plasma volume. It was reported that plasma volume calculated using these formulae is a useful predictor of clinical outcome in patients with heart failure [10,11]. However, these estimates of plasma volume were reportedly poorly correlated with measured plasma volume [12].

Recently, plasma volume status (PVS), an index of the degree to which patients have deviated from their ideal plasma volume, is gaining attention in patients with heart failure. PVS is associated with cardiac events and mortality in patients with heart failure [1315]. American College of Cardiology/American Herat Association guidelines have recommended volume status be assessed [16]. However, the impact of PVS on all-cause and cardiovascular death in the general population remains unknown. Thus, we hypothesized that PVS may serve as an early identification of high-risk subjects for all-cause and cardiovascular deaths in the general population. The present study aimed to examine whether PVS is a novel risk factor for all-cause and cardiovascular deaths in the general population.

Method

Ethics statement

All procedures performed in studies involving human participants were undertaken in accordance with the ethical, institutional, and/or national research committee guidelines of the centers at which the studies were conducted (Yamagata University, 2008, no. 103) and in compliance with the 1964 Helsinki declaration and its later amendments or comparable ethical standards. The institutional ethics committee of Yamagata University School of Medicine approved the study.

This study was performed according to the Ethical Guidelines for Medical and Health Research Involving Human Subjects enacted by the Ministry of Health, Labour and Welfare of Japan (http://www.mhlw.go.jp/file/06-Seisakujouhou-10600000-Daijinkanboukouseikagakuka/0000069410.pdf; http://www.mhlw.go.jp/file/06-Seisakujouhou-10600000-Daijinkanboukouseikagakuka/0000080278.pdf). In the context of the guideline, the investigators shall not necessarily be required to obtain informed consent, but we publicized information concerning this study on the web (http://www.fmu.ac.jp/univ/sangaku/data/koukai_2/2771.pdf) and ensured that there was an opportunity for the research subjects to decline the use of their personal information. All data were fully anonymized.

Study population

This study is a part of an ongoing “Research on design of the comprehensive health care system for chronic kidney disease (CKD)” based on individual risk assessments by the Specific Health Check-up for all inhabitants of Japan between the ages of 40 and 74 years and is covered by the Japanese national health insurance. We utilized data obtained from the following 16 prefectures (i.e., administrative regions): Hokkaido, Tochigi, Saitama, Chiba, Nagano, Niigata, Ishikawa, Fukui, Gifu, Hyogo, Tokushima, Fukuoka, Saga, Nagasaki, Kumamoto, and Okinawa. These prefectures were divided into four region areas; Hokkaido and Tohoku; Kanto and Koshinetsu; Kinki, Shikoku, and Chugoku; and Kyushu and Okinawa. A flow chart of the selection process used in the study is shown in Fig 1. We collected data from 230,989 subjects (aged 40–74 years) who participated in the health check-ups of 2008–2011. Among them, 107 were excluded from this study due to lack of essential data. Therefore, 88,775 men and 142,107 women were included in this study.

Fig 1. A flow chart of the study selection process.

Fig 1

Definition of cardiovascular risks

Blood pressure was measured the following method [17]. Participants were seated with back supports. After resting for at least 5 minutes, blood pressure was measured 2 times without conversation. Blood pressure was determined by an average of 2 blood pressure readings. Hypertension was defined as a systolic blood pressure ≥ 140 mmHg, diastolic blood pressure ≥ 90 mmHg, or antihypertensive medication use. Diabetes mellitus was defined as a fasting blood sugar (FBS) ≥ 126 mg/dL, glycosylated haemoglobin A1c (HbA1c) ≥ 6.5% (National Glycohemoglobin Standardization Program), or anti-diabetic medication use. Dyslipidemia was defined as high-density lipoprotein cholesterol (HDL-C) < 40 mg/dL, low-density lipoprotein cholesterol (LDL-C) ≥ 140 mg/dL, triglyceride ≥ 150 mg/dL, or lipid-lowering medication use.

Definition of PVS

Actual PV (aPV), ideal PV (iPV), and PVS were calculated by the following equations: aPV = (1-hematocrit)×[a+(b×weight (kg))] where hematocrit is a fraction (Men: a = 1530 and b = 41; women, a = 864 and b = 47.9); iPV = c×weight (kg) where c = 39 in men and c = 40 in women; and PVS = [(aPV-iPV)/iPV]×100% [14,15,18]. Normal range of PVS has not been defined yet. Therefore, we defined abnormally high and low PVS as PVS ≥ 7 and < -13.3, respectively, based on the results for 80% of all subjects. Since aPV is often under iPV, the value of PVS could become less than 0. In the Treatment of Preserved Cardiac Function Heart Failure with an Aldosterone Antagonist Trial (TOPCAT) study, PVS was reported to be less than 0 in 91% of heart failure patients [13]. High and low PVS are considered as plasma volume expansion and contraction, respectively.

Measurements

FBS, HbA1c, total cholesterol, HDL-C, LDL-C and triglyceride levels were measured. All blood and urine analyses were performed at a local laboratory. The methods for the analyses were not standardized between laboratories. However, the analyses were based on the Japan Society of Clinical Chemistry recommended methods for laboratory tests, which have been widely accepted by laboratories across Japan.

Endpoint and follow-up

After obtaining permission from the Ministry of Health, Labour and Welfare, we accessed the database containing death certificates for all deaths that occurred between 2008 and 2015. All subjects were prospectively followed for a median follow up period of 4 years (interquartile range, 2.9–5.2 years; longest follow up, 7 years). The endpoints were cardiovascular death, non-cardiovascular death, and all-cause death. The cause of death was determined by reviewing the death certificates and classified based on the death code (International Classification of Diseases, 10th Revision).

Statistical analysis

Normality of continuous variables was checked by a Kolmogorov-Smirnov-Lillefors test. Subjects without essential data were excluded from this study. Continuous and categorical variables were compared with t-tests and chi-square tests, respectively. Survival curves were constructed using the Kaplan-Meier method and compared using log-rank tests. A Cox proportional hazard analysis was performed to determine independent predictors for all-cause death, and significant predictors selected in univariate analysis were entered into the multivariate analysis. Receiver operating characteristics (ROC) curves for all-cause deaths, cardiovascular and non-cardiovascular deaths were constructed and used as a measure of the predictive accuracy of PVS for all-cause deaths. We calculated the net reclassification index (NRI) and integrated discrimination index (IDI) to measure the quality of improvement for the correct reclassification by the addition of PVS to the multivariate model. Values of P < 0.05 were considered statistically significant. All statistical analyses were performed using standard statistical program packages (JMP version 12, SAS Institute Inc., Cary, NC, USA; and R 3.0.2 with additional packages including Rcmdr, Epi, pROC, and PredictABEL).

Results

Baseline characteristics and comparison of clinical characteristics between subjects with high and low PVS

The subjects’ baseline characteristics are shown in Table 1.

Table 1. Comparison of clinical characteristics between subjects with low, normal and high PVS.

Variables All subjects
n = 230,882
Low PVS
n = 22,613
Normal PVS
n = 185,415
High PVS
n = 22,854
Age, years 64 ± 8 62 ± 9* 64 ± 8 65 ± 9*
Male, n (%) 88,775 (38%) 16,203(72%) 63,772 (34%) 8,800 (39%)
BMI, kg/m2 22.9 ± 2.9 26.6 ± 3.5* 22.8 ± 2.9 20.0 ± 2.7*
Hypertension, n (%) 104,003 (45%) 13,496 (59%) 82,371 (44%) 8,136 (36%)
 Systolic BP, mmHg 129 ± 17 134 ± 17* 128 ± 17 124 ± 18*
 Diastolic BP, mmHg 76 ± 11 82 ± 11* 76 ± 11 72 ± 11*
Dyslipidemia, n (%) 127,474 (55%) 16,104 (71%) 103,233 (56%) 8,137 (36%)
Diabetes mellitus, n (%) 20,103 (8.7%) 3,345 (14.8%) 14,811 (8.0%) 1,947 (8.5%)
Smoking, n (%) 31,694 (14%) 5,990 (27%) 22,773 (12%) 2,931 (13%)
Region area
 Hokkaido and Tohoku 22,314 (10) 3,034 (13%) 17,959 (10%) 1,321 (6%)
 Kanto and Koshinetsu 104,487 (45) 9,967 (44%) 84,961 (45%) 9,829 (43%)
 Kinki, Shikoku and Chugoku 15,038 (7) 1,635 (7%) 12,417 (7%) 986 (4%)
 Kyushu and Okinawa 89,043 (38) 7,977 (35) 70,348 (38%) 1,0718 (47%)
Biochemical data
 PVS -2.7 ± 7.5 -17.1 ± 3.8* -3.5 ± 5.1 18.7 ± 18.5*
 RBC, 104/μL 431 ± 68 495 ± 56* 435 ± 53 335 ± 141*
 Hb, g/dL 13.4 ± 1.6 15.5 ± 1.0* 13.5 ± 1.1 10.2 ± 4.1*
 Hematocrit, mg/dL 40.6 ± 4.8 47.2 ± 2.9* 41.0 ± 3.0 31.2 ± 12.2*
 eGFR, ml/min/1.73m2 75.7 ± 17.0 74.5 ± 15.6* 75.7 ± 16.7 76.6 ± 19.6*
 HbA1c (%) 5.4 ± 0.7 5.6 ± 0.9* 5.4 ± 0.7 5.3 ± 0.7*
 FBS, mg/dL 97 ± 21 105 ± 28* 97 ± 20 95 ± 21*
 Total cholesterol, mg/dL 211 ± 36 218 ± 38* 212 ± 36 196 ± 35*
 Triglyceride, mg/dL 120 ± 79 163 ± 107* 119 ± 76 94 ± 62*
 HDL-C, mg/dL 62 ± 17 55 ± 14 63 ± 17 65 ± 17
 LDL-C, mg/dL 125 ± 31 131 ± 32* 126 ± 31 112 ± 30*
Medications
 Anti-hypertensive drug, n (%) 68,615 (30%) 8,435 (37%) 54,686 (29%) 5,494 (24%)
 Anti-diabetic drug, n (%) 11,853 (5.1%) 1,539 (6.8%) 9,006 (4.9%) 1,308 (5.7%)
 Anti-dyslipidemia drug, n (%) 37,629 (16.3%) 3,723 (16.5%) 31,367 (16.9%) 2,539 (11.1%)

Data are expressed as mean ± SD, number (percentage), or median.

BMI, body mass index; BP, blood pressure; eGFR, estimated glomerular filtration rate; FBS, fasting blood sugar; HbA1c, glycosylated hemoglobin A1c; HDL-C, high-density lipoprotein cholesterol; LDL-C, low-density lipoprotein cholesterol; PVS, plasma volume status; RBC, red blood cell count.

* P<0.05 vs. normal PSV group,

P<0.05. vs. low PSV group by analysis of variance (ANOVA) with Tukey’s post hoc test,

P<0.05 by chi-square test.

Hypertension, dyslipidemia and diabetes mellitus were identified in 104,003 (45%), 127,474 (55%), and 20,103 (8.7%) subjects, respectively. The mean PVS was -2.7%. The subjects were divided into three groups based on the PVS: low PVS group, PVS < -13.3, n = 22,613; normal PVS group, PVS from -13.3 to 6.9, n = 185,415; and high PVS group, PVS ≧7, n = 22,854.

Subjects with high PVS were older and had lower prevalence of dyslipidemia than those in the other two groups. Subjects with high PVS showed lower levels of body mass index, systolic and diastolic blood pressure, red blood cell count, haemoglobin, FBS, HbA1c, total cholesterol, and triglyceride and LDL-C and higher level of eGFR than those without it (Table 1).

Subjects with low PVS were younger and more likely to be male; to have hypertension, dyslipidemia, or diabetes mellitus; to be current smokers; or be taking anti-hypertensive or anti-diabetic drugs than those with normal or high PVS. Subjects with low PVS showed higher body mass index, systolic and diastolic blood pressure, red blood cell count, haemoglobin, FBS, HbA1c, total cholesterol, and triglyceride and LDL-C levels and lower eGFR (Table 1).

It was reported that high altitude affects volume status and its regulator hormone secretion [19], indicating the region difference in PVS. There was a significant difference in the prevalence of high and low PVS among region areas.

PVS and mortality

All subjects were prospectively followed during a median follow-up period of 4 years. During the follow-up period, there were 586 cardiovascular deaths, 2,552 non-cardiovascular deaths, and 3,138 all-cause deaths.

Since it was reported that there was a non-linear relationship between PVS and mortality in patients with heart failure [14,18], we examined the unadjusted hazard ratio for subject groups stratified by 1% increments of PVS. As shown in Fig 2, a consistently significant higher risk was seen in the groups with PVS > 5% or < -20% compared with the group with PVS between -6% and -5.1% who had the lowest risk (referent group).

Fig 2. The unadjusted hazard ratio for subject groups stratified by 1% increments of PVS.

Fig 2

CI, confidence interval; PVS, plasma volume status. Solid line shows the hazard ratios for subject groups stratified by 1% increments of PVS. Dotted lines show the 95% confidence interval for subjects stratified by 1% increments of PVS. Orange bar shows the distribution of study subjects. The referent group was defined as the lowest risk group. *P<0.05 v.s. referent group.

Kaplan-Meier analysis demonstrated that subjects with high PVS had higher rates of all-cause, cardiovascular, and non-cardiovascular deaths than those without it (Fig 3A, 3B and 3C). On the other hand, subjects with low PVS had a higher rate of cardiovascular deaths compared to normal PVS group, whereas there were no significant differences in the non-cardiovascular and all-cause mortalities between subjects with low and normal PVS.

Fig 3. Kaplan-Meier analysis of all-cause deaths (A), cardiovascular deaths (B), and non-cardiovascular deaths (C) among subjects with low, normal, and high PVS.

Fig 3

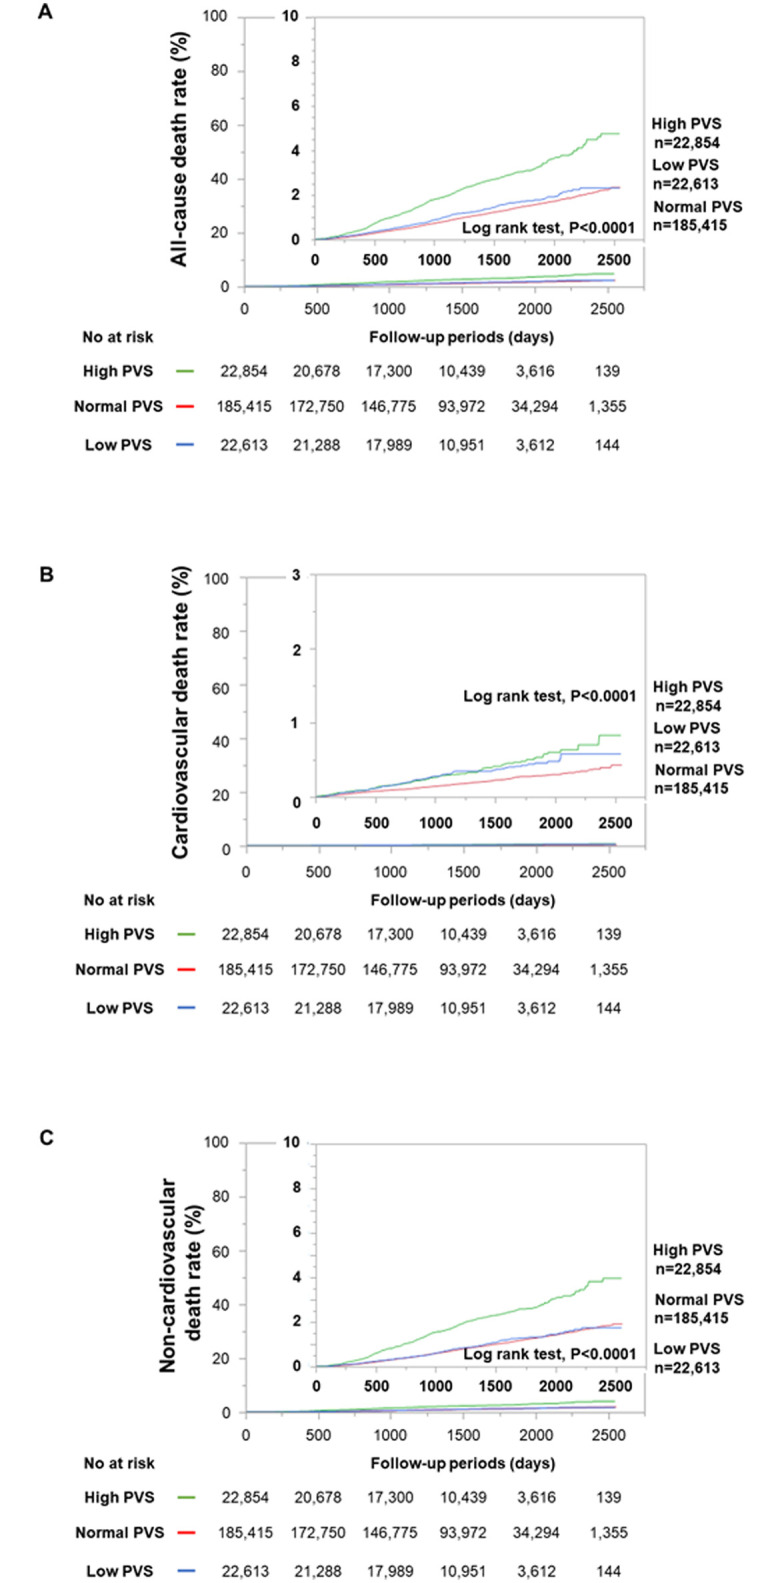
PVS, plasma volume status. Green, red, and blue lines show the survival curves for high, normal, and low PVS groups, respectively.

To determine the risk factors for predicting all-cause, cardiovascular, and non-cardiovascular deaths, we performed univariate and multivariate Cox proportional hazard regression analyses. In the univariate analysis, high PVS was significantly associated with all-cause, cardiovascular and non-cardiovascular deaths (Table 2).

Table 2. Univariate and multivariate Cox proportional hazard analyses of predicting all-cause, cardiovascular, and non-cardiovascular deaths.

Variables Univariate analysis Multivariate analysis*
HR 95%CI P value HR 95%CI P value
All-cause deaths
High vs. normal PVS 2.186 1.993–2.394 <0.0001 2.041 1.856–2.239 <0.0001
Low vs. normal PVS 1.161 1.030–1.305 0.0150 0.938 0.829–1.057 0.2991
Cardiovascular deaths
High vs. normal PVS 1.852 1.466–2.315 <0.0001 1.823 1.437–2.290 <0.0001
Low vs. normal PVS 1.674 1.314–2.107 <0.0001 1.332 1.037–1.691 0.0251
Non-cardiovascular deaths
High vs. normal PVS 2.262 2.044–2.498 <0.0001 2.085 1.880–2.307 <0.0001
Low vs. normal PVS 1.045 0.909–1.196 0.5253 0.848 0.735–0.973 0.0191

CI, confidence interval; HR, hazard ratio; PVS, plasma volume status.

*after adjustment for age, sex, hypertension, diabetes mellitus, dyslipidemia, smoking, and region area.

In addition, low PVS was significantly associated with all-cause and cardiovascular deaths, but not non-cardiovascular deaths. The multivariate Cox proportional hazard regression analysis demonstrated that high PVS was an independent predictor of future all-cause, cardiovascular and non-cardiovascular deaths after adjustment for age, sex, hypertension, dyslipidemia, diabetes mellitus, smoking, and region area (Table 2). On the other hand, low PVS was a positive risk factor for cardiovascular deaths, but a negative risk factor for non-cardiovascular deaths after adjustment for age, sex, hypertension, dyslipidemia, diabetes mellitus, smoking, and region area (Table 2).

Improvement of reclassification by addition of PVS to predict all-cause, cardiovascular, and non-cardiovascular mortality

To examine whether model fit and discrimination improve with addition of PVS to the basic predictors such as age, sex, hypertension, dyslipidemia, diabetes mellitus, smoking, and region area, we evaluated the improvement of C index, NRI and IDI. The ROC curve analyses demonstrated that the C indices of the baseline model for all-cause mortality, cardiovascular mortality, and non-cardiovascular mortality were significantly improved by the addition of PVS. NRI and IDI were also significantly improved by the addition of PVS (Table 3).

Table 3. Statistics for model fit and improvement with the addition of PVS on the prediction of all-cause, cardiovascular, and non-cardiovascular death.

C index NRI (95%CI, P value) IDI (95%CI, P value)
All-cause mortality
 Baseline model 0.6823 Reference Reference
 Baseline model+PVS 0.6928 0.0464 0.0015
(P<0.0001) (0.0318–0.0610, P<0.0001) (0.0012–0.0018, P<0.0001)
Cardiovascular mortality
 Baseline model 0.7177 Reference Reference
 Baseline model+PVS 0.7244 0.0470 0.0003
(P = 0.0264) (0.0155–0.0786, P = 0.0035) (0.0001–0.0004, P<0.0001)
Non-cardiovascular mortality
 Baseline model 0.6762 Reference Reference
 Baseline model+PVS 0.6882 0.0567 0.0014
(P<0.0001) (0.0398–0.0736, P<0.0001) (0.0011–0.0017, P<0.0001)

Baseline model includes age, gender, hypertension, diabetes mellitus, dyslipidemia, smoking, and region area.

IDI, integrated discrimination index; NRI, net reclassification index; 95%CI, 95% confidence interval.

Discussion

The main findings in the present study were as follows: (1) A J-curve association of PVS with all-cause mortality; (2) Kaplan-Meier analysis demonstrated that subjects with high PVS had higher rates of all-cause, cardiovascular, and non-cardiovascular deaths and subjects with low PVS had higher rate of cardiovascular deaths compared to those with normal PVS; (3) multivariate analysis demonstrated that high PVS was an independent predictor of all-cause, cardiovascular, and non-cardiovascular deaths and low PVS was an independent predictor of cardiovascular deaths; (4) the addition of PVS to other risk factors improved the prediction of all-cause, cardiovascular, and non-cardiovascular deaths in the general population.

The prognostic value of PVS has never been examined in the general population until now. The present study extended the past studies regarding calculated plasma volume and can bring new insight into the possibility that PVS could be a feasible marker for early identification of high-risk subjects in the general population. The clinical application of PVS is mainly discussed in the field of heart failure.

The data obtained from Valsartan in Heart Failure Trial (Val-HeFT) indicated that PVS was associated with increased mortality and first morbid events in J-curve fashion with the highest risk seen with PVS > -4 in patients with symptomatic heart failure [14]. Peter et al reported that PVS of -6.5% optimally predicted absence of adverse outcomes, and the rate of cardiac events were increased with advancing plasma expansion in patients with heart failure with reduced ejection fraction and those with mid-range ejection fraction [18]. The TOPCAT study demonstrated that increment in PVS is associated with a higher risk of all-cause death and heart failure hospitalization in patients with heart failure with preserved ejection fraction [13]. Taking these results into consideration, PVS could be a useful predictor of poor clinical outcome in patients with heart failure independently of ejection fraction. Annette et al reported that PVS greater than -5.6% is associated with adverse inpatient outcomes such as in-hospital death, postoperative complications and prolonged hospitalization in patients undergoing coronary bypass graft surgery [15]. Interestingly, their cut-off value for the absence of adverse outcomes was -5.6%. In accordance with these reports, our results from groups stratified by 1% increments of PVS showed that PVS of -6 to -5.1 best predicted the absence of all-cause deaths and J-curve association of PVS with all-cause mortality was observed in the general population. These findings indicated that imbalanced PVS may contribute to the development of cardiovascular disease.

The precise mechanism by which low PVS was associated with cardiovascular mortality is unclear. There is a close relationship between plasma volume and the renin angiotensin aldosterone system. It is well known that renin secretion from juxta glomerular cells is augmented by reduction in plasma volume, leading to renin angiotensin aldosterone system activation, in an attempt to reduce renal excretion of sodium, thus tending to restore plasma volume by increasing blood osmolality [20]. Subjects with low PVS had a higher prevalence rate of hypertension and higher levels of systolic and diastolic blood pressure than those with normal and high PVS. These results suggested the possibility that volume contraction may worsen cardiovascular mortality through activation of the renin angiotensin aldosterone system. In addition, subjects with low PVS accompanied higher prevalence of smoking, suggesting the presence of erythrocytosis secondary to smoking, which poses the risk of thrombosis. Therefore, thromboembolic events may contribute to the high cardiovascular mortality in subjects with low PVS.

Also, the possible pathophysiological mechanism by which high PVS may contribute to the increase in the risk of all-cause, cardiovascular, and non-cardiovascular mortality is unclear. It was reported that low hematocrit and anemia were associated with death in patients with lung cancer, which is the principle cause of cancer death in Japan [21,22]. These reports supported our result that high PVS was associated with non-cardiovascular deaths in the general population. With regard to cardiovascular mortality, previous reports discussed that neurohumoral activation such as that of the renin angiotensin aldosterone system and sympathetic nervous activation exacerbates cardiac function, leading to poor prognosis in heart failure patients [23]. In healthy subjects, as opposed to heart failure patients, high plasma volume potentially inhibits renin secretion. There must be a different mechanism operating in the general population. Potential explanation is that volume overload caused by plasma volume expansion may exacerbate cardiac function [6]. Since this study is a prospective observational study, it is beyond the scope of the study to determine the association between high PVS and mortality in the general population.

The clinical counterpart of the present study was that high PVS is associated with all-cause death, indicating the fact that subjects with high PVS need further examination for fatal disease such as cancer, cardiovascular disease, and pulmonary disease. On the other hand, subjects with low PVS need examination to exclude cardiovascular disease. Importantly, addition of PVS to the established risk factors improved c-statistics, NRI and IDI, indicating that it could be useful clinical information for the prevention, early identification and management of potentially fatal disease. Interestingly, it has been reported that renin angiotensin aldosterone inhibitors optimize plasma volume in patients with heart failure [18]. In addition, sodium-glucose cotransporter 2 (SGLT2) inhibitors result in a 7.3% reduction in plasma volume without compensatory sympathetic nervous activation and improvement in renal function [24,25]. Future studies are required to examine whether PVS guided medication prevents premature deaths in the general population.

Strengths and limitations

The strengths of the present study include its large sample size, prospective follow-up design, and nationwide data source. Therefore, our results are well generalized and highly reliable. However, there were some limitations as well. First, we assessed PVS at only one point in time. Second, we did not examine the incidence of non-fatal cardiovascular disease, cancer, and infectious disease and medical data. Thus, we could not determine the impact of PVS on the development of cardiovascular disease, cancer, and infectious disease. Third, we did not compare the calculated plasma volume but rather measured plasma volume in the general population. Finally, we do not have the data about physical activity, which may affect the future cardiovascular deaths.

Conclusion

This is the first prospective report to reveal the impact of PVS on all-cause and cardiovascular mortality. Calculated PVS could be an additional risk factor for all-cause and cardiovascular mortality in the general population.

Data Availability

Data cannot be shared publicly due to ethical restrictions on sharing data publicly. The protocol of this project (Research on the Positioning of Chronic Kidney Disease in Specific Health Check and Guidance in Japan) determined that analytical data were distributed only to the members of steering committee because the data contain potentially identifying information. Data are available upon requestfrom the Department of Chronic Kidney Disease Initiatives; Fukushima Medical University School of Medicine; 1-Hikarigaoka, Fukushima 960-1295, Japan; Phone & Fax: +81-24-547-1898; E-mail dckdi@fmu.ac.jp.

Funding Statement

The authors received no specific funding for this work.

References

  • 1.Vricella LK (2017) Emerging understanding and measurement of plasma volume expansion in pregnancy. Am J Clin Nutr 106: 1620S–1625S. 10.3945/ajcn.117.155903 [DOI] [PMC free article] [PubMed] [Google Scholar]
  • 2.Miller WL, Albers DP, Gansen DN, Mullan BP (2018) Intravascular Volume Profiles in Patients With Class I and II Systolic Heart Failure: Heterogeneity and Volume Overload Are Common Even in Mild Heart Failure. J Card Fail 24: 417–424. 10.1016/j.cardfail.2017.09.010 [DOI] [PubMed] [Google Scholar]
  • 3.Vincent JL, De Backer D, Wiedermann CJ (2016) Fluid management in sepsis: The potential beneficial effects of albumin. J Crit Care 35: 161–167. 10.1016/j.jcrc.2016.04.019 [DOI] [PubMed] [Google Scholar]
  • 4.Bui AL, Horwich TB, Fonarow GC (2011) Epidemiology and risk profile of heart failure. Nat Rev Cardiol 8: 30–41. 10.1038/nrcardio.2010.165 [DOI] [PMC free article] [PubMed] [Google Scholar]
  • 5.Drexler H, Munzel T, Riede U, Just H (1991) Adaptive changes in the periphery and their therapeutic consequences. Am J Cardiol 67: 29C–34C; discussion 34C-35C. 10.1016/0002-9149(91)90073-t [DOI] [PubMed] [Google Scholar]
  • 6.Miller WL (2016) Fluid Volume Overload and Congestion in Heart Failure: Time to Reconsider Pathophysiology and How Volume Is Assessed. Circ Heart Fail 9: e002922 10.1161/CIRCHEARTFAILURE.115.002922 [DOI] [PubMed] [Google Scholar]
  • 7.Kalra PR, Anagnostopoulos C, Bolger AP, Coats AJ, Anker SD (2002) The regulation and measurement of plasma volume in heart failure. J Am Coll Cardiol 39: 1901–1908. 10.1016/s0735-1097(02)01903-4 [DOI] [PubMed] [Google Scholar]
  • 8.(1980) Recommended methods for measurement of red-cell and plasma volume: International Committee for Standardization in Haematology. J Nucl Med 21: 793–800. [PubMed] [Google Scholar]
  • 9.Binanay C, Califf RM, Hasselblad V, O’Connor CM, Shah MR, et al. (2005) Evaluation study of congestive heart failure and pulmonary artery catheterization effectiveness: the ESCAPE trial. JAMA 294: 1625–1633. 10.1001/jama.294.13.1625 [DOI] [PubMed] [Google Scholar]
  • 10.Duarte K, Monnez JM, Albuisson E, Pitt B, Zannad F, et al. (2015) Prognostic Value of Estimated Plasma Volume in Heart Failure. JACC Heart Fail 3: 886–893. 10.1016/j.jchf.2015.06.014 [DOI] [PubMed] [Google Scholar]
  • 11.Hudson SR, Chan D, Ng LL (2016) Change in plasma volume and prognosis in acute decompensated heart failure: an observational cohort study. J R Soc Med 109: 337–346. 10.1177/0141076816661316 [DOI] [PMC free article] [PubMed] [Google Scholar]
  • 12.Fudim M, Miller WL (2018) Calculated Estimates of Plasma Volume in Patients With Chronic Heart Failure-Comparison With Measured Volumes. J Card Fail 24: 553–560. 10.1016/j.cardfail.2018.07.462 [DOI] [PMC free article] [PubMed] [Google Scholar]
  • 13.Grodin JL, Philips S, Mullens W, Nijst P, Martens P, et al. (2019) Prognostic implications of plasma volume status estimates in heart failure with preserved ejection fraction: insights from TOPCAT. Eur J Heart Fail 21: 634–642. 10.1002/ejhf.1407 [DOI] [PubMed] [Google Scholar]
  • 14.Ling HZ, Flint J, Damgaard M, Bonfils PK, Cheng AS, et al. (2015) Calculated plasma volume status and prognosis in chronic heart failure. Eur J Heart Fail 17: 35–43. 10.1002/ejhf.193 [DOI] [PubMed] [Google Scholar]
  • 15.Maznyczka AM, Barakat MF, Ussen B, Kaura A, Abu-Own H, et al. (2019) Calculated plasma volume status and outcomes in patients undergoing coronary bypass graft surgery. Heart. [DOI] [PubMed] [Google Scholar]
  • 16.Yancy CW, Jessup M, Bozkurt B, Butler J, Casey DE Jr., et al. (2013) 2013 ACCF/AHA guideline for the management of heart failure: a report of the American College of Cardiology Foundation/American Heart Association Task Force on Practice Guidelines. J Am Coll Cardiol 62: e147–239. 10.1016/j.jacc.2013.05.019 [DOI] [PubMed] [Google Scholar]
  • 17.Otaki Y, Watanabe T, Konta T, Watanabe M, Fujimoto S, et al. (2018) Effect of Hypertension on Aortic Artery Disease-Related Mortality- 3.8-Year Nationwide Community-Based Prospective Cohort Study. Circ J 82: 2776–2782. 10.1253/circj.CJ-18-0721 [DOI] [PubMed] [Google Scholar]
  • 18.Martens P, Nijst P, Dupont M, Mullens W (2019) The Optimal Plasma Volume Status in Heart Failure in Relation to Clinical Outcome. J Card Fail 25: 240–248. 10.1016/j.cardfail.2018.11.019 [DOI] [PubMed] [Google Scholar]
  • 19.Haditsch B, Roessler A, Krisper P, Frisch H, Hinghofer-Szalkay HG, et al. (2015) Volume regulation and renal function at high altitude across gender. PLoS One 10: e0118730 10.1371/journal.pone.0118730 [DOI] [PMC free article] [PubMed] [Google Scholar]
  • 20.Patel S, Rauf A, Khan H, Abu-Izneid T (2017) Renin-angiotensin-aldosterone (RAAS): The ubiquitous system for homeostasis and pathologies. Biomed Pharmacother 94: 317–325. 10.1016/j.biopha.2017.07.091 [DOI] [PubMed] [Google Scholar]
  • 21.Wang L, Shao ZH (2018) [Relationship between anemia and clinical features and prognosis of advanced lung cancer patients]. Zhonghua Zhong Liu Za Zhi 40: 512–516. 10.3760/cma.j.issn.0253-3766.2018.07.006 [DOI] [PubMed] [Google Scholar]
  • 22.Zhang X, Zhang F, Qiao W, Zhao Z, Li M (2018) Low Hematocrit Is a Strong Predictor of Poor Prognosis in Lung Cancer Patients. Biomed Res Int 2018: 6804938 10.1155/2018/6804938 [DOI] [PMC free article] [PubMed] [Google Scholar]
  • 23.Packer M (1992) The neurohormonal hypothesis: a theory to explain the mechanism of disease progression in heart failure. J Am Coll Cardiol 20: 248–254. 10.1016/0735-1097(92)90167-l [DOI] [PubMed] [Google Scholar]
  • 24.Lambers Heerspink HJ, de Zeeuw D, Wie L, Leslie B, List J (2013) Dapagliflozin a glucose-regulating drug with diuretic properties in subjects with type 2 diabetes. Diabetes Obes Metab 15: 853–862. 10.1111/dom.12127 [DOI] [PMC free article] [PubMed] [Google Scholar]
  • 25.Sano M, Takei M, Shiraishi Y, Suzuki Y (2016) Increased Hematocrit During Sodium-Glucose Cotransporter 2 Inhibitor Therapy Indicates Recovery of Tubulointerstitial Function in Diabetic Kidneys. J Clin Med Res 8: 844–847. 10.14740/jocmr2760w [DOI] [PMC free article] [PubMed] [Google Scholar]

Decision Letter 0

Anderson Saranz Zago

14 May 2020

PONE-D-20-07641

Impact of Calculated Plasma Volume Status on All-cause and Cardiovascular Mortality: 4-year Nationwide Community-Based Prospective Cohort Study

PLOS ONE

Dear Tetsu Watanabe

Thank you for submitting your manuscript to PLOS ONE. After careful consideration, we feel that it has merit but does not fully meet PLOS ONE’s publication criteria as it currently stands. Therefore, we invite you to submit a revised version of the manuscript that addresses the points raised during the review process.

We would appreciate receiving your revised manuscript by may-23. When you are ready to submit your revision, log on to https://www.editorialmanager.com/pone/ and select the 'Submissions Needing Revision' folder to locate your manuscript file.

If you would like to make changes to your financial disclosure, please include your updated statement in your cover letter.

To enhance the reproducibility of your results, we recommend that if applicable you deposit your laboratory protocols in protocols.io, where a protocol can be assigned its own identifier (DOI) such that it can be cited independently in the future. For instructions see: http://journals.plos.org/plosone/s/submission-guidelines#loc-laboratory-protocols

Please include the following items when submitting your revised manuscript:

  • A rebuttal letter that responds to each point raised by the academic editor and reviewer(s). This letter should be uploaded as separate file and labeled 'Response to Reviewers'.

  • A marked-up copy of your manuscript that highlights changes made to the original version. This file should be uploaded as separate file and labeled 'Revised Manuscript with Track Changes'.

  • An unmarked version of your revised paper without tracked changes. This file should be uploaded as separate file and labeled 'Manuscript'.

Please note while forming your response, if your article is accepted, you may have the opportunity to make the peer review history publicly available. The record will include editor decision letters (with reviews) and your responses to reviewer comments. If eligible, we will contact you to opt in or out.

We look forward to receiving your revised manuscript.

Kind regards,

Anderson Saranz Zago, PhD

Academic Editor

PLOS ONE

Additional Editor Comments (if provided):

According to the opinion of the reviewers, the manuscript brings an interesting subject, however, it needs to be reviewed on several topics. After all these changes, the authors can resubmit the manuscript for a new evaluation.

Sincerely

Anderson Saranz Zago, PhD.

Academic editor

Journal requirements:

When submitting your revision, we need you to address these additional requirements:

1.    Please ensure that your manuscript meets PLOS ONE's style requirements, including those for file naming. The PLOS ONE style templates can be found at http://www.plosone.org/attachments/PLOSOne_formatting_sample_main_body.pdf and http://www.plosone.org/attachments/PLOSOne_formatting_sample_title_authors_affiliations.pdf

2. In ethics statement in the manuscript and in the online submission form, please provide additional information about the patient records/samples used in your retrospective study. Specifically, please ensure that you have discussed whether all data/samples were fully anonymized before you accessed them and/or whether the IRB or ethics committee waived the requirement for informed consent. If patients provided informed written consent to have data/samples from their medical records used in research, please include this information.

3. We noticed you have some minor occurrence(s) of overlapping text with the following previous publication(s), which needs to be addressed:

https://doi.org/10.1253/circj.CJ-18-0721

In your revision ensure you cite all your sources (including your own works), and quote or rephrase any duplicated text outside the Methods section. Further consideration is dependent on these concerns being addressed.

4. Thank you for including your ethics statement:  "All procedures performed in studies involving human participants were undertaken in accordance with the ethical, institutional, and/or national research committee guidelines of the centers at which the studies were conducted (Yamagata University, 2008, no. 103) and in compliance with the 1964 Helsinki declaration and its later amendments or comparable ethical standards." 

a.) Please amend your current ethics statement to include the full name of the ethics committee/institutional review board(s) that approved your specific study.

b.) Please amend your current ethics statement to confirm that your named institutional review board or ethics committee specifically approved this study.

Once you have amended this/these statement(s) in the Methods section of the manuscript, please add the same text to the “Ethics Statement” field of the submission form (via “Edit Submission”).

For additional information about PLOS ONE ethical requirements for human subjects research, please refer to " ext-link-type="uri" xlink:type="simple">http://journals.plos.org/plosone/s/submission-guidelines#loc-human-subjects-research."

5. PLOS requires an ORCID iD for the corresponding author in Editorial Manager on papers submitted after December 6th, 2016. Please ensure that you have an ORCID iD and that it is validated in Editorial Manager. To do this, go to ‘Update my Information’ (in the upper left-hand corner of the main menu), and click on the Fetch/Validate link next to the ORCID field. This will take you to the ORCID site and allow you to create a new iD or authenticate a pre-existing iD in Editorial Manager. Please see the following video for instructions on linking an ORCID iD to your Editorial Manager account: https://www.youtube.com/watch?v=_xcclfuvtxQ

6. Thank you for stating the following in the Acknowledgments Section of your manuscript:

"This work was supported by a Health and Labor Sciences Research Grant for Study on the design of the comprehensive health care system for chronic kidney disease (CKD) based on the individual risk assessment by Specific Health Check-up from the Ministry of Health, Labour and Welfare of Japan and a Grant-in-Aid for Research on Advanced Chronic Kidney Disease (REACH-J), Practical Research Project for Renal Disease from the Japan Agency for Medical Research and Development, AMED."

We note that you have provided funding information that is not currently declared in your Funding Statement. However, funding information should not appear in the Acknowledgments section or other areas of your manuscript. We will only publish funding information present in the Funding Statement section of the online submission form.

Please remove any funding-related text from the manuscript and let us know how you would like to update your Funding Statement. Currently, your Funding Statement reads as follows:

"The authors received no specific funding for this work."

7. Your ethics statement must appear in the Methods section of your manuscript. If your ethics statement is written in any section besides the Methods, please move it to the Methods section and delete it from any other section. Please also ensure that your ethics statement is included in your manuscript, as the ethics section of your online submission will not be published alongside your manuscript.

8. Please upload a new copy of Figure xxxx as the detail is not clear. Please follow the link for more information: https://blogs.plos.org/plos/2019/06/looking-good-tips-for-creating-your-plos-figures-graphics/

[Note: HTML markup is below. Please do not edit.]

Reviewers' comments:

Reviewer's Responses to Questions

Comments to the Author

1. Is the manuscript technically sound, and do the data support the conclusions?

The manuscript must describe a technically sound piece of scientific research with data that supports the conclusions. Experiments must have been conducted rigorously, with appropriate controls, replication, and sample sizes. The conclusions must be drawn appropriately based on the data presented.

Reviewer #1: No

Reviewer #2: Yes

**********

2. Has the statistical analysis been performed appropriately and rigorously?

Reviewer #1: Yes

Reviewer #2: Yes

**********

3. Have the authors made all data underlying the findings in their manuscript fully available?

The PLOS Data policy requires authors to make all data underlying the findings described in their manuscript fully available without restriction, with rare exception (please refer to the Data Availability Statement in the manuscript PDF file). The data should be provided as part of the manuscript or its supporting information, or deposited to a public repository. For example, in addition to summary statistics, the data points behind means, medians and variance measures should be available. If there are restrictions on publicly sharing data—e.g. participant privacy or use of data from a third party—those must be specified.

Reviewer #1: Yes

Reviewer #2: Yes

**********

4. Is the manuscript presented in an intelligible fashion and written in standard English?

PLOS ONE does not copyedit accepted manuscripts, so the language in submitted articles must be clear, correct, and unambiguous. Any typographical or grammatical errors should be corrected at revision, so please note any specific errors here.

Reviewer #1: Yes

Reviewer #2: Yes

**********

5. Review Comments to the Author

Please use the space provided to explain your answers to the questions above. You may also include additional comments for the author, including concerns about dual publication, research ethics, or publication ethics. (Please upload your review as an attachment if it exceeds 20,000 characters)

Reviewer #1: The present study aimed to examine whether PVS is a novel risk factor for all-cause and cardiovascular deaths in the general population. It's an interesting study due to the variety of factors that could be related to cardiovascular mortality. However, the topic should be better explored.

The introduction section is really poor. It's not clear the relationship between plasma volume and mortality. What are the physiological mechanism that can explain this relationship ?

Why PVS is associated with cardiac events and mortality in patients with heart failure ?

Why is this discussion important and what are the hypothesis of the study?

Methods. What changes is expected during the aging process in the PVS ? This answer can explain if the age range (40 to 74 years old) is too high (or not).

In the “definition of PVS” section it is not clear where the values reported comes from (Men: a = 1530; b = 41; 3; c = 39 / women, a = 864; b = 47.9; c = 40). No reference is cited.

Is the authors used some statistical model to define the PVS range (7 and -13.3) ?

Is it possible a negative plasma volume ? It should be better explained.

How blood pressure were measured ?

Endpoint and follow-up section - All subjects were prospectively followed for a period of 914,292 person-years. (???????? Period should be in years/months/days). Participants were followed for 4 years. However the table one present the subject characteristics of the first year. How about the others ?

The results were presented in a difficult way understand.

In the page 7 the authors comment: higher PVS - older and low risk / low PVS - younger and high risk. However, in page 8 and 9, high PVS was significantly associated with all-cause, cardiovascular and non-cardiovascular deaths / page 10 - low PVS was significantly associated with all-cause and cardiovascular deaths, but not non-cardiovascular deaths.

Which is better ? High or low ?

The legend of figures are really poor. What does it means each line in the graphic ?

The interpretation of the graphics are really difficult. The legends do not provide such informations.

The first paragraph of discussion section shows a summary of the results. However the follow explanation it's not clean to a complete understanding of the relationship between PVS and cardiovascular risk.

Reviewer #2: The study now submitted is of good technical quality, its design was well prepared, presents extreme originality and offers great contributions to the application in the clinical area, including: early diagnosis, prognosis, emergency care and choices in making therapeutic decisions.

In addition, for a prospective epidemiological study, the Japanese territorial coverage was quite significant, Including more distant areas such as Okinawa, but no less important than the central areas.

However, on this point I have my first question: why did the researchers not include parts north of Honshu Island, in the representative Tohoku region, between Aomori and Fukoshima?

The second issue concerns possible differences in PVS between higher altitude regions. As is well known, the plasma volume as well as the hematocrit may vary significantly between inhabitants of regions close to sea level and mountainous regions. This could interfere with the PVS values, the mean PVS obtained, over or underestimating mean values, as well as interfere with the inference of the analogies.

In the case of a Japanese archipelago with a wide variation in altitude, the authors do not point out such aspects, homogeneity or not of the altitude of the regions covered by the study and also what measures were taken to minimize possible errors.

Another important question is, why were the mean PVS values of a random sample obtained from healthy people in the same age group and distributed in the regions of the study not obtained?

Finally, how do the authors justify the absence of the inclusion of the state of physical fitness or regular practice of physical activity or sedentary sedentary lifestyle among the variables analyzed and associated with PLWHA and its variations, since the regular practice of physical activity is recognized and widely used in the treatment of heart patients?

Could its effects on the patient's clinical status and consequently on PLWHA not interfere in the discussion of the results?

**********

6. PLOS authors have the option to publish the peer review history of their article (what does this mean?). If published, this will include your full peer review and any attached files.

If you choose “no”, your identity will remain anonymous but your review may still be made public.

Do you want your identity to be public for this peer review? For information about this choice, including consent withdrawal, please see our Privacy Policy.

Reviewer #1: No

Reviewer #2: Yes: Cassiano Merussi Neiva

[NOTE: If reviewer comments were submitted as an attachment file, they will be attached to this email and accessible via the submission site. Please log into your account, locate the manuscript record, and check for the action link "View Attachments". If this link does not appear, there are no attachment files to be viewed.]

While revising your submission, please upload your figure files to the Preflight Analysis and Conversion Engine (PACE) digital diagnostic tool, https://pacev2.apexcovantage.com/. PACE helps ensure that figures meet PLOS requirements. To use PACE, you must first register as a user. Registration is free. Then, login and navigate to the UPLOAD tab, where you will find detailed instructions on how to use the tool. If you encounter any issues or have any questions when using PACE, please email us at figures@plos.org. Please note that Supporting Information files do not need this step.

PLoS One. 2020 Aug 20;15(8):e0237601. doi: 10.1371/journal.pone.0237601.r002

Author response to Decision Letter 0


22 May 2020

1. Is the manuscript technically sound, and do the data support the conclusions?

The manuscript must describe a technically sound piece of scientific research with data that supports the conclusions. Experiments must have been conducted rigorously, with appropriate controls, replication, and sample sizes. The conclusions must be drawn appropriately based on the data presented.

Reviewer #1: No

Reviewer #2: Yes

________________________________________

2. Has the statistical analysis been performed appropriately and rigorously?

Reviewer #1: Yes

Reviewer #2: Yes

________________________________________

3. Have the authors made all data underlying the findings in their manuscript fully available?

The PLOS Data policy requires authors to make all data underlying the findings described in their manuscript fully available without restriction, with rare exception (please refer to the Data Availability Statement in the manuscript PDF file). The data should be provided as part of the manuscript or its supporting information, or deposited to a public repository. For example, in addition to summary statistics, the data points behind means, medians and variance measures should be available. If there are restrictions on publicly sharing data—e.g. participant privacy or use of data from a third party—those must be specified.

Reviewer #1: Yes

Reviewer #2: Yes

________________________________________

4. Is the manuscript presented in an intelligible fashion and written in standard English?

PLOS ONE does not copyedit accepted manuscripts, so the language in submitted articles must be clear, correct, and unambiguous. Any typographical or grammatical errors should be corrected at revision, so please note any specific errors here.

Reviewer #1: Yes

Reviewer #2: Yes

________________________________________

5. Review Comments to the Author

Please use the space provided to explain your answers to the questions above. You may also include additional comments for the author, including concerns about dual publication, research ethics, or publication ethics. (Please upload your review as an attachment if it exceeds 20,000 characters)

Reviewer #1: The present study aimed to examine whether PVS is a novel risk factor for all-cause and cardiovascular deaths in the general population. It's an interesting study due to the variety of factors that could be related to cardiovascular mortality. However, the topic should be better explored.

Q1. The introduction section is really poor. It's not clear the relationship between plasma volume and mortality. What are the physiological mechanism that can explain this relationship ? Why PVS is associated with cardiac events and mortality in patients with heart failure ? Why is this discussion important and what are the hypothesis of the study?

Answer to Q1. Thank you for your comments. We added the following sentences in Introduction section.

‘Heart failure remains a major and increasing public health problem, with a high mortality rate [4]. It was reported that imbalanced volume homeostasis causes systemic congestion and peripheral and pulmonary edema in heart failure [5]. Plasma volume expansion underlies systemic congestion, which is a well-known, clinically, and prognostically relevant complication of heart failure [6]. (Page 3, line 3)

‘American College of Cardiology/American Herat Association guidelines have recommended volume status be assessed [16]. (Page 3, line 15)’

‘Thus, we hypothesized that PVS may serve as an early identification of high-risk subjects for all-cause and cardiovascular deaths in the general population. (Page 3, line 18)’

Q2. Methods. What changes is expected during the aging process in the PVS ? This answer can explain if the age range (40 to 74 years old) is too high (or not).

Answer to Q2. Thank you for your question. To the best of our knowledge, there was no report regarding the relationship between aging and PVS. There was a negative correlation between aging and actual PV and ideal PV in the present study. On the other hand, there was a weak, but significant positive correlation between aging and PVS. These findings suggested that plasma volume may shift toward volume expansion with aging.

Q3. In the “definition of PVS” section it is not clear where the values reported comes from (Men: a = 1530; b = 41; 3; c = 39 / women, a = 864; b = 47.9; c = 40). No reference is cited.

Answer to Q3. Thank you for your suggestion. We added the citations.

Q4 Is the authors used some statistical model to define the PVS range (7 and -13.3) ?

Is it possible a negative plasma volume ? It should be better explained.

Answer to Q4. PVS is an index calculated by the following equation: (actual PV-ideal PV)/ideal PV, but not an estimated plasma volume itself. In TOPCAT study, PVS was reported to be less than 0 in 91% of heart failure patients (European Journal of Heart Failure. 2019; 21: 634-642).

Normal range of PVS has not been defined yet. In this study, we defined abnormally high and low PVS as PVS ≥ 7 and -13.3, respectively, based on the results for 80% of all subjects.

We added the following sentences in Method section

‘Since aPV is often under iPV, the value of PVS could become less than 0. In the Treatment of Preserved Cardiac Function Heart Failure with an Aldosterone Antagonist Trial (TOPCAT) study, PVS was reported to be less than 0 in 91% of heart failure patients [13]. High and low PVS are considered as plasma volume expansion and contraction, respectively. (Page 7, line 8)’

Q5. How blood pressure were measured ?

Answer to Q5. Thank you for your question. We added the following sentence.

‘Blood pressure was measured the following method [17]. Participants were seated with back supports. After resting for at least 5 minutes, blood pressure was measured 2 times without conversation. Blood pressure was determined by an average of 2 blood pressure readings. (Page 6, line 12)

Q6. Endpoint and follow-up section - All subjects were prospectively followed for a period of 914,292 person-years. (???????? Period should be in years/months/days). Participants were followed for 4 years. However the table one present the subject characteristics of the first year. How about the others ?

Answer to Q6. As you pointed out, we rewrote the follow up period as follows. Since the purpose of the present study was to examine whether baseline PVS can predict clinical outcome in the general population, we showed the baseline characteristics in study subjects in Table 1.

‘All subjects were prospectively followed for a median follow up period of 4 years (interquartile range, 2.9-5.2 years; longest follow up, 7 years). (Page 8, line 1)

Q7. The results were presented in a difficult way understand.

In the page 7 the authors comment: higher PVS - older and low risk / low PVS - younger and high risk. However, in page 8 and 9, high PVS was significantly associated with all-cause, cardiovascular and non-cardiovascular deaths / page 10 - low PVS was significantly associated with all-cause and cardiovascular deaths, but not non-cardiovascular deaths.

Which is better ? High or low ?

Answer to Q7. High and low PVS mean imbalanced plasma volume in the general population. We considered the optimal PVS is associated with favor clinical outcome in the general population.

Q8. The legend of figures are really poor. What does it means each line in the graphic ? The interpretation of the graphics are really difficult. The legends do not provide such informations.

Answer to Q8. According to your comments, we modified figure legend.

‘We collected data from 230,989 subjects (aged 40–74 years) who participated in the health check-ups of 2008–2011. Among them, 107 were excluded from this study due to lack of essential data. During the median follow-up period of four years, there were 586 cardiovascular deaths, 2,552 non-cardiovascular deaths, and 3,138 all-cause deaths. (Page 20, line 2)’

‘Solid line shows the hazard ratios for subject groups stratified by 1% increments of PVS. Dotted lines show the 95% confidence interval for subjects stratified by 1% increments of PVS. Orange bar shows the distribution of study subjects. The referent group was defined as the lowest risk group. *P0.05 v.s. referent group. (Page 20, line 7)

‘Green, red, and blue lines show the survival curves for high, normal, and low PVS groups, respectively. (Page 20, line 13)

Q9. The first paragraph of discussion section shows a summary of the results. However the follow explanation it's not clean to a complete understanding of the relationship between PVS and cardiovascular risk.

Answer to Q9. Thank you for your comments. We added the following sentences in Discussion section.

‘These findings indicated that imbalanced PVS may contribute to the development of cardiovascular disease. (Page 16, line 11)’

‘Potential explanation is that volume overload caused by plasma volume expansion may exacerbate cardiac function [6]. (Page 17, line 15)’ 

Reviewer #2: The study now submitted is of good technical quality, its design was well prepared, presents extreme originality and offers great contributions to the application in the clinical area, including: early diagnosis, prognosis, emergency care and choices in making therapeutic decisions.

Q1. In addition, for a prospective epidemiological study, the Japanese territorial coverage was quite significant, Including more distant areas such as Okinawa, but no less important than the central areas.

However, on this point I have my first question: why did the researchers not include parts north of Honshu Island, in the representative Tohoku region, between Aomori and Fukoshima?

Answer to Q1. Thank you for your question. Since we suffered from great earthquake in Tohoku region during study period, we could not obtain the follow-up data in this region unfortunately.

Q2. The second issue concerns possible differences in PVS between higher altitude regions. As is well known, the plasma volume as well as the hematocrit may vary significantly between inhabitants of regions close to sea level and mountainous regions. This could interfere with the PVS values, the mean PVS obtained, over or underestimating mean values, as well as interfere with the inference of the analogies.

In the case of a Japanese archipelago with a wide variation in altitude, the authors do not point out such aspects, homogeneity or not of the altitude of the regions covered by the study and also what measures were taken to minimize possible errors.

Answer to Q2. Thank you for your expertized question. We checked the residential area altitude. It ranged from sea level 31 m in Saitama to 644 m in Nagano. We found that there was a significant difference in PVS among region areas. Therefore, we added region area in multivariate analysis and calculation of C indices, NRI and IDI in order to adjust regional difference. PVS was still significantly associated with clinical outcomes and improved the prediction. We modified table 1, 2, and 3 and added the following sentences.

‘These prefectures were divided into four region areas; Hokkaido and Tohoku; Kanto and Koshinetsu; Kinki, Shikoku, and Chugoku; and Kyushu and Okinawa. (Page 6, line 5)

‘It was reported that high altitude affects volume status and its regulator hormone secretion [17], indicating the region difference in PVS. There was a significant difference in the prevalence of high and low PVS among region areas. (Page 11, line 20)’

Q3. Another important question is, why were the mean PVS values of a random sample obtained from healthy people in the same age group and distributed in the regions of the study not obtained?

Answer to Q3. Thank you for your comments. Since our study subjects were participants of health checkup, they were mainly apparently healthy subjects. Thus, we provide the data about PVS in healthy subjects.

Q4. Finally, how do the authors justify the absence of the inclusion of the state of physical fitness or regular practice of physical activity or sedentary sedentary lifestyle among the variables analyzed and associated with PLWHA and its variations, since the regular practice of physical activity is recognized and widely used in the treatment of heart patients? Could its effects on the patient's clinical status and consequently on PLWHA not interfere in the discussion of the results?

Answer to Q4. Thank you for your suggestion. Unfortunately, we do not have the data about physical activity. Thus, we added the following sentence in Limitation section.

‘Finally, we do not have the data about physical activity, which may affect the future cardiovascular deaths. (Page 18, line 18)

________________________________________

6. PLOS authors have the option to publish the peer review history of their article (what does this mean?). If published, this will include your full peer review and any attached files.

If you choose “no”, your identity will remain anonymous but your review may still be made public.

Do you want your identity to be public for this peer review? For information about this choice, including consent withdrawal, please see our Privacy Policy.

Reviewer #1: No

Reviewer #2: Yes: Cassiano Merussi Neiva

[NOTE: If reviewer comments were submitted as an attachment file, they will be attached to this email and accessible via the submission site. Please log into your account, locate the manuscript record, and check for the action link "View Attachments". If this link does not appear, there are no attachment files to be viewed.]

While revising your submission, please upload your figure files to the Preflight Analysis and Conversion Engine (PACE) digital diagnostic tool, https://pacev2.apexcovantage.com/. PACE helps ensure that figures meet PLOS requirements. To use PACE, you must first register as a user. Registration is free. Then, login and navigate to the UPLOAD tab, where you will find detailed instructions on how to use the tool. If you encounter any issues or have any questions when using PACE, please email us at figures@plos.org. Please note that Supporting Information files do not need this step.

Attachment

Submitted filename: Response to Reviewers.docx

Decision Letter 1

Anderson Saranz Zago

1 Jul 2020

PONE-D-20-07641R1

Impact of Calculated Plasma Volume Status on All-cause and Cardiovascular Mortality: 4-year Nationwide Community-Based Prospective Cohort Study

PLOS ONE

Dear Dr. Tetsu Watanabe

Thank you for submitting your manuscript to PLOS ONE. After careful consideration, we feel that it has merit but does not fully meet PLOS ONE’s publication criteria as it currently stands. Therefore, we invite you to submit a revised version of the manuscript that addresses the points raised during the review process.

As you can see both reviewer pointed that all comment were addressed. However, one of them made a comment about the legend of figure 1.

Please submit your revised manuscript by July 06th. If you will need more time than this to complete your revisions, please reply to this message or contact the journal office at plosone@plos.org. When you're ready to submit your revision, log on to https://www.editorialmanager.com/pone/ and select the 'Submissions Needing Revision' folder to locate your manuscript file.

Please include the following items when submitting your revised manuscript:

  • A rebuttal letter that responds to each point raised by the academic editor and reviewer(s). You should upload this letter as a separate file labeled 'Response to Reviewers'.

  • A marked-up copy of your manuscript that highlights changes made to the original version. You should upload this as a separate file labeled 'Revised Manuscript with Track Changes'.

  • An unmarked version of your revised paper without tracked changes. You should upload this as a separate file labeled 'Manuscript'.

If you would like to make changes to your financial disclosure, please include your updated statement in your cover letter. Guidelines for resubmitting your figure files are available below the reviewer comments at the end of this letter.

If applicable, we recommend that you deposit your laboratory protocols in protocols.io to enhance the reproducibility of your results. Protocols.io assigns your protocol its own identifier (DOI) so that it can be cited independently in the future. For instructions see: http://journals.plos.org/plosone/s/submission-guidelines#loc-laboratory-protocols

We look forward to receiving your revised manuscript.

Kind regards,

Anderson Saranz Zago, PhD

Academic Editor

PLOS ONE

Additional Editor Comments (if provided):

Both reviewer pointed that all comment were addressed. However, one of them made a comment about the legend of figure 1.

After all these changes, you can resubmit the manuscript for the final decision.

[Note: HTML markup is below. Please do not edit.]

Reviewers' comments:

Reviewer's Responses to Questions

Comments to the Author

1. If the authors have adequately addressed your comments raised in a previous round of review and you feel that this manuscript is now acceptable for publication, you may indicate that here to bypass the “Comments to the Author” section, enter your conflict of interest statement in the “Confidential to Editor” section, and submit your "Accept" recommendation.

Reviewer #1: All comments have been addressed

Reviewer #2: All comments have been addressed

**********

2. Is the manuscript technically sound, and do the data support the conclusions?

The manuscript must describe a technically sound piece of scientific research with data that supports the conclusions. Experiments must have been conducted rigorously, with appropriate controls, replication, and sample sizes. The conclusions must be drawn appropriately based on the data presented.

Reviewer #1: Yes

Reviewer #2: Yes

**********

3. Has the statistical analysis been performed appropriately and rigorously?

Reviewer #1: Yes

Reviewer #2: Yes

**********

4. Have the authors made all data underlying the findings in their manuscript fully available?

The PLOS Data policy requires authors to make all data underlying the findings described in their manuscript fully available without restriction, with rare exception (please refer to the Data Availability Statement in the manuscript PDF file). The data should be provided as part of the manuscript or its supporting information, or deposited to a public repository. For example, in addition to summary statistics, the data points behind means, medians and variance measures should be available. If there are restrictions on publicly sharing data—e.g. participant privacy or use of data from a third party—those must be specified.

Reviewer #1: Yes

Reviewer #2: Yes

**********

5. Is the manuscript presented in an intelligible fashion and written in standard English?

PLOS ONE does not copyedit accepted manuscripts, so the language in submitted articles must be clear, correct, and unambiguous. Any typographical or grammatical errors should be corrected at revision, so please note any specific errors here.

Reviewer #1: Yes

Reviewer #2: Yes

**********

6. Review Comments to the Author

Please use the space provided to explain your answers to the questions above. You may also include additional comments for the author, including concerns about dual publication, research ethics, or publication ethics. (Please upload your review as an attachment if it exceeds 20,000 characters)

Reviewer #1: The manuscript has substantially improved after review. It can be observed that all comments have been addressed. However, I would make a last suggestion, given the changes made in the legend of the figures.

In the legend of figure 1, the authors included the following sentence: “We collected data from 230,989 subjects (aged 40–74 years) who participated in the health check-ups of 2008–2011. Among them, 107 were excluded from this study due to lack of essential data. During the median follow-up period of four years, there were 586 cardiovascular deaths, 2,552 non-cardiovascular deaths, and 3,138 all-cause deaths” This sentence should not be included in the legend since it represent a description and it is already included in the study population section.

Reviewer #2: I have no further questions and consider that the authors have answered satisfactorily the questions asked previously, as well as the suggested corrections.

**********

7. PLOS authors have the option to publish the peer review history of their article (what does this mean?). If published, this will include your full peer review and any attached files.

If you choose “no”, your identity will remain anonymous but your review may still be made public.

Do you want your identity to be public for this peer review? For information about this choice, including consent withdrawal, please see our Privacy Policy.

Reviewer #1: Yes: Anderson Saranz Zago

Reviewer #2: Yes: Cassiano Merussi Neiva

[NOTE: If reviewer comments were submitted as an attachment file, they will be attached to this email and accessible via the submission site. Please log into your account, locate the manuscript record, and check for the action link "View Attachments". If this link does not appear, there are no attachment files.]

While revising your submission, please upload your figure files to the Preflight Analysis and Conversion Engine (PACE) digital diagnostic tool, https://pacev2.apexcovantage.com/. PACE helps ensure that figures meet PLOS requirements. To use PACE, you must first register as a user. Registration is free. Then, login and navigate to the UPLOAD tab, where you will find detailed instructions on how to use the tool. If you encounter any issues or have any questions when using PACE, please email PLOS at figures@plos.org. Please note that Supporting Information files do not need this step.

PLoS One. 2020 Aug 20;15(8):e0237601. doi: 10.1371/journal.pone.0237601.r004

Author response to Decision Letter 1


2 Jul 2020

Comments to the Author

1. If the authors have adequately addressed your comments raised in a previous round of review and you feel that this manuscript is now acceptable for publication, you may indicate that here to bypass the “Comments to the Author” section, enter your conflict of interest statement in the “Confidential to Editor” section, and submit your "Accept" recommendation.

Reviewer #1: All comments have been addressed

Reviewer #2: All comments have been addressed

________________________________________

2. Is the manuscript technically sound, and do the data support the conclusions?

The manuscript must describe a technically sound piece of scientific research with data that supports the conclusions. Experiments must have been conducted rigorously, with appropriate controls, replication, and sample sizes. The conclusions must be drawn appropriately based on the data presented.

Reviewer #1: Yes

Reviewer #2: Yes

________________________________________

3. Has the statistical analysis been performed appropriately and rigorously?

Reviewer #1: Yes

Reviewer #2: Yes

________________________________________

4. Have the authors made all data underlying the findings in their manuscript fully available?

The PLOS Data policy requires authors to make all data underlying the findings described in their manuscript fully available without restriction, with rare exception (please refer to the Data Availability Statement in the manuscript PDF file). The data should be provided as part of the manuscript or its supporting information, or deposited to a public repository. For example, in addition to summary statistics, the data points behind means, medians and variance measures should be available. If there are restrictions on publicly sharing data—e.g. participant privacy or use of data from a third party—those must be specified.

Reviewer #1: Yes

Reviewer #2: Yes

________________________________________

5. Is the manuscript presented in an intelligible fashion and written in standard English?

PLOS ONE does not copyedit accepted manuscripts, so the language in submitted articles must be clear, correct, and unambiguous. Any typographical or grammatical errors should be corrected at revision, so please note any specific errors here.

Reviewer #1: Yes

Reviewer #2: Yes

________________________________________

6. Review Comments to the Author

Please use the space provided to explain your answers to the questions above. You may also include additional comments for the author, including concerns about dual publication, research ethics, or publication ethics. (Please upload your review as an attachment if it exceeds 20,000 characters)

Reviewer #1: The manuscript has substantially improved after review. It can be observed that all comments have been addressed. However, I would make a last suggestion, given the changes made in the legend of the figures.

In the legend of figure 1, the authors included the following sentence: “We collected data from 230,989 subjects (aged 40–74 years) who participated in the health check-ups of 2008–2011. Among them, 107 were excluded from this study due to lack of essential data. During the median follow-up period of four years, there were 586 cardiovascular deaths, 2,552 non-cardiovascular deaths, and 3,138 all-cause deaths” This sentence should not be included in the legend since it represent a description and it is already included in the study population section.

Answer to Q1. According to your suggestion, we deleted it. We express our sincere thanks to your effort.

Reviewer #2: I have no further questions and consider that the authors have answered satisfactorily the questions asked previously, as well as the suggested corrections.

Answer to Reviewer #2. We express our sincere thanks to your effort.________________________________________

7. PLOS authors have the option to publish the peer review history of their article (what does this mean?). If published, this will include your full peer review and any attached files.

If you choose “no”, your identity will remain anonymous but your review may still be made public.

Do you want your identity to be public for this peer review? For information about this choice, including consent withdrawal, please see our Privacy Policy.

Reviewer #1: Yes: Anderson Saranz Zago

Reviewer #2: Yes: Cassiano Merussi Neiva

Attachment

Submitted filename: Response to Reviewers.docx

Decision Letter 2

Anderson Saranz Zago

30 Jul 2020

Impact of Calculated Plasma Volume Status on All-cause and Cardiovascular Mortality: 4-year Nationwide Community-Based Prospective Cohort Study

PONE-D-20-07641R2

Dear Dr. Watanabe,

We’re pleased to inform you that your manuscript has been judged scientifically suitable for publication and will be formally accepted for publication once it meets all outstanding technical requirements.

Within one week, you’ll receive an e-mail detailing the required amendments. When these have been addressed, you’ll receive a formal acceptance letter and your manuscript will be scheduled for publication.

An invoice for payment will follow shortly after the formal acceptance. To ensure an efficient process, please log into Editorial Manager at http://www.editorialmanager.com/pone/, click the 'Update My Information' link at the top of the page, and double check that your user information is up-to-date. If you have any billing related questions, please contact our Author Billing department directly at authorbilling@plos.org.

If your institution or institutions have a press office, please notify them about your upcoming paper to help maximize its impact. If they’ll be preparing press materials, please inform our press team as soon as possible -- no later than 48 hours after receiving the formal acceptance. Your manuscript will remain under strict press embargo until 2 pm Eastern Time on the date of publication. For more information, please contact onepress@plos.org.

Kind regards,

Anderson Saranz Zago, PhD

Academic Editor

PLOS ONE

Additional Editor Comments (optional):

I am pleased to inform you that your manuscript has been deemed suitable for publication in PLOS ONE. Congratulations!

Sincerely

Reviewers' comments:

Reviewer's Responses to Questions

Comments to the Author

1. If the authors have adequately addressed your comments raised in a previous round of review and you feel that this manuscript is now acceptable for publication, you may indicate that here to bypass the “Comments to the Author” section, enter your conflict of interest statement in the “Confidential to Editor” section, and submit your "Accept" recommendation.

Reviewer #1: All comments have been addressed

**********

2. Is the manuscript technically sound, and do the data support the conclusions?

The manuscript must describe a technically sound piece of scientific research with data that supports the conclusions. Experiments must have been conducted rigorously, with appropriate controls, replication, and sample sizes. The conclusions must be drawn appropriately based on the data presented.

Reviewer #1: Yes

**********

3. Has the statistical analysis been performed appropriately and rigorously?

Reviewer #1: Yes

**********

4. Have the authors made all data underlying the findings in their manuscript fully available?

The PLOS Data policy requires authors to make all data underlying the findings described in their manuscript fully available without restriction, with rare exception (please refer to the Data Availability Statement in the manuscript PDF file). The data should be provided as part of the manuscript or its supporting information, or deposited to a public repository. For example, in addition to summary statistics, the data points behind means, medians and variance measures should be available. If there are restrictions on publicly sharing data—e.g. participant privacy or use of data from a third party—those must be specified.

Reviewer #1: Yes

**********

5. Is the manuscript presented in an intelligible fashion and written in standard English?

PLOS ONE does not copyedit accepted manuscripts, so the language in submitted articles must be clear, correct, and unambiguous. Any typographical or grammatical errors should be corrected at revision, so please note any specific errors here.

Reviewer #1: Yes

**********

6. Review Comments to the Author

Please use the space provided to explain your answers to the questions above. You may also include additional comments for the author, including concerns about dual publication, research ethics, or publication ethics. (Please upload your review as an attachment if it exceeds 20,000 characters)

Reviewer #1: (No Response)

**********

7. PLOS authors have the option to publish the peer review history of their article (what does this mean?). If published, this will include your full peer review and any attached files.

If you choose “no”, your identity will remain anonymous but your review may still be made public.

Do you want your identity to be public for this peer review? For information about this choice, including consent withdrawal, please see our Privacy Policy.

Reviewer #1: Yes: Anderson Saranz Zagp

Acceptance letter

Anderson Saranz Zago

4 Aug 2020

PONE-D-20-07641R2

Impact of Calculated Plasma Volume Status on All-cause and Cardiovascular Mortality: 4-year Nationwide Community-Based Prospective Cohort Study

Dear Dr. Watanabe:

I'm pleased to inform you that your manuscript has been deemed suitable for publication in PLOS ONE. Congratulations! Your manuscript is now with our production department.

If your institution or institutions have a press office, please let them know about your upcoming paper now to help maximize its impact. If they'll be preparing press materials, please inform our press team within the next 48 hours. Your manuscript will remain under strict press embargo until 2 pm Eastern Time on the date of publication. For more information please contact onepress@plos.org.

If we can help with anything else, please email us at plosone@plos.org.

Thank you for submitting your work to PLOS ONE and supporting open access.

Kind regards,

PLOS ONE Editorial Office Staff

on behalf of

Dr. Anderson Saranz Zago

Academic Editor

PLOS ONE

Associated Data

    This section collects any data citations, data availability statements, or supplementary materials included in this article.

    Supplementary Materials

    Attachment

    Submitted filename: Response to Reviewers.docx

    Attachment

    Submitted filename: Response to Reviewers.docx

    Data Availability Statement

    Data cannot be shared publicly due to ethical restrictions on sharing data publicly. The protocol of this project (Research on the Positioning of Chronic Kidney Disease in Specific Health Check and Guidance in Japan) determined that analytical data were distributed only to the members of steering committee because the data contain potentially identifying information. Data are available upon requestfrom the Department of Chronic Kidney Disease Initiatives; Fukushima Medical University School of Medicine; 1-Hikarigaoka, Fukushima 960-1295, Japan; Phone & Fax: +81-24-547-1898; E-mail dckdi@fmu.ac.jp.


    Articles from PLoS ONE are provided here courtesy of PLOS

    RESOURCES