

Abstract
Purpose:
Targeted radiation therapy has seen an increased interest in the past decade. In vitro and in vivo experiments showed enhanced radiation doses due to gold nanoparticles (GNPs) to tumors in mice and demonstrated a high potential for clinical application. However, finding a functionalized molecular formulation for actively targeting GNPs in tumor cells is challenging. Furthermore, the enhanced energy deposition by secondary electrons around GNPs, particularly by short-ranged Auger electrons is difficult to measure. Computational models, such as Monte Carlo (MC) radiation transport codes, have been used to estimate the physical quantities and effects of GNPs. However, as these codes differ from one to another, the reliability of physical and dosimetric quantities needs to be established at cellular and molecular levels, so that the subsequent biological effects can be assessed quantitatively.
Methods:
In this work, irradiation of single GNPs of 50 nm and 100 nm diameter by x-ray spectra generated by 50 and 100 peak kilovoltages was simulated for a defined geometry setup, by applying multiple MC codes in the EURADOS framework.
Results:
The mean dose enhancement ratio of the first 10 nm-thick water shell around a 100 nm GNP ranges from 400 for 100 kVp x-rays to 600 for 50 kVp x-rays with large uncertainty factors up to 2.3.
Conclusions:
It is concluded that the absolute dose enhancement effects have large uncertainties and need an inter-code intercomparison for a high quality assurance; relative properties may be a better measure until more experimental data is available to constrain the models.
Keywords: Gold nanoparticles, dose enhancement, x-rays, targeted radiotherapy
1. Introduction
1.1. Motivation and background
Four types of radiation beams are generally used for therapeutic purposes: photon beams produced by x-ray tubes with acceleration voltages in the range of 50 to 300 kV; large radioactive sources such as 60Co (gamma photons of 1.17 MeV and 1.33 MeV) contained in therapy units; megavoltage x-rays produced by electron linear accelerators and beams of protons and heavier charged particles accelerated by cyclotrons or synchrotrons [1]. In the therapeutic application of ionizing radiation for cancer treatment, there is a need to reduce the radiation dose delivered to normal tissues of the patient, while keeping or even enhancing the therapeutic dose to the tumor at the same time, so that the risk of developing toxic side effects can be reduced [2]. Among many novel techniques, a very promising approach to achieve this aim is to use radiosensitizers, which are defined as substances that make tumor cells more sensitive to radiation-induced cell killing, without changing the sensitivity of cells in healthy tissues.
In this context, nanoparticles made of high-Z materials have been investigated as potential radiosensitizers [3]. Due to their presumed biocompatibility, their strong photoelectric absorption coefficient, and the emission of Auger and Coster–Kronig (C-K) electrons, gold nanoparticles (GNPs) (Z=79) have been extensively investigated for several years as possible agents for a selective amplification of the radiation dose in tumors [4]. This concept is known as “gold nanoparticle assisted radiation therapy” (GNRT) [5–9]. The first successful experiment using GNPs to increase the radiosensitivity of tumors in mice irradiated by x-rays [10] stimulated extended investigations, by experiments [11–17] and computational Monte Carlo (MC) simulations, into the effects of GNPs when using different types of radiation such as kilovoltage x-rays [18–29], megavoltage x-rays, protons and heavy ions [30–32]. The sensitization of cells by GNPs is strongly dependent on the particle type and energy spectrum of the incident radiation. In this work, we performed a computational exercise focusing on photon spectra of kilovoltage x-rays.
This radiosensitization effect may result from the enhanced energy deposition in the vicinity, up to tens of nanometers of the GNPs. As the enhancement is extremely localized, a selective uptake of GNPs into tumor cells is required. To reach a high concentration of GNPs targeted in the cancer cells, a targeting antibody is needed to transfer GNPs into the cells, the cytoplasm or into the cell nucleus. The antibody cmHsp70.1 can, for instance, be conjugated with GNPs and accumulate them into breast cancer cells [33, 34]. When irradiating cancer cells loaded with GNPs by x-rays, the enhanced radiation dose can destroy the cell membrane [35], mitochondria [36] and even the DNA [37] and consequently kill the cancer cells. As this effect occurs near the GNPs, the surrounding healthy cells and tissues are preserved. Many factors, e.g. the shape, size and uptake of GNPs as well as the type of cell line, influence the biodistribution of GNPs inside cells and subsequently affect the dose enhancement and biological outcome, e.g. cell survival fraction, DNA damages and mice survival rate [11, 13, 30, 38]. For all these different biological endpoints will be altered in the presence of GNPs, the physical radiation doses must be reliably assessed to establish the dose–effect relationship in order to facilitate the use of GNPs in this new potential GNP-assisted radiotherapy modality.
The energies of the secondary and Auger electrons released from the interaction between gold and x-rays are relatively low, and the interaction cross sections in gold of these low energy electrons are subject to a large uncertainty. Many factors in serval aspects affect the dose enhancement effects simulated with different MC codes. The main factors are the different sizes of GNPs used and the different x-ray spectra. Furthermore, the presentation of the results can be influenced in terms of interaction events, energy depositions and absorbed doses. If the same code is used, various physical models and cross sections in the code can be applied by different modelers. Moreover, the interpretations of the physical doses to radiological effects can vary [18–20, 23–25, 27]. It is therefore mandatory to investigate the reliability of calculated dosimetric quantities. For quality assurance of physical radiation quantities in preclinical applications of GNPs, a project of intercomparison of these quantities was initiated by the European Radiation Dosimetry Group (EURADOS) [39] and was carried out by two task groups, the Micro- and Nanodosimetry Task Group of Working Group 6 (WG6) “Computational Dosimetry” [40] and the Internal Microdosimetry Task Group of Working Group 7 (WG7) “Internal Dosimetry” [41].
In this work, electron energy spectra and absorbed dose ratios in the immediate vicinity (nanometer ranges) and at larger distances (micrometer ranges) from GNPs, were simulated and compared by using different MC codes, namely Geant4/Geant4-DNA, TOPAS/TOPAS-nBio, PENELOPE, PARTRAC, NASIC, MDM and MCNP6. The exercise was performed by different research groups involved in the EURADOS network and other MC simulation labs from the USA and China by applying a simple geometry, where one single GNP was irradiated by pre-defined x-ray spectra. This is a study, which compares the results of different Monte Carlo codes, in order to assess which MC is more accurate, a comparison to experimental measurements would be required.
1.2. Physical interaction of x-rays with gold and liquid water
Photons interact with matter by three main processes [3, 42]: photoelectric absorption, Compton scattering and electron-positron pair production. In addition, a fourth process, elastic photon interaction, also known as Rayleigh scattering, is important at low energy (below 100 keV) especially for the high-Z materials, such as gold, and this interaction impacts the direction of propagation of the photons. Photoelectric absorption is the dominant interaction for photons of energies up to around 500 keV for high-Z atoms (Z=60–80) and the cross section strongly depends on the nuclear charge number Z of the atom and the photon energy E, like σ ∝ , with n ≅ 3–4. Compton scattering becomes the dominant interaction process with high-Z atoms as the photon energy becomes greater than 500 keV. The associated atomic cross section is proportional to Z. Electron-positron pair production happens for photon energy larger than 1.022 MeV and its cross section is proportional to Z2. Calculated cross sections for the processes in liquid water and gold are available from the database of NIST/XCOM [43] for use in combination with other database for quantifying the energy deposition in the investigated materials. Fig. 1 shows (a) the total mass attenuation coefficient of interactions of photons with liquid water and gold and (b) the ratio of the mass absorption coefficients of gold and liquid water. The ratio in Fig.1 (b) was calculated based on the interpolated cross sections retrieved from NIST/XCOM.
Fig.1.
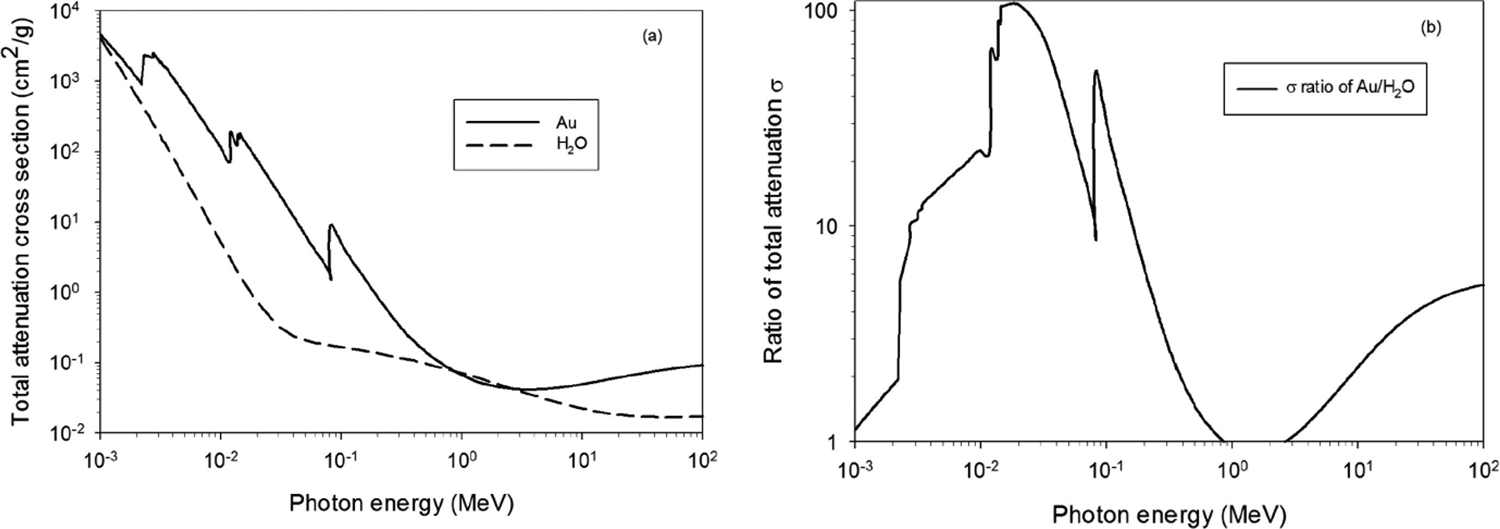
(a) Total attenuation cross section of the interaction of photons with liquid water (H2O) and gold (Au); (b) Ratio of total attenuation cross sections for photon interaction with gold (Au) and liquid water (H2O).
The dose enhancement around high-Z nanoparticles results from two main physical processes: photoelectrons emitted by photoelectric absorption of atoms in the high-Z nanoparticles and Auger electrons produced by the ensuing atomic de-excitation processes. A third process is also possible when x-ray fluorescence photons produce photoelectrons and Auger electrons. The kinetic energy of the photoelectron is the difference between the incident photon energy and the binding energy of the electron in the atomic shell. For photoelectric absorption, the ejected electron comes most predominantly from the innermost shell from which the photon can release an electron. For example, when a 100 keV photon interacts with a gold atom, the ejected electron is preferentially ejected from the K-shell (K-shell binding energy EK=80.8 keV), then the resulting kinetic energy of the photoelectron is about 19.2 keV [42]. This secondary electron has a range in liquid water of about 10 μm [44]. A core-shell excited atom can be de-excited by emission of Auger electrons or characteristic x-rays. The emission of Auger electrons is dominated by outer shells, e.g. M- and N-shell for gold, with a total probability of 98.5% [3] (data from ENDF database explorer: https://www-nds.iaea.org/exfor/). These Auger electrons have mostly low energies in the order of a few hundred eV. For the M shell, about 33% of Auger electrons have energies between 100 eV and 200 eV and about 33% have higher energies, about 10% have energies in excess of 8 keV [3, 45]. These Auger electrons deposit their energies in the immediate vicinity of the GNP and contribute mostly to the dose enhancement effect.
Around the surface of smaller GNPs, the emission of multiple low-energy Auger electrons may result in a highly charged nanoparticle. Such a positively charged nanoparticle is highly reactive and may extract electrons from neighboring water and other biomolecules. This neutralization process can drive energy transfers and charge transfers [46], which are ultra-fast relaxation processes that may ionize surrounding molecules and produce slow electrons, thereby amplifying radiation damage beyond that predicted by Auger decay alone [47].
As mentioned by Kuncic and Lacombe [3], GNPs, irradiated by x-rays, can also de-excite via decay of surface plasmons, i.e. collective oscillations of free electrons on the surface of nanoparticles [48]. Following an excitation event such as a low-energy Coulomb collision, thermal equilibrium is eventually restored through electron-phonon interactions [49]. Equilibrium can be also recovered through recombination of thermalized electrons, whereas sub-excitation electrons can also undergo dissociative electron attachment to surrounding water and other biomolecules, causing further radiation-induced damage [50].
1.3. Physical interaction of electrons with gold and liquid water
The most dominant secondary particles produced in GNPs by photon impact are electrons (positrons). The possible interactions of electrons with the medium are elastic scattering, inelastic collisions and bremsstrahlung emission, furthermore, in the case of annihilation, positrons undergo annihilation [51, 52]. Energy of electrons is mainly transferred to matter through interaction of the electric field of moving electrons with electrons bound in atoms and molecules of the medium [42]. In the following, a short description of topic-related interactions, e.g. elastic scattering and inelastic collisions with matter for low and medium-energy electrons is presented. Elastic collision of electrons with kinetic energies larger than a few hundred eV can be described as scattering of the projectile by the electrostatic field of single target atom. The charge distribution of a target atom consists of the positively charged nucleus and the electron cloud. The density of atomic electrons can be calculated by using available Hartree-Fock codes [51]. Inelastic collisions are the dominant energy loss mechanism for electrons with intermediate and low energy in liquid water, as can be seen from the total inelastic cross section of electrons in liquid water [53]. These interactions lead to electronic excitation and ionizations. Electrons with residual energy lower than the ionization threshold (ca. 10 eV in water) lose energy by excitation of rotational, translational or vibrational modes of the molecular scatters [42, 51]. For interactions of electrons in gold, discrete physics models for electron transportation down to 10 eV have recently been implemented within the Geant4-DNA low energy extension of Geant4. Such models allow the investigation of GNP effects at the nanoscale [54, 55]. For practical MC radiation transport simulations, elastic scattering, excitation and ionization cross sections for electrons were calculated for water vapor, liquid water and DNA molecular moiety to mimic the interactions of electrons in biological tissues [42, 53, 56–58].
2. Materials and methods
2.1. Simulated kilovoltage x-rays
The x-ray spectra used in this work were calculated by the program SpekCalc [59] simulating an x-ray tube with a tungsten target. The parameters used to produce the x-ray spectra are as follows:
Peak voltage (kVp): 50 and 100
Energy bin (keV): 0.5
Angle theta (degree): 20
Air thickness (mm): 470
Beryllium thickness (mm): 0.8
Aluminum thickness (mm): 3.9
Nf: 0.68
P: 0.33
The model parameters ‘Nf’ and ‘P’ in the GUI interface take the default values of 0.68 and 0.33 [60]. The former normalizes the overall fluence and can be used to match the output prediction to that of a particular x-ray tube, if desired. The latter is the ratio of the number of characteristic x-rays produced via electron impact ionization to that generated by bremsstrahlung interaction with the atomic nucleus; this ratio should not be changed without justification [59]. Two of these x-ray spectra, 50 kVp and 100 kVp, are shown in Fig. 2. They were implemented into different MC codes as radiation sources and were sampled as described in section 2.4.
Fig. 2.

X-ray spectra generated at (a) 50 kVp and (b) 100 kVp and were used as irradiation source in this work. The energy bin width of the x-axes is 500 eV.
2.2. Geometry setup
The simulation geometry is illustrated in Fig. 3. A single spherical GNP was positioned at the center of the simulation tracking volume consisting of liquid water. In this exercise, the GNP was assumed as pure gold (without coating and without any conjugation with an antibody). Two particle sizes in diameter of ∅ = 50 nm and ∅ = 100 nm were used in the simulations. This simple assumption of a pure gold particle facilitates the comparison of simulation results as it avoids effects of energy absorption in the coating and the antibody. The use of medium sized GNPs instead of very small GNP (1.9 nm of diameter) [10] allows a higher number of interaction events within the GNP.
Fig. 3.

Geometry setup in MC simulation. A single GNP with a diameter of 50 nm or 100 nm is situated in liquid water. Parallel x-rays, produced by an x-ray tube, are sampled from a planar circular area with a diameter of 10 nm larger than the diameter of the GNP and irradiate the GNP along the z-axis in a right-handed Cartesian reference frame. The distance between the center of planar circular x-ray source and the center of the single GNP is 100 μm. Energy deposition is scored in concentric spherical shells of thickness d around the GNP.
The GNP was irradiated by a plane-parallel x-ray beam, whose central axis was aligned to the center of the GNP. The x-ray beams were emitted from a circular plane source located at 100 μm away from the GNP center. The source diameter was set equal to the diameter of the GNP plus 10 nm in order to increase interaction probability of scattered x-rays with the GNP. To estimate the dose enhancement, simulations were also carried out with the same geometrical conditions but replacing the GNP with liquid water nanoparticle (WNP).
2.3. Monte Carlo simulation codes and physical input parameters
In Table 1, the MC codes and the versions used in this exercise are listed. In addition, the physical models, the cut-off energy, interaction cross sections of photons and electrons with liquid water and gold used in each code are presented. Computer operation systems and machine models are also shown. The information is relevant for searching and identifying potential influential factors, which can be attributed to the uncertainty of the calculated quantities.
Table 1.
Monte Carlo simulation codes used in this work and input parameters, number of incident particles, physical models used in programs and computer machines used.
| Modeler | Code name | Version | Incident photon number | Cut-off energy | Physics lists and options | Cross sectior library | Condensed history or track structure | Deexcitation | Computer Desktop/super | Computer running system | |||
|---|---|---|---|---|---|---|---|---|---|---|---|---|---|
| photon | electron | Photon | electron | Water | Gold | ||||||||
| PENELOPE#1 | PENELOPE | 2011 | 107 | 50 eV | 50 eV | Coherent and incoherent scattering, Photoelectric absorption, Pair production | Inner-shell impact ionization. | Penelope cross section library | Condensed history and limited track structure | Condensed history | X-ray fluorescence and Auger electrons from K – O1-5 shells and subshells | PC Intel Core i3-2120 CPU @3.30GHz | Windows 7 |
| PENELOPE#2 | PENELOPE | 2014 | 107 | 50 eV | 50 eV | Coherent and incoherent scattering, Photoelectric absorption, Pair production | Inner-shell impact ionization | Penelope cross section library | Condensed history and limited track structure | Condensed history | X-ray fluorescence and Auger electrons from K – O1-5 shells and subshells | PC Intel®Core(TM) i5-6300 U cpU@2.40 GHZ | Windows 7 |
| G4/DNA#1 | Geant4/DNA | 10.4.2 | 108 | 50 eV | 10 eV | Coherent and incoherent scattering, Photoelectric absorption, Pair production | Inner-shell impact ionization, excitation Attachment in Geant4-DNA default option for water | EEDL, EPDL and EADL1 | Track structure (Geant4-DNA) Default option and option 7 | Condensed history (Livermore) and multiple scattering | X-ray fluorescence and Auger electrons for KLM shells | PC Intel® Xeon ® CPU E5-2630 U3@2.40 GHz | Ubuntu 16.04 |
| G4/DNA#2 | Geant4/DNA | 10.0.5 | 107 | 990 eV | 10 eV | Geant4-DNA default physics for H2O | Geant4-DNA default physics for H2O | EEDL, EPDL and EADL | Track structure | Condensed history (Livermore) | Particle induced X-ray emission; complete Auger deexcitation | Virtual machine (VMware Player) ‘G4-10.05-CentOS7_us’ hosted on an ‘Intel®Core™ i7-3770 CPU@3.40 GHz’ computer containing 32 GB RAM | CentOS 7, hosted on Windows 7 Enterprise, 64-bit 6.1.7601, Service Pack 1 |
| G4/DNA#3 | Geant4/DNA | 10.4.2 | 109 | 10 eV | 10 eV | Geant4 EM standard physics option 4 for gold and Geant4-DNA default physics for water | Geant4 EM standard physics option 4 for gold and Geant4-DNA default physics for water | EEDL, EPDL and EADL | Track structure | Condensed history (Livermore) | Particle induces x-ray emission, Auger electrons from K-, L- and M- shells and Auger Cascades | PC Intel® Core i5-8500 CPU @4.10GHz Internal Linux-cluster | Windows 10 Ubuntu 16.04 |
| TOPAS | TOPAS-nBio | 3.1.p3 | 108 | 50 eV | 10 eV | Coherent and incoherent scattering, Photoelectric absorption, Pair production | Inner-shell impact ionization, excitation, attachment, Bremsstrahlung | EEDL, EPDL and EADL | Track structure (G4-DNA) | Condensed history (Livermore) | X-ray fluorescence and Auger electrons for KLM shells | ERISOne Linux Cluster | RHEL |
| MCNP6 | MCNP6.1 | 2013 | 108 | 1 keV | 50 eV | coherent and incoherent scattering, photoelectric absorption, and electron/positron pair production | atomic excitation, electron elastic scattering, subshell electro-ionization, and bremsstrahlung | ENDF/B VI.8 | singleevent method (similar to track structure) | single-event method (similar to track structure) | Relaxation considering as many as 29 subshells and can include almost 3,000 distinct transitions among them. | PC Intel Core i7-7700 CPU@3.60GHz | Windows 10 |
| MDM | MDM | 2006 (water) 2019 (gold) | 1014 | No explicit tracking of photons | Water: 7 eV Gold: 10 eV | Coherent and incoherent scattering | Water: Elastic scattering BEB Excitations (2 modes) Vibrations (9 modes). Gold: Inelastic: Plasmon excitation BEB Elastic: ELSEPA Phonons | Photons: NIST Auger: EADL | Track structure | Track structure | Full Auger electronic cascade (K to valence band) | Ran at the CCIN2P3 computing center | Linux CentOS 7.6.1810 |
| PARTRAC | PARTRAC | 2015 | >109 | 100 eV | (H20):10 eV (Au): 100 eV | Coherent and incoherent scattering, Photoelectric absorption | Ionization (H2O: 5 shells; Au: 13 shells and subshells), Excitation (H2O: 5 levels; Au: 1 level) | EPDL97, (photons) Dingfelder2 (electrons in H2O) Hantke3 (electrons in Au) | Track structure | Track structure | EADL library | PC Intel-Core i7-3770K CPU @ 3.50 GHz | Linux (openSUSE 12.3) |
| NASIC | NASIC | 2018 | 3×10⁸ | 10 eV | 10 eV | Compton scattering, photoelectric absorption, gamma conversion, Rayleigh scattering. | Water: elastic scattering, ionization, excitation, attachment, vibrational excitation. Gold: multiple scattering, ionization, bremsstrahlung. | Electron ionization and excitation in liquid water: NASIC cross section library. Others: Geant4 and Geant4-DNA cross section library. | Track structure | Condensed history | X-ray fluorescence and Auger electrons | PC Intel Core i5-7300HQ CPU @2.50GHz | Windows 10 |
EEDL - Evaluated Electrons Data Library; EPDL - Evaluated Photon Data Library; EADL - Evaluated Atomic Data Library.
Data from Dingfelder et al. [53]
Data not published
2.4. Calculation of physical quantities in the MC simulations
The x-ray spectra simulated for an x-ray tube with a tungsten target and 50 kV and 100 kV peak acceleration voltages are shown in Fig. 2. The cumulative spectra were read by each MC code. The cut-off energies for transport of photons and electrons were selected by modelers according to the cross sections provided in their MC codes. The geometry setup of GNPs and x-ray sources defined in this exercise were written in an input file and a geometry input file, respectively. To avoid complexity of data transfer, no phase space files were applied. Simplification of our simulations, i.e. single GNP, geometry setup and sampling of x-ray source leads to an unrealistic irradiation condition. As such, the dose enhancement calculated in this exercise might be overestimated (see the Discussion section). For simulating low energy electrons, the processes of inner-shell impact ionization in PENELOPE or Auger process in Geant4/Geant4-DNA were activated.
The dose enhancement ratio (DER) is defined as the ratio of the average energy deposited within a water shell resulting from x-ray irradiation with and without GNP in the center. The liquid water surrounding the GNP was divided into concentric shells of equal thickness as described in Fig. 3. Starting from the surface of the GNP, 50 water shells with an equal thickness of d = 1 μm were set as sensitive target volumes to mimic cellular targets. To study the DER in the nanometer range around the GNP, energy depositions in 100 water shells with an equal thickness of d = 10 nm next to the surface of GNP were scored as well. By doing so, a picture is obtained how the DER changes over a micrometer range from 1 to 50 μm and over a nanometer range from 10 to 1000 nm from the GNP surface. In addition to the energy deposition in the water shells, the energy fluence of secondary electrons and Auger electrons originating from the GNP were scored within the tracking volume for further analysis. In summary, the following quantities were presented: (1) spectra of secondary electrons escaping from the GNP and (2) DER for each shell in micrometer and nanometer ranges around GNP.
2.5. Uncertainty analysis of DER and energy spectra of secondary electrons
In addition, the uncertainty of the DER and energy spectra of secondary electrons as estimate according to the ISO Guide to the Expression of Uncertainty in Measurement (GUM) [61]. To do this, it is assumed that: (1) Different results reported by the participants are partially due, as shown in Table 1, to different parameter selection, cross-section libraries and modeling techniques, e.g. condensed history and track structure among others. (2) These factors are not biasing the results but rather lead to a scatter around the ‘true value’ of DER and electron energy spectra. However, the energy cutoff of Au can change the results of DER in particular very close region surrounding nanoparticle. (3) The values of DERs and energy spectra follow a lognormal distribution due to the large dispersion. (4) The reported results of DER and energy spectra from different participants are regarded as “results of a measurement” in a broader context, which is explained in the GUM (Scope 1.3).
A practical measure of uncertainty is the so-called expanded uncertainty [61]. The results of the measurement (here the DER values simulated with different codes) is then conveniently expressed as:
| (1) |
where: y is the best estimate of Y; u is the standard uncertainty and U is the expanded uncertainty, k is the coverage factor related to a certain confidence interval (CI), for instance 95%. If all sources of uncertainty have a normal distribution, then u is the combined standard deviation of the convolutions of these normal distributions and the coverage factor for 95% confidence interval is about 2. The expression in Eq. (1) can be interpreted to mean that the best estimate of the values attributable to the measurand Y is y. The range from y−U to y+U is an interval that may be expected to encompass a large fraction of the distribution of values that could be attributed to Y.
In our simulation experiments, the DER may be expected to have a lognormal distribution. Hence, it is advantageous to consider the transformed quantity Y = ln(ξ) as the measurand. Here ln is the natural logarithm and ξ = DER. Thus y = ln(ξ50th) and u = ln(σg) are obtained for each radial distance as the sample mean (ln(ξ50th)) and the sample standard deviation (ln(σg)) over the logarithms of the results of DER values of different codes. Then, we can express the upper and lower boundaries of the 95% CI of the DER as:
| (2) |
| (3) |
where ξ97.5th, ξ50th and ξ2.5th are the 97.5th, 50th and 2.5th percentiles of the lognormal distribution of the DER values; σg is the geometric standard deviation (GSD) of the lognormal distribution of the DER values.
From the difference of Eq.(2) and Eq.(3), one obtains: In(ξ97.5th) − In(ξ2.5th) = In(ξ97.5th/ξ2.5th) = 2kIn(σg), which can be written as: . The quantity is used as an uncertainty factor (UF) to express the dispersion of upper 97.5th and lower 2.5th percentiles from the geometric mean, i.e. the 50th percentile of the distribution of the DER values. With this the upper and lower limits can be easily obtained by multiplication or division of the geometric mean as usually used for a lognormal distribution for a 95% CI computation in nuclear safety, environmental risk and radiation dosimetry [62, 63].
Similar to the uncertainty analysis of DER, confidence intervals and UFs for electron spectra were determined. Before the analysis, for each x-ray spectrum and GNP size, the electron energy spectra calculated by different modelers were first interpolated such as to sort them on a common energy binning.
3. Results
In this section, the following simulated results are presented: (1) The DER in the 10 nm-thick shells located at 10 – 1000 nm and the DER in the 1 μm-thick shells located at 1 – 50 μm from the surface of a GNP with 50 nm and 100 nm diameter irradiated by 50 kVp and 100 kVp x-rays. (2) The energy spectra of secondary electrons, including Auger and K-C electrons escaping from the GNP for the two nanoparticle sizes and two x-ray spectra and (3) the quantitative uncertainty analysis of the DER and the electron energy spectra.
3.1. Dose enhancement ratio (DER) and uncertainty
3.1.1. DER in nanometer ranges
The results of DER in nanometer ranges for the GNP of two diameters of 50 nm and 100 nm, which were irradiated by the 50 kVp and 100 kVp x-ray spectra, are presented in Fig. 4. Here, “PENELOPE#1” and “PENELOPE#2” denote “PENELOPE-2011” and “PENELOPE-2014”, respectively. “G4/DNA” stands for Geant4/Geant4-DNA combination. “G4/DNA#1” “G4/DNA#2” and “G4/DNA#3” denote three participants who use Geant4/Geant4-DNA combination.
Fig. 4.

Dose enhancement ratio in 10 nm-thick shells as a function of distance from the surface of GNP irradiated by x-rays: (a) GNP of 50 nm diameter irradiated by 50 kVp x-rays; (b) GNP of 50 nm diameter irradiated by 100 kVp x-rays; (c) GNP of 100 nm diameter irradiated by 50 kVp x-rays; (d) GNP of 100 nm diameter irradiated by 100 kVp x-rays.
Overall, a GNP of 100 nm diameter irradiated by 50 kVp x-rays showed the largest DER values and a 50 nm GNP irradiated by 100 kVp the lowest DER values. For both GNP diameters the DER obtained for irradiation by 50 kVp x-rays are generally larger than for irradiation by 100 kVp x-rays. A 50 nm GNP irradiated by 50 kVp x-rays showed similar DER values as a 100 nm GNP irradiated by 100 kVp x-rays. For a 50 nm GNP, the mean DER of the first 10 nm-thick water shell is about 220 when irradiated by 50 kVp x-rays and about 180 when irradiated by 100 kVp x-rays. For a 100 nm GNP, the mean DER of the first 10 nm-thick water shell is about 600 when the GNP is irradiated by 50 kVp x-rays and 400 for irradiation by 100 kVp x-rays. For a 100 nm GNP irradiated by 50 kVp x-rays, the mean DER in water shells, which locate at 200 nm to 800 nm, is found to be nearly constant and is close to 100; however, if a GNP of 100 nm is irradiated by 100 kVp x-rays, the mean DER in water shell at these ranges is about 40 with a slight decrease down to 30 at the 1000 nm water shell. For a 50 nm GNP irradiated by 50 kVp x-rays, the mean DER at these locations is close to 40; however, when this GNP is irradiated by 100 kVp x-rays, the mean DER at these locations reaches only up to 20 with a slight decrease down to almost 10 at the 1000 nm water shell.
3.1.2. Uncertainty factor of DER in nanometer ranges
To quantify the variation of DER obtained by all participants, the 2.5th, 50th and 97.5th percentiles of the reported DERs were evaluated for all 10 nm-thick shells at different distances from the surface of the GNP (Fig. 5). It can be seen in Fig. 5 (a), (b), (c) and (d) that the UFs of DERs for the results are 1.6–2.3, 1.4–2.1, 1.4–2.3 and 1.4–2.3, respectively, with the maximum UF values occurring at the water shells located at 240 nm, 440 nm, 780 nm and 860 nm, respectively. The UFs at the first 10 nm-thick shells for the four radiation scenarios are relative small and close to 1.5.
Fig. 5.

The 2.5th, 50th and 97.5th percentiles of the different results reported for the DER at different distances from the nanoparticle surface for 50 nm and 100 nm diameter of GNP irradiated by 50 kVp and 100 kVp x-ray spectra.
As is seen from Fig.4, The results obtained by G4/DNA#1, G4/DNA#3, TOPAS, MDM, NASIC, MCNP6 are close to each other. The results of PARTRAC showed a slightly higher value of DER than the other values. On the contrary, it is observed that, the DERs calculated by PENELOPE codes are generally lower than those obtained by other codes. These differences indicate “systematic” rather than “statistical” uncertainties. For example, the UFs assessed for DERs calculated by PENELOPE are in the range of 1.2, much lower than the UF of about 2.3, calculated for all different codes (Fig. 5). The possible reasons of this difference were firstly investigated by comparison between Geant4/Geant4-DNA code with PENELOPE cross sections and PENELOPE. However, the use of the same cross sections cannot remove the difference of the DEF obtained by G4/DNA and PENELOPE. Some other possible reasons will be continually investigated and searched, especially from the applying PENELOPE code.
3.1.3. DER in micrometer ranges
Fig. 6 shows the DER in 1 μm-thick shells around the GNP surface in micrometer ranges for the two sizes of GNP irradiated by the 50 kVp and 100 kVp x-ray spectra. The variation of DER in the micrometer ranges shows a relatively smaller UF than that found in 10 nm-thick shells in nanometer ranges. The DER of the 100 nm diameter GNP is generally greater than that of the GNP with a 50 nm diameter in the first 20 μm ranges. After 20 μm, the DER declines to about 1, implying that the dose enhancement is not significant at these distances for GNP of 50 nm and 100 nm diameter irradiated by 50 kVp x-ray. Fig 6 (d) shows that if GNP is irradiated by 100 kVp x-ray spectra, the dose enhancement found in the simulations can extend up to 30–40 μm from the surface of the GNP. The overall picture of DER distribution suggests that, to obtain a higher DER in the micrometer ranges, i.e. at the cellular level, GNP with 100 nm diameter can be selected and irradiated by 100 kVp x-rays. It is noted that, for 100 kVp x-rays, the DER calculated by PENELOPE at 2 μm to 8 μm from the surface of the GNP drops down more steeply than the other results, in contrast to the irradiation scenarios by 50 kVp x-rays.
Fig. 6.

Dose enhancement ratio (DER) in micrometer ranges of GNP with 50 nm and 100 nm diameter irradiated by 50 kVp and 100 kVp x-ray spectra. (a) 50 nm by 50 kVp, (b) 50 nm by 100 kVp, (c) 100 nm by 50 kVp, (d) 100 nm by 100 kVp.
3.2. Energy spectra of secondary electrons und uncertainty
3.2.1. Energy spectra of secondary electrons
For an insight of the DER distribution in the nanometer ranges, the energy spectra of secondary electrons including Auger and C-K electrons escaping from the GNP were simulated and compared in Fig. 7 for these two sizes of GNPs irradiated by the two x-ray spectra. For gold, with a probability of 98.5%, the emission of Auger electrons is dominant in the M- and N- shell. For the M-shell, about 33% of electrons have energies between 200–300 eV. From Fig. 7, in the spectra of electrons at the 200–300 eV energy range the main contribution in the spectrum is from Auger electrons and results in dose enhancement at the lower nanometer ranges (~ 10 nm) [44]. Electrons of higher energies stem mostly from photoelectric effect and 10% of Auger electrons with the higher energies (in excess of 8 keV) contribute to the dose enhancement at micrometer ranges. The variation of electron energy spectra at low energy, e.g. 100 eV is much larger compared to the DER at the nanometer ranges.
Fig. 7.

Energy spectra of secondary electrons escaping from the surface of GNP irradiated by x-ray spectra (a) 50 nm by 50 kVp; (b) 50 nm by 100 kVp; (c) 100 nm by 50 kVp and (d) 100 nm by 100 kVp.
3.2.2. Uncertainty factor of electron energy spectra
Fig. 8 presents the 2.5th, 50th and 97.5th percentiles of the reported electron energy spectra for different irradiation scenarios. Overall, the highest UF, from maximum 21.8 to minimum 5.1 was found for 100 nm GNP irradiated by 100 kVp x-rays, and the lowest UF, from maximum 6.5 to minimum 2.9, for 50 nm irradiated by 100 kVp x-rays. If the high UF values at the low energy range, say from 50 eV to 200 eV were neglected due to the very high uncertainty of the cross sections of lower electron energies, then the UF of the energy spectra ranges from 6.3 for the scenario of 100 nm by 100 kVp to 2.7 for the scenario of 50 nm by 50 kVp. The fluctuation of the spectra at higher energy range, say, larger than 20,000 eV resulted from the statistic power of the Monte Carlo simulations, especially for the GNPs irradiated by 100 kVp x-ray.
Fig. 8.

The 2.5th, 50th and 97.5th percentiles of energy spectra of secondary electrons escaping from the surface of GNP irradiated by x-ray spectra reported from different exercise participants (a) 50 nm by 50 kVp; (b) 50 nm by 100 kVp; (c) 100 nm by 50 kVp and (d) 100 nm by 100 kVp.
As an example, Table 2 presents the 2.5th, 50th and 97.5th percentiles of the reported electron energy spectra at energies of 100 eV, 1000 eV and 10,000 eV for different irradiation scenarios. The UF at 100 eV for the four radiation scenarios is very large, expanding from 4.1 to 8.8. The UFs at 1000 eV and 10,000 eV for these four scenarios is smaller than that at 100 eV, ranging from 3.4 to 6.1 and from 2.9 to 5.8, respectively.
Table 2.
The 2.5th, 50th and 97.5th percentiles and uncertainty factor (UF) of the reported probabilities for electrons emitted from surface of the GNP at energies of 100 eV, 1000 eV and 10,000 eV.
| Electron energy (eV) | |||
|---|---|---|---|
| GNP size and x-ray (nm/kVp) |
100 | 1000 | 10,000 |
| (2.5th, 50th, 97.5th), UF | |||
| 50 / 50 | (1.0×10⁻⁶, 3.4×10⁻⁶, 4.4×10⁻⁵) ,6.5 | (1.9×10⁻⁷, 6.2×10⁻⁷, 2.1×10⁻⁶), 3.4 | (5.1×10⁻⁸, 1.6×10⁻⁷, 4.4×10⁻⁷), 2.9 |
| 50 / 100 | (2.1×10⁻⁷, 5.7×10⁻⁷, 3.6×10⁻⁶), 4.1 | (6.2×10⁻⁸, 1.3×10⁻⁷, 8.5×10⁻⁷), 3.7 | (1.1×10⁻⁸, 2.3×10⁻⁸, 1.6×10⁻⁷), 3.8 |
| 100 / 50 | (1.4×10⁻⁶, 5.9×10⁻⁶, 1.1×10⁻⁴), 8.8 | (2.0×10⁻⁷, 7.7×10⁻⁷, 4.9×10⁻⁶), 5.0 | (5.9×10⁻⁸, 3.0×10⁻⁷, 1.7×10⁻⁶), 5.4 |
| 100 / 100 | (3.1×10⁻⁷, 2.4×10⁻⁶, 1.7×10⁻⁵), 7.3 | (8.6×10⁻⁸, 4.8×10⁻⁷, 3.2×10⁻⁶), 6.1 | (2.6×10⁻⁸, 1.2×10⁻⁷, 8.9 ×10⁻⁷), 5.8 |
4. Discussion
4.1. Uncertainty of DER and energy spectra of secondary electrons
The MC codes used in this exercise were: PENELOPE, MDM, PARTRAC, MCNP6, NASIC and Geant4/Geant4-DNA and TOPAS/TOPAS-nBio. Detailed information of each code was presented in Appendix. This information can help to understand the variation of the results.
The simulated results delivered by different participants showed a variation on the DER and the energy spectra of secondary electrons escaping from the GNP. A quantitative uncertainty analysis revealed a larger uncertainty factor ranging from 2.9 up to 8.8 (see Table 2). A very large uncertainty was found at energy 100 eV for the scenario of 100 nm irradiated by 100 kVp x-ray spectra. The reason of this large variation of electron spectra among the participants can be potentially further investigated and searched from the Table 1. It may come from several sources that include the use of different MC codes, the different cross sections, the different physical processes and models. In addition, uncertainties due to differences in code implementation and result analysis could not be completely ruled out. The investigation of uncertain sources for these electron spectra is essential since it is the prime and initial physical quantity output of the MC codes. To further mitigate potential differences between modelers, in the planned exercise for multiple GNPs in cellular level, some certain physical parameters can be fixed if one uses the same code.
Despite the large variation of electron energy spectra shown in the lower to middle energy ranges in Fig. 7, the DER showed comparably smaller uncertainty factors, from 1.4 up to 2.3 in the whole range from 10 nm to 1000 nm for 10 nm–thick water shells. If the maximum UFs of DERs for each radiation scenario were excluded, the overall UF is smaller than a factor of 1.9. In contrast to the DER in the nanometer range, the DER in 1 μm-thick water shells at micrometer range resulted in an overall UF that is smaller than a factor of 1.2.
Even when using the same combined code, for example, Geant4/Geant4-DNA, there are multiple models and options to choose from Geant4 and Geant4-DNA, therefore, the variations of DER between different modelers can be observed. From the Table 1, the difference by using the different models with the same code can be potentially figured out. This suggests that intercomparisons and cross checking of simulated results are necessary for quality assurance of radiation doses for this new GNP-assisted radiotherapy.
4.2. Dependence of DER on the size of GNP and the peak kilovoltage of x-ray
For a fixed peak voltage of the x-ray source, e.g. 50 kVp or 100 kVp, the DER increases as the size of nanoparticle increases from 50 nm to 100 nm. However, if the size of the nanoparticle is fixed, here using 50 nm or 100 nm, the DER decreases as the peak voltage of x-ray increases from 50 kVp to 100 kVp. Furthermore, it has been shown that the DER of 60 kVp is greater than that of 50 kVp for these two sizes of nanoparticles [24]. This implies that x-rays generated by an optimal peak voltage smaller than 100 kVp but greater than 50 kVp should produce the most effective dose enhancement effect.
4.3. Limitation of the present simulations
There are some limitations in the present MC simulation exercise, mainly due to the simple irradiation model employed, using a single nanoparticle, the application of a narrow x-ray beam and the fixed distance between the GNPs and the x-ray sources. The setup of this exercise results in a lack of secondary particle equilibrium such that the absorbed dose cannot be properly assessed. More precisely, the following three effects are not accounted for: (1) In a real irradiation with an extended photon field, electrons generated by photon interactions outside the cylindrical beam used in the simulation also deposit energy in the shell segments used for scoring. Hence, there will be a severe underestimation of the real absorbed dose to water in both cases, i.e. with and without nanoparticle present. If this underestimation is corrected for, it will significantly decrease the dose enhancement factor. A quantitative reduction of DER by applying a real source geometry in simulation will be estimated by another work [64]. (2) Due to the confined beam used in the simulation, the contribution of Compton or Rayleigh scattered photons interacting with the nanoparticle is underestimated. In a more realistic extended radiation beam, most of these photons would be produced outside the cylindrical beam used in the simulation. Including this contribution will increase both the absorbed dose in the absence and in the presence of the nanoparticle, but it can be expected that there will be a net increase of the dose enhancement factor due to the GNPs. (3) The presence of the GNP may lead to absorption of electrons by the nanoparticle such that in the “shadow” of the nanoparticle there would be a reduced deposition of energy due to electrons. This will only apply to electrons produced outside the cylinder covered by the photon beam in the simulation. And this will only play a role in attempts to correct for the previous two points and will also reduce the dose enhancement factor. However, within the uncertainties involved in the corrections for the first two problems, this third correction is probably negligible. Owing to the aforementioned three points, the values of DER shown in Fig. 4 and 6 only present upper limits to the actual DER in the vicinity of the GNPs.
4.4. Perspectives for further work
For the comparison of the physical radiation quantities for the defined geometry and x-ray beam, the results can be regarded as a reference for assessing the uncertainty and variation when using different MC codes. Although seven well-known MC codes were used in this exercise, there are other renowned MC codes, such as FLUKA [65], EGSnrc [66] and PHITS [67], that did not participate in this intercomparison. These codes might be included in a further comparison exercise in the future.
One limitation of MC transport simulation of very-low-energy electrons/photons should be mentioned: At these low energies the scattering of the particles is influenced by their quantum nature because the de-Broglie wavelength of electrons and the wavelength of photons are comparable to or exceed the interatomic distances in molecules or condensed matter. In order to satisfy the Heisenberg uncertainty principle, uncertainties of 5% must be assigned to position and momentum for 1 keV electrons in water; at 100 eV, these uncertainties are 17% to 20% and are even larger at lower energies [68]. Most MC simulation codes used in this work provide event-by-event transports of particles in water and gold down to 50 eV, such as in PENELOPE, and even down to several eV, e.g. in the combination of Geant4/Geant4-DNA, PARTRAC and other codes. However, in Geant4 track structure is not calculated for interaction of electrons in gold, in contrast to PARTRAC. As these low-energy electrons deposit their energy on the nanometer scale, a large uncertainty of the dose enhancement effects on the nanometer range should be expected.
The present exercise demonstrates that, besides fixing input parameters of the geometry setup and source spectra in the MC codes, physical models and code versions should also be fixed among participants. By doing so, systematic uncertainties could be better identified, for example, between Geant4 and TOPAS.
For the exercise reported in this paper, the requirement of fixing the same code versions and physical models was not imposed on the users and will be implemented in the envisaged next EURADOS exercise of inter-code comparisons on multiple GNPs distributed around a cell nucleus. Furthermore, the content of this exercise should be kept as simple as possible and should avoid in-between data transfer and conversion. Quantities calculated for comparison must be clearly defined. A mid-term deadline for delivering results should be given to all participants. If possible, a format of presenting the results will be defined and provided.
5. Conclusion
In this study, a simple model case study of a single GNP with diameter of either 50 nm or 100 nm irradiated in liquid water by photons from an x-ray tube with either 50 kV or 100 kV peak voltage was performed applying seven well-known MC radiation transport simulation codes. The purpose of this study was to compare relevant physical quantities, especially the energy spectra of secondary and Auger electrons and the dose enhancement ratio around the nanoparticle resulting from the interactions of the x-rays with the GNP. The enhanced absorbed dose around a GNPs irradiated by x-rays is impossible to measure on the microscopic scale, however it can be estimated using in silico simulations. These enhanced doses are relevant for the establishment of dose-effect relationship for gold nanoparticle-assisted targeted radiotherapy. Comparison of the results of different participants showed that even for the simple geometry setup and x-ray sources, significant variations and uncertainties of the electron energy spectra are observed, especially in the energy range of 100–500 eV. The reason for these differences may lay, among others, in the implementation of the geometry, the way the physical quantities were scored and application of different physical models and cross sections. Continuous inter-code comparisons helped to improve the results during this type of exercise by identifying differences in simulation settings, scoring or analysis. In the final results, the medians (50th percentile) of the reported DERs in 10 nm-thick water shells around the GNP range from 400 to 600 at 10 nm and decline to 40 to 100 for different radiation scenarios – i.e. different size of GNPs irradiated by different x-ray spectra. The results show a clear difference of DER calculated with Geant4/Geant4-DNA (no track structure calculation in Geant4 for gold) as compared to PENELOPE and PARTRAC (with track structure calculation in gold). Geant4 family codes, like Geant4-DNA, TOPAS and TOPAS-nBio, and other codes, such as MDM, MCNP6 and NASIC (partially based on Geant4-DNA cross sections), produced similar DER values. Despite the larger uncertainty up to a maximum UF of 8.8 for the electron energy spectra, the uncertainty of DER in the 10 nm-thick water shells showed a maximum UF up to 2.3. Therefore, this exercise suggests that an intercomparison of physical quantities calculated by experts applying different MC codes is necessary and inevitable to ensure a high quality dose assessment for GNP-assisted targeted radiotherapy. An expert consortium may need to be established to give recommendations on MC-simulation-based dose assessment for GNP applications in radiotherapy such as, for example, in vitro cell culture or in xenograft mice (same model, voxel and radiation setup) and 3D dose mapping. This consortium could be organized inside the EURADOS network.
Highlights.
EURADOS organized an inter-code intercomparison of dose enhancement of gold nanoparticles irradiated by kVp x-ray spectra.
Variations and uncertainties of dose enhancement are observed by using multiple Monte Carlo codes.
This study gives a reference range of dose enhancement in simulating gold nanoparticles irradiated by x-ray spectra.
This intercomparison improved the simulation performances by identifying differences in settings, scoring and analysis.
Further inter-code intercomparisons ensure a high quality of dose assessment for gold nanoparticle-assisted radiotherapy.
Acknowledgments
This work was supported by EURADOS e.V. and was partially supported by German DFG funding with project number 336532926. The work related to MDM code was supported by the LABEX PRIMES “ANR-11-LABX-0063/ANR-11-IDEX-0007” of Université de Lyon within the program “Investissements d’Avenir” operated by the French National Research Agency (ANR), and by the Foundation ARC pour la recherche sur le cancer. The work done by A. Ipatov received financial support from INCa-ITMO (No. PC201307-BIOHYDRA) within the Programme Plan Cancer 2009–2013 (Inserm). The work of A. Belchior was supported by “Fundação para a Ciência e Tecnologia” (grant SFRH/BPD/112654/2015). The work of S. Di Maria was supported by “Fundação para Ciencia e Tecnologia” (project UID/Multi/04349/2019). The work by J. Schuemann and B. Rudek was supported by the NIH/NCI with Grant No. R01CA187003 (TOPAS-nBio: A Monte Carlo tool for radiation biology research) and German DFG with Grant No. RU 2197/1-1. The authors thank Maria Antonia López, Bastian Breustedt, Rick Tanner and Werner Rühm (all from EURADOS) for their constant supports to this intercomparison exercise.
Appendix – A short introduction to the Monte Carlo codes used in this work
In this appendix, a short description of different MC codes used in this exercise was introduced, mainly on the cross sections of interactions of photons and electrons with liquid water and gold, especially for low energy electrons, such as Auger and K-C electrons. The atomic relaxation process is introduced as well because it is important for understanding how MC codes treat Auger processes.
A.1. Geant4/Geant4-DNA code
In this exercise, a combination of processes available in the Geant4 toolkit [69] (for recent development, see website http://geant4.org) was used to simulate interactions of photons with gold and liquid water, Auger electron production, fluorescence and transport of low energy electrons in gold and liquid water. For physical interactions of low energy electrons in liquid water, the Geant4-DNA [70] (for recent development, see website http://geant4-dna.org) physical processes and models that allow track structure simulations down to eV scale [71] were used in the presented simulations. The photon process models used in Geant4 were based on the Evaluated Photon Data Library [72] for both gold and liquid water target materials. Concerning interactions taking place in the GNP, different models in the low energy package of Geant4 can be used. Therefore, for all participants, who apply Geant4 and Geant4-DNA codes in this work, we denote the combination of the two codes simply as Geant4/Geant4-DNA (denoted as G4/DNA in the Figures).
Indeed, there are various options in this package in Geant4 that can be selected to calculate physical interactions of electrons with gold, for example: the so called “Livermore” and the so-called “Penelope” models that are based on the 2008 version of the PENELOPE code [71]. Nevertheless, it has to be noted that, none of these models are recommended to be used for energies lower than a few hundred eV (250 eV for “Livermore” and 100 eV for “Penelope”). Default tracking step sizes for Livermore and Penelope were used [73]. Moreover, these models are not meant to be used in a step-by-step (discrete) mode which is important when dealing with nanometric volumes. Therefore, in this work, the Geant4 code was “forced” to perform calculations in GNP by decreasing the secondary electron energy cutoff the available models, e.g. “Livermore” models down to 10 eV and applying the multiple scattering (MSC) approach that is suggested by default in these two models. For atomic de-excitation, Auger electron production and fluorescence were activated. In Auger cascades, K-, L-, and M-shell transitions are simulated as described in [74].
Geant4-DNA models were used to simulate low energy electron interactions in liquid water. Indeed Geant4-DNA models that are included in the low energy electromagnetic set of Geant4 models provide an open access software framework for the simulation of ionizing radiation and early biological damage at the DNA scale [70, 75–77]. Physical models and cross-section data included in this Geant4 extension can be used to simulate step-by-step physical interactions of particles (electrons, protons, neutral hydrogen, helium atoms and ions, and a few heavier ions) down to very low energies for electrons (~10 eV) in liquid water and DNA constituents (Adenine, Thymine, Guanine, Cytosine). It also enables simulation of the physico-chemical and chemical stages of water radiolysis in the irradiated medium up to 1 μs after irradiation. However, these processes were not applied in this exercise.
In this study, Geant4-DNA, included in Geant4 version 10.4 was used by different users. It offers three recommended reference physics constructors for the simulation of discrete particle interactions in liquid water. In Geant4, a physics constructor gathers all required lists of particles, physics processes, and associated models required by a Geant4-DNA simulation application. These constructors are referenced as “G4EmDNAPhysics_option2,” “G4EmDNAPhysics_option4,” and “G4EmDNAPhysics_option6”. The energy cutoff for electron transport is 7.4, 10 and 11 eV, respectively. Therefore, the results labelled with G4/DNA#1, G4/DNA#2 and G4/DNA#3 were results delivered by different participants who have used different options in Geant4 for GNP and Geant4-DNA for liquid water.
A.2. TOPAS/TOPAS-nBio code
The TOPAS (TOol for PArticle Simulation) project, launched in 2009, is a software project to simplify the use of MC simulations for cancer research and clinical applications [78]. TOPAS provides a flexible framework to design and share simulation settings across research groups and radiotherapy centers that use similar equipment. This is achieved via a parameter control system that defines all aspects of the simulation without requiring compilation of code. Parameters are specified in one or more text files to define the properties of the simulation. An extension system was developed for users who need additional features specific to their own application, such as custom scorers or geometries. The extension manager allows users to add new features by writing a short section of simple, C++ code based on templates and C++ helper functions provided within TOPAS [79]. TOPAS is now part of the US National Cancer Institute’s (NCI) Informatics Technology for Cancer Research (ITCR) Initiative and free of charge for any user conducting education or research in medical physics and radiation biology for non-profit organizations. The code is available on the TOPAS webpages [80].
The simulations presented here were performed using the TOPAS-nBio, an extension of TOPAS version 3.1.p3 which is based on Geant4 version 10.3.p1. TOPAS-nBio [81] is an extension aiming to provide the ease of use provided by TOPAS to simulations at the nanometer scale for cellular and sub-cellular radiobiology using Geant4-DNA physics and chemistry models. The default Geant4-DNA (option 0) was used for the simulation of particle transport within water but Geant4-DNA currently does not include cross sections for gold. The most widely used physics lists of interactions in GNPs are the so-called Livermore and Penelope lists. Both lists use condensed-history models for electron transport and were shown to underestimate the backscattering coefficients compared to yet unreleased discrete models [54, 55]. The Livermore physics list can be used down to 10 eV [54, 82] (while not recommended), but the Penelope list has a limit at 100 eV and was found to underestimate dose enhancement within the first 100 nm from a GNP surface [83].
To take low energy electron interactions into account, we chose the Livermore list including the recently implemented full Auger deexcitation cascades [74] which models fluorescence, Auger electron production, and particle induced x-ray emission. All secondary production thresholds were disabled for deexcitation. The range cut for electrons was set to 1 nm. The default tracking step-size was used. The dose enhancement was calculated as the ratio of deposition in the presence of GNPs and water nanoparticles (WNPs) which were also simulated using the Livermore physics lists. The results obtained here were denoted as “TOPAS”, which however, includes the use of TOPAS-nBio code.
A.3. PENELOPE code
The computer code system PENELOPE [84] simulates coupled electron-photon transport in arbitrary material systems consisting of a number of homogeneous regions (bodies) limited by sharp (and passive) interfaces. The name is an acronym that stands PENetration and Energy LOss of Positrons and Electrons in matter, photons were introduced later. The adopted interaction models, and the associated databases, allow the simulation of electron/positron and photon transport in the energy range from 50 eV to 1 GeV. Photon transport is simulated by means of the standard, detailed simulation scheme. Electron and positron histories are generated on the basis of a mixed procedure, which combines detailed simulation of hard events with condensed simulation of soft interactions.
A geometry package called PENGEOM permits the generation of random electron-photon showers in material systems consisting of homogeneous bodies limited by quadric surfaces, i.e., planes, spheres, cylinders, etc. It should be noted that approximate interaction models become less accurate when the energy of the transported radiation decreases. Actually, for energies below 1 keV, the differential cross sections (DCSs) are not well known, mostly because they are strongly affected by the state of aggregation (i.e., by the environment of the target atom). On the other hand, for electrons and positrons, the trajectory picture ceases to be applicable (because coherent scattering from multiple centers becomes appreciable) when the de Broglie wavelength, λB = (150 eV/E)1/2 Å, is similar to or greater than the interatomic spacing. Therefore, results from simulations with PENELOPE for energies below 1 keV or so, should be considered to have only a qualitative (or, at most, semi-quantitative) value.
For elements with intermediate and high atomic numbers, secondary characteristic photons with energies less than the cutoff energy, Ec=max {50 eV, UN7(Zm), UO1(Zm)} are not simulated by PENELOPE (where UN7(Zm) and UO1(Zm) denote the ionization energy of the outer subshells, i.e., N7 and O1 of the heaviest element present, whose atomic number is Zm. For example, the value of Ec for gold is 114 eV). This sets a lower limit to the energy range for which the simulation is faithful. Therefore, in the simulation, the cutoff energy for electrons and photons is generally set up to 50 eV. Moreover, the relaxation of shells with principal quantum number larger than 4 (O and P subshells) was not considered in this code. In this work, PENELOPE-2011 defined as “PENELOPE#1” and PENELOPE-2014 defined as “PENELOPE#2” have been used. In version of PENELOPE-2014, there are some changes in global parameters, geometry input and other modifications, like, (1) ionizations of inner shells by electron and positron impact are described as proper inelastic collisions, this ensures that the net deposited energy in each interaction event is positive; (2) cross sections for ionization of N subshells calculated from the relativistic distorted wave Born approximation have been included in the database. However, for this simulation, no essential changes on the energy deposition and dose distribution will be expected.
A.4. PARTRAC code
PARTRAC has been developed from a track structure simulation code, MOCA, for electrons in the water vapor [85]. During the last decades, several functional modules have been added making it now a powerful tool for simulating initial DNA damages [86] and damage responses [87] at the cellular level in addition to radiation track structures and their micro-or nanodosimetric analysis. An overview of PARTRAC capabilities is given elsewhere [88]. Owing to its modular structure and flexibility, PARTRAC code can be adapted for special investigations. This enables PARTRAC code to calculate and simulate the impact of radiation doses and effects of GNPs from molecular to cellular levels [25].
The track structure module of PARTRAC can transport different types of ionizing particles including photons, electrons, protons, alpha particles and heavier ions. In the present context, only the physical stage is of concern which includes the transport of ionizing particles, together with the generation of ionized and excited atoms and molecules in the medium in an event-by-event way. Within the defined tracking volume, full information of both primary and secondary particles can be recorded, e.g. for electron spectra analysis, or evaluated on-the-fly from a corresponding data stream, as done here for dose enhancement analysis.
Cross sections for photon interactions are taken from the EPDL-97 dataset [72] considering the elemental composition of the (usually biological) materials, water and gold in the present work. Relaxation processes after the removal of inner shell electrons by photoionization due to radiative (fluorescence) or non-radiative (Auger or C-K) transitions have been considered based on the EADL dataset [89]. The transport of electrons in water was simulated with the corresponding cross sections [53], while the electron impacting ionization cross sections for gold were calculated with the method of Seltzer [90], based on the theory of Weizsäcker [91] and Williams [92]. An additional module was implemented in PARTRAC for this specific exercise work. They contained two parts: (1) the close collision part that described collisions between two electrons associated with high energy transfers and small impact parameters; and (2) the distant collision part that considered interactions of a virtual photon field emitted by the projectile electron with orbital electrons. Input parameters include the mean kinetic energies of orbital electrons, the expectation value of the electron orbital radius and the binding energies. Elastic cross sections were calculated using literature data [93, 94].
A.5. NASIC code
NASIC [95], an abbreviation from a biophysics NAnodosimetry Monte Carlo SImulation Code, was developed by Tsinghua University, Beijing, China. Up to now it comprises physical module, pre-chemical module, chemical module, geometric module, DNA damage module, DNA damage repair module and cell death module. In the physical module, it can simulate the physical track structure of particles using a step-by-step method. The code includes inelastic cross sections of low energy electrons in liquid water from 8 eV to 10 keV, including ionization and excitation cross sections. Based on the plane wave Born approximation of quantum mechanics, and the Bethe theory and the dielectric theory, using the latest optical data measured by Hayashi et al. [96], the energy loss function(ELF) of photons in liquid water can be derived. Using the EOD (The Extended Oscillator Drude) dispersion model, the measured ELF is extended to non-zero momentum transfers. The original EOD model was proposed by Ritchie et al. [97] with the ionization part calculated according to Eq.(A-1). In order to lower the Bethe ridge of the Bethe surface to better match the measured experimental data, Eq.(A-1) is modified as Eq.(A-2).
| (A-1) |
| (A-2) |
In both equations, is the jth oscillation energy and q is the momentum. In equation (A-2) a, b, c are model parameters that are determined by fitting to the experimental data.
When calculating the cross sections, both, the Born correction models for perturbation correction and electron exchange effect correction are considered. For the perturbation correction, the low-energy correction function proposed by Paretzke is adopted [98, 99]. For the electron exchange effect correction, the method of the Born-Møller cross section proposed by Ritchie et al. [97, 99, 100] is used.
The other cross sections of electron interactions are directly taken from Geant4-DNA and the cross sections for photons and gold are all taken from Geant4. Therefore, the physics module of NASIC is based on Geant4 and Geant4-DNA apart from the electron ionization/excitation cross section in liquid water.
A.6. MDM code
The MDM code was developed at University Lyon based on its precursor, the LQD code [101], which performed an event-by-event tracking of electrons and ions by applying the MC simulation method. It was originally developed in the context of radiochemistry [102] and was later used to investigate the microscopic and nanoscopic dose deposition in the context of hadron therapy [103] and to provide input for the NanOx model [104], aiming at predicting cell survivals to ion irradiation. It was also modified to consider various heterogeneous domains, which have led to the emergence of a new branch MDM, i.e. for MeDiuM used to calculate W-values. Recently, MDM was extended to metallic media to provide a toolkit of high precision for low energy transport of electrons in condensed matter media.
In the following, a short introduction of radiation interactions with matters applied in the MDM is described: (1) Photon interaction: The geometry of the system allows considering that the flux of photons remained unchanged both in direction and energy spectrum over the volume of interest. This consideration simplified the simulation, since photons did not require an explicit tracking. Photon interactions were homogeneously distributed in water and in the GNP. As the total cross section was larger for gold material than water, the interaction density was larger. Only the photoelectric absorption and the Compton scattering were taken into account as, at these energies, they are predominant. (2) Electron-gold interaction: According to the transferred momentum, elastic scattering is described through a single-atom potential [105] or with creation of phonons [106]. Inelastic collisions were described as atomic-like processes [107] for inner-shell electrons, and through a dielectric formalism for outer-shell electrons [108]. A thorough benchmarking was performed for gold-electron interaction for energies from a few eV up to 90 keV [109]. (3) Electron-water interaction: The models used for electron-water interaction are described elsewhere [109]. Briefly, inelastic collisions were described using the model developed by Kim et al. [107] for ionization, by Cobut et al. [110] for excitation of the water molecule into the A1B1 or B1A1 electronic state, and by Richardson et al. [111] for double ionization. The angular distributions of electrons after an ionizing collision were modeled based on the work by Grosswendt et al [112]. Elastic collisions of electrons were based on the work by Michaud et al. [113]. The cross sections of inelastic collisions associated with vibrational excitation of water molecules were based on the measurements in amorphous ice by Michaud et al. [114], and Cobut et al. [110] and enhanced by 15% to account for the liquid state and improve the comparison with experimentally observed decay of solvated electrons [115]. Finally, attachment cross sections were adjusted to reproduce the yield of molecular hydrogen measured by Pastina et al. [116]. (4) Water-gold interface: The change of mesoscopic potential when an electron changes medium was taken into account. The kinetic energy of the electron was modified when crossing the water-GNP interface, on the basis of the difference of the media respective mesoscopic potentials (−1.3 eV for water and −10.04 eV for gold, with respect to vacuum set at zero). For the Auger process, the whole Auger cascade was taken into account for every initial vacancy, based on the EADL library. In the case of the gold atom, a total number of 1622 transitions were considered.
A.7. MCNP6 code
MC track structure codes are very useful in order to understand radiobiological effects at DNA scale. However, the performance of the track structure MC codes strongly depends on the accuracy of the interaction cross sections used in the calculations [58]. The recent release of the Los Alamos Monte Carlo transport code MCNP6 [117] marks the culmination of several years of work to combine all of the capabilities of the earlier MCNP5 [118] and MCNPX [119] codes, to improve the code system, and to include a number of new features [120].
In MCNP6, a new single-event treatment coupled with the ENDF/B VI.8 database was developed for electron transport. This new method allows a direct sampling of microscopic data distributions and consequently an accurate low-energy transport from 1 keV down to 10 eV. The ENDF/B VI.8 database contains cross sections for atomic excitation, electron elastic scattering, subshell electron-impact ionization and bremsstrahlung processes [120]. All cross sections currently used for photon and electron interactions apply to neutral atoms in their ground state and therefore do not consider molecular effects or material structure in condensed (solid or liquid) states [120]. Especially for electron energies less than 1 keV aforementioned effects could lead to significant variations in elastic and inelastic collisions [58]. Detailed discussions about models used to obtain the ENDF/B-VI-8 data library can be found in reference [89]. Even if this single-event mode is a relatively new feature of MCNP6, several works in literature reported on the reliability of the MCNP6 single-event option [121, 122]. For photons, the traditional photon-atomic interaction processes are considered: coherent and incoherent scattering, photoelectric absorption, and electron/positron pair production.
In addition to extending some pre-existing data to lower energies the ENDF/B VI.8 database includes also subshell photoelectric cross sections [120]. A very significant addition to the photon/electron data in MCNP6 is a detailed compilation of information about atomic electron subshells. In contrast to the previous model, which considered only relaxations to the K shell and to a weighted average of the L shells and allowed a maximum of five distinct transitions to these shells, the new data can consider as many as 29 subshells and can include almost 3000 distinct transitions among them. For radiative transitions in a given subshell S0, a possible vacancy in higher subshell S1 is considered, whereas two vacancies in subshells S1 and S2 are considered in non-radiative transitions. Also, the line energy E012 of the fluorescent photon (or Auger and C-K electrons) and the probability P012 of the transition involved is taken into account [120].
Footnotes
Publisher's Disclaimer: This is a PDF file of an unedited manuscript that has been accepted for publication. As a service to our customers we are providing this early version of the manuscript. The manuscript will undergo copyediting, typesetting, and review of the resulting proof before it is published in its final form. Please note that during the production process errors may be discovered which could affect the content, and all legal disclaimers that apply to the journal pertain.
References
- [1].UNSCEAR. Sources and effects of ionizing radiation UNSCEAR 2008 Report to the General Assembly with Scientific Annexes - Volume I. Annex A Medical radiation exposures. New York: United Nations Scientific Committee on the Effects of Atomic Radiation; 2010. [Google Scholar]
- [2].Halperin EC, Wazer DE, Perez CA, Brady LW. Perez and Brady’s Principles and Practice of radiation oncology. 6th ed Philadelphia, PA: Lippincott Williams & Wilkins; 2013. [Google Scholar]
- [3].Kuncic Z, Lacombe S. Nanoparticle radio-enhancement: principles, progress and application to cancer treatment. Physics in medicine and biology. 2018;63:02tr1. [DOI] [PubMed] [Google Scholar]
- [4].Bergs JW, Wacker MG, Hehlgans S, Piiper A, Multhoff G, Rödel C, et al. The role of recent nanotechnology in enhancing the efficacy of radiation therapy. Biochim Biophys Acta. 2015;1856:130–43. [DOI] [PubMed] [Google Scholar]
- [5].Cooper DR, Bekah D, Nadeau JL. Gold nanoparticles and their alternatives for radiation therapy enhancement. Front Chem. 2014;2:1–13. [DOI] [PMC free article] [PubMed] [Google Scholar]
- [6].Zygmanski P, Sajo E. Nanoscale radiation transport and clinical beam modeling for gold nanoparticle dose enhanced radiotherapy (GNPT) using X-rays. Br J Radiol. 2016;89:20150200. [DOI] [PMC free article] [PubMed] [Google Scholar]
- [7].Lin Y, McMahon SJ, Paganetti H, Schuemann J. Biological modeling of gold nanoparticle enhanced radiotherapy for proton therapy. Physics in medicine and biology. 2015;60:4149–68. [DOI] [PubMed] [Google Scholar]
- [8].Lin Y, McMahon SJ, Scarpelli M, Paganetti H, Schuemann J. Comparing gold nano-particle enhanced radiotherapy with protons, megavoltage photons and kilovoltage photons: a Monte Carlo simulation. Physics in medicine and biology. 2014;59:7675–89. [DOI] [PubMed] [Google Scholar]
- [9].Sung W, Jeong Y, Kim H, Jeong H, Grassberger C, Jung S, et al. Computational modeling and clonogenic assay for radioenhancement of gold nanoparticles using 3D live cell images. Radiation research. 2018;190:558–64. [DOI] [PMC free article] [PubMed] [Google Scholar]
- [10].Hainfeld JF, Slatkin DN, Smilowitz HM. The use of gold nanoparticles to enhance radiotherapy in mice. Phys Med Biol. 2004;49:N309–N15. [DOI] [PubMed] [Google Scholar]
- [11].Chithrani DB, Chan CWW. Elucidating the mechanism of cellular uptake and removal of protein-coated gold nanoparticles of different sizes and shapes. Nano Lett. 2007;7:1542–50. [DOI] [PubMed] [Google Scholar]
- [12].Chithrani DB, Dunne M, Stewart J, Allen C, Jaffray DA. Cellular uptake and transport of gold nanoparticles incorporated in a liposomal carrier. Nanomedicine : nanotechnology, biology, and medicine. 2010;6:161–9. [DOI] [PubMed] [Google Scholar]
- [13].Chithrani DB, Ghazani AA, Chan CWW. Determining the size and shape dependence of gold nanoparticle uptake into mammalian cells. Nano Lett. 2006;6:662–8. [DOI] [PubMed] [Google Scholar]
- [14].Chithrani DB, Jelveh S, Jalali F, van Prooijen M, Allen C, Bristow RG, et al. Gold nanoparticles as radiation sensitizers in cancer therapy. Radiation research. 2010;173:719–28. [DOI] [PubMed] [Google Scholar]
- [15].Yang C, Uertz J, Yohan D, Chithrani BD. Peptide modified gold nanoparticles for improved cellular uptake, nuclear transport, and intracellular retention. Nanoscale. 2014;6:12026–33. [DOI] [PubMed] [Google Scholar]
- [16].Chattopadhyay N, Cai Z, Kwon YL, Lechtman E, Pignol J-P, Reilly RM. Molecularly targeted gold nanoparticles enhance the radiation response of breast cancer cells and tumor xenografts to X-radiation. Breast Cancer Res Treat. 2013;137:81–91. [DOI] [PubMed] [Google Scholar]
- [17].Chattopadhyay N, Cai Z, Pignol JP, Keller B, Lechtman E, Bendayan R, et al. Design and characterization of HER-2-targeted gold nanoparticles for enhanced X-radiation treatment of locally advanced breast cancer. Molecular pharmaceutics. 2010;7:2194–206. [DOI] [PubMed] [Google Scholar]
- [18].Cho SH. Estimation of tumour dose enhancement due to gold nanoparticles during typical radiation treatments: a preliminary Monte Carlo study. Phys Med Biol. 2005;50:N163–73. [DOI] [PubMed] [Google Scholar]
- [19].Jones BL, Krishnan S, Cho SH. Estimation of microscopic dose enhancement factor around gold nanoparticles by Monte Carlo calculations. Med Phys. 2010;37:3809–16. [DOI] [PubMed] [Google Scholar]
- [20].Leung MK, Chow JC, Chithrani BD, Lee MJ, Oms B, Jaffray DA. Irradiation of gold nanoparticles by x-rays: Monte Carlo simulation of dose enhancements and the spatial properties of the secondary electrons production. Med Phys. 2011;38:624–31. [DOI] [PubMed] [Google Scholar]
- [21].Lechtman E, Mashouf S, Chattopadhyay N, Keller BM, Lai P, Cai Z, et al. A Monte Carlo based model of gold nanoparticle radiosensitization accounting for increased radiobiological effectiveness. Phys Med Biol. 2013;58:3075–87. [DOI] [PubMed] [Google Scholar]
- [22].Douglass M, Bezak E, Penfold S. Monte Carlo investigation of the increased radiation deposition due to gold nanoparticles using kilovoltage and megavoltage photons in a 3D randomized cell model. Med Phys. 2013;40:071710. [DOI] [PubMed] [Google Scholar]
- [23].Zygmanski P, Liu B, Tsiamas P, Cifter F, Petersheim M, Hesser J, et al. Dependence of Monte Carlo microdosimetric computations on the simulation geometry of gold nanoparticles. Phys Med Biol. 2013;58:7961–77. [DOI] [PubMed] [Google Scholar]
- [24].Li WB, Müllner M, Greiter MB, Bissardon C, Xie WZ, Schlattl H, et al. Monte Carlo simulations of dose enhancement around gold nanoparticles used as x-ray imaging contrast agents and radiosensitizers. Proc SPIE. 2014;9033:90331K. [Google Scholar]
- [25].Xie WZ, Friedland W, Li WB, Li CY, Oeh U, Qiu R, et al. Monte Carlo simulations of dose enhancement around gold nanoparticles used as x-ray imaging contrast agents and radiosensitizers. Phys Med Biol 2015;60:6195–212. [DOI] [PubMed] [Google Scholar]
- [26].Carter JD, Cheng NN, Qu Y, Suarez GD, Guo T. Nanoscale energy deposition by X-ray absorbing nanostructures. The journal of physical chemistry B. 2007;111:11622–5. [DOI] [PubMed] [Google Scholar]
- [27].Cho SH, Jones BL, Krishnan S. The dosimetric feasibility of gold nanoparticle-aided radiation therapy (GNRT) via brachytherapy using low-energy gamma-/x-ray sources. Phys Med Biol. 2009;54:4889–905. [DOI] [PMC free article] [PubMed] [Google Scholar]
- [28].Lechtman E, Chattopadhyay N, Cai Z, Mashouf S, Reilly R, Pignol JP. Implications on clinical scenario of gold nanoparticle radiosensitization in regards to photon energy, nanoparticle size, concentration and location. Phys Med Biol. 2011;56:4631–47. [DOI] [PubMed] [Google Scholar]
- [29].McMahon SJ, Mendenhall MH, Jain S, Currell F. Radiotherapy in the presence of contrast agents: a general figure of merit and its application to gold nanoparticles. Physics in medicine and biology. 2008;53:5635–51. [DOI] [PubMed] [Google Scholar]
- [30].Jain S, Coulter JA, Hounsell AR, Butterworth KT, McMahon SJ, Hyland WB, et al. Cell-specic radiosensitization by gold nanoparticles at megavoltage radiation energies. Int J Radiat Oncol Biol Phys. 2011;79 531–9. [DOI] [PMC free article] [PubMed] [Google Scholar]
- [31].Kim J-K, Seo S-J, Kim H-T, Kim K-H, Chung M-H, Kim K-R, et al. Enhanced proton treatment in mouse tumors through proton irradiated nanoradiator effects on metallic nanoparticles. Phys Med Biol 2012;57:8309–23. [DOI] [PubMed] [Google Scholar]
- [32].Kaur H, Pujari G, Semwal MK, Sarma A, Avasthi DK. In vitro studies on radiosensitization effect of glucose capped gold nanoparticles in photon and ion irradiation of HeLa cells. Nucl Instr Meth Phys Res B. 2013;301:7–11. [Google Scholar]
- [33].Stangl S, Gehrmann M, Riegger J, Kuhs I, Riederer I, Sievert W, et al. Targeting membrane heat-shock protein 70 (Hsp70) on tumors by cmHsp70.1 antibody. Proc Natl Acad Sci USA 2011;108:733–8. [DOI] [PMC free article] [PubMed] [Google Scholar]
- [34].Gehrmann MK, Kimm MA, Stangl S, Schmid TE, Noël PB, Rummeny EJ, et al. Imaging of Hsp70-positive tumors with cmHsp70.1 antibody-conjugated gold nanoparticles. Int J Nanomedicine. 2015;10:5687–700. [DOI] [PMC free article] [PubMed] [Google Scholar]
- [35].Fink SL, Cookson BT. Apoptosis, pyroptosis, and necrosis: mechanistic description of dead and dying eukaryotic cells. Infect Immun. 2005;73:1907–16. [DOI] [PMC free article] [PubMed] [Google Scholar]
- [36].McMahon SJ, McNamara AL, Schuemann J, Prise KM, Paganetti H. Mitochondria as a target for radiosensitisation by gold nanoparticles. Journal of Physics: Conference Series. 2017;777:012008. [Google Scholar]
- [37].Lomax ME, Folkes LK, O’Neill P. Biological Consequences of Radiation-induced DNA Damage: Relevance to Radiotherapy. Clinical Oncology. 2013;25:578–85. [DOI] [PubMed] [Google Scholar]
- [38].Cho EC, Zhang Q, Xia Y. The effect of sedimentation and diffusion on cellular uptake of gold nanoparticles. Nat Nanotechnol. 2011;6:385–91. [DOI] [PMC free article] [PubMed] [Google Scholar]
- [39].Ruhm W, Fantuzzi E, Harrison R, Schuhmacher H, Vanhavere F, Alves J, et al. EURADOS strategic research agenda: vision for dosimetry of ionising radiation. Radiation protection dosimetry. 2016;168:223–34. [DOI] [PMC free article] [PubMed] [Google Scholar]
- [40].Villagrasa C, Bordage M-C, Bueno M, Bug M, Chiriotti S, Gargioni E, et al. Assessing the contribution of cross-sections to the uncertainty of monte carlo calculations in micro- and nanodosimetry. Radiat Prot Dosim. 2018. [DOI] [PubMed] [Google Scholar]
- [41].Breustedt B, Blanchardon E, Castellani CM, Etherington G, Franck D, Giussani A, et al. EURADOS work on internal dosimetry. Annals of the ICRP. 2018;47:75–82. [DOI] [PubMed] [Google Scholar]
- [42].Paretzke HG. Radiation track structure theory In: Freeman GR ed. Kinetics of nonhomogeneous processes. pp89–170. In: Freeman GR, editor. Kinetics of nonhomogeneous processes. New York: John Wiley & Sons; 1987. p. 89–170. [Google Scholar]
- [43].Berger MJ, Hubbell JH, Seltzer SM, Chang J, Coursey JS, Sukumar R, et al. XCOM: Photon Cross Sections Database NIST Standard Reference Database 8 (XGAM). Gaithersburg: NIST, PML, Radiation Physics Division; 2010. [Google Scholar]
- [44].Meesungnoen J, Jay-Gerin JP, Filali-Mouhim A, Mankhetkorn S. Low-energy electron penetration range in liquid water. Radiation research. 2002;158:657–60. [DOI] [PubMed] [Google Scholar]
- [45].Krause MO. Atomic radiative and radiationless yields for K and L shells. Journal of Physical and Chemical Reference Data. 1979;8:307. [Google Scholar]
- [46].Stumpf V, Kolorenc P, Gokhberg K, Cederbaum LS. Efficient pathway to neutralization of multiply charged ions produced in Auger processes. Phys Rev Lett. 2013;110:258302. [DOI] [PubMed] [Google Scholar]
- [47].Li WB. Calculation of DNA strand breakage by neutralisation effect after 125I decays in a synthetic oligodeoxynucleotide using charge transfer theory. Radiation protection dosimetry. 2006;122:89–94. [DOI] [PubMed] [Google Scholar]
- [48].Kittel C Introduction to solid state physics. 3rd ed New York: John Wiley & Sons, Inc; 1966. [Google Scholar]
- [49].Kittel C Quantum of theory of solids. 2nd ed: John Wiley & Sons, Inc; 1987. [Google Scholar]
- [50].Boudaiffa B, Cloutier P, Hunting D, Huels MA, Sanche L. Resonant formation of DNA strand breaks by Loe-Energy (3 to 20 eV) Electrons. Science. 2000;287:1658–60. [DOI] [PubMed] [Google Scholar]
- [51].Salvat F PENELOPE-2014. A code system for Monte Carlo simulation of electron and photon transport NEA/NSC/DOC(2015)3: Nuclear Energy Agency/Organisation for Economic Co-operatrion and Developement; 2015. [Google Scholar]
- [52].Nikjoo H, Emfietzoglou D, Liamsuwan T, Taleei R, Liljequist D, Uehara S. Radiation track, DNA damage and response—a review. Reports on Progress in Physics. 2016;79:116601. [DOI] [PubMed] [Google Scholar]
- [53].Dingfelder M, Hantke D, Inokuti M, Paretzke HG. Electron inelastic-scattering cross sections in liquid water. Radiation Physics and Chemistry. 1998;53:1–18. [Google Scholar]
- [54].Sakata D, Incerti S, Bordage MC, Lampe N, Okada S, Emfietzoglou D, et al. An implementation of discrete electron transport models for gold in the Geant4 simulation toolkit. Journal of Applied Physics. 2016;120:244901. [Google Scholar]
- [55].Sakata D, Kyriakou I, Okada S, Tran HN, Lampe N, Guatelli S, et al. Geant4-DNA track-structure simulations for gold nanoparticles: The importance of electron discrete models in nanometer volumes. Medical physics. 2018;45:2230–42. [DOI] [PubMed] [Google Scholar]
- [56].Tan Z, Xia Y, Liu X, Zhao M, Ji Y, Li F, et al. Cross sections of electron inelastic interactions in DNA. Radiation and environmental biophysics. 2004;43:173–82. [DOI] [PubMed] [Google Scholar]
- [57].Bernhardt P, Paretzke HG. Calculation of electron impact ionization cross sections of DNA using the Deutsch-Märk and Binary-Encounter-Bethe formalisms. Int J Mass Spectrom 2003;223–224:599–611 [Google Scholar]
- [58].Emfietzoglou D, Papamichael G, Nikjoo H. Monte Carlo electron track structure calculations in liquid water using a new model dielectric response function. Radiation research. 2017;188:355–68. [DOI] [PubMed] [Google Scholar]
- [59].Poludniowski G, Landry G, DeBlois F, Evans PM, Verhaegen F. SpekCalc: a program to calculate photon spectra from tungsten anode x-ray tubes. Phys Med Biol. 2009;54:N433–N8. [DOI] [PubMed] [Google Scholar]
- [60].Poludniowski GG. Calculation of x-ray spectra emerging from an x-ray tube. Part II. X-ray production and filtration in x-ray targets. Medical physics. 2007;34:2175–86. [DOI] [PubMed] [Google Scholar]
- [61].ISO. Guide to the expression of uncertainty in measurement (GUM). 1 ed Geneva: International Organization for Standardization; 1995. [Google Scholar]
- [62].Morgan MG, Henrion M. Uncertainty. A guide to dealing with uncertainty in quantitative risk and policy analysis. New York: Cambridge University Pess; 1990. [Google Scholar]
- [63].NCRP. Uncertainty in internal radiation dose assessment NCRP Report No 164. Bethesda: National Council on Radiation Protection & Measurements; 2009. [Google Scholar]
- [64].Rabus H, Gargioni E, Li WB, Nettelbeck H, Villagrasa C. Determining dose enhancement factors of high-Z nanoparticles from simulations where lateral secondary particle disequilibrium exists. Phys Med Biol. 2019;64:155016. [DOI] [PubMed] [Google Scholar]
- [65].Böhlen TT, Cerutti F, Chin MPW, Fassò A, Ferrari A, Ortega PG, et al. The FLUKA code: Developments and challenges for high energy and medical applications. Nuclear Data Sheets. 2014;120:211–4. [Google Scholar]
- [66].Kawrakow I, Mainegra-Hing E, Rogers DWO, Tessier F, Walters BRB. The EGSnrc code system: Monte Carlo simulation of electron and photon transport NRCC Report PIRS-701. Ottawa: Ionizing Radiation Standards, National Research Council Canada; 2018. [Google Scholar]
- [67].Sato T, Iwamoto Y, Hashimoto S, Ogawa T, Furuta T, Abe S, et al. Features of Particle and Heavy Ion Transport code System (PHITS) version 3.02. Journal of Nuclear Science and Technology. 2018;55:684–90. [Google Scholar]
- [68].Thomson RM, Kawrakow I. On the Monte Carlo simulation of electron transport in the sub-1 keV energy range. Med Phys. 2011;38:4531. [DOI] [PubMed] [Google Scholar]
- [69].Agostinelli S, Allison J, Amako K, Apostolakis J, Araujo H, Arce P, et al. Geant4—a simulation toolkit. Nuclear Instruments and Methods in Physics Research Section A: Accelerators, Spectrometers, Detectors and Associated Equipment. 2003;506:250–303. [Google Scholar]
- [70].Incerti S, Baldacchino G, Bernal M, Capra R, Champion C, Francis Z, et al. The Geant4-DNA project. Int J Model Simul Sci Comput. 2010;1:157–78 [Google Scholar]
- [71].Geant4 Collaboration. Geant4: Physics reference manual - Release 10.5. 2018.
- [72].Cullen DE, Hubbell JH, Kissel L. EPDL97: The Evaluated Photon Data Library, ‘97 Version. Lawrence Livermore National Laboratory; 1997. [Google Scholar]
- [73].Kyriakou I, Ivanchenko V, Sakata D, Bordage MC, Guatelli S, Incerti S, et al. Influence of track structure and condensed history physics models of Geant4 to nanoscale electron transport in liquid water. Physica Medica. 2019;58:149–54. [DOI] [PubMed] [Google Scholar]
- [74].Incerti S, Suerfu B, Xu J, Ivantchenko V, Mantero A, Brown JMC, et al. Simulation of Auger electron emission from nanometer-size gold targets using the Geant4 Monte Carlo simulation toolkit. Nuclear Instruments and Methods in Physics Research Section B: Beam Interactions with Materials and Atoms. 2016;372:91–101. [Google Scholar]
- [75].Bernal MA, Bordage MC, Brown JMC, Davidkova M, Delage E, El Bitar Z, et al. Track structure modeling in liquid water: A review of the Geant4-DNA very low energy extension of the Geant4 Monte Carlo simulation toolkit. Physica medica : PM : an international journal devoted to the applications of physics to medicine and biology : official journal of the Italian Association of Biomedical Physics (AIFB). 2015;31:861–74. [DOI] [PubMed] [Google Scholar]
- [76].Incerti S, Ivanchenko A, Karamitros M, Mantero A, Moretto P, Tran HN, et al. Comparison of GEANT4 very low energy cross section models with experimental data in water. Medical physics. 2010;37:4692–708. [DOI] [PubMed] [Google Scholar]
- [77].Incerti S, Kyriakou I, Bernal MA, Bordage MC, Francis Z, Guatelli S, et al. Geant4-DNA example applications for track structure simulations in liquid water: A report from the Geant4-DNA Project. Medical physics. 2018;8:e722–e39. [DOI] [PubMed] [Google Scholar]
- [78].Perl J, Shin J, Schumann J, Faddegon B, Paganetti H. TOPAS: an innovative proton Monte Carlo platform for research and clinical applications. Medical physics. 2012;39:6818–37. [DOI] [PMC free article] [PubMed] [Google Scholar]
- [79].McNamara A, Geng C, Turner R, Mendez JR, Perl J, Held K, et al. Validation of the radiobiology toolkit TOPAS-nBio in simple DNA geometries. Physica medica : PM : an international journal devoted to the applications of physics to medicine and biology : official journal of the Italian Association of Biomedical Physics (AIFB). 2017;33:207–15. [DOI] [PMC free article] [PubMed] [Google Scholar]
- [80].TOPAS. www.topasmc.org and https://topas.readthedocs.org and https://topasnbio.readthedocs.org. 2019.
- [81].Schuemann J, McNamara AL, Ramos-Mendez J, Perl J, Held KD, Paganetti H, et al. TOPAS-nBio: An Extension to the TOPAS Simulation Toolkit for Cellular and Sub-cellular Radiobiology. Radiation research. 2019. [DOI] [PMC free article] [PubMed] [Google Scholar]
- [82].Lazarakis P, Incerti S, Ivanchenko V, Kyriakou I, Emfietzoglou D, Corde S, et al. Investigation of track structure and condensed history physics models for applications in radiation dosimetry on a micro and nano scale in Geant4. Biomedical Physics & Engineering Express. 2018;4:024001. [Google Scholar]
- [83].Sotiropoulos M, Taylor MJ, Henthorn NT, Warmenhoven JW, Mackay RI, Kirkby KJ, et al. Geant4 interaction model comparison for dose deposition from gold nanoparticles under proton irradiation. Biomedical Physics & Engineering Express. 2017;3:025025. [Google Scholar]
- [84].Salvat F, Fernandez-Varea JM, Sempau J. PENELOPE-2011 A code system for Monte Carlo simulation of electron and photon transport. NEA/NSC/DOC(2011)5: Nuclear Energy Agency/Organisation for Economic Co-operatrion and Developement; 2011. [Google Scholar]
- [85].Paretzke HG, Turner JE, Hamm RN, Wright HA, Ritchie RH. Calculated yields and fluctuations for electron degradation in liquid water and water vapor. The Journal of chemical physics. 1986;84:3182–8. [Google Scholar]
- [86].Friedland W, Schmitt E, Kundrat P, Dingfelder M, Baiocco G, Barbieri S, et al. Comprehensive track-structure based evaluation of DNA damage by light ions from radiotherapy-relevant energies down to stopping. Sci Rep. 2017;7:45161. [DOI] [PMC free article] [PubMed] [Google Scholar]
- [87].Friedland W, Kundrat P. Track structure based modelling of chromosome aberrations after photon and alpha-particle irradiation. Mutat Res. 2013;756:213–23. [DOI] [PubMed] [Google Scholar]
- [88].Friedland W, Dingfelder M, Kundrát P, Jacob P. Track structures, DNA targets and radiation effects in the biophysical Monte Carlo simulation code PARTRAC. Mutat Res. 2011;711:28–40. [DOI] [PubMed] [Google Scholar]
- [89].Perkins ST, Cullen DE, Seltzer SM. Tables and graphs of electron-interaction cross sections from 10 eV to 100 GeV derived from the LLNL evaluated electron data library (EEDL), Z = 1–100. Livermore, CA: Lawrence Livermore National Laboratory; 1991. p. 486. [Google Scholar]
- [90].Seltzer SM. Cross Sections for Bremsstrahlung Production and Electron-Impact Ionization In: Jenkins TM, Nelson WR, Rindi A, editors. Monte Carlo Transport of Electrons and Photons. Boston, MA: Springer; 1988. [Google Scholar]
- [91].Weizsäcker CF. Ausstrahlung bei Stössen sehr schnellen Elektronen. Z Phys. 1934;88:612. [Google Scholar]
- [92].Williams EJ. Correlation of Certain Collision Problems with Radiation Theory. Kgl Danske Videnskab Mat-fys Medd. 1935;XIII:4. [Google Scholar]
- [93].Fink M, Yates AC. Theoretical electron spin scattering amplitudes and spin polarization. Atomic Data. 1970;1:385. [Google Scholar]
- [94].Riley ME, MacCallum CJ, Biggs F. Theoretical electron-atom elastic scattering cross sections: Selected elements, 1 keV to 256 keV. Atomic Data and Nuclear Data Tables. 1975;15:443–76. [Google Scholar]
- [95].Li J, Li C, Qiu R, Yan C, Xie W, Wu Z, et al. DNA strand breaks induced by electrons simulated with Nanodosimetry Monte Carlo Simulation Code: NASIC. Radiat Prot Dosim. 2015;166:38–43. [DOI] [PubMed] [Google Scholar]
- [96].Hayashi H, Watanabe N, Udagawa Y, Kao CC. The complete optical spectrum of liquid water measured by inelastic x-ray scattering. Proc Natl Acad Sci USA. 2000;97:6264–6. [DOI] [PMC free article] [PubMed] [Google Scholar]
- [97].Ritchie RH, Hamm RN, Turner JE, Wright HA. The interaction of swift electrons with liquid water. 6 Symposium on microdosimetry Brussels, Belgium, 22–26 May 1978. Commission of the European Communities (CEC) 1978. p. 345–54. [Google Scholar]
- [98].Paretzke HG. Simulation von Elektronenspuren in Energiebereich 0.01–10 keV in Wasserdampf GSF-Bericht 24/88. Neuherberg: GSF-Forschungszentrum für Umwelt und Gesundheit; 1988. [Google Scholar]
- [99].Nikjoo H, Uehara S, Emfietzoglou D. Interaction of radiation with matter. Boca Raton, FL: CRC Press; 2012. [Google Scholar]
- [100].Emfietzoglou D, Nikjoo H. The effect of model approximations on single-collision distributions of low-energy electrons in liquid water. Radiation research. 2005;163:98–111. [DOI] [PubMed] [Google Scholar]
- [101].Gervais B, Beuve M, Olivera GH, Galassi ME. Numerical simulation of multiple ionization and high LET effects in liquid water radiolysis. Radiation Physics and Chemistry. 2006;75:493–513. [Google Scholar]
- [102].Gervais B, Beuve M, Olivera GH, Galassi ME, Rivarola RD. Production of HO2 and O2 by multiple ionization in water radiolysis by swift carbon ions. Chemical Physics Letters. 2005;410:330–4. [Google Scholar]
- [103].Beuve M, Colliaux A, Dabli D, Dauvergne D, Gervais B, Montarou G, et al. Statistical effects of dose deposition in track-structure modelling of radiobiology efficiency. Nuclear Instruments and Methods in Physics Research Section B: Beam Interactions with Materials and Atoms. 2009;267:983–8. [Google Scholar]
- [104].Cunha M, Monini C, Testa E, Beuve M. 59 - NanoxTM: A new multiscale theoretical framework to predict cell survival in the context of particle therapy. Radiotherapy and Oncology. 2016;118:S29. [Google Scholar]
- [105].Salvat F, Jablonski A, Powell CJ. ELSEPA - Dirac partial-wave calculation of elastic scattering of electrons and positrons by atoms, positive ions and molecules. Computer Physics Communications. 2005;165:157–90. [Google Scholar]
- [106].Del Fatti N, Voisin C, Achermann M, Tzortzakis S, Christofilos D, Vallée F. Nonequilibrium electron dynamics in noble metals. Physical Review B. 2000;61:16956–66. [Google Scholar]
- [107].Kim YK, Rudd ME. Binary-encounter-dipole model for electron-impact ionization. Physical review A, Atomic, molecular, and optical physics. 1994;50:3954–67. [DOI] [PubMed] [Google Scholar]
- [108].Ritchie RH. Interaction of Charged Particles with a Degenerate Fermi-Dirac Electron Gas. Physical Review. 1959;114:644–54. [Google Scholar]
- [109].Cunha M, Testa E, Beuve M, Balosso J, Chaikh A. Considerations on the miniaturization of detectors for in vivo dosimetry in radiotherapy: A Monte Carlo study. Nuclear Instruments and Methods in Physics Research Section B: Beam Interactions with Materials and Atoms. 2017;399:20–7. [Google Scholar]
- [110].Cobut V, Frongillo Y, Patau JP, Goulet T, Fraser MJ, Jay-Gerin JP. Monte Carlo simulation of fast electron and proton tracks in liquid water - I. Physical and physicochemical aspects. Radiat Phys Chem. 1998;51:229–43. [Google Scholar]
- [111].Richardson PJ, Eland JHD, Fournier PG, Cooper DL. Spectrum and decay of the doubly charged water ion. The Journal of chemical physics. 1986;84:3189–94. [Google Scholar]
- [112].Grosswendt B, Waibel E. Transport of low energy electrons in nitrogen and air. Nuclear Instruments and Methods. 1978;155:145–56. [Google Scholar]
- [113].Michaud M, Wen A, Sanche L. Cross sections for low-energy (1–100 eV) electron elastic and inelastic scattering in amorphous ice. Radiation research. 2003;159:3–22. [DOI] [PubMed] [Google Scholar]
- [114].Michaud M, Sanche L. Absolute vibrational excitation cross sections for slow-electron (1–18 eV) scattering in solid H2O. Physical review A, General physics. 1987;36:4684–99. [DOI] [PubMed] [Google Scholar]
- [115].Bartels DM, Gosztola D, Jonah CD. Spur Decay Kinetics of the Solvated Electron in Heavy Water Radiolysis. The Journal of Physical Chemistry A. 2001;105:8069–72. [Google Scholar]
- [116].Pastina B, LaVerne JA, Pimblott SM. Dependence of Molecular Hydrogen Formation in Water on Scavengers of the Precursor to the Hydrated Electron. The Journal of Physical Chemistry A. 1999;103:5841–6. [Google Scholar]
- [117].Goorley T, James M, Booth T, Brown F, Bull J, Cox LJ, et al. Initial MCNP6 Release Overview. Nuclear Technology. 2012;180:298–315. [Google Scholar]
- [118].X-5 Monte Carlo Team. MCNP - A General Monte Carlo N-Particle Transport Code, Version 5 -Volume I: Overview and Theory. Report LA-UR-03–1987. Los Alamos National Laboratory; Revised February, 2008. [Google Scholar]
- [119].Pelowitz D MCNPX User’s Manual, Version 2.7.0. Report LA–CP–11–00438: Los Alamos National Laboratory; 2011. [Google Scholar]
- [120].Hughes HG. Recent developments in low-energy electron/photon transport for MCNP6. Progress in Nuclear Science and Technology. 2014;4 454–8. [Google Scholar]
- [121].Antoni R, Bourgois L. Evaluation of the new electron-transport algorithm in MCNP6.1 for the simulation of dose point kernel in water. Nuclear Inst and Methods in Physics Research. 2017;B 412:102–8. [Google Scholar]
- [122].Poskus A Evaluation of computational models and cross sections used by MCNP6 for simulation of electron backscattering. Nuclear Instruments and Methods in Physics Research. 2016;B 368 15–27. [Google Scholar]