

Supplemental Digital Content is available in the text.
Keywords: cardiac hypertrophy, coronary vessels, endothelial cells, haploinsufficiency, quiescence, tamoxifen, telomerase
Objective:
Nanog is expressed in adult endothelial cells (ECs) at a low-level, however, its functional significance is not known. The goal of our study was to elucidate the role of Nanog in adult ECs using a genetically engineered mouse model system.
Approach and Results:
Biochemical analyses showed that Nanog is expressed in both adult human and mouse tissues. Primary ECs isolated from adult mice showed detectable levels of Nanog, Tert (telomerase reverse transcriptase), and eNos (endothelial nitric oxide synthase). Wnt3a (Wnt family member 3A) increased the expression of Nanog and hTERT (human telomerase reverse transcriptase) in ECs and increased telomerase activity in these cells. In a chromatin immunoprecipitation experiment, Nanog directly bound to the hTERT and eNOS promoter/enhancer DNA elements, thereby regulating their transcription. Administration of low-dose tamoxifen to ROSAmT/mG::Nanogfl/+::Cdh5CreERT2 mice induced deletion of a single Nanog allele, simultaneously labeling ECs with green fluorescent protein and resulting in decreased Tert and eNos levels. Histological and morphometric analyses of heart tissue sections prepared from these mice revealed cell death, microvascular rarefaction, and increased fibrosis in cardiac vessels. Accordingly, EC-specific Nanog-haploinsufficiency resulted in impaired EC homeostasis and angiogenesis. Conversely, re-expression of cDNA encoding the hTERT in Nanog-depleted ECs, in part, restored the effect of loss of Nanog.
Conclusions:
We showed that low-level Nanog expression is required for normal EC homeostasis and angiogenesis in adulthood.
Highlights.
Nanog is expressed in low-level in adult human and mouse vascular endothelial cells.
Single Nanog allele deletion induced apoptosis of endothelial cells, cardiac microvessel rarefaction, enlarged cardiomyocytes, and cardiac hypertrophy.
Nanog bound to the hTERT (human telomerase reverse transcriptase)-, eNOS-, and Flk1-promoters/enhancers in response to Wnt3a stimulation.
Re-expression of hTERT-cDNA into Nanog-deficient endothelial cells, in part, protected from apoptosis and restored the angiogenic activities of these cells.
The emergence of endothelial cell (EC) is coordinated by temporally and spatially regulated expression of several TFs (transcription factors), leading to the development of vascularized tissues and organs.1–3 Several different TFs have been shown to regulate the development of ECs during embryonic growth.1–3 These developmentally regulated TFs are not expressed at a high-level in adult ECs, however, their diminished expression and function strongly correlate with decreased EC activities. For example, the expression of the Nanog is enriched in the aorta-gonad-mesonephros4 and during angiogenic spouting.5 Thus, Nanog expression can be detected at low-levels in adult ECs. However, the biological significance of such low-level Nanog expression in adult ECs remains unknown.
Nanog is a homeodomain-containing, DNA-binding TF involved in stem cell self-renewal and pluripotency.6–9 Nanog is expressed in proliferating epithelia for only a short period of time.10 Nanog seemingly does not function as a classic oncogene, as there are no reports of gain-of-function Nanog mutations in human tumors.11 Adult cardiomyocytes and ECs exhibit low or insignificant regenerative capacity,1,3,12–14 and this reduced ability to regenerate is likely due to chronic vascular inflammation, EC dysfunction, and telomere attrition,14–17 all of these processes could disrupt normal EC activities. Consequently, these events contribute to an increased risk of pathological cardiac hypertrophy and diastolic heart failure.18–22 However, the EC-specific role of Nanog in these processes remains unknown.
The receptors, ligands, and intracellular components of canonical Wnt signaling pathway are found in ECs in several different vascular beds13,17,23,24; therefore, we hypothesized that embryonic genes such as Nanog might be expressed in adult tissues. In the heart, the interaction between cardiac ECs and cardiomyocytes is necessary for normal cardiovascular function.23–26 Soluble factors, including NRG1 (neuregulin-1), Wnt3a (Wnt family member 3A), VEGF (vascular endothelial growth factor), and angiopoietin, are known to preserve EC–cardiomyocyte interactions in the adult heart.24–26 Similar to vascular ECs, cardiac ECs express and release autocrine and paracrine factors, such as angiotensin II, endothelial natriuretic peptide, endothelin, and nitric oxide (NO). Together, these factors power cardiac metabolism and contractile function.25–27 An increased risk of cardiac hypertrophy and heart failure is often associated with chronic vascular inflammation, reduced TERT (telomerase reverse transcriptase) expression and its diminished enzymatic activity, decreased eNOS (endothelial NO synthase) or reduced NO bioavailability, and impaired metabolic activities.28–31 eNOS has been suggested to modulate Wnt3a/β-catenin signaling in ECs to prevent unwanted β-catenin-mediated transcriptional activities.32 In addition, telomerase is a key component of the ribonucleoprotein complex that catalyzes the addition of TTAGGG to the 3′ ends of DNA.30,33,34 However, the mechanistic relationships of EC-Nanog with hTERT (human telomerase reverse transcriptase) and eNOS have not been reported. As there is no previous report of Nanog haploinsufficiency in a mouse model system, we generated EC-specific Nanog haploinsufficient mice to address the relationship of Nanog, hTERT, and eNOS in the regulation of cardiovascular function. Specifically, we employed single allele deletion strategy, demonstrated that the EC-specific loss of Nanog effectively impaired EC homeostasis, microvascular rarefaction, and angiogenesis in the absence of any lethal experimental injury, and take a paradigm forward highlighting the significance of low-level Nanog expression in ECs into further proof-of-concept studies in mice.
Materials and Methods
All data, methods, and online supporting materials have been provided with the published article.
Antibodies and Reagents
Human and mouse multiple tissue proteins premade Western blots (WB) were purchased from Pro-Sci (Poway, CA). Recombinant human Wnt3a (5036-WN) was purchased from R&D Systems (Minneapolis, MN); growth factor-reduced Matrigel (No. 356237) bought from BD Biosciences (San Jose, CA). TAM (tamoxifen; T5648), corn oil (C8267), were purchased from Sigma-Aldrich (St. Louis, MO). Mouse anti-CD31 (JC70A) was obtained from Dako (Santa Clara, CA). Rabbit anti-Nanog (A300-397A) was purchased from Bethyl Laboratories (Montgomery, TX). Rabbit anti-Nanog (Nb100-58842) bought from Novus Biologicals (Littleton, CO). Rat anti-CD45 (I3/2.3), rat-anti-CD31 (MEC7.46), and rabbit anti-Nanog (ab21624) were purchased from Abcam, (Cambridge, MA). Mouse anti-β-catenin (E5), mouse anti-VE-cadherin (SC-9989), mouse anti-GAPDH (GAPDH) (4G5), rabbit anti-TERT (Sc-7212), and goat anti-TERT (Sc-7215), Santa Cruz Biotechnology (Dallas, TX). Rabbit anti-VWF (von Willebrand factor; AB7356) were purchased from EMDMillipore (Billerica, MA). Rabbit anti-VEGFR2/FLK1 (fetal liver kinase-1; C-1158), rabbit anti-GAPDH (mAb No. 14C10), rabbit anti-eNOS (D9A5L), rabbit anti-HA (C29F4), anti-GRB2 (No. 3972), rabbit anti-Cleaved Caspase-3 (Asp175), from Cell Signaling (Danvers, MA). Mouse anti-Tubulin (No. 657402) was purchased from BioLegend (San Diego, CA). HRP (horseradish peroxidase)-conjugated secondary goat anti-mouse, donkey anti-rabbit antibodies were purchased from BioRad (Hercules, CA). Donkey anti-rabbit Alexa Flour-594, chicken anti-rabbit Alexa Fluor-647, and anti-mouse Alexa Flour-488 antibodies were purchased from Invitrogen (Carlsbad, CA).
Animal Experiments
All animal studies were approved by the University of Illinois at Chicago Animal Care Committee and compliant with the National Institutes of Health (NIH) guidelines (guide for the care and use of laboratory animals) and the guidelines from Directive 2010/63/EU of the European Parliament on the protection of animals used for scientific purposes. C57BL/6 N-Nanogtm1a(KOMP)Wtsi mice were genetically engineered to allow inducible deletion of the exon-2 and -3 of Nanog allele in a tissue-specific and a timed manner. The C57BL/6 N-Nanogtm1a(KOMP)Wtsi mice (Project ID: CSD33934) were produced as a part of the NIH Common Fund’s Knockout Mouse Phenotyping Program at the University of California (Davis, CA). The C57BL/6 N-Nanogtm1a(KOMP)Wtsi mice were procured by us through a material-transfer agreement from the UC Davis. Both male and female heterozygous mutant mice ranging from 8 to 12 weeks of age were used for experiments, and no randomization used or no animals were excluded from this study. Gt(ROSA)26Sortm4(ACTB-tdTomato,-EGFP)Luo/J (stock No. 007576, hereafter called ROSAmT/mG) mice35 was purchased from the Jackson Laboratory (Bar Harbor, ME). This dual-fluorescent Cre-reporter mouse line expresses the membrane-targeted tandem-dimer (td) Tomato (mT) before Cre-mediated excision, and membrane-targeted GFP (green fluorescent protein or simply mG) after excision.35 The tg.Cdh5(PAC)CreERT2 also called Tg:VE-cadherin-(PAC)CreERT2 transgenic mice produced by Ralph H. Adams (UK Cancer Research, London, UK). After administration with a low-dose of TAM (2 mg/kg body weight [BW]), all ECs (expressing EC-specific Cdh5CreERT2) fluoresce green due to mG expression, whereas non-ECs tomato-red due to baseline expression of mT. Therefore, the incorporation of EC-specific Cdh5CreERT2 allowed us to distinguish ECs (mG, green) from non-ECs (mT, red).36,37 Thus, through a series of crossbreeding experiments, we prepared ROSAmT/mG::Nanogfl/+::Cdh5CreERT2 Genetically Engineered Mouse Model. For genotyping, genomic DNAs prepared from tail samples of Nanogfloxed, Cdh5CreERT2, and ROSAmT/mG mice were polymerase chain reaction (PCR)-amplified. The cassette- and allele-specific primers used for genotyping are listed in Tables I and II in the Data Supplement. The loss of Nanog were visualized through confocal microscopy analysis for the presence of a GFP signal after administration of TAM (2 mg/kg BW). To verify the fidelity of TAM-induced EC-Nanog allelic loss, mouse myocardial ECs were examined by immunoblotting with anti-Nanog antibody.
In Vivo Cardiac Imaging and Euthanasia
Echocardiographic evaluation was performed as previously described by using a Vevo-2100 (VisualSonics, Toronto, ON, Canada).38,39 Briefly, mice were anesthetized with 1.5% isoflurane mixed with 100% oxygen delivered through a nose cone. The depth of anesthesia was monitored based on the absence of a toe-pinch reflex. Body temperature was monitored using a rectal thermometer and was maintained at 37°C by using the heated stage of the equipment. Subsequently, ventricle measurements were taken from the parasternal long axis, short axis, apical and arch view. Left ventricular internal dimension was taken from the parasternal long and short axis view at the level of the papillary muscles. The measurements and calculations were averaged from 3 consecutive cycles as previously described.38,39 Right ventricle (RV) weight was measured by excising heart and dissecting into the right and left ventricle and the septum. RVH was measured as the ratio of RV weight over combined weight of left ventricle and septum (RV/left ventricle+S). For euthanasia of experimental animals, we used 100% CO2 (CO2 asphyxiation) gas supplied by monitored flow from a gas tank, followed by cervical dislocation after the cessation of vital signs as recommended by the Panel on Euthanasia of the American Veterinary Medical Association.
Histology and Immunohistochemistry
For immunohistochemistry, hearts sections of 5 to 6 µm thickness were co-stained with TUNEL (terminal deoxynucleotidyl transferase dUTP nick-end labeling) and VWF using kit from Millipore (S7110) as previously described.5,40–43 Secondary donkey anti-rabbit-647 alexa flour was used to detect VWF+vascular structures. Fluorescence images (63×) were captured using a Zeiss LSM 880 confocal microscope (Carl Zeiss AG, Oberkochen, Germany) and analyzed using Zen 2011 software (Carl Zeiss AG). H&E staining and Masson trichrome staining was performed at the University of Illinois at Chicago histology core facility. Five fields from control and target heart sections were evaluated with an Olympus BX51/IX70 fluorescence microscope (Olympus, Tokyo, Japan). Morphometric analyses of the hearts were assessed using NIH-ImageJ software (Bethesda, MD) as previously described.5,40–43 To assess cardiomyocyte area, heart sections were stained with WGA (wheat germ agglutinin)-Texas RedX conjugate (W21405, ThermoScientific, Waltham, MA). Paraffin section were de-parafinized, dehydrated, permeabilized with Triton-X 100 and incubated with 2 µg/mL WGA-Texas Red-X conjugate, and washed. Images were examined and captured using BX51 Olympus microscope. Cardiomyocyte area was quantified using the NIH ImageJ software.
Wnt3a Stimulation, Cell Biology, and Western Blotting
To activate canonical Wnt signaling pathway, we used Wnt3a (50 ng/mL) to stimulate ECs as previously described.5,40 Human and mouse custom-made WBs were purchased from Pro-Sci, Inc Poway, CA. Human umbilical vein ECs (HUVECs), human aortic ECs, human pulmonary arterial ECs were purchased from Lonza (Allendale, NJ) and cultured for up to 3 to 5 passages as previously described.5,40,41 Human saphenous vein ECs were obtained from PromoCell (Heidelberg, Germany) and cultured as described.5,43 Methods for isolation of primary ECs from mouse organs have been previously described (and please see below).42,43 Briefly, mice were anesthetized through isoflurane inhalation and then hearts were excised and washed in 1× ice-cold PBS. The collected hearts were minced in ice-cold DMEM and transferred to collagenase/dispase digestion solution and incubated at 37°C. For isolation of CD31+ and CD45− ECs, please see below. Western blotting methods have been previously described.40–43 Unless specifically described, we used the term ECs for HUVECs.
Telomerase Activity Assay
Telomerase activity in ECs was determined using a Trapeze kit (S7700, Millipore). Nonsynchronously growing ECs were stimulated with Wnt3a (50 ng/mL) for 6 and 12 hours, and then cell lysates were prepared using the 1×CHAPS lysis buffer provided with the kit. Telomerase activity was estimated using 1.5 µg protein. Heat-inactivated cell extracts were used as the negative control. Amplified products were run on 12% vertical polyacrylamide gels, stained with ethidium bromide, and imaged using a Fotodyne system (Hartland, WI).
Immunostaining and Microscopy
These methods have been described previously.5,42,43 Briefly, monolayer ECs were stimulated with Wnt3a (50 ng/mL) for 6 hours and then hTERT nuclear localization was imaged (at 40×) using an Olympus BX51 microscope at room temperature, and multiple images were analyzed using Zen 2011 software (Carl Zeiss AG). Images of freshly excised whole hearts were captured using a Samsung Galaxy S7, with magnification set at 2.5×. Raw images were saved as czi, TIFF, or EPS documents, and all figures were assembled using QuarkExpress 2016 and Adobe Photoshop 2017.
Chromatin Immunoprecipitation Assay
Chromatin immunoprecipitation experiments have been previously described by us.5,40 In brief, monolayer ECs were cultured in 15-cm dishes and stimulated with Wnt3a for 18 hours, after which 1% formaldehyde was added to the dish, and a chromatin solution was prepared through sonication (Covaris S2, Woburn, MA). Diluted chromatin samples were immunoprecipitated with rabbit anti-Nanog (Novus Biologicals) and isotype-control rabbit IgG (Sc-2345, Santa Cruz Biotechnology, Santa Cruz, CA). Promoter-specific binding of Nanog was analyzed by amplifying a 1500 bp hTERT promoter fragment by using primers: forward, 5′-AAGTCCATCCCTCCTACTCTACTG-3′; and reverse, 5′-TTTCTCTTTGCAGGTTCTCAGG-3′. The immunoprecipitated chromatin with anti-Nanog antibody was quantified using SYBR Green master mix (Applied Biosystems No. 4385612) and data analyzed using Expression Suite software.
Transfection Experiments and Luciferase-Reporter Assays
The hTERT promoter reporter plasmids were custom designed by GeneCopoeia (Rockville, MD). Briefly, 3 truncated hTERT promoter fragments, 1701, 1309, and 636 bp in length and containing 6, 1, and 0 NBEs (Nanog-binding elements) respectively, were cloned into the pEZX-LvG04 dual-reporter plasmid. Lentivirus containing the truncated promoter fragments was generated using methods previously described by us5,40; 1 mL of the viral soup was used to infect one 35-mm dish of randomly growing ECs, and at 18 hours post-transfection, the cells were stimulated with Wnt3a (50 ng/mL) for 6 hours. Subsequently, 200 μL of culture medium was collected and the luciferase activity was measured using a Secrete-Pair kit (LF031, GeneCopoeia). For knockdown experiments, ECs were concurrently infected with or without Nanog shRNA and the 1701 bp TERT fragment containing 6 NBEs, and then stimulated with Wnt3a as previously described.5,40,41 Luciferase activity was normalized relative to constitutively expressed SEAP (secreted alkaline phosphatase) activity, and data are presented as fold-luciferase activity.
Preparation of Lentivirus and Adenovirus Constructs and Viral Particle
Lentivirus encoding control shRNA and Nanog-shRNA were purchased from Origene (Rockville, MD), and high-titer lentiviral particles were processed as previously described.5,40–43 Cell culture media containing pLentivirus control shRNA and 2 separate Nanog-shRNA constructs were mixed in 1:1 ratio before infecting ECs. HA-tagged human cDNA encoding Nanog was subcloned into pLCNX2 (Lot: 102036S-2/T98134, GenScript, Piscataway, NJ) and transfected into second generation Phoenix-Ampho 293T packaging cell line. hTERT-HA construct was prepared by Genscript and correctness of DNA sequence was verfied by DNA sequencing (Genscript). hTERT-HA-adeno associated virus (AAV9) viral particles at 1×10¹³/mL concentration were custom supplied by VectorBiolabs (Malvern, PA). Cell culture supernatants containing viral particles were collected after 48 hours post-transfection and were used to infect primary human ECs. Total cell lysates were prepared after 48 hours of infection and probed with various antibodies.
Isolation of Mouse Primary ECs, Gene Expression, Proliferation, Apoptosis, and 2-Dimensional Matrigel Assay
Isolation of CD31+ and CD45− primary mouse ECs from heart, lung, and brain tissues were performed as previously described.40,42,43 Briefly, heart, lung, and brain tissues were minced in cold PBS and transferred to warm tissue digestion solution containing (10 mg/mL BSA, 1 mg/mL collagenase type IV, 1 U dispase I in DMEM media) in a 37°C incubator, gently stirred for 42 minutes with a sterile stirring bar. Media containing the minced tissues were passed through a 16G syringe every 4 minutes. Thereafter, digested tissue was passed through a sterile 70 µm nylon filter, to remove debris and cellular aggregates. Cells were pelleted and washed with 0.1% BSA in cold PBS, pH 7.4 two times. Thereafter, cell suspension was mixed with CD45 coated Dynabeads and placed in a nutator in 4°C for 20 minutes. The cell-antibody-bead complex was subjected to magnetic separation with CD45 antibody coupled-beads and CD31 antibody linked beads. Next, the cells in suspensions were saved and mixed with CD31 coated microbeads (No. 130-097-418, Miltenyi Biotech) and placed in a nutator in 4°C for 20 minutes. CD31+ ECs were released from the beads by incubating with 0.05% trypsin for 3 minutes at 37°C, thereafter used for all downstream experiments. In addition, EC characteristics were confirmed by anti-VE-cadherin staining.38,40,41 Primary ECs were maintained at 37°C in a humidified 5% CO2 and 95% air. All experiments were performed using primary ECs at passage 3 to 4. mRNA preparation and quantitative reverse transcription-PCR have been previously described by us.5,40,43 All purified oligonucleotide primers (Tables I and II in the Data Supplement) were synthesized by IDT DNA (Coralville, IA). 5′-bromo-2′-deoxyuridine incorporation assays were performed as previously.5,40 For quantification, NIH-ImageJ software was used. For cell death assays, ECs were transfected with control and Nanog shRNAs, and at 48 hours post-transfection, the percentage of cell death was quantified using the Annexin-V apoptosis-detection kit APC (88-8007-72; eBioscience, San Diego, CA), as described.40–43 Cells were sorted using a Beckman-Coulter flow cytometer (Brea, CA). Experiments were performed at least 3×.
Measurement of Plasma Levels of Cytokines
For estimation of cytokine elaboration, blood samples from mice receiving vehicle control alone (corn oil) or TAM (2.0 mg/kg BW) were collected 3 weeks after the last TAM administration. Blood samples were collected at the same time points in all groups. Plasma was separated, aliquoted, thereafter TNFα (tumor necrosis factor), IL-1β (interleukin-1), and IL-6 were determined by a sandwich ELISA (Thermo-Fisher, Rockford, IL), based on a monoclonal–monoclonal antibody pair and a biotin–streptavidin amplification system. The sensitivities of the assays for IL-1β and IL-6 were 1.0 pg/mL and for TNF-α was 5.0 pg/mL. Intra- and inter-assay coefficients of variation were <10% for both cytokines. Data were evaluated by ANOVA, 2-tailed Student t test for paired data, and Pearson correlation test, where indicated.
Statistical Analyses
Statistical analyses were performed using GraphPad Prism 6.0 (GraphPad Software, La Jolla, CA). Initially, data were tested for normality and equal variance to confirm the appropriateness of parametric tests. Parametric data were analyzed by 2-tailed Student t test. An unpaired Student t test was used for comparisons between 2 groups, and ANOVA followed by Tukey or Sidak test was used for multiple comparisons. All data points represent mean±S.D. Number of experiments or number of animals represents biological replicates. Tests used are specified in the legend of each figure, a value of P<0.05 was considered statistically significant.
Results
Adult ECs Express Low Levels of Nanog and hTERT
To explore the status of Nanog expression in adult organs, we used premade WBs prepared from human (50+ years old male) and mouse (3 months old, male and female) tissues. WB analyses of total protein extracts prepared from adult human tissues revealed low levels of expression of the ≈38 kDa Nanog proteins (Figure 1A). The equal loading of proteins across lanes was verified by Grb2 expression (Figure 1B). We used Grb2 as a control, because in our subsequent experiments Grb2 expression remained unchanged after Nanog deletion. Next, we found the expression of Nanog in most adult mouse tissues (Figure 1C), where the anti-Nanog antibody detected ≈38 kDa immunoreactive proteins (Figure 1C). The identities of fast-moving anti-Nanog immunoreactive species in brain, heart, kidney, and spleen (below ≈36 kDa) represent unknown proteins. Anti-tubulin antibody was used to assess the equal loading of proteins across the lanes (Figure 1D). In addition, publicly available expression analysis data (Expression Atlas, www.ebi.ac.uk/gxa/home) suggest that Nanog is present in most tissues obtained from 4 different mouse strains examined (Figure IA in the Data Supplement). Publicly available RNA-seq data show that Nanog is present in mouse heart and lung tissues (Figure IB in the Data Supplement). Next, we isolated primary CD31+/CD45− ECs from heart, lung, and brain tissues from 2, 6, 10, and 14 weeks old mice, prepared protein extracts, thereafter determined the expression of Nanog, Tert, eNos, and VE-cadherin (Figure 1E, please see methods for CD31+/CD45− isolation procedures). In these cells, we observed low level Nanog expression in all 3 tissues examined, and the EC-specific Nanog expression can be detected until 14 weeks (Figure 1E). The expression of Tert in these ECs gradually declined beginning week 10, while the expression of eNos declined after week 14. However, VE-cadherin and Gapdh levels did not change (Figure 1E). The EC characteristics of CD31+/CD45− isolated mouse cells were determined by VE-cadherin staining (Figure 1F). These data demonstrate that Nanog, Tert, and eNos are likely present in several postnatal and adult tissues, and that a subpopulation of adult ECs expresses Nanog protein. Next, we isolated primary CD31+/CD45− ECs form 6 to 8 weeks old mouse heart and lung tissues, cultured for 3 passages, thereafter, either left untreated or treated with Wnt3a (50 ng/mL). Thereafter, CD31+/CD45− ECs prepared from mouse heart and lung mRNAs were subjected to q-RT-PCR assay using mouse Nanog, Tert, and eNos gene-specific primers (Table I ). We observed that ECs expressed low level of Nanog, Tert, and eNos mRNAs at the basal level, but their expression became pronounced after Wnt3a stimulation (Figure IC and ID in the Data Supplement). Thus, primary ECs express low level of Nanog, Tert, and eNos, but can be elevated from low to higher level after Wnt3a stimulation.
Figure 1.

Expression analyses of Nanog. A, Commercially available, premade Western blot (WB) prepared from indicated multiple tissues (50+ years old male) were analyzed with an anti-Nanog antibody. The numbers below the top indicate signal intensities. B, Relative protein sample loading was verified by the expression of the Grb2 protein. The data are representative of 3 independent experiments. C, Total protein extracts prepared from adult mice (3 mo old, male and female pooled) tissues were analyzed with an anti-Nanog antibody. The numbers below represent signal intensities. D, Protein loading was verified by the expression of β-Tubulin protein. The data are representative of 3 independent experiments. E, Protein extracts prepared from CD31+/CD45− endothelial cells (ECs) at passage 3 from indicated tissues (H, heart, L, lung, and B, brain) obtained from 2, 6, 10, and 14 wk old mice were analyzed by WB with indicated antibodies. Nanog is expressed in all 3 tissues examined and the EC-specific Nanog can be detected until 14 wk. Tert (telomerase reverse transcriptase) in ECs declined beginning week 10, while the expression of eNos declined very moderately after week 14. There was no change in VE-cadherin and Gapdh levels. Experiments were repeated at least 3×. The numbers below the WB panels indicate relative signal intensities. F, Representative images of EC characteristics of mouse ECs obtained from indicated tissues were determined by anti-mouse VE-cadherin (Texas red) staining; nuclear Propidium iodide (green). Magnification, 40×; scale bar, 150 μm.
What regulates the expression of Nanog in ECs? To address this question, primary ECs obtained from human heart tissues were stimulated with Wnt3a (50 ng/mL) for 6 hours in presence of serum and VEGF (5 ng/mL; Figure 2A). Quantitative RT-PCR analysis of mRNAs prepared from human heart revealed increased levels of Nanog, hTERT, and eNOS mRNAs (Table I in the Data Supplement and Figure 2A). WB analyses showed increased Nanog, TERT, and eNOS protein levels in HUVECs that received Wnt3a for 6 hours, and β-catenin, a key intracellular signaling component of the canonical Wnt3a signaling pathway, was also increased (Figure 2B). Microscopy of HUVECs stained with VE-cadherin (green) and hTERT (red) revealed increased hTERT in EC nuclei receiving Wnt3a relative to controls (Figure 2C). Microscopic analyses showed partial distribution of hTERT in the cytoplasm. Does the increase in hTERT protein level correlate with its increased enzymatic activity? To address this question, we measured the telomerase enzymatic activity in control and Wnt3a-stimulated ECs. Telomerase activity was induced in ECs by Wnt3a in a time-dependent manner, which diminished within 12 hours (Figure 2D and 2E). These results indicate that Wnt3a induces robust expression of hTERT and eNOS in HUVECs and also upregulates telomerase activity, as there was no appreciable telomerase activity in the absence of Wnt3a.
Figure 2.

Wnt3a (Wnt family member 3A) induces increased Nanog, hTERT (human telomerase reverse transcriptase), and eNOS (endothelial nitric oxide synthase) expressions, and telomerase activity in human umbilical vein endothelial cells (HUVECs). A, Timeline of HUVECs stimulation and quantitative reverse transcription polymerase chain reaction (qRT-PCR) analysis. Total mRNA prepared from control HUVECs and HUVECs stimulated with Wnt3a (50 ng/mL) for 6 h was subjected to qRT-PCR analyses for Nanog, hTERT, and eNOS expression, which revealed a significant increase in mRNA expression after Wnt3a stimulation relative to control. *P<0.05 and ***P<0.001. P values are from Student t-tests. Data are shown as mean±SD obtained from n=3 independent experiments. B, Total cell lysates prepared from control and Wnt3a-stimulated endothelial cells (Ecs) were analyzed by Western blot (WB) with the indicated antibodies. Wnt3a stimulation increased the expression of Nanog, hTERT and eNOS by 6 h, together with that of β-cadherin, used as a positive control. GAPDH was used as the loading control. The numbers below the top 4 represent WB signal intensities in arbitrary units, obtained following NIH-ImageJ analyses. C, Control (top) and Wnt3a-stimulated (bottom) HUVECs were subjected to anti-hTERT (red) and anti-VE-cadherin (green) staining; the images (40× magnification) show increased nuclear accumulation of hTERT. D, HUVECs receiving Wnt3a for 6 h showed increased telomerase activity (arrows); the telomerase activities declined by 12 h, whereas control ECs showed no activity. For optimal resolution and clarity of telomerase-amplified products, we have provided an inverted image (D). E, Unaltered image of the ethidium bromide-stained agarose gel showing PCR products obtained as a result of telomerase activities; experiments were repeated at least 3×. DAPI indicates 4′,6-diamidino-2-phenylindole; and TSR, telomere synthetic repeat.
Nanog Binds to the hTERT Promoter and Activates hTERT Transcription
What is the relationship between Nanog and hTERT? To address this question, we analyzed the promoter/enhancer region −3.6 kb upstream of the transcription start site. We identified 16 putative Nanog-binding (-ATTA-) elements (NBEs) in the hTERT promoter (Figure II in the Data Supplement). To determine whether Nanog binds to these putative NBEs in the hTERT promoter, we prepared chromatin from control and Wnt3a-stimulated HUVECs and performed chromatin immunoprecipitation assays (Figure 3A through 3C). Chromatin samples were immunoprecipitated with isotype-control IgG or anti-Nanog antibody, thereafter the eluted DNA subjected to PCR using primers specifically designed to amplify a 1550 bp region of the hTERT promoter (Figure II in the Data Supplement). As expected, Nanog binding to the hTERT promoter was significantly higher in Wnt3a-stimulated cells, whereas there was no detectable binding in control HUVECs (Figure 3B and 3C). Next, we designed transfection experiments (Figure 3D); accordingly, we prepared a series of 5′-deletion dual-promoter reporter constructs featuring a common 3′ terminus at nucleotide -1 relative to the transcription start site (Figure 3E), and transiently expressed these reporter constructs in HUVECs. Promoter activity was assayed by measuring luciferase activity, normalized to the constitutively expressed secreted alkaline phosphatase (Figure 3E). The HUVECs receiving Wnt3a, the p(−1701 bp)Luc construct harboring 6 NBEs, showed significantly increased fold luciferase activity relative to controls (Figure 3E). In contrast, constructs containing either a single binding site [p(−1309 bp)Luc] or no binding sites [p(−636 bp)Luc] had minimal luciferase activity (Figure 3E). To test whether Wnt3a-induced Nanog expression was responsible for activating hTERT transcription, we cotransfected cells with the p(−1701 bp)Luc construct, with either control or Nanog shRNA. In Wnt3a-stimulated cells, the luciferase activity was significantly reduced in Nanog-depleted HUVECs relative to control HUVECs (Figure 3F). There was a detectable low level of Luc activity in control HUVECs, suggesting that there might be basal transcription factor(s) that could also activate the Nanog promoter at the baseline level. These results demonstrate that Nanog directly occupies the –ATTA- DNA sequence in the genome proximal to the hTERT promoter and modulates its transcription.
Figure 3.

Nanog mediates hTERT (human telomerase reverse transcriptase) expression in human umbilical vein endothelial cells (HUVECs). A, Timeline of HUVECs stimulation with no Wnt3a (Wnt family member 3A; vehicle control) or with Wnt3a (50 ng/mL) and chromatin immunoprecipitation polymerase chain reaction (ChIP-PCR) assay. Β, Quantitative PCR analyses for Nanog occupancy of the hTERT promoter. Nanog DNA complexes obtained from control and HUVECs receiving Wnt3a for 18 h were immunoprecipitated with an anti-Nanog antibody and isotype-control anti-IgG. Promoter-specific binding in the −1.5 kb region of the hTERT promoter DNA was significantly higher in Wnt3a-stimulated ECs relative to control (*P<0.05 vs control). C, The eluted ChIP was PCR-amplified with hTERT promoter-specific primers, and the PCR products were separated on a 2% gel; the results show positive amplification at ≈1500 bp, indicating Nanog binding to the hTERT promoter/enhancer in response to Wnt3a stimulation. D, Timeline of EC transfection and measurement of luciferase activity in response to Wnt3a (50 ng/mL). E, Promoter/enhancer deletion constructs containing 6, 1, and 0 Nanog-binding elements (NBEs) were prepared, in which ▸ indicates the location of putative Nanog-binding sites in the promoter/enhancer DNA strand in the 5′-3′ direction, whereas ◂ indicates the reverse strand (3′-5′). The HUVECs were transfected overnight (18 h) before being stimulated with Wnt3a for 6 h. Luciferase activity was measured in media collected at 6 h and normalized relative to constitutively expressed secreted alkaline phosphatase activity; the results are shown as fold-luciferase activity. E, Wnt3a mediated luciferase activity in HUVECs expressing hTERT-promoter luciferase constructs harboring 6 and 1 NBE sites, compared with control (*P<0.05, **P<0.01, ***P <0.001 vs control). Data are shown as mean±SD collected from 3 independent experiments (n=3). F, The hTERT promoter construct containing 6 NBEs was co-transfected with or without Nanog shRNA, and the cells were stimulated with Wnt3a (50 ng/mL) for 6 h; subsequently, luciferase activity was measured as described above. Depletion of HUVECs Nanog resulted in a significant decline in Wnt3a-induced hTERT promoter activity. These experiments were repeated at least 3×. WB indicates Western blot.
Nanog Transcriptionally Regulates TERT and eNOS Expression in ECs
Next, we assessed the hTERT and eNOS mRNAs and protein levels after shRNA-mediated Nanog-knockdown. Under basal conditions, Nanog-depletion reduced hTERT and eNOS mRNA expression in HUVECs (Figure III in the Data Supplement). In our experiments, we chose to stimulate HUVECs with Wnt3a, because (1) ECs are known to express intracellular signaling components of canonical Wnt signaling pathway13,45 and (2) Nanog is a downstream target of Wnt3a signaling in stem and ECs.13,24 To evaluate the relationship of Nanog with hTERT and eNOS, we knocked-down Nanog, thereafter, stimulated HUVECs with Wnt3a. The experimental timeline is shown in Figure 4A. Control shRNA did not alter Nanog, Cyclin-D1, hTERT, VEGFR2, and eNOS expression, while Nanog knockdown decreased expression of these genes significantly in HUVECs (Figure 4B). VEGFR2 and Cyclin-D1 were included as positive controls. Accordingly, Nanog, hTERT, and eNOS protein levels significantly decreased in these cells (Figure 4C and 4D). Next, to define the role of Nanog in the direct transcriptional control of hTERT and eNOS in HUVECs, we overexpressed HA (hemagglutinin)-epitope-tagged Nanog cDNA in these cells and expression levels were analyzed in total cell extracts. Consistent with our hypothesis the expression of hTERT and eNOS increased in these cells with concomitant increased expression of 2 known Nanog targets, VEGFR2 (an EC-specific cell surface tyrosine kinase receptor) and Cyclin-D1 (Figure 4E and 4F). Collectively, these results indicate Nanog regulation of hTERT and eNOS transcriptions.
Figure 4.

Nanog governs hTERT (human telomerase reverse transcriptase) expression. A, Timeline of Nanog knockdown and quantitative reverse transcription polymerase chain reaction (qRT-PCR) analysis of total mRNAs prepared from control and Nanog-depleted endothelial cells (ECs), stimulated without/with Wnt3a (Wnt family member 3A; 50 ng/mL). B, qRT-PCR analyses of total mRNAs prepared from control and Nanog-depleted ECs treated either without or with Wnt3a revealed a significant (***P<0.001 vs control 18S rRNA from the same group) decline in the expression of hTERT and in that of the Nanog target genes Cyclin-D1 and Vegfr2 (positive controls). C, Representative Western blot (WB) images of total cell lysates prepared from control and Nanog-depleted ECs stimulated without/with Wnt3a (50 ng/mL) and immunoblotted with anti-Nanog and anti-hTERT; hTERT expression was markedly diminished. GAPDH was used as the loading control. D, Quantification of protein expression relative to GAPDH; the results show a significant reduction in hTERT expression (**P<0.01 or ***P<0.001 vs control). E, Total lysates from ECs transfected with HA-tagged Nanog cDNA were prepared after 48 h and used in WB analysis, which showed increased expression of hTERT, VEGFR2 (vascular endothelial growth factor receptor-2), and Cyclin-D1. F, Quantification of protein expression (relative to GAPDH) in control and Nanog-overexpressing cells show a significant increase in VEGFR2, hTERT, and Cyclin-D1 expression (*P<0.05 vs respective control group). Data are shown as mean±S.D. from 3 independent experiments. P values are obtained from Student t tests. eNOS indicates endothelial nitric oxide synthase.
EC-Specific Nanog Haploinsufficiency (NanogECΔHaplo) Results in Decreased Tert and eNos Expression In Vivo
We previously established that Nanog-depletion in ECs in vitro induced apoptosis of these cells.5 To interrogate the mechanistic relationship between Nanog and Tert in adult ECs, we generated mice with a TAM-inducible EC-specific single Nanog allele knockout in a ROSAmT/mG reporter background (for details please see methods, and Figure IVA through IVE in the Data Supplement). After a series of breeding and crossbreeding, siblings with several different genotypes were obtained (for genotyping primers, please see Table II in the Data Supplement); mice with inappropriate genotypes were not used. Siblings with appropriate genotype used for phenotypic analyses were (1) ROSAmT/mG, (2) ROSAmT/mG::Nanogfl/+, and (3) ROSAmT/mG::Nanogfl/+::Cdh5CreERT2 mice. Both male and female mice were used at the age of 8 to 10 weeks. After the intraperitoneal administration of a low-dose TAM (2.0 mg/kg) for 5 consecutive days, followed by a 1-week wait time (Figure VA in the Data Supplement), we verified the fidelity of the ROSAmT/mG and Cdh5CreERT2 system (Figure IVF through IVJ in the Data Supplement). Thereafter, we isolated CD31+ ECs from the control and TAM-receiving mice (Figure VB in the Data Supplement), examined mRNA expression levels using quantitative reverse transcription-PCR, which revealed decreased Nanog, Tert, and Flk1/Vefgr2 mRNA levels (Table I and Figure VB in the Data Supplement). Accordingly, WB analyses of cell lysates prepared from CD31+ cardiac ECs isolated from these mice confirmed decreased Nanog, Tert, eNos, and Flk1/Vegfr2 protein levels (Figure VC and VD in the Data Supplement). Moreover, thin cryosections (unfixed) prepared from ROSAmT/mG (−TAM, vehicle control), ROSAmT/mG::Nanogfl/+ (+TAM), and ROSAmT/mG::Nanogfl/+::Cdh5CreERT2 (+TAM) mouse hearts showed GFP-expression in the ECs, but tomato/red in non-Cre compartments, which indicated the efficiency of the high-fidelity Cdh5 (VE-cadherin) promoter-driven Cre/lox excision system (Figure VE and VF in the Data Supplement). The Cdh5CreERT2-mediated recombination labeled ECs with GFP (green), while non-ECs remained tomato (Red). To minimize autofluorescence, all cryosections were not subjected to fixatives such as paraformaldehyde or methanol. Further, CD31+ cells prepared from heart tissues from these mice were subjected to anti-VE-cadherin and anti-Nanog staining (Figure VG and VH in the Data Supplement). Microscopy of control ECs (−TAM) showed low level of Nanog (Figure VG in the Data Supplement), while TAM-administration reduced the level of Nanog in these cells (Figure VH in the Data Supplement). Importantly, these data show the ability of low-dose TAM administration (2 mg/kg BW) to induce a deletion of a single Nanog allele in these mice while simultaneously labeling the ECs as early as 7 days after the last TAM administration. Consistent with haplodeficiency, the mRNA and protein levels seen in Nanogfl/+ ECs are estimated at ≈50% and ≈30% (Figure VC and VD in the Data Supplement) levels. However, at the microscopic level the GFP-expression observed in ECs, and tomato/red in non-Cre compartments did not completely agree with protein levels determined by the Western blotting, and this discrepancy could be due to intense illumination of GFP under the UV light.
Mice With NanogECΔHaplo Show Increased Cell Death and Perivascular Fibrosis
To delineate if EC-specific Nanog deletion contributes to the development of vascular pathology, we prepared thin heart sections from control and NanogECΔHaplo mice. The timeline of this experiment is shown in Figure 5A. In both ECs and non-ECs, we found increased apoptosis, as detected by costaining of ECs with the anti-VWF antibody (magenta) and TUNEL (green) on days 7, 14, 21, and 30 (Figure 5B). Representative images of thin mouse myocardium sections are shown in Figure 5C. As apoptosis increased in the myocardial sections obtained from these mice, we also examined the extent of myocardial fibrosis. Masson trichrome staining revealed both perivascular and vascular fibrosis, which significantly increased at day 30 (Figure 5D and 5E). In parallel, Nanog depletion in cultured ECs and in vivo also resulted in an increase in Annexin-V and PI+ cells compared with control cells (Figures VA and VIB in the Data Supplement). In addition, blood samples collected from these mice were subjected to ELISA to assess cytokine elaboration that might be expected to increase in association with EC apoptosis. Cardiovascular pathology and EC apoptosis are likely both associated with perivascular and vascular fibrosis and could be due to significantly increased levels of TNFα and IL-6, but not IL-1β (Figure IVC in the Data Supplement). Quantitative analyses showed that the EC-specific loss of Nanog produces significant accumulation of TNFα and IL-6, which could additionally contribute to increased vascular fibrosis and cardiomyocyte hypertrophy in these mice.
Figure 5.

Endothelial cell (EC)-specific Nanog haploinsufficiency (NanogECΔHaplo) results in increased EC apoptosis and develop fibrosis. A, Timeline of TAM (tamoxifen) administration in control ROSAmT/mG::Nanogfl/+ and ROSAmT/mG::Nanogfl/+::Cdh5CreERT2 mice. TAM (2 mg/kg body weight) was administered intraperitoneally every 24 h for 5 consecutive days, and this was followed by wait periods of 7 days (d7), 14 days (d14), 21 days (d21), and 30 days (d30). Hearts were cut into 2 equal halves, and 5-μm-thin serial sections were prepared for microscopic analyses from cryopreserved heart tissues or for Masson trichrome staining from formalin-fixed/paraffin-embedded tissue. B, Quantification of fibrotic areas (identified in 40× magnification images) in and around vessels. The data indicate a significant increase in fibrosis at d30 in NanogECΔHaplo compared with control (***P<0.001 or ****P<0.001 vs respective control group). C, Representative Masson trichrome staining (blue) of control and NanogECΔHaplo heart sections show increased fibrosis in vascular and perivascular areas in NanogECΔHaplo heart sections. D, Quantification of TUNEL (terminal deoxynucleotidyl transferase dUTP nick-end labeling) staining in control and NanogECΔHaplo heart sections show a significant time-dependent increase in TUNEL+ cells (****P<0.001 vs control). For details, please see methods. E, Representative high-resolution confocal microscopy images (63×) of heart sections stained with anti-VWF (von Willebrand factor; magenta, EC marker) and TUNEL+ (green) cells; the results indicate widespread apoptosis in both ECs and non-ECs. Statistical significance was determined by a 1-way ANOVA with Tukey post hoc analysis. Data are shown as mean±S.D. (n=6 mice/group). We pooled data from 3 male and 3 female mice, as the cardiac pathology observed in these mice were identical.
Left Ventricular Function and Cardiac Hypertrophy in NanogECΔHaplo Mice
Disruption of normal EC homeostatic activities often give rise to cardiovascular pathology.3,13,16–18 To ensure that observed phenotype was not due to TAM (2 mg/kg BW) per se, all subsequent experiments in mice were performed 25 days after the last TAM administration (Figure 6A). As the loss of single Nanog allele showed increased apoptosis at day 30, accompanied with a significant increase in vascular and perivascular fibrotic lesions, these mice were subjected to an echocardiographic evaluation (Figure 6B through 6D). Representative M-mode tracing of control and NanogECΔHaplo mice are as shown in Figure 6B, 1 through 6B, 6. Interestingly, NanogECΔHaplo hearts showed a significant increase in diastolic parameters relative to controls, including left ventricular diameter at diastole (mm) and left ventricular volume at diastole (μL; Figure 6C and 6D), which indicated the presence of ongoing cardiac hypertrophy. Additionally, these mice displayed a decline in heart rate (Figure 6E), indicating a decline in cardiac contractility. We also observed a significant increase in cardiac output (Figure 6F) and stroke volume (µL), as shown in Figure 6G. Importantly, NanogECΔHaplo mice displayed increased right ventricular hypertrophy (Figure 6H and 6I). To assess the cardiomyocyte area and determine the extent of cardiac hypertrophy, thin sections of cardiac tissues were subjected to H&E (Figure 6J). Compared with the control, NanogECΔHaplo hearts appeared visually edematous and enlarged (Figure 6K). These observations remained consistent with significantly increased blood pressure (Figure 6L), increased heart weight (Figure 6M), no change in BW (Figure 6N), but increased cardiac index (Figure 6O) and increased cardiomyocyte area (Figure 6P) in NanogECΔHaplo mice, but not in control (Figure 6L through 6P). Further, evaluation of cross-sectional area of cardiac myocytes with WGA confirmed the presence of cardiac hypertrophy in NanogECΔHaplo, but not control mice (Figure 6P and 6Q; Figure VIII in the Data Supplement). In addition, the quantitative analyses of mRNA prepared from NanogECΔHaplo hearts revealed significant changes in the expression of Anp (atrial natriuretic peptide), Bnp (brain natriuretic peptide), Cnp (C-type natriuretic peptide), eNOS, Et-1 (endothelin-1), and Myh7 (myosin heavy chain-7), compared with controls (Figure 6R). Accordingly, we observed decreased eNos protein levels in NanogECΔHaplo mice, but not in control mice (Figure VI in the Data Supplement), and in a chromatin immunoprecipitation assay Nanog protein bound to the eNOS-promoter (Figure 6T and Figure IX in the Data Supplement). Thus, Wnt3a mediated the expression not only of hTERT, but also eNOS via Nanog’s transcriptional activities. Together, these findings strongly indicate the occurrence of ongoing cardiac hypertrophy due to decreased Nanog, Tert, and eNos levels.
Figure 6.
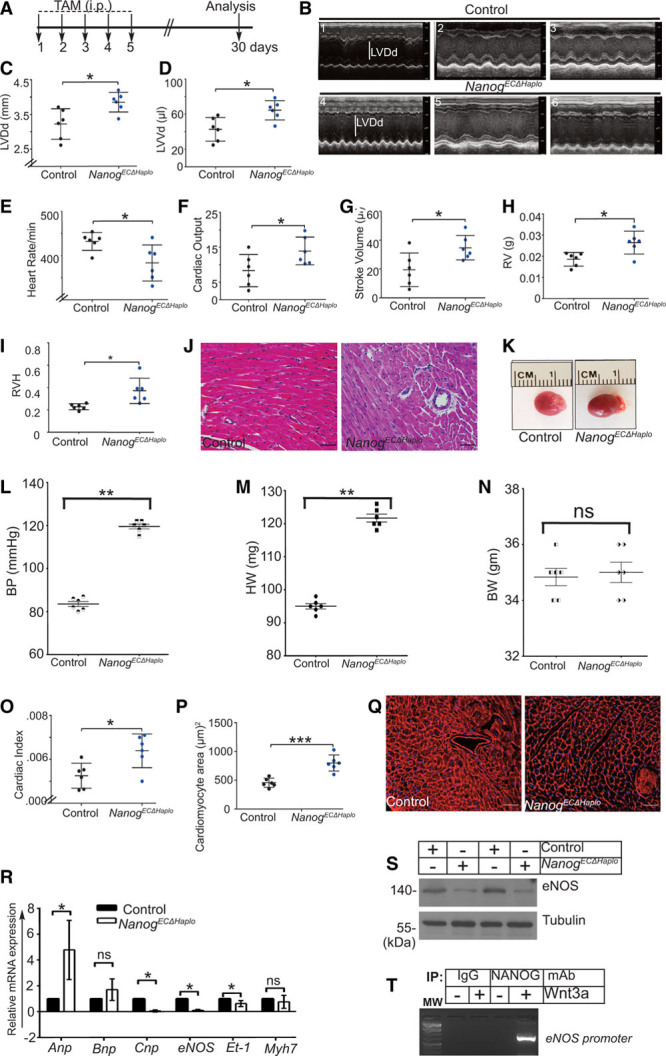
Mice with NanogECΔHaplo develop cardiac hypertrophy. A, Timeline of TAM (tamoxifen) administration in age-matched control (ROSAmT/mG::Nanogfl/+) and NanogECΔHaplo ROSAmT/mG::Nanogfl/+::Cdh5CreERT2) mice. Each mouse received 2 mg/kg TAM each day, for a total of 10 mg/kg body weight (BW) intraperitoneally (IP) for 5 consecutive days, followed by a wait period of 30 days (d30). At that point, mouse hearts were evaluated with echocardiography. B, 1–3, Three representative M-mode tracings of the cardiac chambers of control mice. Β, 4–6, Three representative M-mode tracings of the cardiac chambers of NanogECΔHaplo mice. Quantification of left ventricular (LV) parameters at diastole in control vs NanogECΔHaplo mice. C, Left ventricular diameter at diastole (LVDd) in millimeter. D, Left ventricular volume at diastole (LVVd) in microliter. E, NanogECΔHaplo mice showed a significant reduction in heart rate compared with controls. NanogECΔHaplo mice showed a significant increase in the following: (F) cardiac output, (G) stroke volume in microliter, (H) right ventricular (RV) weight in grams, and (I) right ventricular hypertrophy (RVH): ratio of RV weight to total weight of LV and septum. J, Representative H&E-stained myocardial sections from control and NanogECΔHaplo mice show the presence of larger nuclei in NanogECΔHaplo mice. K, A picture of unfixed whole hearts collected on d30 indicates control litter mate hearts or hypertrophic/enlarged hearts in mice with the NanogECΔHaplo genotype. L, NanogECΔHaplo mice show increased systolic blood pressure (BP). Values are mean±SD obtained from 6 mice (3 male, 3 female) over 5 recording sessions each. M, NanogECΔHaplo mice show increased heart weight (HW). N, No change in BW. O, Increased cardiac index (CI=LV mass/body weight) in mice with the NanogECΔHaplo genotype measured on d30 post TAM injection. P, Quantification of a cardiomyocyte cross-sectional area in control and NanogECΔHaplo mice. Q, Representative wheat germ agglutinin staining of heart sections prepared from control and NanogECΔHaplo mice show an increased cardiomyocyte area in NanogECΔHaplo mice. R, Quantitative reverse transcription polymerase chain reaction (qRT-PCR) analyses of total mRNA extracted from whole hearts indicate altered expression of molecular markers associated with cardiac hypertrophy, Anp, Bnp, Cnp, eNOS, Et-1, and Myh7 in the NanogECΔHaplo mouse group vs control. S, Representative Western blot analyses of cell extracts prepared from CD31+ endothelial cells (ECs) show decreased eNOS (endothelial nitric oxide synthase) levels in NanogECΔHaplo vs control. T, Chromatin immunoprecipitation (ChIP) assay demonstrating NANOG binding to the eNOS promoter in response to Wnt3a (Wnt family member 3A) stimulation of cardiac ECs. For in vitro analyses, n=3–4 independent experiments; for in vitro analyses, n=6 mice/group. Statistical significance was determined by a 1-way ANOVA with Tukey post hoc analysis. Data are shown as mean±SD. *P<0.05 vs control; **P<0.01 vs control; ***P<0.005 vs respective control group; ns indicates not significant. Scale bar is 50 μm. All data points were pooled from 3 male and 3 female mice (n=6) as the observed cardiac pathology were identical.
Re-Expression of hTERT in Nanog-Depleted Cardiac ECs Partially Restores the Angiogenic Activities of ECs
In addition to above results and as shown in Figure X in the Data Supplement, together strongly suggested that TERT is a downstream target of Nanog in the regulation of angiogenic activities of ECs. Presence of VEGF and bFGF (basic fibroblast growth factor) did not appreciably increase the expression of Nanog and hTERT in actively growing ECs (Figure XI in the Data Supplement). If endothelial TERT is a downstream mediator of angiogenic signals emerging from Wnt3a-induced Nanog (see Figures 2 and 3), elevating the TERT expression should restore or amplify the angiogenic activities of ECs. To test this hypothesis, we designed a rescue experiment. Accordingly, we exogenously expressed cDNA encoding hTERT into Nanog-depleted cardiac ECs, and these cells were subjected to apoptosis and angiogenic activity assays (Figure 7A). We observed increased cell proliferation, as illustrated by an increase in 5′-bromo-2′-deoxyuridine incorporation of EC nuclei in response to Wnt3a stimuli, which was significantly reduced in Nanog-depleted cardiac ECs (Figure 7B and 7C). Importantly, the re-expression of cDNA encoding hTERT in Nanog-depleted ECs partially restored proliferative activities of these cells (Figure 7B and 7C). To quantify the extent of cell death in Nanog-depleted ECs and re-expression of cDNA encoding hTERT, we examined these cells by coimmunostaining with VE-cadherin and TUNEL. As expected, shRNA-mediated Nanog depletion resulted in a significant increase in TUNEL+ cells compared with control groups (Figure 7D). Importantly, the re-expression of hTERT in Nanog-depleted cardiac ECs led to a significant reduction in TUNEL+ cells (Figure 7D and 7E). Finally, to address if a functional relationship exists between Nanog and hTERT during formation of EC branching-point structures, control ECs, control shRNA, Nanog shRNA-transfected ECs, and hTERT cDNA-transfected ECs were plated onto 2-dimensional Matrigel and stimulated overnight with Wnt3a. Importantly, Nanog-depleted ECs presented fewer branching-point structures than control ECs; however, this effect of Nanog depletion was partially restored in the hTERT re-expression experiment (Figure 7F and 7G). The efficiency of Nanog knockdown and TERT levels in the ECs were determined by WB analyses (Figure 7H). Thus, hTERT activity in ECs depends on Nanog levels and the concomitant activity of eNOS (please see Figure 7O through 7Q). Together, these results show that low level Nanog and hTERT activities regulate normal homeostatic and angiogenic activities of cardiac ECs.
Figure 7.

Re-expression of hTERT (human telomerase reverse transcriptase) in Nanog-depleted cardiac endothelial cells (Ecs) partially restores the angiogenic activity of ECs. A, Timeline of transfection, knockdown, and rescue experiments. Cardiac ECs were co-transfected overnight with either control or Nanog shRNAs and hTERT cDNA (rescue experiment). After 48 h of transfection, ECs received either vehicle alone or Wnt3a (Wnt family member 3A; 50 ng/mL), which were used for downstream experiments. B, Quantification revealed decreased BrdU+ cells in the Nanog-depleted group (**P<0.005 vs control), but hTERT re-expression (addback) partially restored the effect of NANOG depletion (*P<0.05 vs control). C Representative images of the BrdU+ nuclei in indicated groups. Dark brown color indicates BrdU+ ECs. Scale bar, 20 μm. D. Quantification of TUNEL+ (terminal deoxynucleotidyl transferase dUTP nick-end labeling) nuclei in control, NANOG shRNA, and hTERT cDNA (re-expression/rescue) groups in the absence or presence of Wnt3a. E, Representative high-resolution confocal images of cultured ECs stained with anti-VE-cadherin (red) and TUNEL (green) indicate increased TUNEL+ cells in the NANOG knockdown group. Re-expression of hTERT cDNA in the NANOG knockdown group reduced the extent of TUNEL+ cells. Scale bar is 50 μm. F, Quantification of branching-point structures following NANOG knockdown and hTERT re-expression (rescue experiment) in ECs. G, Representative images of the formation of branching-point structures (black arrows) following NANOG depletion and hTERT re-expressing ECs. H, Efficiency of NANOG knockdown and hTERT cDNA re-expression in ECs was determined by Western blot (WB) analyses with indicated antibodies. Molecular weights are shown in kilo Dalton (kDa). For in vitro analyses, n=3 independent experiments. I, The quantification of WB signal intensities obtained from at least 3 independent experiments. Statistical significance was determined by a one-way ANOVA with Tukey post hoc analysis. Ns indicates not significant. Data are shown as mean±SD. *P<0.05, **P<0.01, ***PP<0.005, and ****P<0.001 vs respective control group.
Re-Expression of hTERT into NanogECΔHaplo Mice, in Part, Restores the Effect of EC-Specific Nanog-Haplodeficiency
From above studies it became apparent that NanogECΔHaplo results in myocardial microvascular rarefaction, therefore, we hypothesized that this phenotype is likely due to decreased level of hTERT. To address this hypothesis, next we performed a rescue experiment in which NanogECΔHaplo mice were injected with hTERT-HA-AAV9 live viral particles on day 15 after the last dose of TAM administration (Figure 8A). After 28 days after the last TAM injection, we prepared tissue sections and also isolated primary ECs as described above in Figure 1 from (1 control (WT), (2) NanogECΔHaplo (MT), (3) NanogECΔHaplo+hTERT-HA-AAV9. Tissue sections were subjected to anti-CD31 (to identify ECs) and Asp175 (to examine apoptosis) immunohistochemistry and examined under epifluorescent microscopy (Figure 8B through 8G). We monitored vascular rarefaction (CD31+ ECs) and quantified the Asp175 content in heart, because increased EC apoptosis strongly corelated with microvascular rarefaction and increased pathological cardiac physiological parameters seen in Figures 6 and 7. In control (WT) group (Figure 8A, 8B, and 8G), the analysis of heart sections in low (10×) and high (20×) magnification showed 87±3.5% CD31+ normal vascular structures, while the number of CD31+ vascular structures decreased to 60±3.2% in mutant mice (Figure 8A, 8B, and 8G), revealing microvascular rarefaction. In control group, staining with Asp175 showed basal apoptosis (3±1.6%; Figure 8A, 8B, and 8H), in contrast, MT mice showed increased apoptosis of both ECs (CD31+) and non-ECs (CD31−; Figure 8C, 8D, and 8H). In MT mice, the CD31+ EC apoptosis was about 25±4.5% and CD31− non-EC apoptosis 3±5.2%, thus, the total number of EC and non-EC apoptosis was 28±2.6%. We did not identify and characterize the CD31− negative apoptotic cells. Importantly, mutant-mice receiving hTERT-HA-AAV9 through retroorbital route, showed increased CD31+ vascular structures (79±2.5%) and decreased apoptosis (8±2.7%), thereby decreased microvascular rarefaction (Figure 8E, 8F, 8G, and 8H). The extent of Nanog-deficiency, downregulation of Tert (endogenous), Flk1, eNos, Asp175, and the efficiency of hTERT-HA-AAV9 rescue studies were analyzed by Western immunoblotting of cardiac EC-proteins prepared from indicated mice groups (Figure 8I). The level of exogenous hTERT (Figure 8I, top third panel, third lane) was at least 3-fold higher than the endogenous Tert (Figure 8I, top second panel, first lane). Moreover, the reexpression of hTERT into mutant mice increased Flk1 and eNos levels (Figure 8I) and decreased Asp175, while there was no change in control GAPDH (Figure 8I). Collectively, these compelling set of evidence suggests that EC apoptosis and microvascular rarefaction seen in NanogECΔHaplo myocardium was coupled to reduction in hTERT, eNOS, and Flk1 expressions.
Figure 8.

Re-expression of hTERT (human telomerase reverse transcriptase) in NanogECΔHaplo mice decreases myocardial endothelial cells (Ecs) apoptosis and microvascular rarefaction. A, Strategy and timeline of in vivo rescue experiment. B–G, Representative microscopic images of indicated heart tissue sections stained with Asp175 (anti-Cleaved Caspase-3) and anti-CD31 antibodies at 10× and 20× magnifications. H and I, Control vascular structures and microvascular rarefaction were quantified by scoring CD31+ vascular structures. While EC apoptosis were scored by CD31+ and Asp175+ double staining. For rescue experiment, MT (NanogECΔHaplo) mice received ≈2.0×10¹²/mice live advirus particles through r.o. route on day 15 after the last TAM (tamoxifen) administration. Thus, MT-mice receiving hTERT-HA-AAV9 demonstrated increased CD31+ vascular structures (79±2.5%) and decreased apoptosis (8±2.7%), thereby decreased microvascular rarefaction. Statistical significance was determined by a 1-way ANOVA with Tukey post hoc analysis. Data are shown as mean±SD. *P<0.05 as shown. J. The extent of Nanog-deficiency and downregulation of Tert (telomerase reverse transcriptase; endogenous), Flk1, eNos, and Asp175 (Cleaved Caspase-3) were analyzed in protein extracts prepared from cardiac ECs of NanogECΔHaplo + hTERT-HA-AAV9 mice. The efficiency of hTERT-HA-AAV9 administration was analyzed by Western immunoblotting with anti-HA antibody of EC-proteins prepared from indicated mice. As quantified, the exogenous hTERT increased to 3-fold higher than the endogenous Tert. Moreover, reexpression of hTERT into mutant (MT) mice increased Flk1 and eNos levels and decreased Asp175, while there was no change in GAPDH. The quantification of Western blot (WB) signal intensities obtained from at least 3 independent experiments. All data points were pooled from male (3) and female (3) mice (total n=6) as there were no differences in the cardiac physiological end-points. For WB analyses, ECs from male and female mice were pooled as the cardiac pathology observed in these mice were identical. WT indicates wild type.
Discussion
The role of Nanog in ECs in vivo has not been addressed. Previously, we showed that in ECs NANOG mediated the expression of VEGFR2/Flk1 in response to Wnt3a.5 Transfection experiments and knockdown studies demonstrated that NANOG binds to the ATTA DNA sequence found in the VEGFR2 promoter/enhancer segments. Importantly, NANOG-depletion decreased FLK1 expression, induced apopotosis, and decreased angiogenic activities of these cells. Here, we show that adult cardiac ECs express low level of Nanog and TERT. We provide a set of compelling genetic evidence that EC-Nanog transcriptionally regulates the expression of Tert and eNos in vivo. Importantly, mice harboring EC-specific deletion of one copy of Nanog gene induced myocardial EC apoptosis, microvascular rarefaction, thereby resulting in impaired homeostasis and angiogenic activities of these cells.5 Nanog is expressed in several adult tissues, including in lung and cardiac ECs. However, our analyses do not rule-out the possibility that Nanog is also expressed by non-ECs as well. ECs express Wnt3a, its receptor Frizzled, all other intracellular components of canonical Wnt3a/β-catenin signaling machinery.44,45 Increased Nanog expression has been reported in heart tissues in the aftermath of acute myocardial infarction.46 Cardiac hypertrophy and myocardial infarction is frequently associated with vascular inflammation, declining TERT expression and its reduced enzymatic activity, reduced eNOS or reduced NO bioavailability, and impaired metabolic activities.28–31 Conversely, increased expression of TERT is likely cardioprotective.47 However, no studies have mechanistically linked Nanog, TERT, and eNOS proteins in the regulation of homeostasis and angiogenic activities of ECs. As Nanog was expressed in ECs at a low level, we explored the potential relationship between Wnt3a stimulation and Nanog, TERT, and eNOS expression. Importantly, we found the TERT- and eNOS-promoter/enhancers harbored several NANOG binding DNA elements upstream of their transcription start sites. Accordingly, activation of canonical Wnt stabilized β-catenin, which increased Nanog, hTERT, and eNOS expression. However, Wnt3a-mediated transcriptional activity of β-catenin could be inhibited by the action of eNOS,32 which prevents excessive β-catenin transcriptional activity.
What is the physiological significance of Nanog expression in ECs? Nanog is a developmentally regulated TF that plays an essential role during embryonic development,6–9 therefore, it was not surprising that global loss of Nanog leads to embryonic lethality,7 while the conditional deletion of Nanog in primordial germ cells results in apoptosis.48 Because the deletion of a single Nanog allele has not been documented and to eliminate the uncertainty associated with a lethal phenotype resulting from a Nanog null allele in the adult vasculature, we created a new Genetically Engineered Mouse Model to produce an EC-specific Nanog haploinsufficient line. Moreover, to circumvent any phenotypic anomalies resulting from Nanog deletion in cell types other than ECs, we engineered mice with a TAM-inducible Cre expression system driven by the Cdh5 promoter.35 During the course of our study, we observed a dominant cardiovascular dysfunction characterized by a cardiac hypertrophy-like phenotype and edema, and heart failure. However, we focused on cardiac hypertrophy phenotype, because edematous heart and heart failure phenotypes were difficult for us to characterize in detail.
To address the relationship between Nanog and TERT, we examined whether the deletion of a single Nanog allele would result in reduced TERT expression. Human and mouse TERT sequences were highly homologous and contained a similar number of Nanog-binding sites in the upstream promoter segment. Thus, the deletion of a single Nanog allele reduced TERT and eNOS expressions in myocardial ECs, and this event likely produced a cardiovascular phenotype. As TERT is a key longevity gene,47 the reactivation of telomerase can reverse tissue degeneration in aged telomerase-deficient mice.49 A decline in TERT expression and its enzymatic activity results in cellular senescence that ultimately leads to cell death. Moreover, Nanog loss resulted in cardiac EC apoptosis, partially due to reduced TERT expression in ECs; this event likely increased the recruitment of fibroblasts/myofibroblasts and inflammatory cells, together likely induced fibrosis in the injured heart vessels as an adaptive response.50,51 We surmise that the TERT promoter could be responsive to several stimuli, including hypoxia and BMP4 (bone morphogenetic protein 4); thus, it is likely that the TERT promoter might not only be under the exclusive transcriptional control of Nanog. Our data also do not exclude the possibility that transcription factors (such as AP1 [activator protein 1], ETS, or SP1 [specificity protein 1]) could also cooperate with Nanog to regulate expression of TERT. However, increased TNF-α and IL-6 expression indicates ongoing vascular inflammation, apoptosis, and EC dysfunction, thereby indirectly disrupting NO bioavailability. Although we detected TUNEL staining in non-ECs, we hypothesize that this is likely a secondary event to EC apoptosis. The extent of non-EC death was significantly higher in mice harboring NanogECΔHaplo compared with control. Reduced hTERT expression and reduced enzymatic activity in blood vessels are central to mitochondrial dysfunction, causing oxidative stress in ECs. Together, these events likely produced an increase in both RV and left ventricle mass, as well as a significant decline in heart rate. Enlarged cardiomyocyte size, coupled with an increase in molecular markers associated with cardiac hypertrophy, led to increased diastolic parameters, which indicated the development of cardiac hypertrophy. Importantly, mice harboring an EC-specific deletion of a single Nanog showed an increased CO and stroke volume but a decreased heart rate, which indicated high-output heart failure with an appreciable increase in ejection fraction (%) and fractional shortening (%; Table III in the Data Supplement). These results suggest that low levels of Nanog required for normal myocardial EC function in adults.
To address the role of Nanog/TERT in the regulation of angiogenesis, we used Wnt3a as an angiogenic agent,5,44,45 and conducted rescue experiments using Nanog-depleted ECs. As expected, the cell survival increased and the ability of these ECs to form capillary-like networks was restored. This result suggests that increased TERT levels could prevent further EC loss or damage in the heart. As a consequence of EC-specific Nanog haploinsufficiency, apoptosis of ECs is expected to impair the function of many cell types, including cardiomyocytes and other cells that are dependent on blood vessels and tissue perfusion. In Nanog-depleted ECs, Wnt3a had no effect on ECs and angiogenesis. This observation is likely not due to off-target effects, because the observed phenotype was consistent with our hypothesis that raising Nanog levels and stimulating TERT activity in ECs is an effective way to increase angiogenesis, a pathway that is further enhanced by cotreatment with Wnt3a. The presence of immune cells, myofibroblasts, or mesenchymal cells did not compensate for the loss of single Nanog allele in ECs. It will be interesting to determine if normalizing the hTERT in ECs that express only one copy of the Nanog allele in vivo could prevent apoptosis and thereby restore the normal cardiovascular function in this model.
Why do NanogECΔHaplo mice develop cardiac hypertrophy? One could surmise that the cardiac hypertrophy experienced by these mice could be due to an adaptive response, as a result of reduced NO availability, decreased Flk1 mediated survival signaling and EC death. In the adult heart, NO is released by ECs and, consistent with its activity on vascular smooth muscle cells, regulates the onset of ventricular relaxation (positive lusitropy), thus optimizing physiological pump function as the cardiac muscle contracts in rhythmic motion. NO is a key regulator of myocardial contractile function, as it acts indirectly by dilating the systemic vasculature or directly by moderating angiogenesis, metabolism, and cell survival. In the heart, coronary and endocardial ECs and cardiac myocytes could release NO. eNOS is found to be expressed mostly in the cardiac ECs with only an appreciable level of expression in cardiac myocytes. The expression of eNOS is higher in coronary vessels and endocardium compared with capillaries and coronary vein ECs. Nevertheless, NO has been shown to reduce myocardial fibrosis and apoptosis, and known to act as an anti-hypertrophic factor, therefore it plays a cardioprotective role. As the cardiac endothelium in these mice showed increased EC apoptosis and decreased eNOS levels, these events likely dampen the bioavailability of NO. Decreased NO levels and apoptosis play key roles in several cardiovascular systems and lead to myocardial, cerebral, pulmonary, and renal complications. In this regard, our results provide a direct link between EC dysfunction/apoptosis and cardiac hypertrophy that can precipitate into heart failure. This is an endogenous adaptive response that progresses into severe cardiac pathology with no resolution. Thus, our observations imply that Nanog-regulated EC gene expression at the basal state is required to maintain normal vascular EC turnover. This concept is bolstered by our data demonstrating a close relationship between EC dysfunction and apoptosis, and the observed cardiovascular phenotype. Therefore, we hypothesize that decreased Nanog, decreased TERT, and decreased eNOS levels signal an increased risk of impending cardiovascular events. ECs release several vasoactive agents, including the vasodilator molecule NO and the vasoconstrictor peptide endothelin-1, which contribute to functional communication with cardiomyocytes and are unquestionably involved in the development of cardiomyocyte hypertrophy. Reduced NO production and its inactivation by reactive oxygen species can contribute to clinical consequences, including EC dysfunction, cardiac hypertrophy, coronary artery disease, and stroke. There are likely to be several mechanisms underlying decreased NO bioavailability in human cardiac hypertrophy and heart failure, but mouse experiments suggest that NO bioavailability is reduced due to decreased eNOS levels. In the endothelium, increased inflammation and oxidative stress can also modify several signaling pathways to disrupt normal EC activity. Blood flow and vascular tone regulation, increased platelets, and monocyte adhesion to vascular endothelium are influenced by EC dysfunction, vascular inflammation, and reactive oxygen species. We also observed microvascular rarefaction in NanogECΔHaplo mice, and this pathology was diminished in these mice that received AAV-9-hTERT-cDNA. Importantly, myocardial microvascular rarefaction was closely associated with EC apoptosis and decreased levels of hTERT, eNOS, and Flk1. However, upon retro-orbital delivery of AAV-9-hTERT-cDNA in vivo into NanogECΔHaplo mice, we observed appreciable level of restoration of Flk1 and eNOS proteins expression and decreased apoptosis; thus, this data indicated that Nanog critically regulates the levels of TERT and eNOS in vivo. These observations remain consistent with the reports that microvascular rarefaction was frequently seen in the myocardium of rats experiencing chronic inhibition of NOS, characteristic of the pressure-overload hypertrophy, and in eNOS-null mice.52–54 The observed structural and mechanical changes indicated the development and progression of EC-initiated cardiac hypertrophy and heart failure. Together, we demonstrated that decreased Nanog and TERT levels, reduced eNOS levels, increased vascular and perivascular fibrosis, and cardiac hypertrophy likely represent maladaptive responses or pathological modifications, which without clinical intervention can progress to heart failure. Thus, the cardiac EC Nanog/TERT/eNOS signaling pathway represents a new target for therapeutic development and intervention to restore normal cardiovascular function.
One of the limitations is the low-level of Nanog in adult ECs, because these cells are terminally differentiated. We focused on cardiac ECs as cardiac phenotype was unmistakably striking; however, our study does not rule-out possible EC-dysfunction in other vascular beds. Although, the current study was focused on the functional relationship between Nanog and hTERT, eNOS, and Flk1 it is likely that Nanog has multiple targets and may regulate expression of several EC genes. The use of a single allele deletion of Nanog is appropriate given the Nanog’s widespread biological effects and targets.45 In summary, the low-level expression of Nanog is essential for normal EC turnover and their activities in adult cardiovascular organs.
Acknowledgments
The Research Resources Center (RRC) Core Microscopy and Imaging, Cardiovascular Physiology Core, Flow Cytometry Service, Research Histology, and Tissue Imaging Cores of the University of Illinois at Chicago.
Sources of Funding
This work was supported in part by the American Heart Association (AHA) Grants GRNT25710129 and GRNT33700162 to K. K.Wary. J. Baruah was supported by AHA Predoctoral Fellowships (Mid-West affiliate) 15PRE22760004 and CCTS-PECTs (Center for Clinical and Translational Science Pre-doctoral Education for Clinical and Translational Sciences) 1UL1TR002003; and S. Chaudhuri was supported by the Fulbright-Nehru Fellowship Program (2038/FNPDR/2015). C. Axen was supported by National Institute Health (NIH)-T32/HL007829. V. Mastej was supported by by the NIH-T32/HL007829 and AHA Predoctoral Fellowship 19PRE34450173 (National Affiliate). The content is solely the responsibility of the authors and does not necessarily represent the official views of the AHA or NIH.
Disclosures
None.
Supplementary Material
Nonstandard Abbreviations and Acronyms
- AAV
- adeno associated virus
- Anp
- atrial natriuretic peptide
- Asp175
- anti-Cleaved Caspase-3
- bFGF
- basic fibroblast growth factor
- Bnp
- brain natriuretic peptide
- BW
- body weight
- Cnp
- C-type natriuretic peptide
- EC
- endothelial cell
- eNOS
- endothelial nitric oxide synthase
- Et-1
- endothelin-1
- FLK1/Flk1
- fetal liver kinase-1
- GFP/mG
- green fluorescent protein
- HUVEC
- human umbilical vein endothelial cells
- mT
- tomato
- Myh7
- myosin heavy chain-7
- NIH
- National Institutes of Health
- NO
- nitric oxide
- NRG1
- neuregulin-1
- PCR
- polymerase chain reaction
- RV
- right ventricle
- TAM
- tamoxifen
- TERT
- telomerase reverse transcriptase
- TF
- transcription factors
- VEGF
- vascular endothelial growth factor
- VEGFR2
- vascular endothelial growth factor receptor-2
- VWF
- von Willebrand factor
- WB
- Western blot
- WGA
- wheat germ agglutinin
For Sources of Funding and Disclosures, see page 2262.
The Data Supplement is available with this article at https://www.ahajournals.org/doi/suppl/10.1161/ATVBAHA.120.314875.
References
- 1.De Val S, Black BL. Transcriptional control of endothelial cell development. Dev Cell 200916180–195doi: 10.1016/j.devcel.2009.01.014 [DOI] [PMC free article] [PubMed] [Google Scholar]
- 2.Palencia-Desai S, Kohli V, Kang J, Chi NC, Black BL, Sumanas S. Vascular endothelial and endocardial progenitors differentiate as cardiomyocytes in the absence of Etsrp/Etv2 function. Development 20111384721–4732doi: 10.1242/dev.064998 [DOI] [PMC free article] [PubMed] [Google Scholar]
- 3.Park C, Kim TM, Malik AB. Transcriptional regulation of endothelial cell and vascular development. Circ Res 20131121380–1400doi: 10.1161/CIRCRESAHA.113.301078 [DOI] [PMC free article] [PubMed] [Google Scholar]
- 4.Wang XY, Lan Y, He WY, Zhang L, Yao HY, Hou CM, Tong Y, Liu YL, Yang G, Liu XD, et al. Identification of mesenchymal stem cells in aorta-gonad-mesonephros and yolk sac of human embryos. Blood 20081112436–2443doi: 10.1182/blood-2007-07-099333 [DOI] [PubMed] [Google Scholar]
- 5.Kohler EE, Cowan CE, Chatterjee I, Malik AB, Wary KK. NANOG induction of fetal liver kinase-1 (FLK1) transcription regulates endothelial cell proliferation and angiogenesis. Blood 20111171761–1769doi: 10.1182/blood-2010-07-295261 [DOI] [PMC free article] [PubMed] [Google Scholar]
- 6.Chambers I, Colby D, Robertson M, Nichols J, Lee S, Tweedie S, Smith A. Functional expression cloning of Nanog, a pluripotency sustaining factor in embryonic stem cells. Cell 2003113643–655doi: 10.1016/s0092-8674(03)00392-1 [DOI] [PubMed] [Google Scholar]
- 7.Chambers I, Silva J, Colby D, Nichols J, Nijmeijer B, Robertson M, Vrana J, Jones K, Grotewold L, Smith A. Nanog safeguards pluripotency and mediates germline development. Nature 20074501230–1234doi: 10.1038/nature06403 [DOI] [PubMed] [Google Scholar]
- 8.Mitsui K, Tokuzawa Y, Itoh H, Segawa K, Murakami M, Takahashi K, Maruyama M, Maeda M, Yamanaka S. The homeoprotein Nanog is required for maintenance of pluripotency in mouse epiblast and ES cells. Cell 2003113631–642doi: 10.1016/s0092-8674(03)00393-3 [DOI] [PubMed] [Google Scholar]
- 9.Hart AH, Hartley L, Ibrahim M, Robb L. Identification, cloning and expression analysis of the pluripotency promoting Nanog genes in mouse and human. Dev Dyn 2004230187–198doi: 10.1002/dvdy.20034 [DOI] [PubMed] [Google Scholar]
- 10.Piazzolla D, Palla AR, Pantoja C, Cañamero M, de Castro IP, Ortega S, Gómez-López G, Dominguez O, Megías D, Roncador G, et al. Lineage-restricted function of the pluripotency factor NANOG in stratified epithelia. Nat Commun. 2014;5:4226. doi: 10.1038/ncomms5226. doi: 10.1038/ncomms5226. [DOI] [PubMed] [Google Scholar]
- 11.Fischedick G, Wu G, Adachi K, Araúzo-Bravo MJ, Greber B, Radstaak M, Köhler G, Tapia N, Iacone R, Anastassiadis K, et al. Nanog induces hyperplasia without initiating tumors. Stem Cell Res 201413300–315doi: 10.1016/j.scr.2014.08.001 [DOI] [PubMed] [Google Scholar]
- 12.Leach JP, Martin JF. Cardiomyocyte proliferation for therapeutic regeneration. Curr Cardiol Rep. 2018;20:63. doi: 10.1007/s11886-018-1011-x. doi: 10.1007/s11886-018-1011-x. [DOI] [PubMed] [Google Scholar]
- 13.Cines DB, Pollak ES, Buck CA, Loscalzo J, Zimmerman GA, McEver RP, Pober JS, Wick TM, Konkle BA, Schwartz BS, et al. Endothelial cells in physiology and in the pathophysiology of vascular disorders. Blood 1998913527–3561 [PubMed] [Google Scholar]
- 14.Aird WC. Phenotypic heterogeneity of the endothelium: II. Representative vascular beds. Circ Res 2007100174–190doi: 10.1161/01.RES.0000255690.03436.ae [DOI] [PubMed] [Google Scholar]
- 15.Zhang H, Lui KO, Zhou B. Endocardial cell plasticity in cardiac development, diseases and regeneration. Circ Res 2018122774–789doi: 10.1161/CIRCRESAHA.117.312136 [DOI] [PubMed] [Google Scholar]
- 16.Widlansky ME, Gokce N, Keaney JF, Jr, Vita JA. The clinical implications of endothelial dysfunction. J Am Coll Cardiol 2003421149–1160doi: 10.1016/s0735-1097(03)00994-x [DOI] [PubMed] [Google Scholar]
- 17.Oka T, Akazawa H, Naito AT, Komuro I. Angiogenesis and cardiac hypertrophy: maintenance of cardiac function and causative roles in heart failure. Circ Res 2014114565–571doi: 10.1161/CIRCRESAHA.114.300507 [DOI] [PubMed] [Google Scholar]
- 18.Kamo T, Akazawa H, Komuro I. Cardiac nonmyocytes in the hub of cardiac hypertrophy. Circ Res 201511789–98doi: 10.1161/CIRCRESAHA.117.305349 [DOI] [PubMed] [Google Scholar]
- 19.Matsushima S, Kuroda J, Zhai P, Liu T, Ikeda S, Nagarajan N, Oka S, Yokota T, Kinugawa S, Hsu CP, et al. Tyrosine kinase FYN negatively regulates NOX4 in cardiac remodeling. J Clin Invest 20161263403–3416doi: 10.1172/JCI85624 [DOI] [PMC free article] [PubMed] [Google Scholar]
- 20.Zaglia T, Milan G, Ruhs A, Franzoso M, Bertaggia E, Pianca N, Carpi A, Carullo P, Pesce P, Sacerdoti D, et al. Atrogin-1 deficiency promotes cardiomyopathy and premature death via impaired autophagy. J Clin Invest 20141242410–2424doi: 10.1172/JCI66339 [DOI] [PMC free article] [PubMed] [Google Scholar]
- 21.Appari M, Breitbart A, Brandes F, Szaroszyk M, Froese N, Korf-Klingebiel M, Mohammadi MM, Grund A, Scharf GM, Wang H, et al. C1q-TNF-related protein-9 promotes cardiac hypertrophy and failure. Circ Res 201712066–77doi: 10.1161/CIRCRESAHA.116.309398 [DOI] [PubMed] [Google Scholar]
- 22.van Berlo JH, Maillet M, Molkentin JD. Signaling effectors underlying pathologic growth and remodeling of the heart. J Clin Invest 201312337–45doi: 10.1172/JCI62839 [DOI] [PMC free article] [PubMed] [Google Scholar]
- 23.Gillers BS, Chiplunkar A, Aly H, Valenta T, Basler K, Christoffels VM, Efimov IR, Boukens BJ, Rentschler S. Canonical wnt signaling regulates atrioventricular junction programming and electrophysiological properties. Circ Res 2015116398–406doi: 10.1161/CIRCRESAHA.116.304731 [DOI] [PMC free article] [PubMed] [Google Scholar]
- 24.Foulquier S, Daskalopoulos EP, Lluri G, Hermans KCM, Deb A, Blankesteijn WM. WNT signaling in cardiac and vascular disease. Pharmacol Rev 20187068–141doi: 10.1124/pr.117.013896 [DOI] [PMC free article] [PubMed] [Google Scholar]
- 25.Wan A, Rodrigues B. Endothelial cell-cardiomyocyte crosstalk in diabetic cardiomyopathy. Cardiovasc Res 2016111172–183doi: 10.1093/cvr/cvw159 [DOI] [PMC free article] [PubMed] [Google Scholar]
- 26.Chen X, Zhabyeyev P, Azad AK, Wang W, Minerath RA, DesAulniers J, Grueter CE, Murray AG, Kassiri Z, Vanhaesebroeck B, et al. Endothelial and cardiomyocyte PI3Kβ divergently regulate cardiac remodelling in response to ischaemic injury. Cardiovasc Res 20191151343–1356doi: 10.1093/cvr/cvy298 [DOI] [PMC free article] [PubMed] [Google Scholar]
- 27.Jaba IM, Zhuang ZW, Li N, Jiang Y, Martin KA, Sinusas AJ, Papademetris X, Simons M, Sessa WC, Young LH, et al. NO triggers RGS4 degradation to coordinate angiogenesis and cardiomyocyte growth. J Clin Invest 20131231718–1731doi: 10.1172/JCI65112 [DOI] [PMC free article] [PubMed] [Google Scholar]
- 28.Jurk D, Wilson C, Passos JF, Oakley F, Correia-Melo C, Greaves L, Saretzki G, Fox C, Lawless C, Anderson R, et al. Chronic inflammation induces telomere dysfunction and accelerates ageing in mice. Nat Commun. 2014;2:4172. doi: 10.1038/ncomms5172. doi: 10.1038/ncomms5172. [DOI] [PMC free article] [PubMed] [Google Scholar]
- 29.Oh H, Taffet GE, Youker KA, Entman ML, Overbeek PA, Michael LH, Schneider MD. Telomerase reverse transcriptase promotes cardiac muscle cell proliferation, hypertrophy, and survival. Proc Natl Acad Sci U S A 20019810308–10313doi: 10.1073/pnas.191169098 [DOI] [PMC free article] [PubMed] [Google Scholar]
- 30.Sahin E, Colla S, Liesa M, Moslehi J, Müller FL, Guo M, Cooper M, Kotton D, Fabian AJ, Walkey C, et al. Telomere dysfunction induces metabolic and mitochondrial compromise. Nature 2011470359–365doi: 10.1038/nature09787 [DOI] [PMC free article] [PubMed] [Google Scholar]
- 31.Shesely EG, Maeda N, Kim HS, Desai KM, Krege JH, Laubach VE, Sherman PA, Sessa WC, Smithies O. Elevated blood pressures in mice lacking endothelial nitric oxide synthase. Proc Natl Acad Sci U S A 19969313176–13181doi: 10.1073/pnas.93.23.13176 [DOI] [PMC free article] [PubMed] [Google Scholar]
- 32.Zhang Y, Chidiac R, Delisle C, Gratton JP. Endothelial NO synthase-dependent S-nitrosylation of β-catenin prevents its association with TCF4 and inhibits proliferation of endothelial cells stimulated by Wnt3a. Mol Cell Biol. 2017;37:e00089-17. doi: 10.1128/MCB.00089-17. doi: 10.1128/MCB.00089-17. [DOI] [PMC free article] [PubMed] [Google Scholar]
- 33.Hoffmeyer K, Raggioli A, Rudloff S, Anton R, Hierholzer A, Del Valle I, Hein K, Vogt R, Kemler R. Wnt/β-catenin signaling regulates telomerase in stem cells and cancer cells. Science 20123361549–1554doi: 10.1126/science.1218370 [DOI] [PubMed] [Google Scholar]
- 34.Zhang Y, Toh L, Lau P, Wang X. Human telomerase reverse transcriptase (hTERT) is a novel target of the Wnt/β-catenin pathway in human cancer. J Biol Chem 201228732494–32511doi: 10.1074/jbc.M112.368282 [DOI] [PMC free article] [PubMed] [Google Scholar]
- 35.Muzumdar MD, Tasic B, Miyamichi K, Li L, Luo L. A global double-fluorescent cre reporter mouse. Genesis 200745593–605doi: 10.1002/dvg.20335 [DOI] [PubMed] [Google Scholar]
- 36.Wang Y, Nakayama M, Pitulescu ME, Schmidt TS, Bochenek ML, Sakakibara A, Adams S, Davy A, Deutsch U, Lüthi U, et al. Ephrin-B2 controls VEGF-induced angiogenesis and lymphangiogenesis. Nature 2010465483–486doi: 10.1038/nature09002 [DOI] [PubMed] [Google Scholar]
- 37.Nohata N, Uchida Y, Stratman AN, Adams RH, Zheng Y, Weinstein BM, Mukouyama YS, Gutkind JS. Temporal-specific roles of rac1 during vascular development and retinal angiogenesis. Dev Biol 2016411183–194doi: 10.1016/j.ydbio.2016.02.005 [DOI] [PubMed] [Google Scholar]
- 38.Gaffin RD, Peña JR, Alves MS, Dias FA, Chowdhury SA, Heinrich LS, Goldspink PH, Kranias EG, Wieczorek DF, Wolska BM. Long-term rescue of a familial hypertrophic cardiomyopathy caused by a mutation in the thin filament protein, tropomyosin, via modulation of a calcium cycling protein. J Mol Cell Cardiol 201151812–820doi: 10.1016/j.yjmcc.2011.07.026 [DOI] [PMC free article] [PubMed] [Google Scholar]
- 39.Rajan S, Jagatheesan G, Karam CN, Alves ML, Bodi I, Schwartz A, Bulcao CF, D’Souza KM, Akhter SA, Boivin GP, et al. Molecular and functional characterization of a novel cardiac-specific human tropomyosin isoform. Circulation 2010121410–418doi: 10.1161/CIRCULATIONAHA.109.889725 [DOI] [PMC free article] [PubMed] [Google Scholar]
- 40.Cowan CE, Kohler EE, Dugan TA, Mirza MK, Malik AB, Wary KK. Kruppel-like factor-4 transcriptionally regulates VE-cadherin expression and endothelial barrier function. Circ Res 2010107959–966doi: 10.1161/CIRCRESAHA.110.219592 [DOI] [PMC free article] [PubMed] [Google Scholar]
- 41.Humtsoe JO, Liu M, Malik AB, Wary KK. Lipid phosphate phosphatase 3 stabilization of beta-catenin induces endothelial cell migration and formation of branching point structures. Mol Cell Biol 2010301593–1606doi: 10.1128/MCB.00038-09 [DOI] [PMC free article] [PubMed] [Google Scholar]
- 42.Wary KK, Vogel SM, Garrean S, Zhao YD, Malik AB. Requirement of alpha(4)beta(1) and alpha(5)beta(1) integrin expression in bone-marrow-derived progenitor cells in preventing endotoxin-induced lung vascular injury and edema in mice. Stem Cells 2009273112–3120doi: 10.1002/stem.241 [DOI] [PMC free article] [PubMed] [Google Scholar]
- 43.Chatterjee I, Baruah J, Lurie EE, Wary KK. Endothelial lipid phosphate phosphatase-3 deficiency that disrupts the endothelial barrier function is a modifier of cardiovascular development. Cardiovasc Res 2016111105–118doi: 10.1093/cvr/cvw090 [DOI] [PMC free article] [PubMed] [Google Scholar]
- 44.Goodwin AM, Sullivan KM, D’Amore PA. Cultured endothelial cells display endogenous activation of the canonical Wnt signaling pathway and express multiple ligands, receptors, and secreted modulators of Wnt signaling. Dev Dyn 20062353110–3120doi: 10.1002/dvdy.20939 [DOI] [PubMed] [Google Scholar]
- 45.Dejana E. The role of wnt signaling in physiological and pathological angiogenesis. Circ Res 2010107943–952doi: 10.1161/CIRCRESAHA.110.223750 [DOI] [PubMed] [Google Scholar]
- 46.Luo H, Li Q, Pramanik J, Luo J, Guo Z. Nanog expression in heart tissues induced by acute myocardial infarction. Histol Histopathol 2014291287–1293doi: 10.14670/HH-29.1287 [DOI] [PubMed] [Google Scholar]
- 47.Bär C, Bernardes de Jesus B, Serrano R, Tejera A, Ayuso E, Jimenez V, Formentini I, Bobadilla M, Mizrahi J, de Martino A, et al. Telomerase expression confers cardioprotection in the adult mouse heart after acute myocardial infarction. Nat Commun. 2014;5:5863. doi: 10.1038/ncomms6863. doi: 10.1038/ncomms6863. [DOI] [PMC free article] [PubMed] [Google Scholar]
- 48.Yamaguchi S, Kurimoto K, Yabuta Y, Sasaki H, Nakatsuji N, Saitou M, Tada T. Conditional knockdown of Nanog induces apoptotic cell death in mouse migrating primordial germ cells. Development 20091364011–4020doi: 10.1242/dev.041160 [DOI] [PubMed] [Google Scholar]
- 49.Codd V, Nelson CP, Albrecht E, Mangino M, Deelen J, Buxton JL, Hottenga JJ, Fischer K, Esko T, Surakka I, et al. ; CARDIoGRAM consortium Identification of seven loci affecting mean telomere length and their association with disease. Nat Genet 201345422–7, 427e1doi: 10.1038/ng.2528 [DOI] [PMC free article] [PubMed] [Google Scholar]
- 50.Jaskelioff M, Muller FL, Paik JH, Thomas E, Jiang S, Adams AC, Sahin E, Kost-Alimova M, Protopopov A, Cadiñanos J, et al. Telomerase reactivation reverses tissue degeneration in aged telomerase-deficient mice. Nature 2011469102–106doi: 10.1038/nature09603 [DOI] [PMC free article] [PubMed] [Google Scholar]
- 51.Frangogiannis NG. Cell biological mechanisms in regulation of the post-infarction inflammatory response. Curr Opin Physiol 201817–13doi: 10.1016/j.cophys.2017.09.001 [DOI] [PMC free article] [PubMed] [Google Scholar]
- 52.Andersen S, Nielsen-Kudsk JE, Vonk Noordegraaf A, de Man FS. Right ventricular fibrosis. Circulation 2019139269–285doi: 10.1161/CIRCULATIONAHA.118.035326 [DOI] [PubMed] [Google Scholar]
- 53.Sládek T, Gerová M, Znojil V, Devát L. Morphometric characteristics of cardiac hypertrophy induced by long-term inhibition of NO synthase. Physiol Res 199645335–338 [PubMed] [Google Scholar]
- 54.Kubis N, Richer C, Domergue V, Giudicelli JF, Lévy BI. Role of microvascular rarefaction in the increased arterial pressure in mice lacking for the endothelial nitric oxide synthase gene (eNOS3pt-/-). J Hypertens 2002201581–1587doi: 10.1097/00004872-200208000-00021 [DOI] [PubMed] [Google Scholar]
Associated Data
This section collects any data citations, data availability statements, or supplementary materials included in this article.