

Abstract
Thyroid cancer (TC) is the most well-known endocrine neoplasia as well as a common malignant tumor in the head and neck. Our study was designed to assess the prognostic meaningful of TNFRSF12A expression in TC dependent on data acquired from TCGA and so as to increase further knowledge into the biological pathways involved in TC pathogenesis related TNFRSF12A.
Information on gene expression and comparing clinical data were identified and downloaded from TCGA. Gene set enrichment analysis (GSEA) created an arranged list of all genes indicated by their connection with TNFRSF12A expression.
Our study cohort included 370 (73.1%) female and 136 (26.9%) male patients. The scatter plot and paired plot showed the difference of TNFRSF12A expression between normal and tumor samples (P < .01). The univariate analysis suggested that TNFRSF12A-low associated essentially with age (HR: 1.15; 95%CI: 1.08–1.22; P < .01), stage (HR: 2.79; 95%CI: 1.43–5.46; I vs IV; P = .003) and tumor stage (HR: 2.39; 95%CI: 1.08–5.30; P = .031). The GSEA results show that type II diabetes mellitus, pantothenate and CoA biosynthesis, adipocytokine signaling pathway, PPAR signaling pathway, mTOR signaling pathway, insulin signaling pathway, are enriched in TNFRSF12A low expression phenotype.
TNFRSF12A expression may be a potential useful prognostic molecular biomarker of bad survival in thyroid cancer, in addition, PPAR signaling pathway, insulin signaling pathway, mTOR signaling pathway may be the key pathway controlled by TNFRSF12A in thyroid cancer. Further experimental ought to be performed to demonstrate the biologic effect of TNFRSF12A.
Keywords: prognosis, TCGA, thyroid cancer, TNFRSF12A
1. Introduction
Thyroid cancer (TC) is the most frequent endocrine neoplasia and a common malignant tumor in the head and neck. TC has an incidence rate accounting for only 1% of all the malignant tumors.[1,2] In recent decades, there has been a remarkable increase in TC morbidity has aroused substantial public concern. Meanwhile, high-incidence patients often develop distant metastasis and lymph node metastasis, which in turn result in high mortality.[3] Thyroid cancer can be divided into papillary thyroid carcinoma (PTC), anaplastic thyroid carcinoma (ATC), follicular thyroid carcinoma (FTC), and medullary thyroid carcinoma (MTC).[4] PTC is the most widely recognized pathological type and accounts for approximately 90% of thyroid cancer cases.[5] Over 80% of PTC patients achieve 35 to 40-year survival after effective treatment.[6] However, patients who are not sensitive to radioiodine therapy or with cervical lymph node metastasis at the time of diagnosis have a poor prognosis and 10-year survival of less than 10%.[7] Therefore, it is important to identify suitable biomarkers for use to characterize TC recurrence and metastasis and prognostic monitoring. Chen et al[8] found that MT1 M upregulation significantly inhibited colony formation, migration, proliferation, and invasion of PTC cell lines. This implied that MT1 M was involved in the progression of thyroid cancer and might act as a tumor suppressor gene. Cao et al[9] reported that elevated expression of PPP1R15A and CDK7 were both associated with poor clinical prognosis in ATC patients while inhibition sensitized ATC cells to conventional chemotherapy.
Tumor necrosis factor (TNF) receptor superfamily member 12A (TNFRSF12A; otherwise called FN14, CD266 and TWEAKR), is the smallest individual of the TNF superfamily of receptors that contain a short cytoplasmic demise domain[10] and has been reported to be elevated in different cancers, including HCC,[11] lung cancer,[12] glioblastoma[13] and breast cancer.[14] However, there are no studies providing insights into the role of TNFRSF12A in thyroid cancer prognosis and the underlying molecular mechanisms in TC remain to be fully elucidated. Liu et al[15] suggested that TNFRSF12A contributes to endothelial dysfunction through the modulation of ROS and mtROS and the underlying mechanism has been implicated in the AMPK/PGC 1α/MnSOD signaling pathway. Qiu et al[16] found that TNFRSF12A was associated with tumor stage, but the study was restricted to PCT. The expression of the TNFRSF12A axis has been reported to be upregulated in patients with autoimmune thyroid disease and may play a key role in the pathogenesis of autoimmune thyroid disease.[17] TNFRSF12A is also deemed as a factor that advances prostate cancer bone metastasis[18] and ectopic expression expands the invasive action of prostate cancer cells.[19] Roos et al identified aurintricarboxylic acid as a repressor of TNFRSF12A leading to glioma cell chemotactic migration and invasion through inhibition of Rac1 activation.[20] However, the relationship between TNFRSF12A and TC prognosis has not been elucidated. Therefore, this study assessed the relationship between TNFRSF12A expression and TC prognosis using data obtained from TCGA dataset, GSEA analysis was also conducted to understand the biological pathways involved in TC associated TNFRSF12A pathogenesis.
2. Materials and methods
2.1. Gene information and bioinformatics analysis
Information on gene expression (570 cases, Workflow Type: HTSeqCounts) and comparing clinical data (506 cases, Data Format: BCR XML) were recognized and downloaded from level 3 gene-expression information (FPKM normalized) of TCGA TC cohort. Boxplots were utilized to envision the expression differences for discrete variables.[21] The clinicopathological data collected included sex, age, stage, grade, T-stage, M-stage, N-stage, survival status, and survival duration in days. Data were analyzed using the R (version 3.5.3) and R Bioconductor packages. Besides, Perl language for data matrix and data processing with P less than 0.5 was performed. This study did not require ethical approval from the ethics committee or institutional review board.
2.2. GSEA enrichment
Gene set enrichment analysis (GSEA) created an arranged list of all genes based on their connection with TNFRSF12A expression. The samples were divided into high- and low-TNFRSF12A groups as a training set to distinguish the potential function and elucidate the significant survival difference using GSEA. Annotated gene sets c2.cp.kegg.v6.0.symbols.gmt was selected as the reference gene sets and includes terms with FDR < 0.05. Gene set permutations were executed multiple times for every examination. The expression degree of TNFRSF12A was applied as a phenotype label. The normalized enrichment score (NES) and nominal P value were used in the enriched pathways in every phenotype.
2.3. Statistical analysis
Statistical analyses were performed using R version 3.5.3 and Bioconductor. A Scatter plot and paired plot were used to visualize the difference in normal and tumor samples. Overall survival (OS) was characterized as the time interval from the date of diagnosis to the date of death. The listwise deletion technique was utilized to deal with missing data, which excluded the entire sample from the investigation if any single value was absent. The connection between clinical factors and TNFRSF12A was examined using logistic regression, Wilcoxon signed-rank test, and Kruskal test. Clinical factors related to OS were analyzed using Cox regression analysis and the Kaplan-Meier approach. Multivariate Cox analysis was used to evaluate the impact of TNFRSF12A expression on survival alongside other clinical attributes (such as age, gender, stage, distant metastasis). Benjamini–Hochberg way was used to transform the P values to FDRs. P value < .05 was considered to be statistically significant.
3. Results
3.1. Clinical characteristics
The TCGA database contained 506 patients and the clinicopathological attributes of these samples are presented in Table 1. The mean age at diagnosis in the TCGA dataset was 47 years old (range 15–89 years) and the median finally contact for subjects was 34.4 months (range 0–180.8 months). Meanwhile, follow-up studies confirmed 490 (96.8%) alive and 16 (3.2%) death patients. This study's cohort included 370 (73.1%) female and 136 (26.9%) male patients. Stage I disease was located in 285 patients (56.3%), stage II in 52 (10.3%), stage III in 112 (22.1%), and stage IV in 55 (10.9%). Tumor stage was found to be T1 in 144 patients (28.5%), T2 in 167 (33.0%), T3 in 170 (33.6%) and T4 in 23 (4.5%). The node stage contained N0 in 230 (45.5%) and N1 in 226 (44.7%), while 9 of 506 (1.8%) cases had distant metastases. All the subjects were adenomas or adenocarcinomas.
Table 1.
TCGA thyroid cancer patient characteristics.

3.2. The association of TNFRSF12A expression and clinicopathologic factors
The scatter plot showed the differences in TNFRSF12A expression between normal and tumor samples (P < .01, Fig. 1A). The paired plot was used to show differences in TNFRSF12A expression between the normal and tumor samples from the same patients and the results showed significant differences (P < .01, Fig. 1B) The study outcomes suggested that the expression of TNFRSF12A was significant and may play a vital role in regulating cancer development. Decreased expression of TNFRSF12A was significantly associated with the patient age (P = .004, Fig. 2A), clinical-stage (P = .004, Fig. 2C), and lymph nodes (P < .01, Fig. 2F). Univariate analysis revealed that TNFRSF12A expression was related to poor prognosis (Table 2). Decreased TNFRSF12A expression in TC was associated with age (OR = 0.43; 95%CI = 0.26–0.70, 21–40 vs 61–80) indicating that patients with low TNFRSF12A expression are inclined to advance to a further advanced stage than those with high TNFRSF12A expression in age clinicopathologic characteristic.
Figure 1.

(A) The scatter plot showed the difference of TNFRSF12A expression between normal and tumor samples (P < .01); (B) paired plot to demonstrated the TNFRSF12A expression between normal and tumor from the same patients and the results was significant difference (P < .01); (C) Survival analysis demonstrated that TC with TNFRSF12A-low had a more terrible prognosis than that with TNFRSF12A-high (P = .015).
Figure 2.
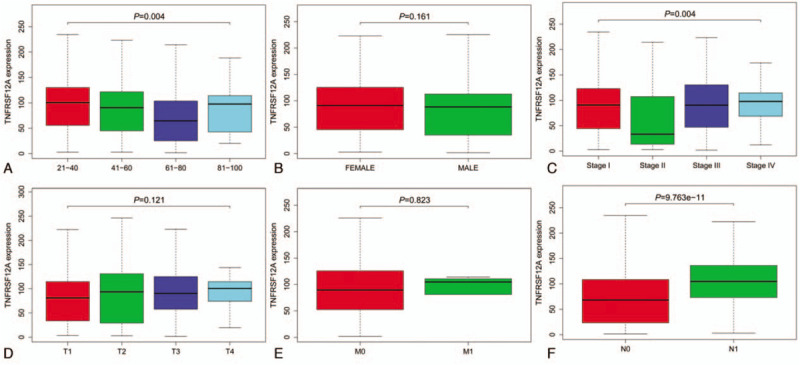
Association with TNFRSF12A expression and clinicopathologic factors. (A) Age; (B) Gender; (C) Stage; (D) T-stage; (E) M-stage; (F) N-stage.
Table 2.
TNFRSF12A expression associated with clinical pathological characteristics (logistic regression).

3.3. Survival and multivariate analysis
Survival analysis demonstrated that TC associated low TNFRSF12A had poor prognosis than with high TNFRSF12A (P = .015) Figure 1C. Univariate analysis revealed that low TNFRSF12A expression was associated with age (HR: 1.15; 95%CI: 1.08–1.22; P < .01), stage (HR: 2.79; 95%CI: 1.43–5.46; I vs IV; P = .003) and tumor stage (HR: 2.39; 95%CI: 1.08–5.30; P = .031) Table 3. TNFRSF12A is associated with overall survival, with an HR of 1.01 (CI: 0.95–1.09, P = .042).
Table 3.
a. Associations with overall survival and clinicopathologic characteristics in TCGA patients using Cox regression. b. Multivariate survival model after variable selection.

3.4. GSEA recognition of TNFRSF12A related signaling pathways
To recognize signaling pathways that might be differentially expressed in TC, GSEA analysis was performed among low and high TNFRSF12A expression data sets (FDR P < .05, NOM P < .05). The most significantly enriched signaling pathways were chosen depending on the normalized enrichment scores (NES) Table 4. The results show that Pathogenic Escherichia coli infection, tight junction, glycosaminoglycan degradation, leukocyte transendothelial migration were differentially enriched in TNFRSF12A high expression phenotype and type II diabetes mellitus, pantothenate, and CoA biosynthesis, adipocytokine signaling pathway, PPAR signaling pathway, mTOR signaling pathway, insulin signaling pathway, are enriched in TNFRSF12A low expression phenotype (Fig. 3).
Table 4.
Gene sets enriched in phenotype high.

Figure 3.

Enrichment plots from gene set enrichment analysis (GSEA).
4. Discussion
In this study, we conducted a comprehensive and detailed assessment of TNFRSF12A expression in thyroid cancer based on the TCGA database. Further, its association with clinicopathologic characteristics, survival, function, and expression difference was assessed. Knowing whether a more highly-expression biomarker in tumor consists of a right away link to thyroid cancer helps us understand the mechanistic clarification for observed clinical survival patterns. The study found that there was significant TNFRSF12A expression between normal and tumor samples which indicated that TNFRSF12A plays an important role in regulating cancer progression. This ought to be of terrific interest for perspective on the present improvement of thyroid therapies and maybe uncover potential biomarkers or targets for determinants for prognosis.
TNFRSF12A (TNF receptor superfamily member 12A), is also known as fibroblast growth factor-inducible 14 (Fn14), and its ligand TNFSF12 (TNF superfamily member 12) is also known as tumor necrosis factor-related weak inducer of apoptosis (TWEAK). The initiation of the TWEAK/Fn14 axis is involved in tumorigenesis of numerous malignancies.[22] Various studies demonstrate that TWEAK/Fn14 signaling is related to tumor metastasis and progression, as well as immune surveillance and angiogenesis.[23] Fn14 and TWEAK are lowly expressed in typical tissues and are highly expressed in numerous tumors. Metastases and overexpression of Fn14 are associated with advanced-stage tumors.[19,24–25] The expression of TNFRSF12A and its potential prognostic effect on thyroid cancer has not yet been elucidates. This study, showed that decreased expression of TNFRSF12A in thyroid cancer was associated with advanced clinical pathologic factors (age, clinical stage, nodes stage), survival time, and poor prognosis. Univariate analysis revealed that TNFRSF12A expression was associated with poor prognosis and age plays an indispensable role in the inclined to advance to a further advanced stage. The univariate and multivariate analysis also suggested TNFRSF12A expression was linked to OS hence may act as a potential prognostic biomarker and therapeutic target in thyroid cancer. However, more research is needed to clarify these findings.
GSEA analysis was performed in both low and high TNFRSF12A expression datasets. The results show that pathogenic Escherichia coli infection, tight junction, glycosaminoglycan degradation, leukocyte transendothelial migration were differentially expressed in high TNFRSF12A expression. E. coli is a common bacterium of the human gut microbiota that plays a vital role in maintaining intestinal homeostasis.[26] Type II diabetes mellitus (T2DM), pantothenate and CoA biosynthesis, adipocytokine signaling pathway, PPAR signaling pathway, insulin signaling pathway, mTOR signaling pathway were found to be differentially enriched in low TNFRSF12A expression. Numerous studies have reported that T2DM increases thyroid cancer incidences while the most crucial pathogenesis is insulin resistance.[27] Therefore, we hypothesized that insulin disorder may contribute to TNFRSF12A low expression phenotype. Studies have reported the key role of peroxisome proliferator-activated receptor (PPAR) in inflammation and cancers and suggest its role in anti-proliferation, angiogenesis, metastasis, apoptosis, and immunomodulatory via activation of signaling pathways in various cancer cells and cancer stem cells.[28] The function of PPAR is in regulating glucose and lipid metabolism, inflammation, and endothelial function. The GSEA results suggested that material metabolism may play an important role in the TNFRSF12A low expression phenotype.
5. Conclusion
TNFRSF12A expression may be a potential prognostic biomarker of overall survival in thyroid cancer. Besides, pathogenic Escherichia coli infection, PPAR signaling pathway, insulin signaling pathway, mTOR signaling pathway are key pathways associated with TNFRSF12A in thyroid cancer. Further research is needed to demonstrate the biologic effect of TNFRSF12A expression.
Author contributions
All authors contributed significantly to this work. W.Z.H. designed the research study; W.Z.H. C.Q. W.G.H. and N.X performed the research study and extracted the data and analyzed the data; W.Z.H., N.X., and C.Q. wrote and revised the manuscript. In addition, all authors approved the final draft.
Footnotes
Abbreviations: GSEA = gene set enrichment analysis, TC = thyroid cancer, TNFRSF12A = tumor necrosis factor receptor superfamily member 12A.
How to cite this article: Wu ZH, Niu X, Wu GH, Cheng Q. Decreased expression of TNFRSF12A in thyroid gland cancer predicts poor prognosis: a study based on TCGA data. Medicine. 2020;99:34(e21882).
ZHW and XN are first author and contributed equally to this study.
The authors have no funding and conflicts of interest to disclose.
Data sharing not applicable to this article as no datasets were generated or analyzed during the current study.
References
- [1].Wang TS, Sosa JA. Thyroid surgery for differentiated thyroid cancer-recent advances and future directions. Nat Rev Endocrinol 2018;14:670–83. [DOI] [PubMed] [Google Scholar]
- [2].Mackenzie EJ, MortiMer RH. Thyroid nodules and thyroid cancer. Med J Aust 2004;180:242–7. [DOI] [PubMed] [Google Scholar]
- [3].Jung CK, Little MP, Lubin JH, et al. The increase in thyroid cancer incidence during the last four decades is accompanied by a high frequency of BRAF mutations and a sharp increase in RAS mutations. J Clin Endocrinol Metab 2014;99:E276–85. [DOI] [PMC free article] [PubMed] [Google Scholar]
- [4].Zhu J, Zhang Q, Jin XY, et al. MiR-506 suppresses papillary thyroid carcinoma cell proliferation and metastasis via targeting IL17RD. Eur Rev Med Pharmacol Sci 2019;23:2856–62. [DOI] [PubMed] [Google Scholar]
- [5].NiKiForova MN, ChiosEa SI, NiKiForov YE. MicroRNA expression profiles in thyroid tumors. Endocr Pathol 2009;20:85–91. [DOI] [PubMed] [Google Scholar]
- [6].Veiga LH, Neta G, Gschebrook-Kilfo YB, et al. Thyroid cancer incidence patterns in Sao Paulo, Brazil, and the U.S. SEER program, 1997–2008. Thyroid 2013;23:748–57. [DOI] [PMC free article] [PubMed] [Google Scholar]
- [7].Frohlich E, Wahl R. The current role of targeted therapies to induce radioiodine uptake in thyroid cancer. Cancer Treat Rev 2014;40:665–74. [DOI] [PubMed] [Google Scholar]
- [8].Chen Y, Quan R, Bhandari A, et al. Low metallothionein 1 M (MT1 M) is associated with thyroid cancer cell lines progression. Am J Transl Res 2019;11:1760–70. [PMC free article] [PubMed] [Google Scholar]
- [9].Cao X, Dang L, Zheng X, et al. Targeting super-enhancer-driven oncogenic transcription by CDK7 inhibition in anaplastic thyroid carcinoma. Thyroid 2019;29:809–23. [DOI] [PubMed] [Google Scholar]
- [10].Wiley SR, Cassiano L, Lofton T, et al. A novel TNF receptor family member binds TWEAK and is implicated in angiogenesis. Immunity 2001;15:837–46. [DOI] [PubMed] [Google Scholar]
- [11].Wang T, Ma S, Qi X, et al. Knockdown of the differentially expressed gene TNFRSF12A inhibits hepatocellular carcinoma cell proliferation and migration in vitro. Molecular Med Rep 2017;15:1172. [DOI] [PMC free article] [PubMed] [Google Scholar]
- [12].Chang WA, Yen MC, Hung JY, et al. Investigation of the role of tumor necrosis factor-like weak inducer of apoptosis in non-small cell lung cancer. Oncol Rep 2018;39:573–81. [DOI] [PubMed] [Google Scholar]
- [13].Perez JG, Tran NL, Rosenblum MG, et al. The TWEAK receptor Fn14 is a potential cell surface portal for targeted delivery of glioblastoma therapeutics. Oncogene 2016;35:2145–55. [DOI] [PMC free article] [PubMed] [Google Scholar]
- [14].Ludmilla DP, Anne VS, Berger Frédérique, et al. Predictive Gene Signature of Response to the Anti-TweakR mAb PDL192 in Patient-Derived Breast Cancer Xenografts. PLoS One 2014;9:e104227. [DOI] [PMC free article] [PubMed] [Google Scholar]
- [15].Liu H, Peng H, Xiang H, et al. TWEAK/Fn14 promotes oxidative stress through AMPK/PGC-1 α/MnSOD signaling pathway in endothelial cells. Mol Med Rep 2018;17:1998–2004. [DOI] [PubMed] [Google Scholar]
- [16].Qiu J, Zhang W, Zang C, et al. Identification of key genes and miRNAs markers of papillary thyroid cancer. Biol Res 2018;51:45. [DOI] [PMC free article] [PubMed] [Google Scholar]
- [17].Peng S, Yu X, Zhao X, et al. Role of the tumor necrosis factor-like weak inducer of apoptosis (TWEAK)/fibroblast growth factor-inducible 14 (Fn14) axis in autoimmune thyroid disease. Clin Endocrinol (Oxf) 2017;87:783–90. [DOI] [PubMed] [Google Scholar]
- [18].Yin J, Liu YN, Tillman H, et al. AR-regulated TWEAK-FN14 pathway promotes prostate cancer bone metastasis. Cancer Res 2014;74:4306–17. [DOI] [PMC free article] [PubMed] [Google Scholar]
- [19].Huang M, Narita S, Tsuchiya N, et al. Overexpression of Fn14 promotes androgen-independent prostate cancer progression through MMP-9 and correlates with poor treatment outcome. Carcinogenesis 2011;32:1589–96. [DOI] [PubMed] [Google Scholar]
- [20].Roos A, Dhruv HD, Mathews IT, et al. Identification of aurintricarboxylic acid as a selective inhibitor of the TWEAK-Fn14 signaling pathway in glioblastoma cells. Oncotarget 2017;8:12234–46. [DOI] [PMC free article] [PubMed] [Google Scholar]
- [21].Kruppa J, Jung K. Automated multigroup outlier identification in molecular high-throughput data using bagplots and gemplots. BMC Bioinformatics 2017;18:232. [DOI] [PMC free article] [PubMed] [Google Scholar]
- [22].Hu G, Zeng W, Xia Y. TWEAK/Fn14 signaling in tumors. Tumor Biol 2017;39:101042831771462. [DOI] [PubMed] [Google Scholar]
- [23].Wang X, Zeng Y, Ho DN, et al. Fibroblast growth factorinducible 14: multiple roles in tumor metastasis. Curr Mol Med 2015;15:892–904. [DOI] [PubMed] [Google Scholar]
- [24].Pettersen I, Baryawno N, Abel F, et al. Expression of TWEAK/Fn14 in neuroblastoma: implications in tumorigenesis. Int J Oncol 2013;42:1239–48. [DOI] [PubMed] [Google Scholar]
- [25].Watts GS, Tran NL, Berens ME, et al. Identification of Fn14/TWEAK receptor as a potential therapeutic target in esophageal adenocarcinoma. Int J Cancer 2007;121:2132–9. [DOI] [PubMed] [Google Scholar]
- [26].Leser TD, Mølbak L. Better living through microbial action: the benefits of the mammalian gastrointestinal microbiota on the host. Environ Microbiol 2009;11:2194–206. [DOI] [PubMed] [Google Scholar]
- [27].Veziant J, Gagnière J, Jouberton E, et al. Association of colorectal cancer with pathogenic Escherichia coli: Focus on mechanisms using optical imaging. World J Clin Oncol 2016;7:293–301. [DOI] [PMC free article] [PubMed] [Google Scholar]
- [28].Young-Gyun S, Ho-Chun C, Reum AA, et al. The association between type 2 diabetes mellitus and thyroid cancer. J Diabetes Res 2017;2017:1–8. [DOI] [PMC free article] [PubMed] [Google Scholar]