Supplemental Digital Content is Available in the Text.
Keywords: Bedside sensory testing, Bedside-QST, Quantitative sensory testing, Sensory profiling, Stratified therapy
Abstract
Introduction:
Stratification of patients according to the individual sensory phenotype has been suggested a promising method to identify responders for pain treatment. However, many state-of-the-art sensory testing procedures are expensive or time-consuming.
Objectives:
Therefore, this study aimed to present a selection of easy-to-use bedside devices.
Methods:
In total, 73 patients (39 m/34 f) and 20 controls (11 m/9 f) received a standardized laboratory quantitative sensory testing (QST) and a bedside-QST. In addition, 50 patients were tested by a group of nonexperienced investigators to address the impact of training. The sensitivity, specificity, and receiver-operating characteristics were analyzed for each bedside-QST parameter as compared to laboratory QST. Furthermore, the patients' individual sensory phenotype (ie, cluster) was determined using laboratory QST, to select bedside-QST parameters most indicative for a correct cluster allocation.
Results:
The bedside-QST parameters “loss of cold perception to 22°C metal,” “hypersensitivity towards 45°C metal,” “loss of tactile perception to Q-tip and 0.7 mm CMS hair,” as well as “the allodynia sum score” indicated good sensitivity and specificity (ie, ≳70%). Results of interrater variability indicated that training is necessary for individual parameters (ie, CMS 0.7). For the cluster assessment, the respective bedside quantitative sensory testing (QST) parameter combination indicated the following agreements as compared to laboratory QST stratification: excellent for “sensory loss” (area under the curve [AUC] = 0.91), good for “thermal hyperalgesia” (AUC = 0.83), and fair for “mechanical hyperalgesia” (AUC = 0.75).
Conclusion:
This study presents a selection of bedside parameters to identify the individual sensory phenotype as cost and time efficient as possible.
1. Introduction
In the past, many clinical trials have failed to show analgesic efficacy, despite encouraging results in preclinical and early clinical studies.2,13,15 Historically, neuropathic pain has been treated based on the underlying etiology, while more recently, mechanism-related therapy concepts were suggested as promising alternatives. Therefore, including a stratification approach is considered a valid option to account for these different analgesic efficacy outcomes. A laboratory-based QST, using a standardized test protocol (ie, the DFNS protocol), may be such a stratification tool.11 Thereby, the somatosensory function of skin and deep somatosensory afferents can be assessed. A recent multicenter study identified 3 sensory phenotypes by a hypothesis-free cluster analysis,1 indicating loss of small and large fibers (cluster 1 = “sensory loss”), preserved sensory function and thermal hyperalgesia (cluster 2 = “thermal hyperalgesia”), and small fiber loss with mechanical hyperalgesia (cluster 3 = “mechanical hyperalgesia”). In fact, these clusters presented similar patterns to those induced by neuropathic surrogate models in healthy volunteers.17 The exact stratification algorithm was not applied in clinical trials, yet but responders of recent studies can be tentatively assigned to each cluster: the sodium channel blocker oxcarbazepine showed significant pain relief in a subgroup of patients with an irritable nociceptor phenotype (cluster 2), whereas in the remaining group, there was no effect.6 Another study indirectly hypothesized that patients with sensory loss (cluster 1) had good response to opioids.7 Interestingly, patients with degenerated nociceptors and mechanical allodynia (cluster 3) responded better to topical lidocaine than patients with preserved nociceptors and mechanical allodynia.20 By contrast, a study indicated that irritable nociceptor phenotypes (clusters 2 and 3) do not predict lidocaine treatment effect as hypothesized.5 Another study investigating the response to pregabalin in chemotherapy-induced peripheral neuropathy did not detect increased mechanical sensitivity (cluster 3) as predictor for treatment response.8 Thereby, treatment effects identified with regard to the sensory phenotype are not entirely understood yet and need to be interpreted with caution.
Still, the European Medicines Agency acknowledged sensory profiling and subgrouping as an adequate stratification tool to determine specific sensory phenotypes in exploratory trials on neuropathic pain. However, an entire sensory testing protocol is time-consuming; some equipment is expensive and thorough training necessary. To provide a feasible and economically reasonable stratification tool that can be easily applied in clinical routine, it is essential to develop stringent time-saving test protocols, which are comparable with quantitative sensory testing, ie, an easy-to-use bedside-QST.
Ideally, these protocols distinguish abnormal from physiological sensory parameters with reasonable accuracy in an appropriate time frame, using inexpensive QST equipment. Further on, this bedside test should be practicable for unexperienced study personal after brief training sessions.
Therefore, the main aim of this study was to compare the results of a standardized easy-to-use bedside assessment battery (ie, bedside-QST) with a standardized laboratory-based QST (ie, laboratory-based quantitative sensory testing [lab-QST]) to select the best parameters for a bedside-QST stratification tool.
2. Methods
2.1. Patients and healthy controls
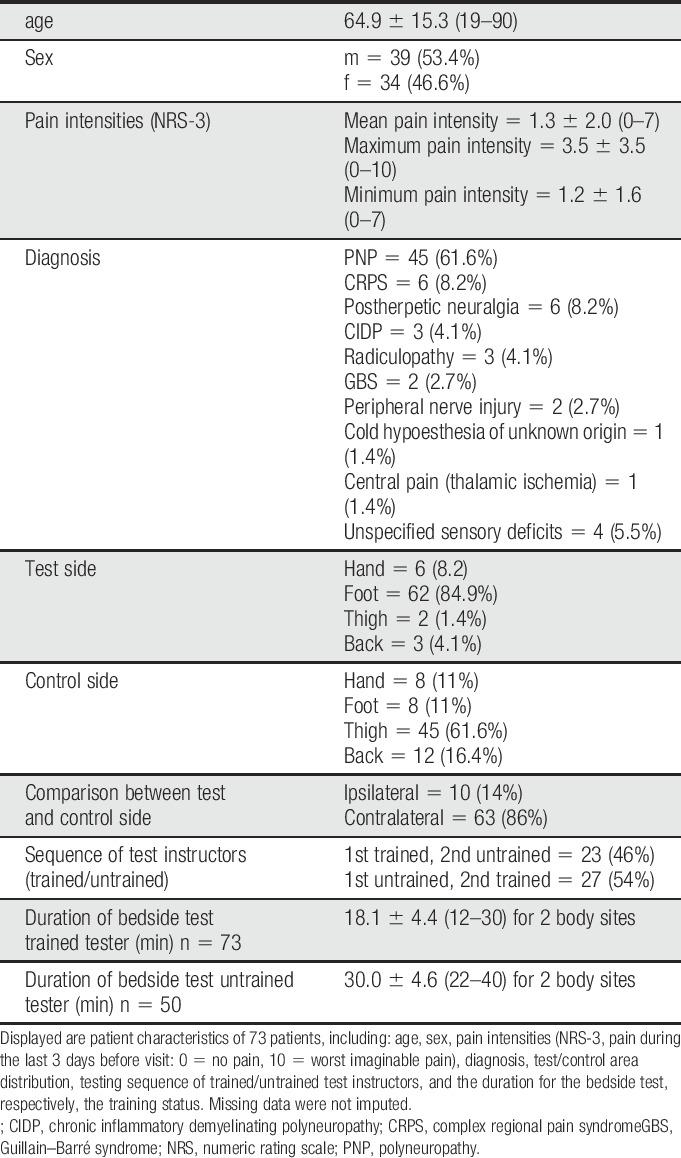
Seventy-three patients with different neuropathic pain etiologies and 20 healthy controls were included in the study (Table 1). Laboratory and bedside-QST measurements were performed at the affected area (ie, area of maximum pain/sensory loss) and a control area (contralateral site in unilateral diseases or closest nonaffected area in bilateral diseases). The aim was to include patients with sensory loss and gain of function within different pain etiologies (ie, polyneuropathy, complex regional pain syndrome, postherpetic neuralgia, chronic inflammatory demyelinating polyneuropathy, radiculopathy, Guillain–Barré syndrome, peripheral nerve injury, central pain after thalamic stroke, cold hypoesthesia of unknown origin, and unspecified sensory deficits). The distribution and number of different neuropathic etiologies is displayed in Table 1.
Table 1.
Patient characterization.
The inclusion criteria were (1) patients needed to understand the procedure and (2) patients had to be older than 18 years. There were no exclusion criteria regarding medication intake or specific other diseases because the investigation focused on the comparison of lab-QST vs bedside-QST.
2.2. Laboratory-based Quantitative Sensory Testing
The lab-QST protocol established by the German Research Network on Neuropathic Pain (DFNS) includes 13 parameters, assessed by 7 different test devices.9–11 The mechanical detection threshold (Optihair2-Set; Marstock Nervtest, Heidelberg, Germany) and vibration detection threshold (VDT) (neurological tuning fork [64 Hz] represents A-beta fiber integrity). The cold detection threshold and mechanical pain threshold assess function of different A-delta fiber subtypes. The capacity of different C-fiber subtypes is assessed through the cold pain threshold, the warm detection threshold, and the heat pain threshold. Further on, paradoxical heat sensations are evaluated within the thermal sensory limen; both parameters are characterized by C- and A-delta fiber integrity. All thermal testing was applied through the Medoc TSA II system with a 1°C/s ramp (0–50°C) applied (Medoc Advance Medical System, Ramat Yishai, Israel). The pressure pain threshold (FDN200; Wagner Instruments, Greenwich, CT) assessed deep somatosensory function. The mechanical pain sensitivity, the dynamic mechanical allodynia (DMA) (QST brush), and wind-up ratio [WUR] represent parameters of central sensitization. The mechanical pain threshold, WUR, and MPS parameters were assessed using Pinprick stimuli (MRC Systems GmbH, Heidelberg, Germany). The parameters were transformed into z-values to determine a loss or gain of sensory function and control for localization, age- and gender-specific sensory changes.9 All parameters exceeding the z-value of +1.96 indicate a gain of function, whereas parameters below −1.96 indicate a loss of function.
2.3. Bedside Quantitative Sensory Testing
In total, 13 simple sensory bedside stimuli were tested. For each stimulus, the patient received a standardized instruction. Thereafter, the patients and healthy volunteers had to rate and quantify the sensations as described below. The patients were instructed to rate a stimulus as painful as soon as an additional impression such as stinging, drilling, burning, or aching occurred. The bedside-QST includes the equipment as shown in Figure 1.
Figure 1.
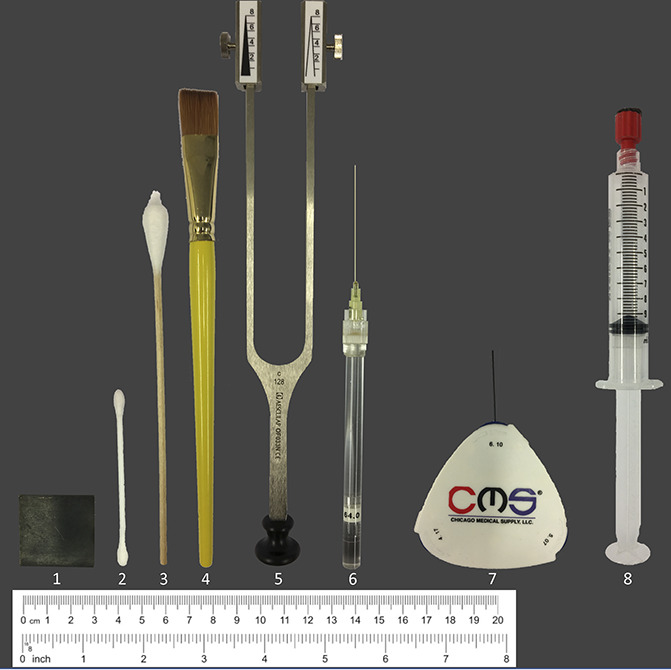
Bedside-QST devices. Displayed are the devices used for bedside-QST. (1) 3-cm2 metal piece, (2) Q-tip, (3) cotton wisp, (4) brush, (5) tuning fork c 128/C 64 Hz, (6) von Frey hair 64 mN, (7) 0.7-mm/0.4-mm CMS hair, (8) 10-mL syringe. QST, quantitative sensory testing.
2.3.1. Thermal nonpainful and painful perception
The thermal detection and pain perception were tested using metal (iron) pieces measuring 3 cm2, equalling the size of the lab-QST thermode. The subjects were instructed to rate: (1) if the stimulus is painful (ie, yes/no), and if painful, the pain intensity on a numeric rating scale (NRS) (ie, NRS-11, 0 = no pain, 10 = worse imaginable pain); (2) the quality of the stimulus (ie, perceived/not perceived, if perceived: cold/warm), and if perceived, the intensity of the stimulus on a NRS (ie, NRS-11, 0 = no perception, 10 = strongest imaginable perception).
For the cold detection, a metal piece with 22°C room temperature and, for the cold pain detection, a metal piece with 8°C (stored in the fridge) were applied for 3 seconds. For warm and heat pain detection, metal pieces were heated with a milk heater (“Babycare,” Breuer GmbH, Ulm, Germany) to 37°C and 45°C, respectively. All metal pieces were applied to the skin for 3 seconds.
2.3.2. Touch sensation
The dynamic mechanical detection sensitivity was assessed at control and test area by a Q-tip stroke (5-cm length, 1×). The subjects had to indicate (1) the intensity of the perception at test area as compared to the control area on a scale from 0 to 20, where 10 was defined as the intensity of the control area (ie, <10 = less intensity at affected area as compared to control; >10 = stronger intensity at affected area as compared to control).
Two additional tests for static mechanical detection were performed: a bedside 0.4-mm CMS (Chicago Medical Supply, LLC, Northbrook, IL) and a 64-mN Fruhstorfer von Frey hair (Optihair2-Set; Marstock Nervtest) were applied 3 times in the control area and the affected skin. It was documented whether (1) the stimulus was perceived at least 2 times (ie, yes/no), and (2) subjects had to compare if the stimulus was more intense in the affected or control area, or if there was no difference (ie, 0 = same intensity in control and test area, 1 = control area more intense, and 2 = test area more intense).
2.3.3. Mechanical pain sensitivity
To test for pinprick hyperalgesia and hypoalgesia, a 0.7-mm CMS hair (ie, bedside pinprick) (CMS, Chicago Medical Supply, LLC) was applied to the affected skin and the control area. (1) subjects had to indicate whether the stimulus was perceived as blunt touch or as a pinprick. (2) if the stimulus was perceived as a pinprick, subjects had to rate the pain intensity on the NRS-11 scale (0 = no pain, 10 = worse imaginable pain).
2.3.4. Wind up
In order to assess temporal pain summation, the 0.7 mm hair (ie, bedside pinprick) was applied once followed by a series of 10 applications with a frequency of 1/s. Subjects were instructed to rate the pain intensity, induced by the single stimulus and the last stimuli of the series on the NRS-11 scale (0 = no pain, 10 = worse imaginable pain).
2.3.5. Dynamic mechanical allodynia
To test for DMA, subjects were touched by a brush, a Q-tip and a cotton wisp in the affected and control area. The devices were applied 4 times each, drawing a cross with 2 strokes (length 5 cm) from each direction with a 90°C angle. For each stimulus (brush/Q-tip/cotton wisp), subjects had to indicate (1) if the stimulus was perceived as painful (yes/no) as well as (2) the pain intensity on the NRS-11 (0 = no pain, 10 = worse imaginable pain).
2.3.6. Pressure pain sensitivity
A bedside algometer consisting of a 10-mL syringe sealed with a plug and felt (contact area 1 cm2) was placed above a muscle to evaluate deep somatosensory pressure pain. (1) the syringe was compressed up to 4 mL and subjects had to indicate, whether this compression was painful on the NRS-11 (0 = no pain, 10 = worse imaginable pain). (2) the syringe was slowly compressed with 1 mL/s and subjects had to indicate when the pressure was perceived as painful (ie, pain threshold was determined by the milliliter of compressed air in the syringe).
2.3.7. Vibration detection
The VDT was performed with a standardized tuning fork (c 128 Hz/C 64 Hz, 8-point scale), placed over a bony prominence in the area of the affected skin and control area. The patients had to indicate when the vibration stimulus was vanished (0 = no vibration stimulus perception, 8 = best possible vibration detection).
2.4. Influence of standardized training sessions on the quality of sensory bedside quantitative sensory testing
According to the DFNS, a standardized test procedure with systematic instructions for the test subject in combination with systematic training sessions is necessary to guarantee reliable lab-QST results.16,19 To address the impact of training, 50 patients were tested by 2 groups of investigators: (1) an experienced, well trained member of the pain research group performed the tests and (2) a group of non-experienced medical students performed the tests after having received only a brief written introduction.
2.5. Dichotomous discrimination of sensory perceptions
Subjects were asked whether they can feel the different painful or nonpainful sensations elicited by the bedside-QST stimulus or whether they did not perceive a perception (cold, warmth, cold pain, heat pain, touch, and pinprick). They were further instructed to answer with yes or no. These results were compared with the respective dichotomous lab-QST results (abnormal and normal) according to the DFNS.11
2.6. Statistical analysis
2.6.1. Sensitivity and specificity
For calculation of sensitivity and specificity, the results of dichotomous bedside-QST parameters (painful or perception [Yes/No]) were compared with the respective dichotomous lab-QST results (abnormal/normal) according to the DFNS database of normative values. To achieve a sufficient statistical power, both patients and healthy controls were analyzed together.
2.6.2. Correlation and receiver-operating characteristics of bedside quantitative sensory testing vs laboratory quantitative sensory testing
For the correlation analysis, the interval-scaled bedside-QST values of the intensity ratings (ie, NRS-11) were compared with the corresponding perception thresholds in lab-QST parameters using Spearman correlation coefficients. The ROCs calculation included the intensity ratings/thresholds of the interval-scaled bedside-QST parameter and the respective dichotomous lab-QST results (abnormal/normal). The quality of each parameter was evaluated by the corresponding area under the curve (AUC), according to the following grading system: 100-90 excellent, 90-80 good, 80-70 fair, 70-60 poor, and 60-50 fail.12
2.6.3. Impact of training on the accuracy of bedside testing
To address the impact of training, 50 patients were examined by unexperienced and experienced investigators. The assessment of interrater variability comprised the calculation of the squared weighted kappa between trained and untrained investigators with a SPSS extension bundle (STATS WEIGHTED KAPPA.spe). In addition, the correlation coefficients (Spearman Rho) between bedside-QST and lab-QST for the trained and untrained investigators as well as the correlation between trained and untrained investigators were calculated.
2.6.4. Cluster analysis of laboratory quantitative sensory testing parameters and selection of bedside quantitative sensory testing parameters
A cluster analysis of lab-QST parameters was performed to assign each patient to the respective sensory phenotype (ie, sensory loss/thermal hyperalgesia/mechanical hyperalgesia).18 In addition, ROC curves were calculated to evaluate the discriminatory power (ie, (1) Cluster 1 vs 2/3, (2) Cluster 2 vs 1/3, (3) Cluster 3 vs 1/2), for each bedside-QST parameter. To select the most indicative bedside-QST parameter combination for each cluster, the selection criterion for the individual bedside-QST parameter was determined by the AUC (≥0.70). The calculation of a bedside score for each bedside cluster solution included the transformation of the ordinal values into dichotomous values according to the respective cutoff values, as determined by the ROCs (ie, cutoff (x): [(=0) < x < (=1)]).
Statistical analysis was performed with SPSS (V. 23, IBM).
3. Results
3.1. Patients and healthy controls
In total, 93 participants were included, ie, 20 controls (mean [± SD] age: 66.9 [± 11.2], 11 m/9 f) and 73 patients (64.9 [± 15.3], 39 m/34 f). There was no difference in age between controls and patients (P > 0.5). The epidemiological data of the patient cohort are shown in Table 1.
3.2. Laboratory quantitative sensory testing in patients
The parameters assessed through lab-QST were sorted to the respective sensory function (ie, loss/gain of function) according to the normative data sets of the DFNS (Fig. 2A). Patients presented thermal and mechanical hypoesthesia more frequently as well as increased VDTs and decreased sensitivity to heat and pinprick stimuli. Dynamic mechanical allodynia and paradoxical heat sensations were found more frequently as well as an increased sensitivity to pinprick stimuli. Notably, positive signs such as heat hyperalgesia and cold hyperalgesia were rare. In addition, the sensory profile of the entire patient group is shown in Figure 2B.
Figure 2.
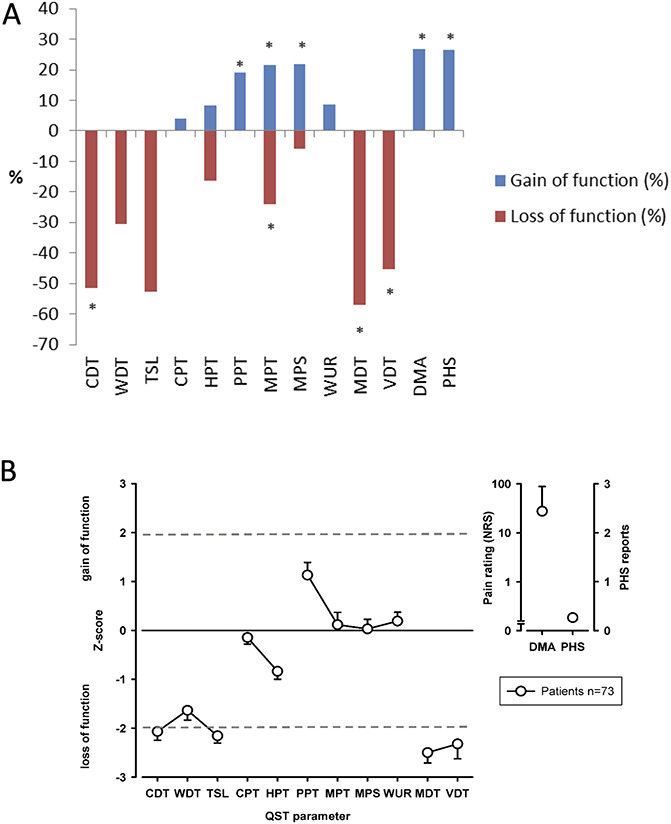
Lab-QST in patients. (A) Displayed are the frequencies (%) of abnormal values as compared to normative DFNS data. Patients showed more frequent thermal (CDT, WDT, and TSL) and mechanical (MDT) hypoesthesia as well as increased VDTs and decreased sensitivity to heat (HPT) and pinprick stimuli (MPS) as well as more frequent dynamic mechanical allodynia and paradoxical heat sensations. Furthermore, an increased sensitivity to pinprick stimuli (MPS) as well as paradoxical heat sensations were more frequent. (B) Displayed is the somatosensory profile of 73 patients. The dotted gray line represents ±1.96 SDs from the mean of corresponding normative values of the age-, sex- and location-matched DFNS database. All z-values <1.96 represent a loss of function, all z-values >1.96 indicate a gain of function. CDT, cold detection threshold; CPT, cold pain threshold; DMA, dynamic mechanical allodynia; HPT, heat pain threshold; lab-QST, laboratory quantitative sensory testing; MDT, mechanical detection threshold; MPT, mechanical pain threshold; MPS, mechanical pain sensitivity; PHS, paradoxical heat sensation; PPT, pain pressure threshold; TSL, thermal sensory limen; VDT, vibration detection threshold; WUR, wind-up ratio; WDT, warm detection threshold.
3.3. Bedside quantitative sensory testing in patients and healthy controls
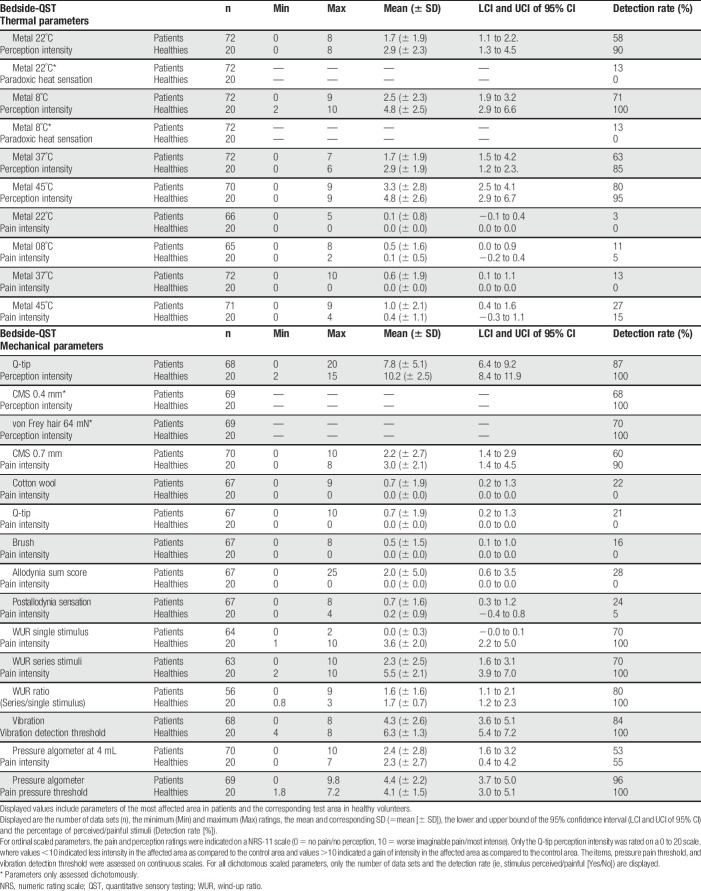
A descriptive analysis of all bedside-QST parameters in patients and healthy controls was conducted (ie, ordinal/dichotomous) (Table 2).
Table 2.
Descriptive analysis of bedside-QST parameters.
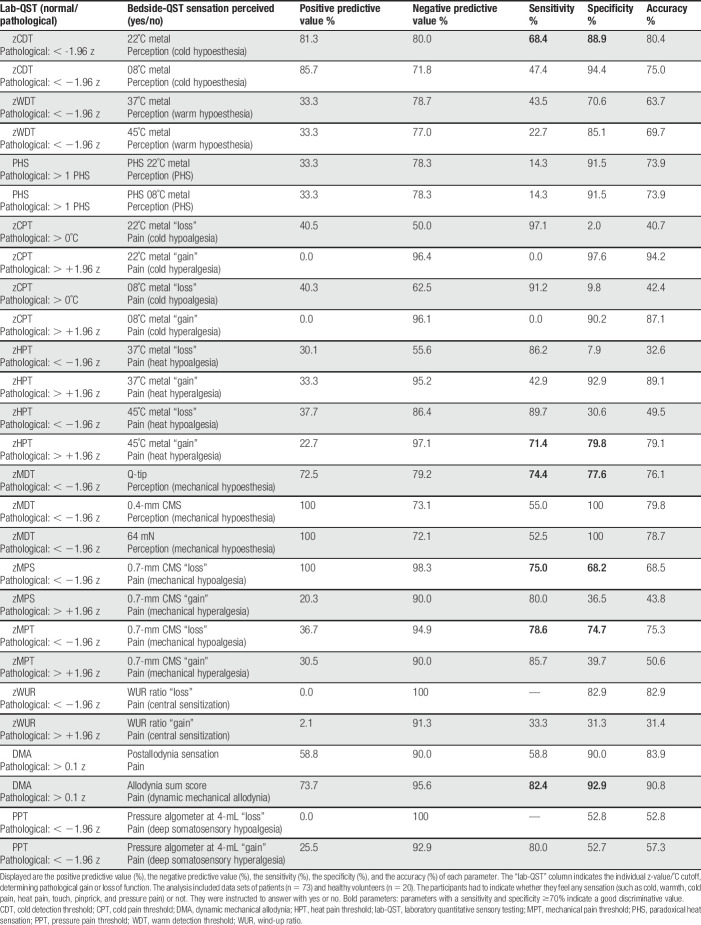
3.4. Sensitivity and specificity of bedside quantitative sensory testing parameters compared with laboratory quantitative sensory testing
The following bedside-QST parameters (Table 3) indicated good discrimination values (ie, sensitivity and specificity ≳70%): Loss of cold perception to 22 °C metal, hypersensitivity towards 45 °C metal, loss of tactile perception to Q-tip and loss of pain perception to 0.7mm CMS hair as well as DMA by Q-tip, brush and cotton wisp (ie, allodynia sum score). However, the sensitivity and specificity of parameters assessing gain of function towards cold pain (ie, cold hyperalgesia) has to be interpreted with caution due to the fact that only 3 patients suffered from cold hyperalgesia.
Table 3.
Sensitivity and specificity of bedside-QST parameters.
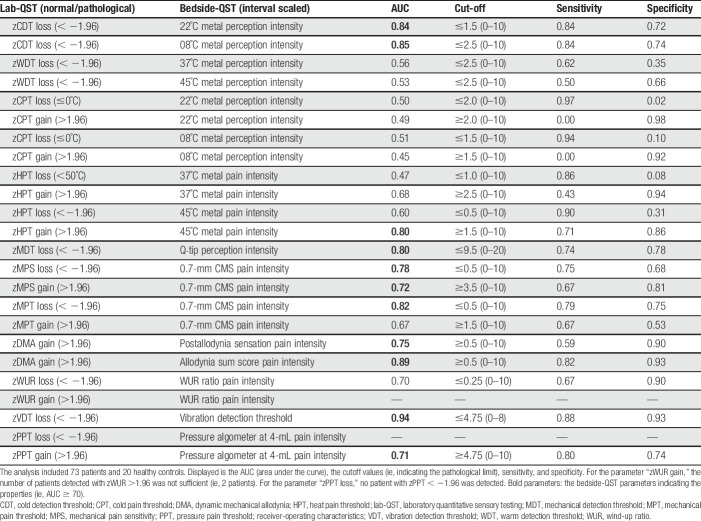
3.5. Receiver-operating characteristics
The ROCs identified cutoff values for pathological values as well as the corresponding sensitivity and specificity for each bedside-QST parameter. This approach enables the identification of hypoalgesia or hyperalgesia for the respective stimulus. The bedside-QST parameters indicated poor to excellent agreements as compared to gold standard lab-QST parameters (Table 4).
Table 4.
ROCs of bedside-QST parameters and corresponding lab-QST parameters.
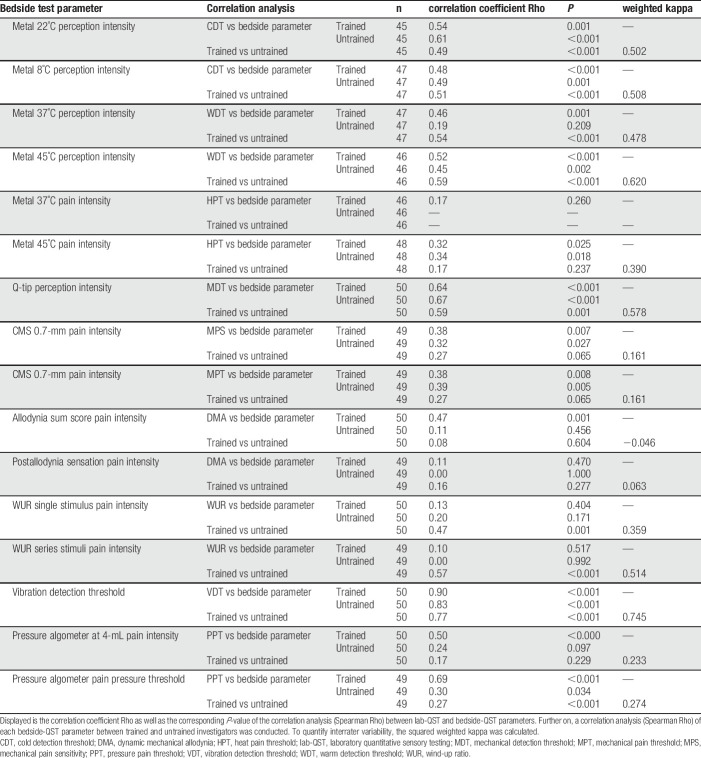
3.6. Impact of training on the accuracy of bedside testing
To address the impact of training, 50 patients were examined by trained and untrained investigators. The results indicate that the bedside parameters assessed by the trained investigators do have better correlations with QST parameters. The parameter after allodynia sensation indicated a weak correlation between QST and bedside parameters. In the untrained investigators group, no correlation between QST and bedside parameters were found in the parameters metal 37°C, allodynia sum score, pressure threshold, and pressure at 4 mL, indicating that training might improve these parameters. The low interrater variability (kappa: 0.161) as well as no correlation between the trained and untrained data of the CMS 0.7-mm parameter suggests that training is crucial to improve its performance (Table 5).
Table 5.
Correlation analysis of lab-QST and bedside-QST parameters.
3.7. Selection of bedside quantitative sensory testing parameters indicative for the sensory phenotype
The 3-cluster solution approach assigned patients to the sensory loss cluster (n = 34, [47%]), the thermal hyperalgesia cluster (n = 14, [19%]), and the mechanical hyperalgesia cluster (n = 25, [34%]) (Fig. 3).1 In addition, ROCs were calculated to select a combination of bedside-QST parameters most indicative for each lab-QST cluster (Table 1S in the supplementary material, available at http://links.lww.com/PR9/A63). For the “sensory loss” cluster 1, the combination of parameters 08° metal perception intensity, Q-tip perception intensity, WUR single pain intensity, and vibration threshold revealed an excellent agreement (AUC 0.91). For the “thermal hyperalgesia” cluster 2, the combination of parameters 08° metal perception intensity and vibration threshold revealed a good agreement (AUC 0.83). For the “mechanical hyperalgesia” cluster 3, the combination of parameters Q-tip perception intensity, WUR single pain intensity, and WUR series pain intensity revealed a fair agreement (AUC 0.75) (Fig. 4). To calculate a score for each bedside cluster, the ROC cutoffs of each bedside-QST parameter were used to determine the likelihood for the cluster affiliation (eg, if the parameter indicated a positive cluster affiliation, the parameter scored 1, if not the parameter scored 0).
Figure 3.
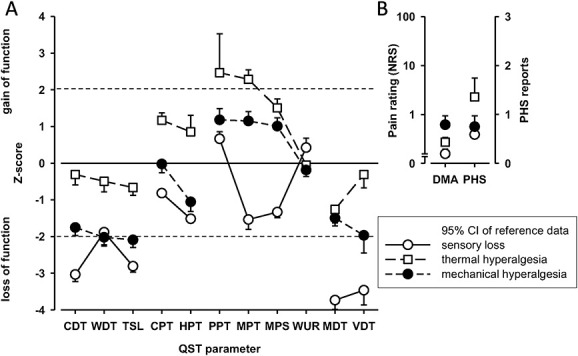
Lab-QST clusters. (A) Displayed are the frequencies (%) of abnormal values and, (B) the z-values as compared to normative DFNS data. Cluster 1 (sensory loss) (n = 34), cluster 2 (thermal hyperalgesia) (n = 14), cluster 3 (mechanical hyperalgesia) (n = 25). The dotted gray line represents ±1.96 SDs from the mean of corresponding normative values of the age-, sex-, and location-matched DFNS database. All z-values <1.96 represent a loss of function, all z-values >1.96 indicate a gain of function. CDT, cold detection threshold; CPT, cold pain threshold; DMA, dynamic mechanical allodynia; HPT, heat pain threshold; lab-QST, lab-Quantitative Sensory Testing; MDT, mechanical detection threshold; MPT, mechanical pain threshold; MPS, mechanical pain sensitivity; PHS, paradoxical heat sensation; PPT, pain pressure threshold; TSL, thermal sensory limen; VDT, vibration detection threshold; WDT, warm detection threshold; WUR, wind-up ratio.
Figure 4.
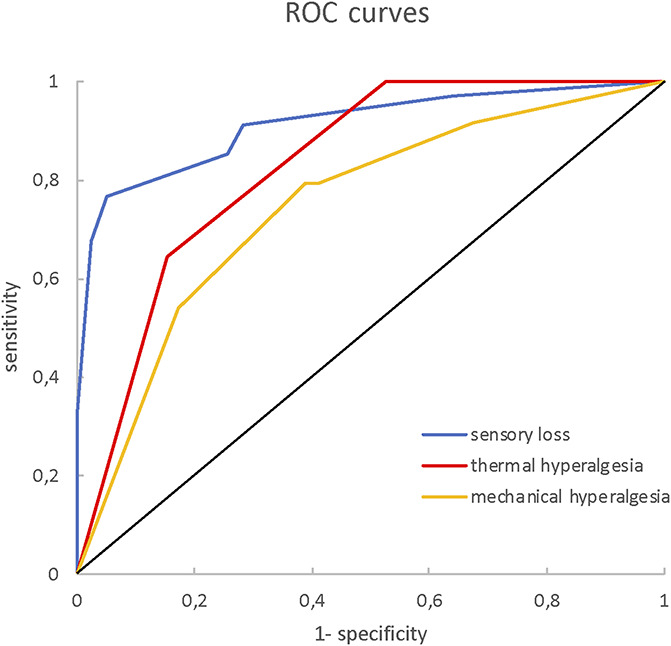
Bedside-QST cluster solutions. Displayed are the ROC curves of the 3 bedside-QST cluster solutions as compared to the respective lab-QST cluster. Bedside Cluster I (sensory loss): AUC = 0.91, cutoff: ≥ 0.292 (sensitivity = 0.91, specificity = 0.72). Bedside Cluster II (thermal hyperalgesia): AUC = 0.83, cutoff: ≥ 0.750 (sensitivity = 0.64, specificity = 0.85). Bedside Cluster III (mechanical hyperalgesia): AUC = 0.75, cutoff: ≥ 0.583 (sensitivity = 0.79, specificity = 0.61). lab-QST, laboratory quantitative sensory testing; ROC, receiver-operating characteristics.
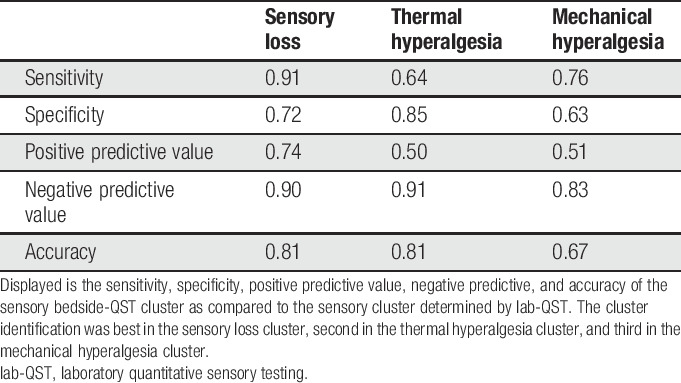
Finally, the sensitivities and specificities of the bedside-QST cluster stratifications as compared to the lab-QST were calculated (Table 6).
Table 6.
Comparison of bedside-QST and lab-QST cluster solutions.
The following equations were invented to calculate a score for each bedside cluster:
Cluster 1:
 |
Cluster 2:
 |
Cluster 3:
 |
4. Discussion
4.1. The pros and cons of bedside quantitative sensory testing
Recently, attempts have been made to develop bedside test devices most indicative for lab-QST parameters,4,21 without touching upon the demand for a bedside-QST cluster stratification. Both studies used correlation approaches in combination with a standard laboratory-based QST to identify the most reliable sensory testing parameters. However, some issues such as the training status of unexperienced study personal in clinical trials were neglected. Another important difference between the presented bedside-QST protocols and the lab-QST protocol, which should be taken into account, is the suprathreshold stimulus response assessment in most bedside-QST protocols (exception: vibration and pressure threshold). The lab-QST assesses the individual perception threshold at which the stimulus is perceived first. However, it is not clear whether the stimulus-response kinetic is similar for subthreshold and suprathreshold stimuli. Furthermore, the fact that a bedside device may indicate only a weak correlation with the lab-QST but still may be reliable to identify a sensory phenotype should be noted. Another general issue of sensory testing is the assessment of spontaneous pain. QST evaluates pain thresholds (ie, evoked pain) through thermal and mechanical stimuli. The fact that both evoked and spontaneous pain qualities can be found in neuropathic conditions does not simplify pain assessment, and it is not understood how evoked and spontaneous pain do correlate. An interesting result suggested that spontaneous pain qualities such as burning pain are the result of an hyperexcitable TRPV1 channel that is activated below body temperature.3 This however may point to a threshold problem rather than different underlying mechanisms. The fact that psychophysical measures lack objective spontaneous pain assessment methods may therefore be a general limitation of sensory testing approaches.
This study characterized bedside-QST assessment devices, showing several advantages as well as limitations. The study's aim was to test a variety of devices assessing different sensory modalities and thereby find a corresponding bedside device for each lab-QST parameter. Indeed, some assessment devices were able to mimic lab-QST parameter function very closely, whereas for others, a proper bedside device is yet to be found. This might depend, at least in part, on different types of measures, namely threshold vs suprathreshold measures. Therefore, the advantage of the lab-QST protocol remains the higher level of standardization, in the application procedure as well as the assessment of the stimulus response. However, despite the fact that for bedside-QST, the range of tested sensory modalities is usually smaller, and the stimuli are less well standardized, the testing can be performed in significantly shorter time (ie, <5 minutes for the 5 selected test parameters per test area), whereas a full lab-QST assessment is much more time-consuming (ie, 30 minutes per test area). Another advantage of the bedside-QST is that expensive devices such as a thermotest device, a pinprick set, as well as von Frey hairs are not required. Therefore, the proposed bedside-QST battery could be implemented in clinical settings as well as clinical trials, which so far have not used QST for feasibility reasons. However, our results also indicate that for specific bedside parameters, a training should be conducted to increase validity of the testing results.
4.2. Selection of promising bedside parameters
Four approaches can be summarized to compare the properties of an easy-to-use simple bedside-QST with the laboratory-based QST:
To compare the sensitivity and specificity of dichotomous questions in the bedside-QST (ie, stimulus perceived/painful [yes/no]) to normal/abnormal lab-QST results.
To calculate ROCs to determine cutoff values for ordinal-scaled bedside-QST parameter perception/pain intensities.
To assess the influence of the investigator's training status (ie, trained/untrained) on the accuracy of the assessment for the most promising parameters.
To stratify patients to the corresponding sensory lab-QST cluster by selecting the most indicative set of bedside-QST parameters for each sensory cluster.
To develop a short and simple-to-use sensory assessment protocol, a selection process of the test parameters was performed based on several considerations. (1) the bedside-QST parameters indicating the best properties (ie, AUC: ≥70) in the previous statistical analyses were selected, (2) practical issues were evaluated (ie, only one temperature device, parameter validity based on training status), (3) the interpretation of parameters assessing hypersensitivity towards cold pain or light mechanical stimuli is limited since those positive sensory signs were not frequent in this study cohort.
Finally, based on the accuracy for sensory cluster identification, the 5 most indicative parameters were selected and implemented in the “Bedside Cluster Assessment” for bedside cluster stratification (Fig. 5). However, similar to the lab-QST cluster stratification, the resulting metric may assign the same patient to more than one cluster. This, however, mimics the probabilistic approach of the original lab-QST cluster analysis. Furthermore, the fact applies that a differentiation of the 3 lab-QST clusters depends on the combination of the 13 different QST parameters (ie, sensory profile) and that certain parameters for itself do not have a good differentiation capacity. Therefore, the reduction of parameters may contribute to an increased overlap of cluster allocation.
Figure 5.
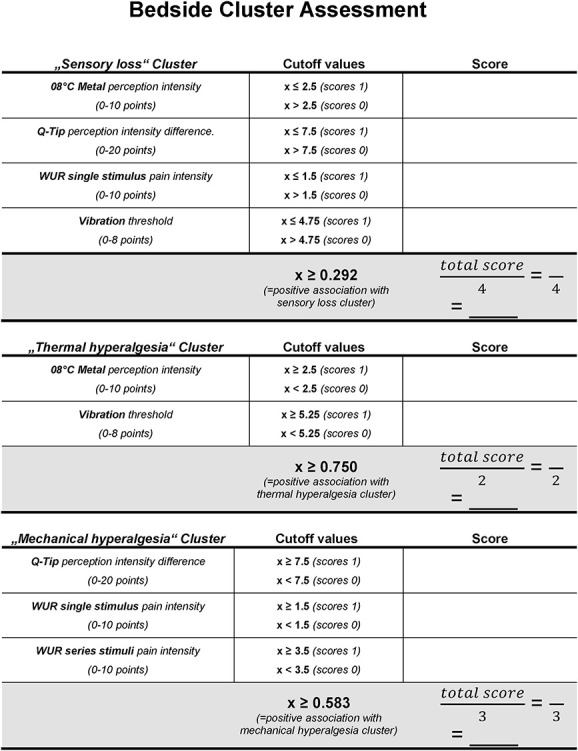
Bedside-QST cluster assessment. Displayed is the calculation sheet for the bedside-QST cluster assessment. The cutoff values indicate the individual ordinal-scale limits for bedside-QST parameters as well as cutoff ratios (total score divided by the number of bedside parameters) for each sensory cluster. QST, quantitative sensory testing.
4.3. Future implications for a sensory bedside quantitative sensory testing assessment
Several studies indicated that presence or absence of small/large fiber function may predict a positive therapeutic outcome. For example, Demant et al. indicated that patients with small fiber integrity (ie, irritable nociceptor type) responded better to oxcarbazepine than those patients with nonirritable nociceptors.6 However, this needs to be interpreted with caution because the irritable nociceptor subgroup had better success rates in previous treatment attempts than the nonirritable nociceptors. More recently, a phase IIa study indicated a significant, treatment response for the oral TRPA 1 antagonist (GRC 17536) after 4 weeks.14 Interestingly, only in a subgroup of patients with preserved A-delta- and C-fiber function (ie, >18° CDT and <49°C HPT), these effects were shown. This implicates that for additional phase 3 or 4 studies, scrutinizing pharmacological treatment effects on a subpopulation with small fiber integrity, bedside-QST parameters such as metal 08/22/45°C could be adequate stratification tools. Another study indirectly suggested that patients with a sensory loss do benefit from a treatment with opioids.7 In light of the present opioid crisis, such a bedside tool in combination with other screening questionnaires could help excluding a significant amount of people from an unnecessary opioid treatment. However, still a validation of the proposed bedside assessment needs to be completed before implementing such an approach in clinical trials.
4.4. Conclusions
The bedside-QST is a cheap and easy-to-use method to assess somatosensory abnormalities in neuropathic conditions. Many parameters compare well with the lab-based QST. Our results suggest that in the future, a combination of parameters should be selected, rather than single bedside items to test for neuropathy-related mechanisms. Moreover, in clinical routine, the idea of allocating each patient to a sensory cluster and applying the corresponding treatment may be fostered by such a bedside-QST. However, first steps into the direction of bedside clustering have been made. Although, a proper solution for some issues such as the multiple cluster allocation still need to be conquered.
4.5. Limitations
The beside-QST was assessed at one point in time only, either by trained or untrained investigators. Therefore, results on repeatability or intraindividual variation were not obtained.
Because of the methodological focus, parameters such as current medication, medication history, and treatment effects were not assessed. This restrains the notion of a phenotype-guided treatment recommendation.
Disclosures
M. Reimer has received speaking fees and travel expenses from Pfizer, Grünenthal, Astellas, and grant/research support from Mundipharma and Grünenthal. J.C. Otto reports research support from Grünenthal GmbH and travel costs from Pfizer. J. Forstenpointner reports personal fees and nonfinancial support from Grünenthal GmbH and Sanofi Genzyme, personal fees from Bayer, nonfinancial support from Novartis, outside the submitted work. J. Vollert has received consulting fees from CASQUAR GmbH, outside this work. J. Gierthmühlen has received speaking fees and travel grants from Pfizer, Sanofi Pasteur, and Grünenthal and has been a consultant for Glenmark Pharmaceuticals. T. Klein was an employee of Mundipharma Research GmbH & Co.KG. P. Hüllemann reports speaking fees from Pfizer and Genzyme and travel reimbursement from Grünenthal. R. Baron reports personal fees from Pfizer Pharma GmbH, Genzyme GmbH, Grünenthal GmbH, Mundipharma Research GmbH und Co. KG, Allergan, Sanofi Pasteur, Medtronic, Eisai, Lilly GmbH, Boehringer Ingelheim Pharma GmbH& Co.KG, Astellas Pharma GmbH, Novartis Pharma GmbH, Bristol-Myers Squibb, Biogenidec, AstraZeneca GmbH, Merck, Abbvie, Bayer-Schering, MSD GmbH, Daiichi Sankyo, Glenmark Pharmaceuticals S.A., Seqirus Australia Pty. Ltd, Teva Pharmaceuticals Europe Niederlande, Teva GmbH, Genentech, Mundipharma International Ltd. UK, Astellas Pharma Ltd. UK, TAD Pharma GmbH, Galapagos NV, Kyowa Kirin GmbH, Vertex Pharmaceuticals Inc., Biotest AG, Celgene GmbH, Desitin Arzneimittel GmbH, Regeneron Pharmaceuticals Inc. USA, Theranexus DSV CEA Frankreich, Grünenthal SA Portugal, Abbott Products Operations AG Schweiz, Bayer AG, Grünenthal Pharma AG Schweiz, Mundipharma Research Ltd. UK, Akcea Therapeutics Germany GmbH, Asahi Kasei Pharma Corporation, AbbVie Deutschland GmbH & Co. KG, Air Liquide Sante International Frankreich, Alnylam Germany GmbH, Lateral Pharma Pty Ltd, Hexal AG, Ethos Srl Italien, Janssen, Sanofi-Aventis Deutschland GmbH, Agentur Brigitte Süss, Grünenthal B.V. Niederlande and grants/research support from EU Projects: Europain (115007). DOLORisk (633491). IMI Paincare (777500). German Federal Ministry of Education and Research (BMBF): Verbundprojekt: Frühdetektion von Schmerzchronifizierung (NoChro) (13GW0338C). German Research Network on Neuropathic Pain (01EM0903). Pfizer Pharma GmbH, Genzyme GmbH, Grünenthal GmbH, Mundipharma Research GmbH und Co. KG., Alnylam Pharmaceuticals Inc., Zambon GmbH. The remaining author has no conflicts of interest to declare.
This study was funded by Mundipharma Research Ltd.
This work was supported by the European Union's Horizon 2020 research and innovation program under grant agreement No 633491 (DOLORisk). The authors acknowledge financial support by Land Schleswig-Holstein within the funding program Open Access Publikationsfonds.
Acknowledgements
The authors thank all participating patients, colleagues, and the staff of the institutions for their contributions to data collection. Statistical advice was provided by Prof. Dr. Dempfle (Institute of Medical Informatics and Statistics, Kiel University, Germany).
T. Klein is an ex-employee of Mundipharma Research Ltd.
Appendix A. Supplemental digital content
Supplemental digital content associated with this article can be found online at http://links.lww.com/PR9/A63.
Footnotes
Sponsorships or competing interests that may be relevant to content are disclosed at the end of this article.
M. Reimer and J. Forstenpointner contributed equally to this work.
Supplemental digital content is available for this article. Direct URL citations appear in the printed text and are provided in the HTML and PDF versions of this article on the journal's Web site (www.painrpts.com).
References
- [1].Baron R, Maier C, Attal N, Binder A, Bouhassira D, Cruccu G, Finnerup NB, Haanpaa M, Hansson P, Hullemann P, Jensen TS, Freynhagen R, Kennedy JD, Magerl W, Mainka T, Reimer M, Rice AS, Segerdahl M, Serra J, Sindrup S, Sommer C, Tolle T, Vollert J, Treede RD. Peripheral neuropathic pain: a mechanism-related organizing principle based on sensory profiles. PAIN 2017;158:261–72. [DOI] [PMC free article] [PubMed] [Google Scholar]
- [2].Beydoun A, Shaibani A, Hopwood M, Wan Y. Oxcarbazepine in painful diabetic neuropathy: results of a dose-ranging study. Acta Neurol Scand 2006;113:395–404. [DOI] [PubMed] [Google Scholar]
- [3].Biggs JE, Yates JM, Loescher AR, Clayton NM, Robinson PP, Boissonade FM. Effect of SB-750364, a specific TRPV1 receptor antagonist, on injury-induced ectopic discharge in the lingual nerve. Neurosci Lett 2008;443:41–5. [DOI] [PubMed] [Google Scholar]
- [4].Buliteanu A, Lazaridou A, Schreiber K, Edwards R, Rajan S, Garcia J, White J, Gibbons C, Illigens B, Freeman R. Validation of a bedside quantitative sensory testing (QST) protocol in chronic neuropathic pain. J Pain 2018;19:S52. [Google Scholar]
- [5].Demant DT, Lund K, Finnerup NB, Vollert J, Maier C, Segerdahl MS, Jensen TS, Sindrup SH. Pain relief with lidocaine 5% patch in localized peripheral neuropathic pain in relation to pain phenotype: a randomised, double-blind, and placebo-controlled, phenotype panel study. PAIN 2015;156:2234–44. [DOI] [PubMed] [Google Scholar]
- [6].Demant DT, Lund K, Vollert J, Maier C, Segerdahl M, Finnerup NB, Jensen TS, Sindrup SH. The effect of oxcarbazepine in peripheral neuropathic pain depends on pain phenotype: a randomised, double-blind, placebo-controlled phenotype-stratified study. PAIN 2014;155:2263–73. [DOI] [PubMed] [Google Scholar]
- [7].Edwards RR, Haythornthwaite JA, Tella P, Max MB, Raja S. Basal heat pain thresholds predict opioid analgesia in patients with postherpetic neuralgia. Anesthesiology 2006;104:1243–8. [DOI] [PubMed] [Google Scholar]
- [8].Hincker A, Frey K, Rao L, Wagner-Johnston N, Ben Abdallah A, Tan B, Amin M, Wildes T, Shah R, Karlsson P, Bakos K, Kosicka K, Kagan L, Haroutounian S. Somatosensory predictors of response to pregabalin in painful chemotherapy-induced peripheral neuropathy: a randomized, placebo-controlled, crossover study. PAIN 2019;160:1835–46. [DOI] [PMC free article] [PubMed] [Google Scholar]
- [9].Magerl W, Krumova EK, Baron R, Tolle T, Treede RD, Maier C. Reference data for quantitative sensory testing (QST): refined stratification for age and a novel method for statistical comparison of group data. PAIN 2010;151:598–605. [DOI] [PubMed] [Google Scholar]
- [10].Pfau DB, Geber C, Birklein F, Treede RD. Quantitative sensory testing of neuropathic pain patients: potential mechanistic and therapeutic implications. Curr Pain Headache Rep 2012;16:199–206. [DOI] [PubMed] [Google Scholar]
- [11].Rolke R, Baron R, Maier C, Tolle TR, Treede RD, Beyer A, Binder A, Birbaumer N, Birklein F, Botefur IC, Braune S, Flor H, Huge V, Klug R, Landwehrmeyer GB, Magerl W, Maihofner C, Rolko C, Schaub C, Scherens A, Sprenger T, Valet M, Wasserka B. Quantitative sensory testing in the German Research Network on Neuropathic Pain (DFNS): standardized protocol and reference values. PAIN 2006;123:231–43. [DOI] [PubMed] [Google Scholar]
- [12].Safari S, Baratloo A, Elfil M, Negida A. Evidence based emergency medicine; Part 5 receiver operating curve and area under the curve. Emergency (Tehran) 2016;4:111–13. [PMC free article] [PubMed] [Google Scholar]
- [13].Shaibani A, Fares S, Selam JL, Arslanian A, Simpson J, Sen D, Bongardt S. Lacosamide in painful diabetic neuropathy: an 18-week double-blind placebo-controlled trial. J Pain 2009;10:818–28. [DOI] [PubMed] [Google Scholar]
- [14].Tandon M, Jain SM, Balamurugan R, Rahman MU, Salhi Y, Holland RL, Baron R. (PTH78) A simple algorithm to identify likely responders to GRC 17356 in patients of painful diabetic peripheral neuropathy using sensory mapping. Proceedings of the 7th International Congress on Neuropathic Pain, London, United Kingdom, May 9, 2019. [Google Scholar]
- [15].Vinik AI, Tuchman M, Safirstein B, Corder C, Kirby L, Wilks K, Quessy S, Blum D, Grainger J, White J, Silver M. Lamotrigine for treatment of pain associated with diabetic neuropathy: results of two randomized, double-blind, placebo-controlled studies. PAIN 2007;128:169–79. [DOI] [PubMed] [Google Scholar]
- [16].Vollert J, Attal N, Baron R, Freynhagen R, Haanpaa M, Hansson P, Jensen TS, Rice AS, Segerdahl M, Serra J, Sindrup SH, Tolle TR, Treede RD, Maier C. Quantitative sensory testing using DFNS protocol in Europe: an evaluation of heterogeneity across multiple centers in patients with peripheral neuropathic pain and healthy subjects. PAIN 2016;157:750–8. [DOI] [PubMed] [Google Scholar]
- [17].Vollert J, Magerl W, Baron R, Binder A, Enax-Krumova EK, Geisslinger G, Gierthmuhlen J, Henrich F, Hullemann P, Klein T, Lotsch J, Maier C, Oertel B, Schuh-Hofer S, Tolle TR, Treede RD. Pathophysiological mechanisms of neuropathic pain: comparison of sensory phenotypes in patients and human surrogate pain models. PAIN 2018;159:1090–102. [DOI] [PubMed] [Google Scholar]
- [18].Vollert J, Maier C, Attal N, Bennett DLH, Bouhassira D, Enax-Krumova EK, Finnerup NB, Freynhagen R, Gierthmuhlen J, Haanpaa M, Hansson P, Hullemann P, Jensen TS, Magerl W, Ramirez JD, Rice ASC, Schuh-Hofer S, Segerdahl M, Serra J, Shillo PR, Sindrup S, Tesfaye S, Themistocleous AC, Tolle TR, Treede RD, Baron R. Stratifying patients with peripheral neuropathic pain based on sensory profiles: algorithm and sample size recommendations. PAIN 2017;158:1446–55. [DOI] [PMC free article] [PubMed] [Google Scholar]
- [19].Vollert J, Mainka T, Baron R, Enax-Krumova EK, Hullemann P, Maier C, Pfau DB, Tolle T, Treede RD. Quality assurance for Quantitative Sensory Testing laboratories: development and validation of an automated evaluation tool for the analysis of declared healthy samples. PAIN 2015;156:2423–30. [DOI] [PubMed] [Google Scholar]
- [20].Wasner G, Kleinert A, Binder A, Schattschneider J, Baron R. Postherpetic neuralgia: topical lidocaine is effective in nociceptor-deprived skin. J Neurol 2005;252:677–86. [DOI] [PubMed] [Google Scholar]
- [21].Zhu GC, Bottger K, Slater H, Cook C, Farrell SF, Hailey L, Tampin B, Schmid AB. Concurrent validity of a low-cost and time-efficient clinical sensory test battery to evaluate somatosensory dysfunction. Eur J Pain 2019;23:1826–38. [DOI] [PMC free article] [PubMed] [Google Scholar]


