Supplemental Digital Content is available in the text
Keywords: citrullinated alpha enolase peptide-1 antibody, C-reactive protein, interleukin-6, neutrophil gelatinase-associated lipocalin, procalcitonin, sepsis
Abstract
We examined the blood concentrations of neutrophil gelatinase-associated lipocalin (NGAL) and citrullinated alpha enolase peptide-1 (CEP-1) antibody in sepsis patients to evaluate their potential diagnostic, classified and prognostic utility together with C-reactive protein (CRP), procalcitonin (PCT), interleukin-6 (IL-6).
Sixty-nine patients admitted at the emergency department with sepsis were studied, on admission, their demographic and clinical information were recorded. Blood levels of CRP, PCT, IL-6, NGAL, and CEP-1 antibody were measured. Relationships between sequential [sepsis-related] organ failure assessment score and blood biomarkers, between acute physiology and chronic health evaluation II score and blood biomarkers were investigated. Additionally, the mutual correlation among CRP, PCT, IL-6, NGAL, and CEP-1 antibody were investigated. Diagnostic and predictive values for clinical outcomes for biomarkers were assessed by receiver operator characteristic curve.
Sixty-nine participants (38 sepsis, 31 septic shock) were compared with 40 healthy controls. The levels of CRP, PCT, IL-6, and NGAL were significantly higher in sepsis patients ([59.49 ± 48.88]; 0.71, [0.13–11.72]; 60.46, [33.26–201.20]; 265.61, [185.79–500.96], respectively) compared with healthy controls ([2.05 ± 1.85]; 0.02, [0.02–0.03]; 12.08, [7.22–16.84]; 19.73, [7.66–34.39], respectively) (P < .001). CRP, PCT, IL-6, and NGAL had better discriminatory performance with an area under the receiver operator characteristic curve (AUC) of (0.98; 0.98; 0.90; 0.97, respectively), 95% confidence interval (CI) = ([0.95; 1.00]; [0.96; 1.00]; [0.84; 0.96]; [0.94; 1.00], respectively) (P < .001), with a cut off value of (8.02 mg/L [Se = 88.40%, Sp = 100.00%]; 0.06 ng/mL [Se = 94.20%, Sp = 75.00%]; 30.63 pg/mL [Se = 78.30%, Sp = 95.00%]; 95.72 ng/mL [Se = 99.00%, Sp = 92.00%], respectively). Between the sepsis group and septic shock group, PCT and NGAL were significantly higher in septic shock group (2.44, [0.49–20.36]; 294.65 [203.34–1262.47], respectively) compared with sepsis group (0.41, [0.11–2.63]; 219.94, [146.38–385.24], respectively) (P < .05). Between survivors group and nonsurvivors group, PCT was obviously elevated in nonsurvivors group (2.47, [0.70–12.49]) compare with survivors group (0.41, [0.11–8.16]) (P < .05), with an AUC of 0.69, 95% CI = (0.57; 0.81) (P < .05), while CEP-1 antibody was decreased in nonsurvivors group (14.03, [4.94–17.17]) contrast to survivors group (18.78, [8.08–39.72]) (P < .05), with an AUC of 0.67, 95% CI = (0.54; 0.80) (P < .05). Additionally, CEP-1 antibody demonstrated a negative correlation with either sequential [sepsis-related] organ failure assessment score (r = −0.31, P < .05) or PCT (r = −0.27, P < .05).
As CRP, PCT, and IL-6, NGAL was valuable in sepsis diagnosis. With a classificatory value, PCT and NGAL correlated with the degree severity of sepsis. PCT and CEP-1 antibody were meaningful in sepsis prognosis. CEP-1 antibody may be a protective factor for sepsis.
1. Introduction
Sepsis is a big threat for patients admitted to the emergency department, as it will be unavoidable once life- threatening organs happened caused by dysregulated host response to infection.[1] So long as the situation goes on, it will eventually lead to septic shock with significant mortality if irreversible hypotension happened to occur. The earlier diagnosis, classification, and accurate treatment the patients get, the better prognosis they will have. In recent years, more and more investigations are focused on biomarkers because a biomarker with high accuracy, repeatability, and simplicity would contribute to sepsis diagnosis and improve the prediction of mortality.[2–3] The physiologic, pathologic, and biochemical abnormalities of sepsis are mainly induced by infection, so biomarkers related to infection may be helpful for the diagnosis and classification of sepsis. C-reaction protein (CRP), procalcitonin (PCT), and interleukin-6 (IL-6) are sensitive indicators of infection that can be detected in serum.[4–5] Because of widespread use, good reproducibility, and low cost, PCT and CRP are frequently detected when an infected patient is suspected of suffering from sepsis. IL-6 has been investigated for its ability to diagnose sepsis, Chan T et al[6] found that IL-6 was useful biomarker for sepsis diagnosis and prognosis. Serum IL-6 was significantly elevated in sepsis, and higher when the disease progresses to septic shock even death.[7–8] Pham Thi Ngoc Thao et al[9] indicate that a reduction in IL-6 level of ≥86% at 24 hours from intensive care unit admission was a survival predictor for sepsis and septic shock patient. However, PCT, CRP, and IL-6 may not be completely specific for sepsis. Therefore, it is necessary to combine with some other biomarkers for the diagnostic criteria of sepsis.
Neutrophil gelatinase-associated lipocalin (NGAL) is a lipocalin superfamily member synthesized in renal tubular epithelial cells, which has been most extensively known as a novel excellent diagnostic and prognostic marker of acute kidney injury (AKI).[10] Renal failure is a common organ injury in patients with sepsis.[11] Detection of serum NGAL levels may contributes to early diagnosis of sepsis, as the levels of serum NGAL increased with sepsis severity, even much higher in septic patients with AKI than those without AKI.[12] In addition, sepsis patients with sustained Elevation of NGAL may have a higher incidence to develop septic shock.[13] Macdonald SPJ et al illustrated that during infectious processes, plasma NGAL can be elevated which produced by inflammatory cells.[14] Gordon P. Otto et al[15] showed that the elevation of NGAL in sepsis was mainly associated with inflammation.
Citrullinated alpha enolase peptide-1 (CEP-1), one of citrullinated peptides identified as anti-citrullinated protein antibodies autoantigens. CEP-1 antibody has been detected for rheumatoid arthritis (RA) as diagnosis and treatment biomarkers.[16] At present, there is little research on the relationship between sepsis and CEP-1 antibody, but there may be a link between bacterial infections and CEP-1 antibody. Since bacterial infection can induce autoimmunity in RA, CEP-1 antibody cross-reacts with bacterial enolase.[17,18] Additionally, unfettered inflammation and impaired immune function are important reasons for the pathogenesis of sepsis while the generation of CEP-1 autoantigen may be explained by inflammation and immune disorder. Hence, we hypothesized that there may be some relationship between CEP-1 antibody and sepsis.
The above studies mainly discussed the diagnostic and prognostic utility of CRP, PCT, and IL-6 for sepsis. However, further study focuses on the value of NGAL combined with CEP-1 antibody and these biomarkers for sepsis may be more conducive to the diagnosis and treatment of sepsis. We detected the blood concentration of NGAL and CEP-1 antibodies, in order to assess the efficacy of them as sepsis markers.
2. Material and methods
2.1. Study population
During this prospective investigation, a total of 109 subjects in the Peking University Third Hospital were enrolled from April, 2017, through August, 2018. As demonstrated in Table 1, the first group (sepsis patients) was collected from 69 sepsis patients, aged 37 to 95 years old, 59.42% were male (Fig. 1). We strictly followed the SEPSIS-3 diagnostic criteria: in the presence of a known or suspect bacterial infection, an acute change in baseline of the total sequential [sepsis-related] organ failure assessment (SOFA) score ≥2 points can be diagnosed as sepsis.[1] After consent was obtained, consecutive patients, more than 18 years old, met diagnosis criteria for sepsis were enrolled. As a construct of sepsis, patients with persisting hypotension requiring vasopressors to maintain mean arterial pressure (MAP) ≥65 mm Hg and having a serum lactate level >2 mmol/L (18 mg/dL) despite adequate volume resuscitation can be diagnosed as septic shock.[1] In this way, sepsis cases were further classified as sepsis and septic shock (Table 2). Sepsis group (n = 38) aged 54 to 89 years old, 57.89% were male. The common infections were: lung infection (mainly pneumonia) 78.95%, digestive system infection (pancreatitis, biliary tract infection) 15.79%, urinary system infection 2.63%, central nervous system infection 2.63%. Septic group (n = 31) aged 37 to 95 years old, 61.29% were male. The common infections were: lung infection (mainly pneumonia) 74.19%, digestive system infection (pancreatitis, biliary tract infection) 16.13%, urinary system infection 3.23%, central nervous system infection 6.45%. According to mortality at 28 days of hospital stay, sepsis patients were divided into survivors group (n = 46) and nonsurvivors group (n = 23). Survivors group aged 37 to 95 years old, 67.39% were male. The common infections were: lung infection (mainly pneumonia) 76.09%, digestive system infection (pancreatitis, biliary tract infection) 15.22%, urinary system infection 6.52%, central nervous system infection 2.17%. Nonsurvivors group aged 54 to 94 years old, 43.38% were male. The common infections were: lung infection (mainly pneumonia) 78.26%, digestive system infection (pancreatitis, biliary tract infection) 17.39%, urinary system infection 0.00%, central nervous system infection 4.35%. Exclusion criteria were:
Table 1.
Clinical characteristics and baseline demographics of subjects.

Figure 1.
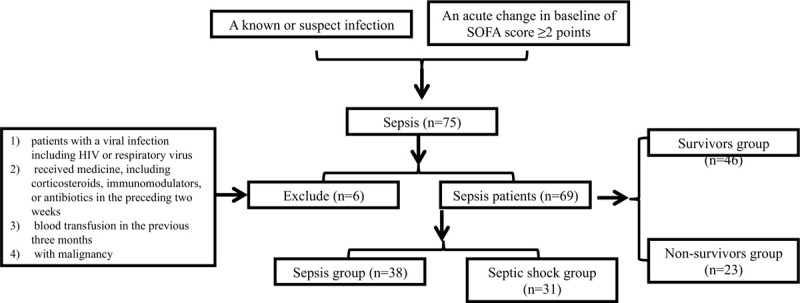
Flowchart exhibiting the selection of the sepsis patients (n = 69). According to the diagnostic criteria of sepsis, 75 patients with sepsis were admitted, 7 of whom were removed due to the exclusion principle, and 69 patients with sepsis remained. Sepsis patients were further divided into sepsis group (n = 38) and septic shock group (n = 31) according to the presence or absence of shock symptoms. Sepsis patients were divided into survivors group (n = 46) and nonsurvivors group (n = 23) according to mortality at 28 d of hospital stay. HIV = human immunodeficiency virus, n = number.
Table 2.
Clinical characteristics and baseline demographics for the subgroup of sepsis patients.

-
(1)
patients with a viral infection including human immunodeficiency virus or respiratory virus;
-
(2)
received medicine, including corticosteroids, immunomodulators, or antibiotics in the preceding 2 weeks;
-
(3)
blood transfusion in the previous 3 months;
-
(4)
with malignancy.
All eligible patients were treated according to standard clinical practice and guidelines.[19] The second group (healthy controls) were gathered from 40 healthy individuals, aged 54 to 87 years old, 60.00% were male, who underwent physical examinations at the same time. The protocol was approved by the local Institutional Ethics Committee.
2.2. Date collection
The acquired clinical datasets were collected upon admission:
-
(1)
patients’ demographic information;
-
(2)
laboratory characteristics;
-
(3)
SOFA score, acute physiology and chronic health evaluation (APACHE) II score.
Once enrolment, blood samples (serum and plasma) were collected on the basis of inclusion criteria. The samples were centrifuged and stored at −80°C for later analysis. PCT and CRP levels were detected in a serum sample. IL-6, NGAL, and CEP-1 antibody concentrations were assessed in the plasma sample. We measured CRP by particle enhanced immunoturbidimetric assay (Beckman coulter AU5800, Brea, CA). PCT levels were measured by an electrochemiluminescence immunoassay system (Roche Elecsys cobas e 411, Switzerland). Both IL-6 (Roche Elecsys cobas e 601, Switzerland) and NGAL (Beckman coulter AU2700, Brea, CA) concentrations were detected using a turbidimetric immunoassay test. Plasma concentrations of CEP-1 antibody were measured using commercial enzyme-linked immunosorbent assay kits (Euroimmun, Germany).
2.3. Statistical analysis
Statistical analysis was performed using SPSS version 22.0. Normally distributed variables were expressed as mean ± standard deviation variables was performed by the Kolmogorov–Smirnov test (P > .10). To compare normally distributed variables between 2 groups, the Student test was utilized. Otherwise, non-normal distributed one used Mann–Whitney U test. Categorical variables were presented as percentages, compared with X2 test. Spearman test was used when assessed correlations among variables. To compare the diagnosis and prognosis value of biomarkers, receiver operator characteristic (ROC) curves were generated, and the area under the receiver operator characteristic curve (AUC) were determined. All statistical tests were 2-tailed, and P-value < .05 was considered statistically significant, and P < .01 was considered as a highly statistical significance.
3. Results
3.1. The significance of biomarkers in the diagnosis of sepsis
As illustrated in Figure 2, the levels of CRP, PCT, IL-6, and NGAL were significantly higher in sepsis patients ([59.49 ± 48.88]; 0.71, [0.13–11.72]; 60.46, [33.26–201.20]; 265.61, [185.79–500.96], respectively) compared with healthy controls ([2.05 ± 1.85]; 0.02, [0.02–0.03]; 12.08, [7.22–16.84]; 19.73, [7.66–34.39], respectively) (P < .001). There was no difference in CEP-1 antibody (P = .26) between them (Fig. S1A, Supplemental Figure, which demonstrated the concentration distribution of CEP-1 antibody for sepsis patients versus healthy controls). ROC curve analysis was employed for estimation of diagnostic value of every blood biomarker in sepsis. Similarly, as shown in Figure 3, CRP, PCT, IL-6, and NGAL had better discriminatory performance with an AUC of (0.98; 0.98; 0.90; 0.97, respectively), 95% confidence interval (CI) = ([0.95; 1.00]; [0.96; 1.00]; [0.84; 0.96]; [0.94; 1.00], respectively) (P < .001), with a cut off value of (8.02 mg/L [Se = 88.40%, Sp = 100.00%]; 0.06 ng/mL [Se = 94.20%, Sp = 75.00%]; 30.63 pg/mL [Se = 78.30%, Sp = 95.00%]; 95.72 ng/mL [Se = 99.00%, Sp = 92.00%], respectively), while the ROC curve for CEP-1 antibody yielded an AUC value of 0.44 (95% CI = [0.33; 0.54], P = 0.26), (Fig. S1B, Supplemental Figure, which demonstrated the ROC curve of CEP-1 antibody for sepsis patients versus healthy controls).
Figure 2.
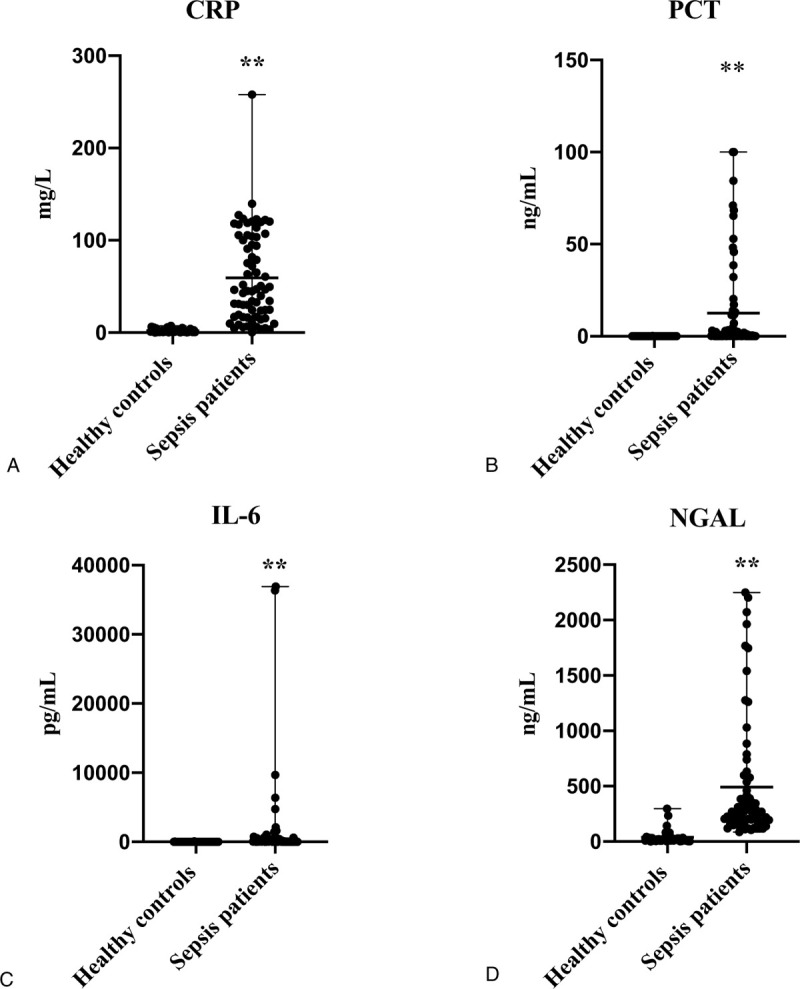
Distribution of the biomarker levels in healthy controls and sepsis patients: (A), of CRP; (B), of PCT; (C), of IL-6; (D), of NGAL. ∗P < .05 Compared with healthy controls; ∗∗P < .01 Compared with healthy controls. The levels of CRP, PCT, IL-6, and NGAL were significantly higher in sepsis patients compared with healthy controls (P < .001). CRP = C-reactive protein, IL-6 = interleukin-6, NGAL = neutrophil gelatinase-associated lipocalin, PCT = procalcitonin.
Figure 3.
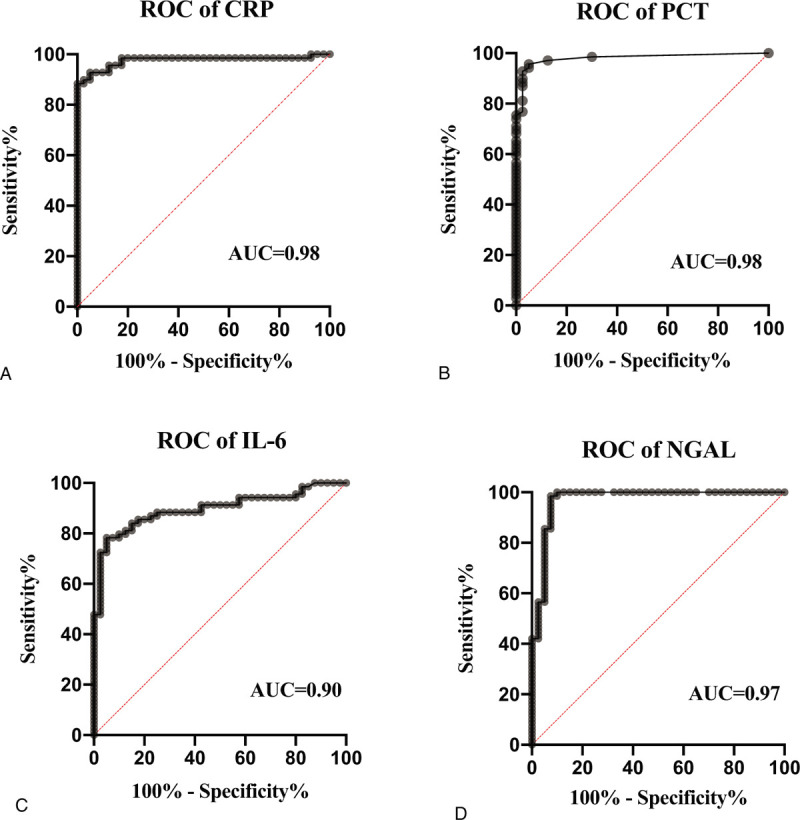
ROC curves for diagnosis of sepsis according to the levels of biomarkers. (A), of CRP; (B), of PCT; (C), of IL-6; (D), of NGAL. CRP, PCT, IL-6, and NGAL had discriminatory performance with an AUC of (0.98; 0.98; 0.90; 0.97, respectively). AUC = area under the receiver operator characteristic curve, CRP = C-reactive protein, IL-6 = interleukin-6, NGAL = neutrophil gelatinase-associated lipocalin, PCT = procalcitonin, ROC = receiver operator characteristic.
3.2. The significance of biomarkers in the classification of sepsis
As described in Figure 4, between the sepsis group and septic shock group, PCT and NGAL were significantly higher in septic shock group (2.44, [0.49–20.36]; 294.65 [203.34–1262.47], respectively) compared with sepsis group (0.41, [0.11–2.63]; 219.94, [146.38–385.24], respectively) (P < .05). Although without significant difference, the levels of CRP (P = 0.46) and IL-6 (P = 0.14) were higher in the septic shock group ([64.34 ± 53.63]; 158.7, [34.70–647.20], respectively) than in the sepsis group ([55.54 ± 44.99]; 58.59, [26.65–157.13] respectively) (Fig. S2A and B, Supplemental Figure, which illustrated the distribution of CRP (A) and IL-6 (B) levels in sepsis group and septic shock group), the concentrations of CEP-1 antibody were lower in the septic shock group (17.91 ± 13.68) than in the sepsis group (31.17 ± 44.16) (P = 0.09) (Fig. S2C, Supplemental Figure, which illustrated the distribution of Anti-CEP-1 levels in sepsis group and septic shock group).
Figure 4.
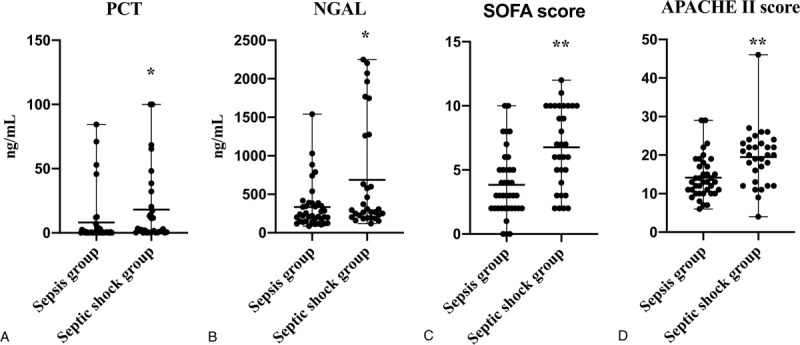
Distribution of the PCT (A), NGAL (B) levels and SOFA score (C), APACHE II score (D) for sepsis group versus septic shock group. ∗P < .05 Compared with sepsis group; ∗∗P < .01 Compared with sepsis group. Between the sepsis group and septic shock group, PCT, NGAL levels and SOFA score, APACHE II score were significantly higher in septic shock group compared with sepsis group (P < .05). APACHE = acute physiology and chronic health evaluation, NGAL = neutrophil gelatinase-associated lipocalin, PCT = procalcitonin, SOFA = sequential [sepsis-related] organ failure assessment.
The reference ranges of CRP, PCT, IL-6, and NGAL were ≤3 mg/L, <0.1 ng/mL, <7 pg/mL, and 37 to 180 ng/mL, respectively. Based on their upper limit of their reference value, according to the distribution characteristics of CRP, PCT, IL-6, and NGAL, the measurement results of CRP, PCT, and IL-6 were divided into 3 levels: (low level: < upper limit ∗ 10), (middle level: upper limit ∗10- upper limit ∗ 50), (high level: > upper limit ∗ 50). NGAL was divided into 3 levels: (low level: < upper limit), (middle level: upper limit - upper limit ∗ 3), (high level: > upper limit ∗ 3). The positivity for anti-CEP-1 was characterized as values more than 20 RU/mL. Figure 5 and S3 shows the prevalence of CRP, PCT, IL-6, NGAL, and anti-CEP-1 in sepsis group and septic shock group. The proportion of middle and high levels of PCT, IL-6, and NGAL were significantly more in septic shock group (64.52%, 58.07%, 90.32%, respectively) compared with sepsis group (31.58%, 39.47%, 71.05%, respectively) (P < .05) (Fig. 5). There was no difference both in the distribution characteristics of CRP (P = .78) and the positive rates of CEP-1 antibody (P = .58) between them (Fig. S3, Supplemental Figure, which showed the prevalence of CRP (A) and anti-CEP-1 (B) in sepsis group and septic group).
Figure 5.
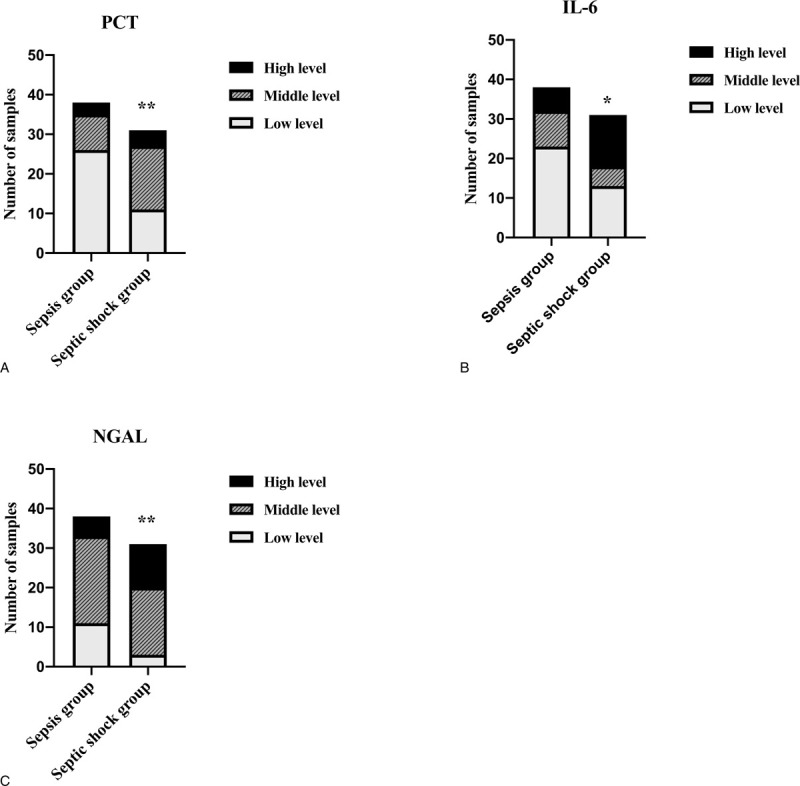
The prevalence of indicators in sepsis group and septic group: (A), of PCT; (B), of IL-6; (C), of NGAL. ∗P < .05 Compared with sepsis group; ∗∗P < .01 Compared with sepsis group. For PCT and IL-6: low level =< upper limit ∗ 10; middle level = upper limit ∗10- upper limit ∗ 50; high level => upper limit ∗ 50; For NGAL: low level =< upper limit; middle level=upper limit - upper limit ∗ 3 high level => upper limit ∗ 3. The proportion of middle and high levels of PCT, IL-6, and NGAL were significantly more in septic shock group compared with sepsis group (P < .05). IL-6 = interleukin-6, NGAL = neutrophil gelatinase-associated lipocalin, PCT = procalcitonin.
3.3. The significance of biomarkers in the prognosis of sepsis
Between survivors group and nonsurvivors group, PCT was obviously elevated in nonsurvivors group (2.47, [0.70–12.49]) compare with survivors group (0.41, [0.11–8.16]) (P < .05), while CEP-1 antibody was decreased in nonsurvivors group (14.03, [4.94–17.17]) contrast to survivors group (18.78, [8.08–39.72]) (P < .05) (Fig. 6). Although without significant difference, the levels of CRP (P = 0.20), IL-6 (P = 0.61), and NGAL (P = 0.58) were higher in nonsurvivors group ([72.41 ± 58.16]; 65.94, [32.53–620.50]; 256.61, [192.46–598.97], respectively) than in the survivors group ([53.03 ± 42.77]; 59.40, [34.21–395.45]; 259.39, [173.89–481.68], respectively) (Fig. S4, Supplemental Figure, which demonstrated the distribution of CRP (A), IL-6 (B), and NGAL (C) levels in survivors group and nonsurvivors group).
Figure 6.
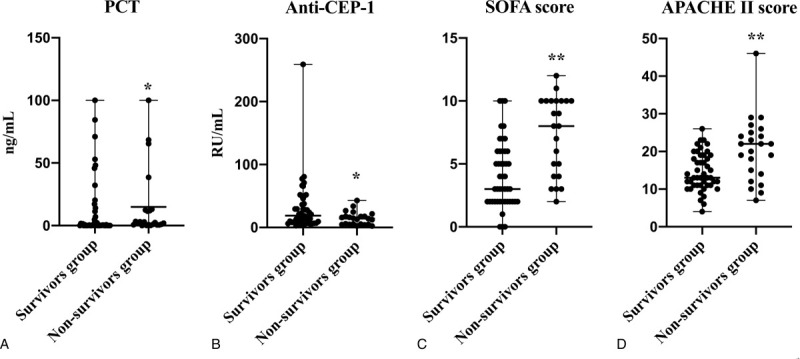
Distribution of the PCT (A), anti-CEP-1 (B) levels and SOFA score (C), APACHE II score (D) for survivors group versus nonsurvivors group. ∗P < .05 Compared with survivors group; ∗∗P < .01 Compared with survivors group. PCT, SOFA score and APACHE II score were obviously elevated in nonsurvivors group compare with survivors group (P < .05), while CEP-1 antibody was decreased in nonsurvivors group contrast to survivors group (P < .05). APACHE = acute physiology and chronic health evaluation, CEP-1 = citrullinated alpha enolase peptide-1, PCT = procalcitonin, SOFA = sequential [sepsis-related] organ failure assessment, between survivors group and nonsurvivors group.
The positive rates of CEP-1 antibody significantly higher in survivors group (47.83%) compared with nonsurvivors group (21.74%) (P < .05) (Fig. 7). There was no difference in the distribution characteristics of CRP (P = .16), PCT (P = .07), IL-6 (P = .88), and NGAL (P = .78) between them (Fig. S5, Supplemental Figure, which illustrated the prevalence of CRP (A), PCT (B), IL-6 (C), and NGAL (D) in survivors group and nonsurvivors group).
Figure 7.
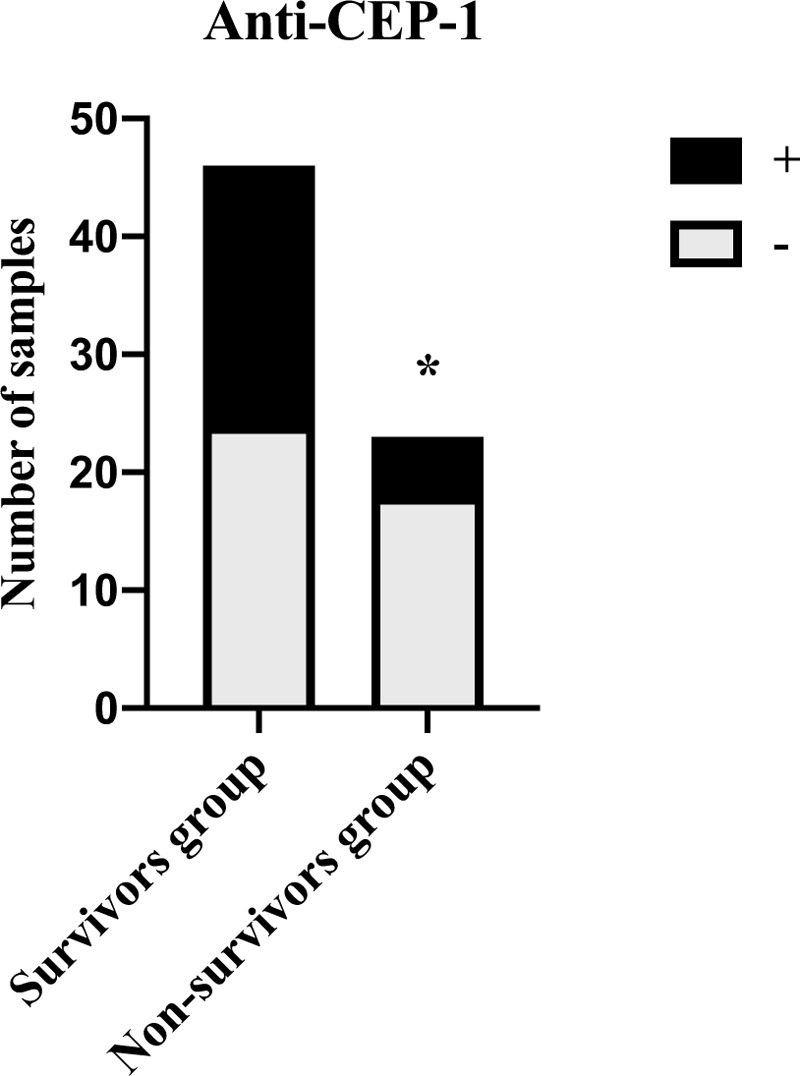
Distribution of anti-CEP-1 positivity in survivors group and nonsurvivors group (A). The positive rates of CEP-1 antibody significantly higher in survivors group compared with nonsurvivors group (P < .05). CEP-1 = citrullinated alpha enolase peptide-1.
According to mortality at 28 days of hospital stay, PCT (Fig. 8A) and CEP-1 antibody (Fig. 8B) had better discriminatory performance with an AUC of (0.69, 0.67 respectively), 95% CI = ([0.57; 0.81]; [0.54; 0.80], respectively) (P < .05), with a cut off value of (0.53 ng/mL [Se = 86.96%, Sp = 54.35%]; 18.21 [Se = 78.26%, Sp = 52.17%]), while the ROC curve for CRP, IL-6 and NGAL yielded an AUC value of (0.60, 0.54, 0.54, respectively), 95% CI = ([0.45;0.74], P = .20; [0.39;0.69], = .61; [0.40;0.68], P = .58, respectively).
Figure 8.
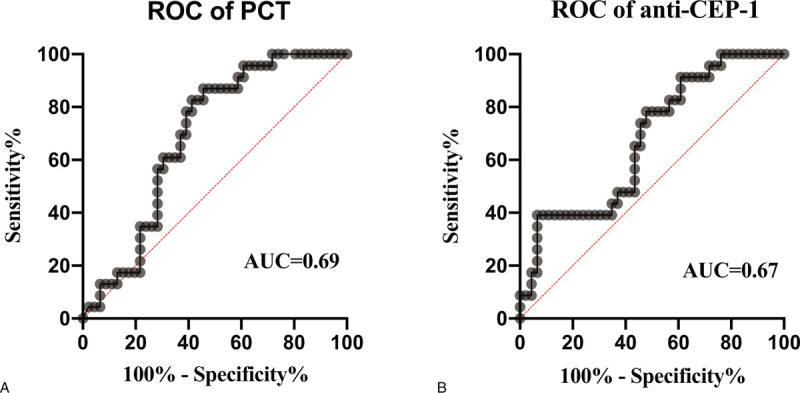
ROC curves used to predict 28-d mortality for sepsis patients based on the concentrations of PCT (A) and anti-CEP-1 (B). According to mortality at 28 d of hospital stay, PCT and CEP-1 antibody had discriminatory performance with an AUC of (0.69, 0.67, respectively). AUC = area under the receiver operator characteristic curve, CEP-1 = citrullinated alpha enolase peptide-1, PCT = procalcitonin, ROC = receiver operator characteristic.
3.4. The associations between biomarkers and APACHE II score or SOFA score, mutual association of biomarkers
As we can see in Figures 4D and 6D, both in septic shock group (20.00, [13.00–23.00]) and nonsurvivors group (22.00, [14.00–25.00]) APACHE II score were obviously higher than sepsis group (13.00, [10.00–17.00]) and survivors group (8.00, [4.00–10.00]) (P < .01). Similarly, both in septic shock group (7.00, [4.00–10.00]) and nonsurvivors group (13.00, [11.00–19.00]) SOFA score were obviously higher than sepsis group (3.00, [2.00–5.00]) and survivors group (3.00, [2.00–6.00]) (P < .01) (Figs. 4C and 6C).
As described in Table 3, the APACHE II score (r = 0.36, P < .05) and SOFA score (r = 0.50, P < .01) were positively correlated with serum concentrations of PCT in the overall group of patients. In addition, plasma NGAL (r = 0.31, P < .05) was positively correlated with SOFA score while CEP-1 (r = −0.31, P < .05) antibody and SOFA score demonstrated negative correlation.
Table 3.
Correlations between SOFA and biomarkers, Between APACHE II and biomarkers in patients.

As showed in Table 4, except the moderate correlation between CRP and NGAL (r = 0.25, P < .05), CRP levels were positively correlated with PCT (r = 0.62, P < .01), IL-6 (r = 0.41, P < .01); PCT levels were positively correlated with IL-6 (r = 0.53, P < .01), NGAL (r = 0.57, P < .01); IL-6 levels were positively correlated with NGAL (r = 0.53, P < .01). CEP-1 antibody was only moderately negatively correlated with PCT (r = −0.27, P < .05).
Table 4.
Mutual correlations of serum values among CRP, PCT, NGAL, and CEP-1 antibody.

4. Discussion
As CRP, PCT, and IL-6, we found the levels of NGAL in sepsis patients were significantly higher than those in healthy controls. CRP, PCT, and IL-6 have been generally used in sepsis diagnosis, suggesting NGAL may useful for the diagnosis of sepsis.[20–21] Thus we further investigated the potential value of NGAL combine with CEP-1 antibody for sepsis. We found that CRP, PCT, IL-6, and NGAL were significantly positively correlated with each other. First, CRP and PCT showed the strongest correlation (r = 0.62) among the correlation coefficients between any 2 indicators. Second, PCT had the moderate correlation with either IL-6 (r = 0.53) or NGAL (r = 0.57), while IL-6 was also moderately related to either NGAL (r = 0.53) or CRP (r = 0.41). Finally, the correlation between CRP and NGAL was demonstrated minimal and mild (r = 0.25). Therefore, NGAL was correlated with CRP, PCT, and IL-6. Additionally, the AUC (0.98, 0.98, 0.90, 0.97, respectively) of CRP, PCT, IL-6, and NGAL in the diagnosis of sepsis was statistically significant, suggesting that as these indicators, NGAL was valuable in sepsis diagnosis. Similar to previous study, Hong DY et al[22] indicated that plasma NGAL concentrations were significantly higher in sepsis patients. Similarly, CRP, PCT, and IL-6 levels were also significantly increased in sepsis patients, except for their AUC, previous study showed that the AUC of PCT or IL-6 was around 0.8, CRP was lower, even did not obviously demonstrate diagnostic value in sepsis patients.[23–25] The different general patient characteristics might account for the contrast results. Compared with sepsis patients, the control group was healthy people, which could explain that our AUC was higher than that of previous studies.
Several scoring systems have been studied for their classificatory value in sepsis patients, including APACHE II score and SOFA score. APACHE II score and SOFA score were designed to predict severity or mortality in critically ill patients in hospital. [26,27] APACHE II score is more likely to evaluate the severity of the disease, while SOFA score is more inclined to evaluate the organ injury of the patient Though the sensitivity of assessment ability varies between them, both are associated with severity or mortality for critically patients.[28] It may be more persuasive to use both scores together. Our results also showed that these 2 scores were associated with sepsis severity. Whether between the subgroups of sepsis patients or between survivors and nonsurvivors group, APACHE II score and SOFA score revealed obvious difference, and the more severe the disease was, the higher the score was (Figs. 4 and 6). Therefore, we analyzed the correlation between severity of sepsis and biomarkers based on these 2 scores. OF note, PCT was only molecule significantly correlated with both the APACHE II score (r = 0.36) and SOFA score (r = 0.50) as observed previously.[28] Additionally, plasma NGAL (r = 0.31) was positively correlated with SOFA score. Quantitatively, PCT and NGAL concentrations were significantly higher in the sepsis shock group than in the sepsis group. In terms of distribution characteristics, the middle and high levels of PCT or NGAL in sepsis shock group were significantly more than that in sepsis group, suggesting that PCT and NGAL are all valuable in sepsis classification. Although there was no statistically significant difference in IL-6 between the sepsis group and the septic shock group, the proportion of middle and high IL-6 levels in the septic shock group were significantly higher than that in the sepsis group, suggesting that IL-6 level exceeding 10 times the upper limit of the reference range might make a certain endeavor to classify sepsis.
Similar to previous study, the levels of PCT in nonsurvivors group were significantly higher than those in survivors group, whereas the AUC of PCT (0.69) was moderate.[29] It is speculated that the moderate AUC of PCT in our study may be due to the fact that PCT has predictive value for the prognosis of sepsis, but the value of this single indicator is limited.
At present, there is little research on the relationship between sepsis and CEP-1 antibody. During our observation, the CEP-1 antibody concentrations were slightly lower in sepsis patients than in healthy persons. Patients with more serious of sepsis were more likely to develop a decreased level of plasma CEP-1 antibody, though the difference had no statistical significance. With an AUC of 0.67, the concentration of CEP-1 antibody was significantly lower in the nonsurvivors group than survivors group, the positive rates of CEP-1 antibody significantly higher in survivors group compared with nonsurvivors group, while it demonstrated a negative correlation with either SOFA score (r = −0.31) or PCT (r = −0.27). Additionally, Weis S et al[30] reported that blood glucose levels are maintained a dynamic physiologic range by the gluconeogenesis and glycolysis pathways in order to establish disease tolerance to sepsis, disease tolerance is beneficial to improve the condition of sepsis patients. In normal condition, alpha enolase plays a negative role to glycolysis. However, glycolysis is enhanced during RA process, as the accumulation of alpha enolase is susceptibility to citrullination, which leads to the production of CEP-1 antibody.[31] The enhancement of glycolysis may disrupt the balance with gluconeogenesis and thus affect the establishment of sepsis disease tolerance. Therefore, though our results confirmed a low diagnostic and classificatory value of CEP-1 antibody, it was valuable in sepsis prognosis, we speculated that it may be a protective factor for sepsis. The latter need much further study to investigate.
The limitation of this study was the systemic inflammatory response syndrome (SIRS) caused by noninfectious factors was not investigated because of the small sample size. Previous studies have shown that CRP, PCT, and IL-6 can distinguish between noninfectious SIRS and sepsis.[32–34] Hence, the combination of these indicators may also contribute to the differential diagnosis of sepsis. In this way, similar studies including noninfectious SIRS are warranted in large population.
5. Conclusion
The results of the present study have indicated that NGAL and CEP-1 antibody can be treated as utility biomarkers of sepsis. As CRP, PCT, and IL-6, NGAL was valuable in sepsis diagnosis. With a classificatory value, PCT and NGAL correlated with the degree severity of sepsis. Similar to the prognostic utility of PCT, CEP-1 antibody may be a protective factor for sepsis which need much more study to prove in future.
Author contributions
Conceptualization: Xiuzhu Hou, Liyan Cui.
Data curation: Xiuzhu Hou, Chong Liu, Hongwei Lian, Zhen Xu, Lijuan Ma, Liyan Cui.
Formal analysis: Xiuzhu Hou, Chong Liu, Keke Jia.
Funding acquisition: Liyan Cui.
Investigation: Xiuzhu Hou, Hongwei Lian, Liyan Cui.
Methodology: Xiuzhu Hou, Chong Liu, Xubin Zang, Jianbin Sun, Liyan Cui.
Supervision: Liyan Cui.
Writing – original draft: Xiuzhu Hou.
Writing – review & editing: Xiuzhu Hou, Liyan Cui.
Supplementary Material
Supplementary Material
Supplementary Material
Supplementary Material
Supplementary Material
Footnotes
Abbreviations: AKI = acute kidney injury, APACHE = acute physiology and chronic health evaluation, AUC = area under the receiver operator characteristic curve, CEP-1 = citrullinated alpha enolase peptide-1, CI = confidence interval, CRP = C-reactive protein, IL-6 = interleukin-6, MAP = mean arterial pressure, NGAL = neutrophil gelatinase-associated lipocalin, PCT = procalcitonin, RA = rheumatoid arthritis, ROC = receiver operator characteristic, SIRS = systemic inflammatory response syndrome, SOFA = sequential [sepsis-related] organ failure assessment.
How to cite this article: Hou X, Liu C, Lian H, Xu Z, Ma L, Zang X, Sun J, Jia K, Cui L. The value of neutrophil gelatinase-associated lipocalin and citrullinated alpha enolase peptide-1 antibody in diagnosis, classification, and prognosis for patients with sepsis. Medicine. 2020;99:34(e21893).
Funding was provided by the National Natural Science Foundation of China: 61771022.
The authors report no conflicts of interest.
The datasets generated during and/or analyzed during the current study are available from the corresponding author on reasonable request.
References
- [1].Signer M, Deutschman CS, Seymour CW, et al. The third international consensus definitions for sepsis and septic shock (sepsis-3). JAMA 2016;315:801–10. [DOI] [PMC free article] [PubMed] [Google Scholar]
- [2].Ríos-Toro JJ, Márquez-Coello M, García-Álvarez JM, et al. Soluble membrane receptors, interleukin 6, procalcitonin and C reactive protein as prognostic markers in patients with severe sepsis and septic shock. PloS One 2017;12:e0175254. [DOI] [PMC free article] [PubMed] [Google Scholar]
- [3].Barre M, Behnes M, Hamed S, et al. Revisiting the prognostic value of monocyte chemotactic protein 1 and interleukin-6 in the sepsis-3 era. J Crit Care 2018;43:21–8. [DOI] [PubMed] [Google Scholar]
- [4].Jiang YN, Cai X, Zhou HM, et al. Diagnostic and prognostic roles of soluble CD22 in patients with Gram-negative bacterial sepsis. Hepatobiliary Pancreat Dis Int 2015;14:523–9. [DOI] [PubMed] [Google Scholar]
- [5].Tanaka T, Narazaki M, Kishimoto T. IL-6 in inflammation, immunity, and disease. Cold Spring Harb Perspect Biol 2014;6:a016295. [DOI] [PMC free article] [PubMed] [Google Scholar]
- [6].Chan T, Gu F. Early diagnosis of sepsis using serum biomarkers. Expert Rev Mol Diagn 2011;11:487–96. [DOI] [PubMed] [Google Scholar]
- [7].Zhang Y, Khalid S, Jiang L. Diagnostic and predictive performance of biomarkers in patients with sepsis in an intensive care unit. J Int Med Res 2019;47:44–58. [DOI] [PMC free article] [PubMed] [Google Scholar]
- [8].Feng M, Sun T, Zhao Y, et al. Detection of serum interleukin-6/10/18 levels in sepsis and its clinical significance. J Clin Lab Anal 2016;30:1037–43. [DOI] [PMC free article] [PubMed] [Google Scholar]
- [9].Ngoc Thao PT, Tra TT, Son NT, et al. Reduction in the IL-6 level at 24 h after admission to the intensive care unit is a survival predictor for Vietnamese patients with sepsis and septic shock: a prospective study. BMC Emerg Med 2018;18:39. [DOI] [PMC free article] [PubMed] [Google Scholar]
- [10].Park SY, Eom JS, Lee JS, et al. Neutrophil gelatinase-associated lipocalin as a predictor of acute kidney injury in patients during treatment with colistimethate sodium. Infect Chemother 2018;50:128–37. [DOI] [PMC free article] [PubMed] [Google Scholar]
- [11].Lelubre C, Vincent JL. Mechanisms and treatment of organ failure in sepsis. Nat Rev Nephrol 2018;14:417–27. [DOI] [PubMed] [Google Scholar]
- [12].Wang M, Zhang Q, Zhao X, et al. Diagnostic and prognostic value of neutrophil gelatinase-associated lipocalin, matrix metalloproteinase-9, and tissue inhibitor of matrix metalloproteinases-1 for sepsis in the Emergency Department: an observational study. Crit Care 2014;18:634. [DOI] [PMC free article] [PubMed] [Google Scholar]
- [13].Macdonald SP, Stone SF, Neil CL, et al. Sustained elevation of resistin, NGAL and IL-8 are associated with severe sepsis/septic shock in the emergency department. PLoS One 2014;9:e110678. [DOI] [PMC free article] [PubMed] [Google Scholar]
- [14].Macdonald SPJ, Bosio E, Neil C, et al. Resistin and NGAL are associated with inflammatory response, endothelial activation and clinical outcomes in sepsis. Inflamm Res 2017;66:611–9. [DOI] [PubMed] [Google Scholar]
- [15].Otto GP, Hurtado-Oliveros J, Chung HY, et al. Plasma neutrophil gelatinase-associated lipocalin is primarily related to inflammation during sepsis: a translational approach. PLoS One 2015;10:e0124429. [DOI] [PMC free article] [PubMed] [Google Scholar]
- [16].Montes A, Dieguez-Gonzalez R, Perez-Pampin E, et al. Particular association of clinical and genetic features with autoimmunity to citrullinated α-enolase in rheumatoid arthritis. Arthritis Rheum 2011;63:654–61. [DOI] [PubMed] [Google Scholar]
- [17].Quirke AM, Perry E, Cartwright A, et al. Bronchiectasis is a model for chronic bacterial infection inducing autoimmunity in rheumatoid arthritis. Arthritis Rheumatol 2015;67:2335–42. [DOI] [PMC free article] [PubMed] [Google Scholar]
- [18].Wegner N, Lundberg K, Kinloch A, et al. Autoimmunity to specific citrullinated proteins gives the first clues to the etiology of rheumatoid arthritis. Immunol Rev 2010;233:34–54. [DOI] [PubMed] [Google Scholar]
- [19].Rhodes A, Evans LE, Alhazzani W, et al. Surviving sepsis campaign: international guidelines for management of sepsis and septic shock: 2016. Intensive Care Med 2017;43:304–77. [DOI] [PubMed] [Google Scholar]
- [20].Yang AP, Liu J, Yue LH, et al. 5 Neutrophil CD64 combined with PCT, CRP and WBC improves the sensitivity for the early diagnosis of neonatal sepsis. Clin Chem Lab Med 2016;54:345–51. [DOI] [PubMed] [Google Scholar]
- [21].Contenti J, Occelli C, Lemoel F, et al. Presepsin versus other biomarkers to predict sepsis and septic shock in patients with infection defined by Sepsis-3 criteria: the PREDI study of diagnostic accuracy. Emergencias 2019;31:311–7. [PubMed] [Google Scholar]
- [22].Hong DY, Kim JW, Paik JH, et al. Value of plasma neutrophil gelatinase-associated lipocalin in predicting the mortality of patients with sepsis at the emergency department. Clin Chim Acta 2016;452:177–81. [DOI] [PubMed] [Google Scholar]
- [23].Zhou Y, Liu Z, Huang J, et al. Usefulness of the heparin-binding protein level to diagnose sepsis and septic shock according to sepsis-3 compared with procalcitonin and C reactive protein: a prospective cohort study in China. BMJ Open 2019;9:e026527. [DOI] [PMC free article] [PubMed] [Google Scholar]
- [24].Song J, Park DW, Moon S, et al. Diagnostic and prognostic value of interleukin-6, pentraxin 3, and procalcitonin levels among sepsis and septic shock patients: a prospective controlled study according to the sepsis-3 definitions. BMC Infect Dis 2019;19:968. [DOI] [PMC free article] [PubMed] [Google Scholar]
- [25].Szederjesi J, Almasy E, Lazar A, et al. An evaluation of serum procalcitonin and C-reactive protein levels as diagnostic and prognostic biomarkers of severe sepsis. J Crit Care Med (Targu Mures) 2015;1:147–53. [DOI] [PMC free article] [PubMed] [Google Scholar]
- [26].Knaus WA, Draper EA, Wagner DP, et al. APACHE II: a severity of disease classification system. Crit Care Med 1985;13:818–29. [PubMed] [Google Scholar]
- [27].Vincent JL, Moreno R, Takala J, et al. The SOFA (sepsis-related organ failure assessment) score to describe organ dysfunction/failure. On behalf of the Working Group on Sepsis-Related Problems of the European Society of Intensive Care Medicine. Intensive Care Med 1996;22:707–10. [DOI] [PubMed] [Google Scholar]
- [28].Choi JY, Jang JH, Lim YS, et al. Performance on the APACHE II, SAPS II, SOFA and the OHCA score of post-cardiac arrest patients treated with therapeutic hypothermia. PloS One 2018;13:e0196197. [DOI] [PMC free article] [PubMed] [Google Scholar]
- [29].Jekarl DW, Lee S, Kim M, et al. Procalcitonin as a prognostic marker for sepsis based on SEPSIS-3. J Clin Lab Anal 2019;33:e22996. [DOI] [PMC free article] [PubMed] [Google Scholar]
- [30].Weis S, Carlos AR, Moita MR, et al. Metabolic adaptation establishes disease tolerance to sepsis. Cell 2017;169:1263–75.e14. [DOI] [PMC free article] [PubMed] [Google Scholar]
- [31].Chang X, Wei C. Glycolysis and rheumatoid arthritis. Int J Rheum Dis 2011;14:217–22. [DOI] [PubMed] [Google Scholar]
- [32].Potjo M, Theron AJ, Cockeran R, et al. Interleukin-10 and interleukin-1 receptor antagonist distinguish between patients with sepsis and the systemic inflammatory response syndrome (SIRS). Cytokine 2019;120:227–33. [DOI] [PubMed] [Google Scholar]
- [33].Duplessis C, Gregory M, Frey K, et al. Evaluating the discriminating capacity of cell death (apoptotic) biomarkers in sepsis. J Intensive Care 2018;6:72. [DOI] [PMC free article] [PubMed] [Google Scholar]
- [34].Talebi-Taher M, Babazadeh S, Barati M, et al. Serum inflammatory markers in the elderly: are they useful in differentiating sepsis from SIRS? Acta Med Iran 2014;52:438–42. [PubMed] [Google Scholar]
Associated Data
This section collects any data citations, data availability statements, or supplementary materials included in this article.


