Abstract
We aimed to evaluate the accuracy and interchangeability of stroke volume and cardiac output measured by electrical velocimetry and transthoracic echocardiography during cesarean delivery.
We enrolled 20 parturients in this prospective observational study. We recorded the stroke volume and cardiac output using both methods and compared the values at seven specific time points. We analyzed the data using linear regression analysis for Pearson's correlation coefficients and Bland-Altman analysis to determine percentage errors. We conducted a trending ability analysis based on the four-quadrant plot with the concordance rate and correlation coefficient.
We recorded 124 paired datasets during cesarean delivery. The correlation coefficients of the measured cardiac output and stroke volume between the two methods were 0.397 (P < .001) and 0.357 (P < .001). The 95% limits of agreement were −1.0 to 8.1 L min−1 for cardiac output and −10.4 to 90.4 ml for stroke volume. Moreover, the corresponding percentage errors were 62% and 60%. The concordance correlation coefficients were 0.447 (95% CI: 0.313-0.564) for stroke volume and 0.562 (95% CI: 0.442-0.662) for cardiac output. Both methods showed a moderate trending ability for stroke volume (concordance rate: 82% (95% CI: 72–90%)) and cardiac output (concordance rate: 85% (95% CI: 78–93%)).
Our findings indicated that electrical velocimetry monitoring has limited accuracy, precision, and interchangeability with transthoracic echocardiography; however, it had a moderate trending ability for stroke volume and cardiac output measurements during cesarean delivery.
Keywords: cardiac output, stroke volume, transthoracic echocardiography, electrical velocimetry, cesarean delivery
1. Introduction
Parturients undergoing cesarean delivery (CD) usually present obvious hemodynamic variability[1,2] and a high frequency of hypotension.[3] Traditionally, we have only clinically monitored the noninvasive blood pressure and heart rate as indirect surrogate parameters for cardiac output (CO) measurement. Given the inconvenience and potential risks associated with invasive hemodynamic monitoring,[4,5] it might no longer be desirable for parturient management.[6] With the introduction of noninvasive hemodynamic monitoring, there has been increasing research on the measurement of maternal hemodynamics for improved safety of the mother and fetus. Transthoracic echocardiography (TTE) has shown excellent agreement with pulmonary artery catheterization (PAC) in CO measurements in pregnant women; further, it has been widely recognized as an acceptable method for hemodynamic assessment in parturients.[7] A meta-analysis of 39 studies on CO measurements of pregnant women reported that echocardiography was used in 31 studies.[8]
Electrical velocimetry (EV) is a method that allows for non-invasive continuous monitoring of CO. Compared with TTE, EV has unique advantages including continuous monitoring, low time-consumption, and user independence. There has been limited clinical use of EV in parturients with case reports being published.[2,9] We aimed to compare the accuracy, precision, and trending ability of stroke volume (SV) and CO estimation using EV and TTE during CD.
2. Methods
We conducted this prospective observational study at the West China Second University Hospital after obtaining approval from the China registered clinical trial ethics review board (registration number: ChiCTR1900021321). This article adheres to the Strengthening the Reporting of Observational studies in Epidemiology statement. We obtained informed consent from all the study participants.
We enrolled 20 parturients who underwent cesarean delivery in West China Second University Hospital between February 2019 and March 2019. The inclusion criteria were as follows: age >18 years old, singleton pregnancy, and undergoing elective CD. The exclusion criteria were as follows: refusal to provide consent, severe cardiac disease, persistent arrhythmias, severe preeclampsia, and contraindications to combined spinal-epidural anesthesia (CSEA, e.g., coagulopathy, infection, severe lumbar disc herniation and patient refusal.).
2.1. Data collection
We obtained SV and CO measurements at the following 7 intraoperative time points:
-
(1)
before anesthesia, supine position (T1);
-
(2)
before anesthesia, left lateral position (T2);
-
(3)
after spinal injection, anesthesia level reaching the sixth thoracic (T3);
-
(4)
5 minutes after fetus delivery (T4);
-
(5)
15 minutes after fetus delivery (T5);
-
(6)
30 minutes after fetus delivery (T6); and
-
(7)
45 minutes after fetus delivery (T7). At each time point, we obtained the following hemodynamic data: systolic, diastolic, and mean arterial pressure; heart rate (HR); SV; and CO.
2.2. EV Measurements of SV and CO
The ICON monitoring system (Osypka Medical GmbH, Berlin, Germany) is based on the EV model.[10] An electrode pair is placed at the base of the neck on the left side while another pair is placed on the left inferior part of the thorax at the xiphoid process level. The SV (SVEv, ml) and CO (COEv, L min−1) can be derived using the following equations:
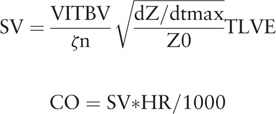 |
where VITBV = intrathoracic blood volume (ml), ζ = index of transthoracic aberrant electrical conduction, dZ/dtmax = peak rate of change of the blood resistivity (velocity) component of the transthoracic cardiogenic impedance pulse variation (ohmic mean acceleration) (Ωs−2), Z0 = transthoracic base impedance (Ω),  and TLVE = left ventricular ejection time (s) without heart rate correction.
2.3. TTE Measurements of SV and CO
We measured the aortic valve diameter (AVD) using the parasternal long axis view by TTE (Mindray M7; Shenzhen Mindray Bio-Medical Electronics Co., Ltd., Shenzhen, China). We obtained the velocity time integral (VTI) using the apical five chamber view with the pulsed wave Doppler placed within the left ventricular outflow tract at approximately 0.5 cm proximal to the aortic valve. We recorded five consecutive beats to obtain the average VTI to calculate the SV and CO measured by TTE (SVTTE and COTTE, respectively) at each time point.
 |
2.4. Anesthesia management
Preoperative routine monitoring involved obtaining arterial pulse oxygen saturation, noninvasive blood pressure, and five-lead electrocardiogram measurements (Philips IntelliVue Monitoring; Philips Medical Systems, Andover, MA). CSEA was performed with parturients in the left lateral position as follows. First, an 18-gauge Tuohy needle was inserted into the L3-L4 interspace using the loss of resistance to saline technique to identify the epidural space. Next, a 27-gauge Whitacre spinal needle was placed through the Tuohy needle until dural puncture and isobaric 0.5% bupivacaine 2.5 ml was administered. Subsequently, we inserted an epidural catheter (Zhejiang Haisheng Medical Device Co., Ltd, Zhejiang, China) 4 cm into the epidural space. We did not administer a test dose with lidocaine. The parturients were immediately placed in a supine position and the uterus was manually displaced to the left. The intraoperative hemodynamic and medical management was conducted at the discretion of the attending anesthesiologist without considering the SV and CO measurements obtained using the two study devices.
2.5. Statistical analysis
We performed statistical analysis using SPSS 20.0 (SPSS Inc., Chicago, IL) and R statistical software (R Studio, version 3.5.2; R Foundation for Statistical Computing, Vienna, Austria). We made figures using GraphPad Prism 7.0 (GraphPad Software Inc, La Jolla, CA). The data were presented as mean ± SD, median (interquartile range), or number (percentage). The normality of data was assessed using the Shapiro-Wilk test. We compared hemodynamic parameters using repeated measures analysis of variance (ANOVA). We used linear regression analysis and Bland-Altman analysis to assess the agreement between the two methods.[11,12] A correlation coefficient of 0.9-1.0 indicates a strong correlation while a correlation coefficient of <0.5 indicates a weak correlation. We calculated the bias, limits of agreement, and percentage error. A bias estimate of close to zero and a narrow CI indicates a highly precise and accurate agreement between both measurements. We calculated the percentage error as the 95% limit of agreement (1.96 × standard deviation [SD] from the bias) divided by the mean (calculated as the mean of both methods) multiplied by 100. The clinically acceptable percentage error is <30%. We assessed the trending ability using a four-quadrant plot.[13] The central exclusion zone of the four-quadrant plot was ±10 ml and ±0.75 L min−1 for small changes in SV and CO.[14] We defined the concordance rate as the percentage of the total number of plots in the first and third quadrants of the four-quadrant plot. The concordance rate was considered good and clinically acceptable if the rate was >92%. All P values were 2-sided and P < .05 was considered statistically significant except for in repeated measures ANOVA with Bonferroni adjustment where statistical significance was set at P < .01.
3. Results
In this prospective observational study, we enrolled an initial 23 parturients who underwent planned CD. Subsequently, we excluded 3 parturients and included data from the remaining 20 parturients in the final analysis. Among the 3 excluded parturients, two were excluded for poor TTE images and the other for a poor electrical signal. Operations on thirteen parturients were ended before T7 (45 minutes after fetus delivery); subsequently, there were only 7 paired data available at T7, which were excluded from repeated measures ANOVA. Further, we did not acquire two TTE data at T2 and one TTE datum at T3; finally, we acquired a total of 124 paired SV and CO data. Table 1 shows the baseline demographic and surgical characteristics of the parturients. Table 2 presents the hemodynamic measurements at each time point.
Table 1.
Patient characteristics and surgical procedure (N = 20).
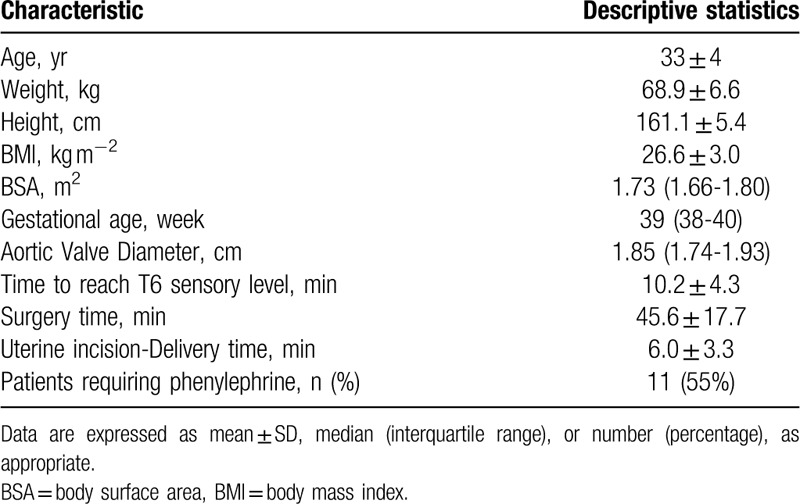
Table 2.
Intraoperative hemodynamic data (N = 20).

3.1. Linear regression analysis
The Pearson's correlation coefficients between SVEv and SVTTE and between COEv and COTTE were 0.357 (P < .001) and 0.397 (P < .001), respectively (Fig. 1).
Figure 1.
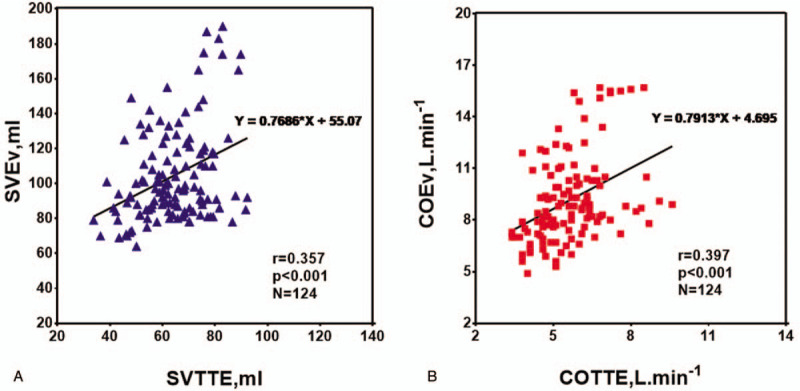
Linear regression analyses for repeated measurements between stroke volume (SV, blue triangles; A) and cardiac output (CO, red squares; B) measurements obtained with electrical velocimetry (SVEv, COEv) and transthoracic echocardiography (SVTTE, COTTE). The continuous dark lines correspond to the fitted straight line.
3.2. Accuracy and precision of agreement
We performed Bland-Altman analyses with all the time points (T1-T7) considered. The bias between SVEv and SVTTE was 40.3 ml while the SD bias was ±25.7 ml; further, the 95% CI of the limits of agreement ranged from −10.4 ± 4.0 ml to 90.4 ± 4.0 ml (Fig. 2A). The bias between COEv and COTTE was 3.5 L min−1 while the SD bias was ±2.3 L min−1; further, the 95% CI of the limits of agreement ranged from −1.0 ± 0.4 L min−1 to 8.1 ± 0.4 L min−1 (Fig. 2B). The percentage errors of SV and CO were 60% and 62%, respectively. The ICON device reported higher SV and CO measurements than the TTE standard values.
Figure 2.
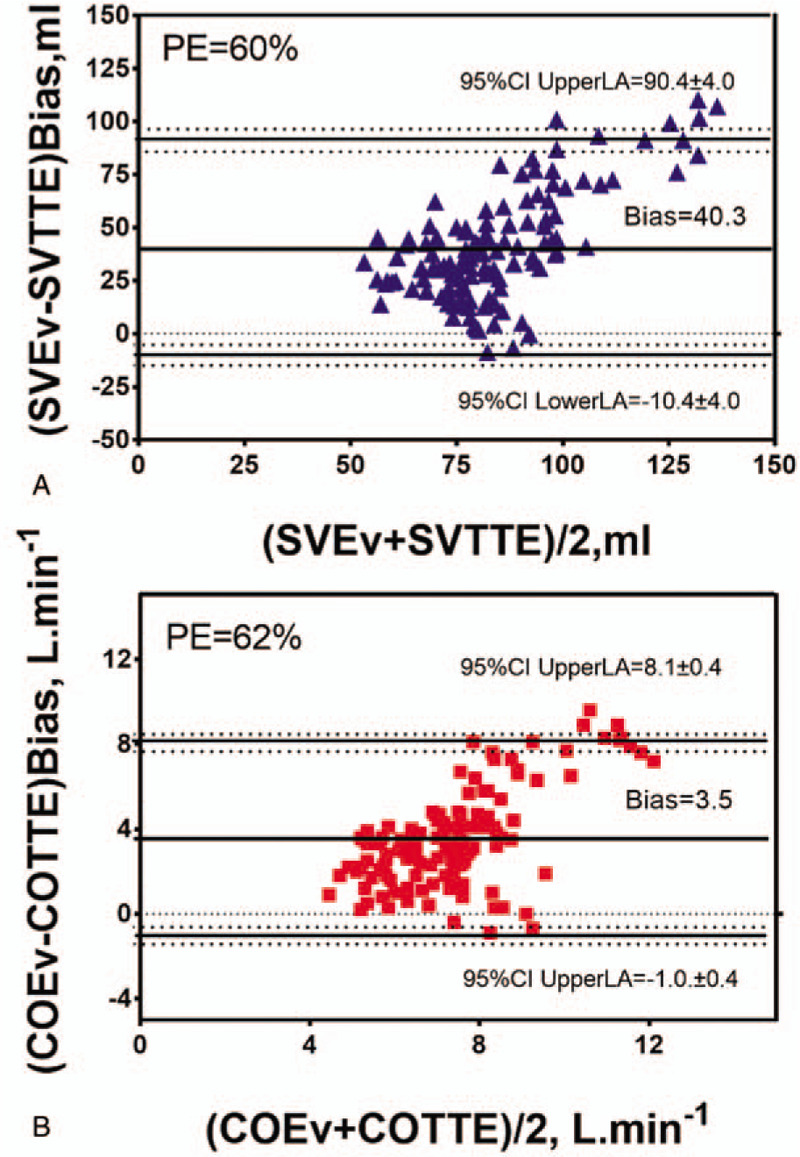
Bland-Altman plots for repeated measurements between stroke volume (SV, blue triangles; A) and cardiac output (CO, red squares; B) measurements obtained with electrical velocimetry (SVEv, COEv) and transthoracic echocardiography (SVTTE, COTTE). The continuous lines correspond to the mean difference (bias), the dashed lines correspond to the 95% limits of agreement (LA), and the dotted lines correspond to the 95% confidence interval of the upper and lower LA. PE indicates percentage error.
3.3. Trending ability
We expressed the trending ability of EV using the four-quadrant plot with the concordance correlation coefficient (CCC) and concordance rate (Fig. 3). We applied an exclusion zone of 10 ml for SV and 0.75 L min−1 for CO as previously reported.[14] There was a strong correlation between ΔCOEv and ΔCOTTE (r = 0.734 (95% CI: 0.615-0.820), P < .001; Fig. 3B) and a moderate correlation between ΔSVEv and ΔSVTTE (r = 0.628 (95% CI: 0.469-0.748), P < .001; Fig. 3A). The CCC was 0.447 (95% CI: 0.313-0.564) between ΔSVEv and ΔSVTTE and 0.562 (95% CI: 0.442-0.662) between ΔCOEv and ΔCOTTE. The concordance rate was 82% (95% CI: 72%-90%) between ΔSVEv and ΔSVTTE and 85% (95% CI: 78%-93%) between ΔCOEv and ΔCOTTE (Fig. 3).
Figure 3.
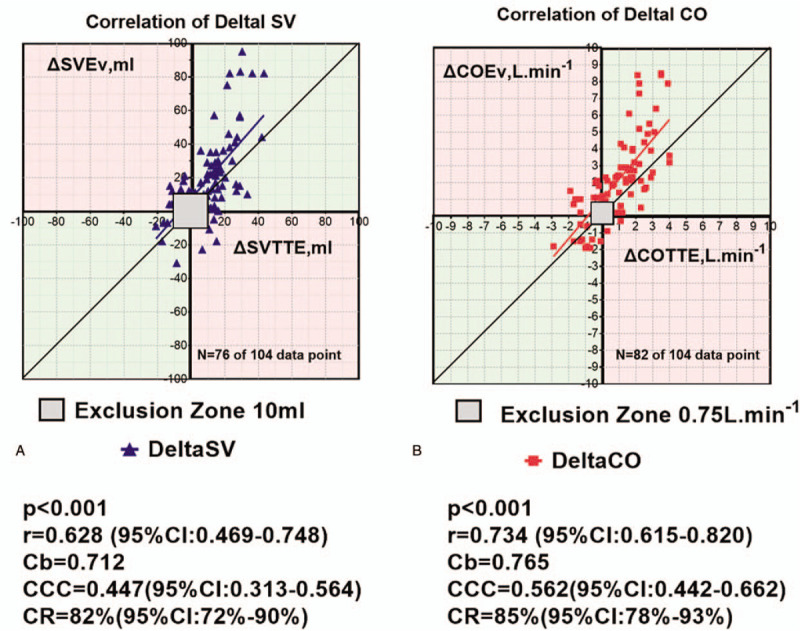
Four-quadrant plot for repeated measurements shows changes in stroke volume (ΔSV, blue triangles; A) and cardiac output (ΔCO, red squares; B) with electrical velocimetry (ΔSVEv, ΔCOEv) compared to changes in transthoracic echocardiography (ΔSVTTE, ΔCOTTE). Exclusion zone, set at 10 ml and 0.75 L min−1, is shown. Regression lines for ΔSV (continuous blue line; A) and ΔCO (continuous red line; B) and the identity line (continuous dark line) are shown. In light green, concordant SV and CO changes. In light pink, discordant SV and CO changes. Cb, a bias correction factor that measures how far the best-fit line deviates from a line at 45 degrees; CCC indicates concordance correlation coefficient; CI = confidence interval, CR = concordance rate.
4. Discussion
This study demonstrates the lack of interchangeability between EV and TTE values obtained using the ICON monitoring system in parturients undergoing CD. Percentage errors obtained through Bland-Altman analyses were 62% for CO and 60% for SV, which were not clinically acceptable. The mean biases were 40.3 ml between SVEv and SVTTE and 3.5 L min−1 between COEv and COTTE. Previous studies have confirmed the accuracy of CO measurement in pediatric patients using EV compared to using thermodilution, Fick oxygen method, and TTE.[15–18] However, with respect to adult patients, there has been significant heterogeneity of outcomes.[19–22] A number of studies have reported unacceptable intraoperative accuracy and interchangeability of EV with other standard methods.[14,23,24] In our study, several factors could have contributed to the observed poor interchangeability between the ICON system and TTE. First, with respect to EV, there is a correlation of VITBV (ml, intrathoracic blood volume) with the patient's body weight.[10] The presence of a fetus may lead to overestimation of the patient's body weight, which leads to CO overestimation by the ICON monitor. Second, the significant increase in fat and fluid levels in the body during pregnancy might affect the ζ, which refers to the index of transthoracic aberrant electrical conduction. Specifically, the changes in the tissue elements may interfere with accurate measurement of SV and CO. As reported by Teefy et al,[20] overweightness and obesity have a significant effect on the relative precision and accuracy of EV compared with thermodilution. Third, the CD procedure may interfere with the EV measurement; specifically, abdominal surgical interventions have been reported to cause a shift of >1 L min−1 m-2 in the bioimpedance readings of the CO index with the shift direction being unpredictable.[25]
Although there was no interchangeability between EV and TTE during CD in our parturients, there was a strong correlation between ΔCOEv and ΔCOTTE and a moderate correlation between ΔSVEv and ΔSVTTE. The concordance rates between the two methods were close to the clinically acceptable level of 92%. Further, compared to TTE, EV had a moderate trending ability in both SV and CO measurements. Therefore, in elective CD, we may use EV for guiding the direction of SV and CO change. However, these findings should be interpreted with cautions since there have been inconsistent previous findings regarding the trending ability of EV.[14,24] Aurora et al reported that EV underestimated the CO[14]; however, their patients had a significantly different BMI from that of our parturients (31 ± 5 vs 26.6 ± 3.0 kg m−2), which is possibly contributed to the differences in the intrathoracic blood volume, fat, and fluid levels.
In our study, we analyzed the CO and SV but not index since previous findings indicated a low correlation of CO with body surface area during pregnancy.[26] Moreover, COTTE and SVTTE values in our study were comparable with those of a previous study using TTE.[6,27]
This study has several limitations. First, we used TTE as the standard reference method for hemodynamic monitoring instead of PAC, which is traditionally used. TTE is widely accepted as a standard reference method in parturients and is recommended by the European Society of Intensive Care Medicine for hemodynamic assessment.[6–8,28,29] To ensure reliability of the technique, we invited a certified, experienced echocardiography technician to acquire the images and finish the online calculation. Moreover, CO estimated using VTI methods, which was applied in our study, has been reported to have the least beat-to-beat variability, good intra-observer, and inter-observer reliability[27,28]. Second, we collected our data in a relatively short period across CD with an average time duration of 45 minutes. Our findings could not reveal the entire perioperative hemodynamic variability of CD; however, the hemodynamic changes during this period could effectively reflect the accuracy, precision, and trending ability of EV.
5. Conclusions
In conclusion, our findings indicate that EV monitoring has limited accuracy and precision. Further, despite having a moderate trending ability, it did not have interchangeability with TTE in SV and CO measurements during CD.
Acknowledgments
The authors would like to kindly acknowledge Professor Liang Zhao, Acumen Medical Information & Technology Co., Ltd, for his valuable comments and suggestions on the statistical analysis.
Author contributions
Funding acquisition: S.M. Feng.
Investigation: S.M. Feng.
Methodology: S.M. Feng, J Liu.
Project administration: S.M. Feng.
Supervision: J Liu.
Writing – original draft: S.M. Feng.
Writing – review & editing: J Liu.
Footnotes
Abbreviations: AVD = aortic valve diameter, CD = cesarean delivery, CO = cardiac output, COEv = cardiac output measured by electrical velocimetry, COTTE = cardiac output measured by transthoracic echocardiography, COTTE = cardiac output measured by transthoracic echocardiography, CSEA = combined spinal-epidural anesthesia, DAP = diastolic arterial pressure, EV = electrical velocimetry, HR = heart rate, MAP = mean arterial pressure, PAC = pulmonary artery catheterization, SAP = systolic arterial pressure, TTE = transthoracic echocardiography, SV = stroke volume, SVEv = stroke volume measured by electrical velocimetry, SVTTE = stroke volume measured by transthoracic echocardiography, VTI = velocity time integral.
How to cite this article: Feng S, Liu J. Electrical velocimetry has limited accuracy and precision and moderate trending ability compared with transthoracic echocardiography for cardiac output measurement during cesarean delivery: A prospective observational study. Medicine. 2020;99:34(e21914).
This work was supported by the Science and Technology Department of Sichuan Province, China (No.2019YFS0227). We declare no other external funding or competing interests.
The authors have no conflicts of interest to disclose.
The datasets generated during and/or analyzed during the current study are available from the corresponding author on reasonable request.
References
- [1].Ram M, Lavie A, Lev S, et al. Cardiac hemodynamics before, during and after elective cesarean section under spinal anesthesia in low-risk women. J Perinatol 2017;37:793–9. [DOI] [PubMed] [Google Scholar]
- [2].Liu Y, Pian-Smith M, Leffert L, et al. Continuous measurement of cardiac output with the electrica velocimetry method in patients under spinal anesthesia for cesarean delivery. J Clin Monit Comput 2015;29:627–34. [DOI] [PubMed] [Google Scholar]
- [3].Kinsella S, Carvalho B, Dyer R, et al. International consensus statement on the management of hypotension with vasopressors during caesarean section under spinal anaesthesia. Anaesthesia 2018;73:71–92. [DOI] [PubMed] [Google Scholar]
- [4].Armstrong S, Fernando R, Columbb M. Minimally- and non-invasive assessment of maternal cardiac output: go with the flow!. Int J Obstet Anesth 2011;20:330–40. [DOI] [PubMed] [Google Scholar]
- [5].Harvey S, Harrison D, PAC-Man study collaboration Assessment of the clinical effectiveness of pulmonary artery catheters in management of patients in intensive care (PACMan): a randomised controlled trial. Lancet 2005;366:472–7. [DOI] [PubMed] [Google Scholar]
- [6].McIntyre J, Ellyett K, Mitchell E, et al. Validation of thoracic impedance cardiography by echocardiography in healthy late pregnancy. BMC Pregnancy Childbirth 2015;15:70. [DOI] [PMC free article] [PubMed] [Google Scholar]
- [7].Cornette J, Laker S, Jeffery B, et al. Validation of maternal cardiac output assessed by transthoracic echocardiography against pulmonary arterycatheterization in severely ill pregnant women: prospective comparative study and systematic review. Ultrasound Obstet Gynecol 2017;49:25–32. [DOI] [PubMed] [Google Scholar]
- [8].Meah V, Cockcroft J, Backx K, et al. Cardiac output and related haemodynamics during pregnancy: a series of meta-analyses. Heart 2016;102:518–26. [DOI] [PubMed] [Google Scholar]
- [9].Ballas J, Archer T, Buono K, et al. Electrical cardiometry provides a continuous, non-invasive method of trending cardiac output in labor. Am J Obstet Gynecol 2014;210: 1SUPPL1: S359. [Google Scholar]
- [10].Bernstein D, Lemmens H. Stroke volume equation for impedance cardiography. Med Biol Eng Comput 2005;43:443–50. [DOI] [PubMed] [Google Scholar]
- [11].Bland J, Altman D. Statistical methods for assessing agreement between two methods of clinical measurement. Lancet 1986;1:307–10. [PubMed] [Google Scholar]
- [12].Bland J, Altman D. Agreement between methods of measurement with multiple observations per individual. J Biopharm Stat 2007;17:571–82. [DOI] [PubMed] [Google Scholar]
- [13].Carrasco J, Jover L. Estimating the generalized concordance correlation coefficient through variance components. Biometrics 2003;59:849–58. [DOI] [PubMed] [Google Scholar]
- [14].Magliocca A, Rezoagli E, Anderson T, et al. Cardiac output measurements based on the pulse wave transit time and thoracic impedance exhibit limited agreement with thermodilution method during orthotopic liver transplantation. Anesth Analg 2018;126:85–92. [DOI] [PubMed] [Google Scholar]
- [15].Norozi K, Beck C, Osthaus W, et al. Electrical velocimetry for measuring cardiac output in children with congenital heart disease. Br J Anaesth 2008;100:88–94. [DOI] [PubMed] [Google Scholar]
- [16].Narula J, Chauhan S, Ramakrishnan S, et al. Electrical cardiometry: A reliable solution to cardiac output estimation in children with structural heart disease. J Cardiothorac Vasc Anesth 2017;31:912–7. [DOI] [PubMed] [Google Scholar]
- [17].Tirotta C, Lagueruela R, Madril D, et al. Non-invasive cardiac outputmonitor validation study in pediatric cardiac surgery patients. J Clin Anesth 2017;38:129–32. [DOI] [PubMed] [Google Scholar]
- [18].Chaiyakulsil C, Chantra M, Katanyuwong P, et al. Comparison of three noninvasive hemodynamic monitoring methods in critically ill pediatric patients. PLoS One 2018;13:e0199203. [DOI] [PMC free article] [PubMed] [Google Scholar]
- [19].Remigiusz Kazimierczyk R, Marcinkiewicz-Siemion M, Sobkowicz B, et al. The role of electrical cardiometry in non-invasive assessment of hemodynamic parameters in patients with pulmonary arterial hypertension. Eur J Heart Fail 2016;18: SUPPL 1: 268. [Google Scholar]
- [20].Teefy P, Bagur R, Phillips C, et al. Impact of obesity on non-invasive cardiac hemodynamic measurement by electrical cardiometry in adults with aortic stenosis. J Cardiothorac Vasc Anesth 2018;32:2505–11. [DOI] [PubMed] [Google Scholar]
- [21].Zoremba N, Bickenbach J, Krauss B, et al. Comparison of electrical velocimetry and thermodilution techniques for the measurement of cardiac output. Acta Anaesthesiol Scand 2007;51:1314–9. [DOI] [PubMed] [Google Scholar]
- [22].Raue W, Swierzy M, Koplin G, et al. Comparison of electrical velocimetry and transthoracic thermodilution technique for cardiac output assessment in critically ill patients. Eur J Anaesth 2009;26:1067–71. [DOI] [PubMed] [Google Scholar]
- [23].Cox P, Ouden A, Theunissen M, et al. Accuracy, precision, and trending ability of electrical cardiometry cardiac index versus continuous pulmonary artery thermodilution method: A prospective, observational study. BioMed Res Int 2017;2017:2635151. [DOI] [PMC free article] [PubMed] [Google Scholar]
- [24].Wang D, Lee I, Chou A, et al. Non-invasive cardiac output measurement with electrical velocimetry in patients undergoing liver transplantation: comparison of an invasive method with pulmonary thermodilution. BMC Anesthesiol 2018;18:138. [DOI] [PMC free article] [PubMed] [Google Scholar]
- [25].Huang L, Critchley L, Zhang J. Major upper abdominal surgery alters the calibration of bioreactance cardiac output readings, the NICOM, when comparisons are made against suprasternal and esophageal Doppler intraoperatively. Anesth Analg 2015;121:936–45. [DOI] [PubMed] [Google Scholar]
- [26].van Oppen A, van der Tweel I, Duvekot J, et al. Use of cardiac index in pregnancy: is it justified? Am J Obstet Gynecol 1995;173:923–8. [DOI] [PubMed] [Google Scholar]
- [27].Dennis A, Arhanghelschi I, Simmons S, et al. Prospective observational study of serial cardiac output by transthoracic echocardiography in healthy pregnant women undergoing elective caesarean delivery. Int J Obstet Anesth 2010;19:142–8. [DOI] [PubMed] [Google Scholar]
- [28].Petersen J, Liu J, Chi Y, et al. Comparison of multiple non-invasive methods of measuring cardiac output during pregnancy reveals marked heterogeneity in the magnitude of cardiac output change between women. Physiol Rep 2017;5:e13223. [DOI] [PMC free article] [PubMed] [Google Scholar]
- [29].Cecconi M, Backer DD, Antonelli M, et al. Consensus on circulatory shock and hemodynamic monitoring. Task force of the European Society of Intensive Care Medicine. Intensive Care Med 2014;40:1795–815. [DOI] [PMC free article] [PubMed] [Google Scholar]


