Abstract
Nanoscopy has now become a real procedure in fluorescence microscopy of living cells. The STED/RESOLFT family of nanoscopy approaches (Hell 2004; Blom 2014) has the best prospects for delivering high speed imaging, but the history of STED includes a continuing struggle to reduce the deactivation power applied, along with difficulties in achieving simultaneous multicolor images. In this manuscript, we present a concept for a similar real-time nanoscopy, using a new class of bipartite probes that separate the luminescent and quenching functions into two coupled molecules. In particular, the STAQ (Superresolution via Transiently Activated Quencher) example we show herein employs the excited state absorbance (not ground state) of the partner to accept energy from and quench the luminescent dye. The result is that much less deactivation power is needed for superresolved (~50nm) imaging. Moreover, the TAQ partner excited by the “donut” beam is shown to quench several different visible dyes via the same mechanism, opening the door to easier multicolor imaging. We demonstrate three dyes sharing the same deactivation and show examples of superresolved multicolor images. We suggest STAQ will facilitate the growth of real-time nanoscopy by reducing confounding photodamage within living cells while expanding the nanoscopist’s palette.
Keywords: super resolution, STED, microscopy, imaging
INTRODUCTION
In recent years, the diffraction limit that long impeded optical microscopy has been well and often broken. The means to circumvent the physical limits have come from three non-exclusive approaches: (a) patterned illumination and detection (Gustafsson 2000), (b) sparse ensemble centrolocation schemes (Betzig 2006; Hess 2006; Rust 2006), (permitting a “pointillist painting”), and (c) nonlinear or saturated competition between activating and deactivating beams to sculpt the effective dimensions of an excited volume (Hell 1994).
All of these methods have strengths and drawbacks. The pointillist methods are slowest yet easiest to implement and achieve high resolution in three dimensions. They have been widely adopted.
The nonlinear approaches (RESOLFT: REversible Saturable OpticaL Fluorescence Transitions (Hell 2004), and especially STED: STimulated Emission Depletion (Hell 1994)) have required somewhat more complex laser microscopes and careful selection of chromophores; their resolution, however, is theoretically limited only by dye size, and they can report images in real (scan) time. STED, for example, has provided true video rate nanoimaging in living cells and tissues (Westphal 2008).
STED was also sometimes hobbled by two practical problems: large laser powers were required and employed in the deactivating donut beam and difficulties were found in accomplishing simultaneous superresolved multicolor imaging. Problems arose because the depletion band wavelength for one dye is usually within the emission collection band of the second dye. The last few years have shown considerable progress for power and colors (Blom 2014). As confocal and STED microscopy share many of the same principles, equipment and acquisition systems, many of the techniques applied to normal confocal microscopy have been added to STED, e.g. image deconvolution (Willig 2006). Further, new probes (Schroder 2009) have been designed to exploit the cell’s own machinery to create a dye useful for STED for in vivo cell imaging. There are ways to excite and deplete two different dyes to produce dual color STED (Bückers 2011), and Stokes shift optimization facilitates single laser/two color methods (Tonnesen 2011).
The use of higher powers is a serious issue for cell and tissue imaging; while the deactivating wavelengths are at somewhat less damaging red wavelengths, photodamage from repeated scanning is a real and confounding concern, especially if one wishes to continuously monitor a series of biological events.
One approach to reduce power needs appears in (Grotjohann 2011). Hell and colleagues knew from their pioneering work on STED that reduction of saturating intensity (Is) in RESOLFT methods would yield higher resolution at lower power, and they theoretically linked Is to dark state switching times and cross sections. They evolutionarily selected photoswitchable fluorescent proteins for efficient cycling (Grotjohann 2011). Using a similar method (Willig 2011), Willig and coworkers have been able to dual-label using photochromic probes. Using spectral unmixing, they employ two different photoswitchable fluorescent proteins detected with a single channel. Another interesting development in this field is the decoupling of excitation and switching (Brakemann 2011). In this case, Dreiklang protein is switched on and a ‘donut’ beam switches it off, leaving a remanent subdiffraction population that is read with a distinct excitation beam.
Most recently, RESOLFT has been employed with a lattice of depletion zones to greatly increase frame rates and field sizes (Chmyrov 2013); STED, in contrast, had been multiplexed only at a handful of foci, to keep power exposure within limits(Yang 2014). During review, however, a new report on STED multiplexing has appeared (Bergermann 2015) that reveals the advantages of lattice depletion.
Methods that reduce power needs are clearly needed both for general bioimaging and to facilitate multifocal speed increases. Since fluorophores subjected to the depletion beam are shorter lived, in general, gated STED (Vicidomini 2011) can discriminate against them and achieve much better resolution for a given power.
We have chosen a (compatible) different route, one intended to decouple the photophysics of excitation and de-activation by placing the responsibility for those tasks in two different moieties (e.g. coupled chromophores). We term this method superresolution via transiently activated quenching (“STAQ”). Essentially, the “dye” (luminescent chromophore of choice) is kept proximate to a TAQ partner that does not quench the chromophore until that TAQ partner also enters an activated or excited state.
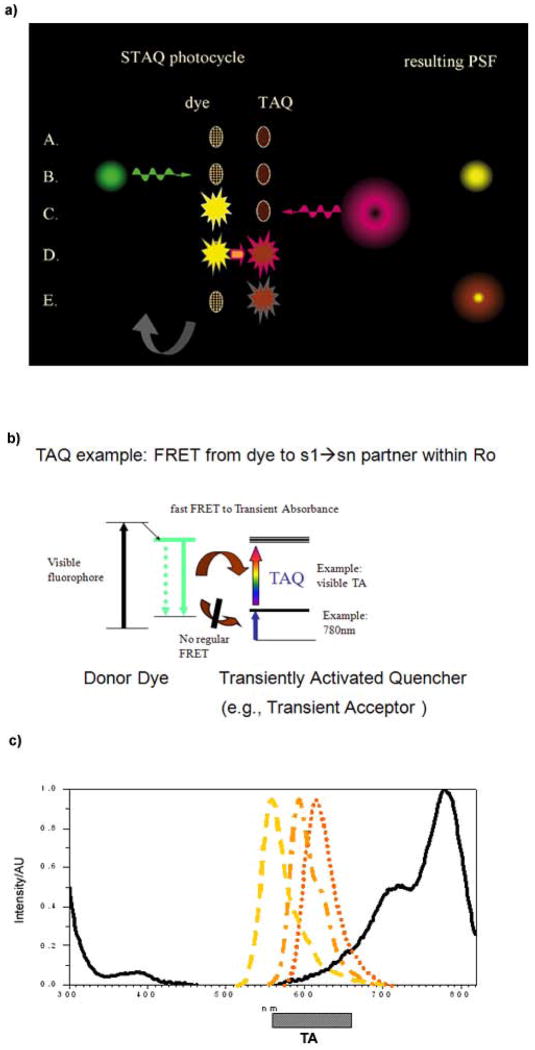
A cartoon representation of one such process is shown in Fig. 1(a). Both moieties begin in the ground state (Step A). First, the dye is excited and begins to spontaneously emit (Step B). The TAQ moiety is excited next, so both dye and TAQ are activated (Step C). Quenching of the dye follows rapidly (Step D) and the TAQ moiety deactivates either during the quenching event or thereafter (Step E), permitting cycling.
Figure 1.
While this approach can be implemented using a variety of photoactivated quenching schemes, one very general method we will demonstrate employs FRET (Förster Resonance Energy Transfer) from the excited state of the dye chromophore to the excited state (transient) absorbance of a “TAQ” quenching moiety (Fig. 1(b)). The emission spectra of the three dyes we have used, along with the ground state absorbance and (more important) strong excited state absorbance regime (bar labeled TA) of IR125 are shown in Fig. 1(c).
To begin, we chose to intentionally connect a transient absorber to a semi-rigid linker bringing it within the transient Förster radius of a fluorophore. Selection of chromophores was based on multiple requirements. The transient absorber needed a high extinction coefficient (reduces power needs), a reasonable lifetime (to make timing less critical), and excitation in the near IR (since UV/VIS excitation would inevitably repopulate some of the quenched dye upper state) – along, of course, with biocompatibility. The TAQ must also have only a weak ground state absorbance overlap with the dye emission, since one does not wish to accidentally deactivate the emitting dye via ordinary FRET. An energy level diagram is shown in the Fig. 1b to illustrate these principles. In the photosynthetic kinetics field, plant chromophores are known to participate in a similar process (Barzda 2001) (“singlet annihilation”), mentioned as an artifact in (Cotlet 2003).
The paucity of NIR transient spectra in the literature made TAQ selection challenging, but fortunately, the FDA-approved dye “ICG” (indocyanine green, IR125) was studied for photovoltaic purposes (Sudeep 2007) and displayed a transient absorbance across the mid-visible range after excitation in the 780nm band (Fig. 1(c)). Conjugation with a polyproline linker, modeling of distances of closest and average approach via Molecular Dynamics, and attachment of TAQ to both visible fluorophores like rhodamine 6G and to reactive linkers is discussed fully within Methods; further information is also available in the STAQ patent (US # 8547533 B2). The theory of STAQ including depletion efficiency design is outlined in Appendix I.
MATERIALS AND METHODS
Laser setup
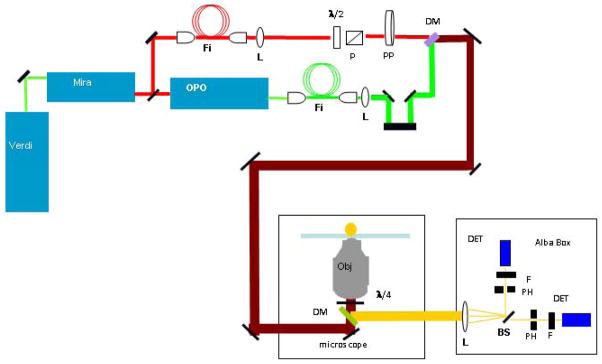
We constructed a home-built STED/STAQ microscope using a picosecond (1.5ps) Ti: Sapphire pumped ppCTA OPO (MIRA-OPO, Coherent Inc.) to generate simultaneous visible (green) excitation and near IR (775–785 nm) deactivation pulses at 76MHz repetition rate. Both beams were passed through 60 m fiber to stretch the pulse to over 6ps (460HP and SM630 fiber, Thorlabs Inc). The visible excitation beam (545nm) was focused using an objective (20X, NA 0.4). The resulting beam was expanded and collimated using an adjustable collimating lens (Thorlabs) providing a large diameter used to overfill the 100x objective (NA=1.45, Olympus UPLANSAPO) in a Zeiss Axiovert 135M microscope. The total visible power reaching the microscope was 300 μW. This power was attenuated by a λ/2 waveplate and polarizing cube to about 4–8 μW before the objective. The surviving fluorescence was detected in an epi-configuration with a 450–700BP dichroic (Chroma) and passed to the Alba 3 spectrometer. Because STED and STAQ in this configuration required confocal detection of the fluorescence, a pinhole was placed in front of the first detector (DET1). The pinhole size was varied between 50μm and 100μm depending on the fluorescence intensity. The STAQ depletion beam after the fiber was also collimated with an adjustable collimating lens (Thorlabs) and overlapped with the visible beam using a dichroic mirror (700SP, Chroma) before reaching the microscope. The STED/STAQ depletion beam (775nm) was attenuated using a λ/2 waveplate and polarizing cube. The depletion beam was steered through a vortex phase plate (VPP-1 from RPC Photonics) that created the ‘donut’ hole. After the beams are overlapped in space, an autocorrelator was used to ascertain the relative position of the two beams in time. For emission, 635/65DMBP-XR dichroic filter (Chroma Inc.) was used to eliminate the IR depleting beam and block most of the green excitation beam. Detection was carried out using the Alba 3 channel fluorescence correlation system (ISS, Inc.) equipped with avalanche photodiodes. Before the objective and after the primary dichroic, a λ/4 waveplate was placed to obtain a completely circularly polarized beam. The visible beam and the STED beam arrival times were varied by changing the arrival time of the visible beam with a retroreflector on a stage. The STED beam power ranged from 10–50mW. The objective was a ×100 UPLANSAPO oil objective (Olympus Inc.) with NA 1.4. A piezo scanner (100 × 100 μm travel, Nano-Bio2 from Mad City Labs, Inc.) and a z-scanning PIFOC (100 μm, Mad City Labs, Inc.) controlled by the ISS software was used to image at a rate of 0.1, 0.2 or 1.0 ms/pixel. The setup is shown in Fig. 2.
Figure 2.
All the figures were post processed using ImageJ. The intensity scales are given in counts. Most of the images were collected at 512×512 pixels or 256×256 pixels. When necessary 2–3 frames were collected and summed. Fig. 3 was collected at 512×512 pixels and downsized by averaging with linear interpolation to 256×256 pixels. For two color imaging, Dylight 550 and Dylight 594 signals were split with a 610nm dichroic (Chroma Inc). The Dylight 550 signal was further cleaned with a bandpass filter 580/30 nm (Semrock Inc) and similarly with a 610LP and two 700SP filters (Semrock and Thorlabs) for the Dylight 594 signal. Bleedthrough was found to be about 5%.
Figure 3.
Organic Synthesis
A novel dye with good STAQ characteristics was synthesized by the Inter Institute Probe Development Center (Organic Synthesis Lab) of NHLBI and NIH. The dye “STAQ-I” was synthesized by combining elements of rhodamine 6G and NIR TAQ dye, IR125. Visible dyes used and IR125 (Zhang 2005) are not affected by pH changes in the pH 5–9 range; all our investigations were done at neutral pH.
Conjugation with a polyproline linker, modeling of distances of closest and average approach via Molecular Dynamics (see below), and attachment of TAQ to both visible fluorophores like rhodamine 6G and to reactive linkers will be discussed elsewhere.
Briefly, the linear sequence of the peptide was assembled to 1,2-diaminoethane 2-Cl-trityl resin. Rhodamine 19 perchloride was activated and reacted with Glu(tBu)-Pro6-1,2, diaminoethane-2-Cl-Trityl resin peptidyl resin suspended in DMF for 2 hours.. The resin was then washed with DMF, DCM and MeOH and cleaved using TFA/water for 2 hours. The resulting filtrate was dried and purified by HPLC. MS (ESI, m/z): 1168 M+. Rhodamine conjugated peptide P6-E was prepared using Fmoc solid phase peptide synthesis. Then the primary amine was selectively protected with Boc group followed by coupling of the side chain of glutamic acid with amino PEG4 tert-butyl ester. After removal of Boc and tert-butyl groups, the freed primary amine was conjugated with ICG-sulfo-NHS. The final step is activation of PEG4 acid to its sulfo-NHS for further conjugation with proteins or beads. Further details of syntheses available on request to Imaging Probe Development Center.
Molecular dynamic simulations
The two dyes (IR125 and R6G) were built from their basic components (single aromatic rings, sulfonic groups, etc.) and then minimized using MacroModel’s (part of Schrödinger Suite, Schrödinger Inc) default Molecular Mechanics minimization. The six polyproline linker was generated using MacroModel’s amino acid fragments and its growth function. All prolines were joined using trans geometry with phi and psi angles reported for left-handed helices. The two dyes were attached to their respective ends of the six polyproline linker using the “Connect & Fuse” function in MacroModel. The IR125 fragment was attached to the C-terminus of the linker and the R6G fragment was attached to the N-terminus. The system was then minimized as before. Molecular dynamics simulations were run, using water as an implicit solvent, on the minimized structure. The system was equilibrated for 20ps, and then the dynamics simulations were run for 500ps using a 1.5fs time step. The average distance found for the linker in the system, based on the 100 structures saved during the simulation was 19.5 Å. For FRET, additional distance must be accounted for between the linker ends and the location of the oscillating dipoles in the conjugated portion of the fluorophore; one might reasonably add 3 Å at R6G and 4Å at IR125.
Sample preparation
Latex beads of 20nm or 100nm in diameter coated with aliphatic amines (Invitrogen, P7452) were labeled with the STAQ dye. For “randomly labeled” STAQ experiments the beads were separately labeled with rhodamine 6G-NHS (Invitrogen) or DyLight 550-NHS (Thermo Scientific) or DyLight 594 (Thermo Scientific) and ICG-NHS (Dojindo Molecular Technologies) using the provided labeling protocol. After the reaction, the beads were centrifuged for twenty minutes at 5000rpm to separate the reaction buffer from the pelleted beads. To completely remove any unbound dye, the beads were washed and centrifuged repeateadly to remove as much of the free dye as possible. About 1 μL of the dialyzed beads was placed in a Labtek II chamber coverglass (Nuntech). 80 μL of water were added to dilute the beads and allowed to dry. Mounting medium or glycerol was used to cover the dried beads. For alignment of the ‘donut’ STAQ/STED beam and optimization of beam overlap, deep red beads (Invitrogen Inc) 170nm in diameter were used.
Microtubule preparation
Tubulin was isolated from frozen rat brains as described in (Wolff 1996) and stored in liquid nitrogen at a concentration of 25 g/l. To prepare microtubules, tubulin was diluted to 5 g/l in PMGG (= PMG + 1 mM GTP; PMG = 0.1 M Pipes, 2 mM MgCl2, 10% v/v glycerol, pH 7) in a total volume of 5 μl, and incubated for 20 minutes at 37° C. Then 5 μl of PMGG + 20 μM Taxol was added, and incubated for 10 minutes at 37° C. Following this, 15 μl of PMGG + 10 μM Taxol was added and incubated for 10 minutes at 37° C. Final concentration of microtubules was 1 g/l.
Antibody labeling with fluorescent dyes
Anti-mouse monoclonal antibody was obtained from Sigma (M6898, ~ 2.2 g/l). An aliquot of 95 μl of antibody solution was mixed with 5 μl of 1 M Borate buffer pH 8.5. ICG-NHS (disulfo), 50 μg (10 μl of 5 g/l in DMSO) was added and mixed, followed by addition of 12.5 μg of DyLight 550 or DyLight 594 (both from ThermoPierce, Rockford IL). Reaction proceeded for about 45 minutes at room temperature with occasional mixing. Tris buffer, pH 7.4 was added to a final concentration of 50 mM and incubation continued for 5 minutes. Excess dye was removed by use of Dye Removal Resin (ThermoPierce), used according to manufacturer’s instructions.
Immunofluorescent labeling of microtubules
Chambered cover glasses (Thermo Fisher Scientific 155411) were first coated with CellTak (BD Biosciences Bedford, MA). CellTak stock as supplied (1.75 μl) was diluted with 800 μl of 0.1 M Na Bicarbonate + 8 μl of 0.1 M NaOH. Cover glasses were coated with 150 μl of this working stock, spread out as much as possible to cover the surface. After 35 minutes at room temperature, glasses were washed with water, wicked dry, and kept moist until microtubules were added. A 1 μl sample of microtubules (1 g/l) was diluted with 1 μl of PMG + Taxol 10 μM, and all of this placed on the cover glass and spread. Samples were allowed 10 minutes in a moist atmosphere to absorb to the glass. Glasses were washed 2 × 150 μl of TBS (tris buffered saline, Mediatech, Manasas, VA), and blocked with 150 μl of TBS-BSA (TBS + 2 g/l BSA (bovine serum albumin, Sigma)) at room temperature for 15 minutes. The solution edges were blotted to remove block solution, and glasses were covered with 150 μl of primary antibody (DM1A, Sigma T9026), 1–300 in TBS-BSA, and incubated at room temperature for 30 minutes. Glasses were washed twice with 100 μl of TBS-BSA, and secondary antibody (double labeled with DyLight 550 or 594 and “disulfo” IR125) diluted 1–100 in TBS-BSA. Following incubation at room temperature for 30 minutes, antibody was removed and samples washed twice with 150 μl of TBS-BSA.
Human skin fibroblasts were used for this study. These cells were obtained from ATCC (CRL-7761 (TE 353.Sk)), and were maintained in RPMI medium with 10% fetal bovine serum and cultured in 10% CO2 at 37° C. For imaging, these large slow growing cells were trypsinized and plated in chambered coverglass wells, and grown for at least two days before imaging. Cells were fixed by −20° C methanol, washed with PBS, and immunostained following essentially the same protocol as the microtubule samples described above.
Preparation of fluorescent microtubules
Tubulin was thawed and diluted to 5 g/l in PMG and equilibrated on ice for 10 minutes. A 40 μl sample was then centrifuged in a Beckman Airfuge A-110 rotor at 30 psi (~200 kg) for 8 minutes at room temperature. The top 30 μl was removed and GTP added to 0.5 mM. This was incubated for 5 minutes at 37°C. Then 0.6 μl of 0.5 mM Taxol was added, and incubated for 10 minutes at 37° C. Following this, 0.6 μl of 1 mM Taxol was added and incubated for 10 minutes at 37° C, and then another 0.6 ul of 1 mM Taxol added and incubated for 5 minutes at 37° C. A sample (30 μl) of a solution of 2 M TMAO (trimethylamine oxide) and 20 μM Taxol was added and mixed gently and incubated for 15 minutes at room temperature. The TMAO is added to stabilize the microtubules (Sackett 1997).
Fluorophores were dissolved in DMSO prior to addition to the microtubules. Disulfo IR125 was dissolved at 10 g/l, and Dylight500 and Dylight 594 were dissolved at 2.5 g/l. Aliquots of 0.4 μl of fluorophore solution were added to a 20 μl sample of microtubules. Disulfo IR125 was always added first and the Dylight added about 10 sec later. The samples were then gently vortexed and incubated at room temperature for 30 minutes. Labeled microtubules were pelleted by centrifugation in the Airfuge (200 kg x 6 minutes) at room temperature. The supernatant was removed and the pellet gently resuspended in microtubule stabilizing buffer consisting of PM buffer containing 0.7 M TMAO, 10 μM Taxol, 6 % glycerol.
RESULTS
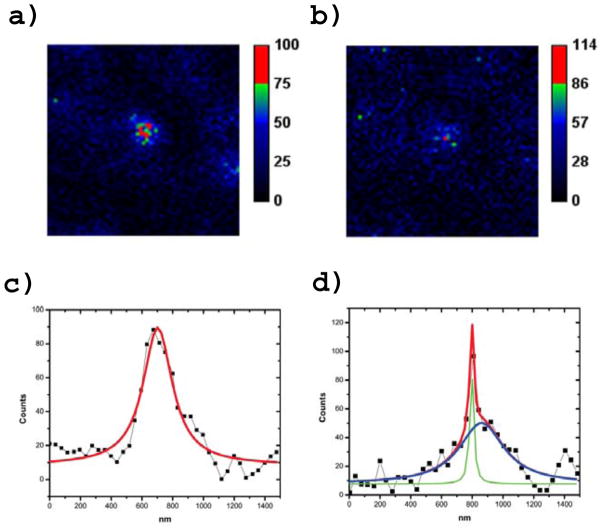
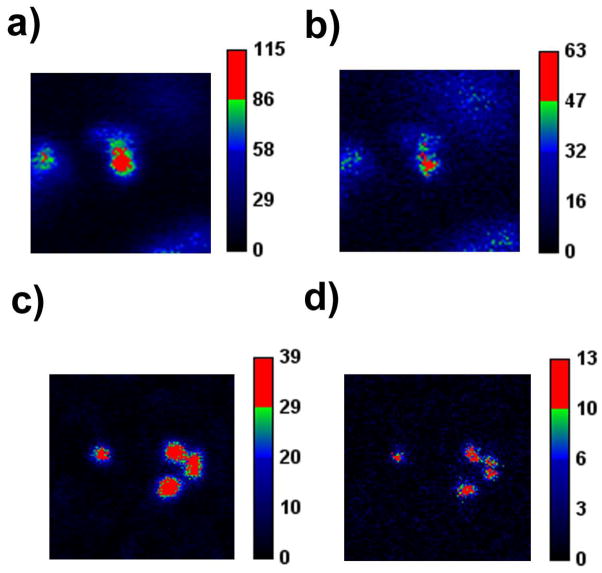
To test the STAQ concept, we constructed a home-built STED/STAQ microscope. We attached the conjugate R6G-IR125 to subresolution latex beads, and we found that superresolution could be achieved with 12mW of 780nm power (Fig. 3.).
While our scanner pixel resolution is 40nm and thus the peak is dominated by a single bright pixel, we observe this pattern recurs at most single-bead sites in our images. A higher resolution (likely galvonometric) scanner will be needed to explore the ultimate resolution of the technique. For now, we simply note resolution is below 50nm with a 12 milliwatt donut power at the relatively non-damaging ~780nm wavelength.
For some studies, we simply coadsorbed both the fluorophore and the TAQ moiety into the bead without a linker (“random labeling STAQ”). We simply relied on the high local concentration of TAQ to achieve the needed proximity (Fig. 4).
Figure 4.
Since the transient absorbance of the TAQ moiety spans the upper visible wavelength range, illumination at ~775nm has the potential to superresolve a variety of fluorophore –IR125 pairs. In addition to R6G, we have coupled DyLight 550 and DyLight 594 to IR125 achieving similar “random labeling STAQ” results on latex beads.
STED usually requires fairly high deactivation power because the deactivation cross section is determined by the shape of the fluorophore emission envelope, and one must compromise to obtain both efficient, uncontaminated detection of the main emission band and stimulated emission carried out at lower energies in the spectral envelope. In contrast, the TAQ moiety provides the full extinction (> ~170,000 M−1cm−1) of its central band near 780nm, easily making it an order of magnitude more absorbing than the excited tail of a visible dye. Since STAQ here is a FRET process, it is useful to test “antenna scalability”: Do multiple TAQ moieties within transient Forster range of the transiently activated quencher (see Fig 1(b)), reduce power needs? One artifact that might prevent applying multiple TAQ: if pairs are too proximate, weak ground-state overlap (weak ordinary FRET) may interfere with the desired signal.
The synthetic chemistry of multiTAQ design is beyond the scope of this first manuscript.
To begin, however, we show that a reduction in power level required to halve the PSF (analogous to Is) occurs when we increase the TAQ/fluorophore ratio in random labeling STAQ (Fig. 5).
Figure 5.
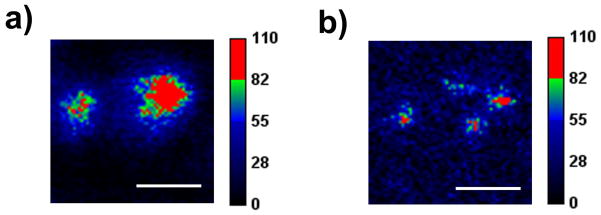
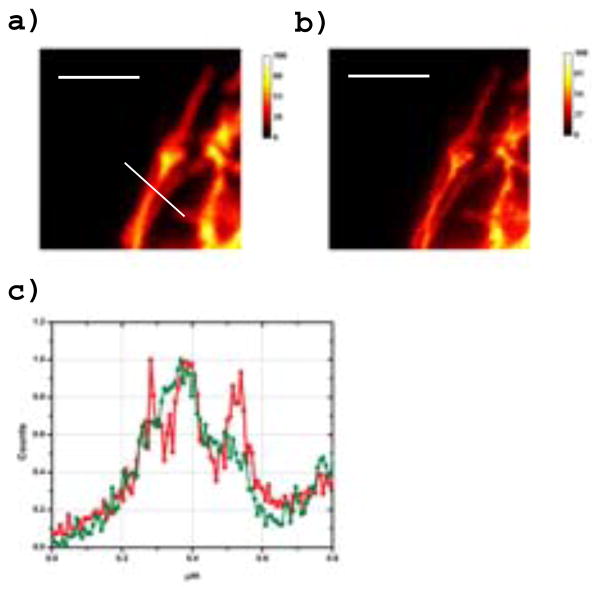
The ultimate goal of most superresolution is the study of biological structures. Hence, we labeled various proteins including antibodies and microtubules. Due to low IR125 water solubility, a more soluble “disulfo” variant was synthesized that still preserved STAQ ability. Figure 6 shows the superresolved image of intracellular microtubules coated with STAQ-anti mouse antibody “sandwich” (i.e., bound to a mouse antibody specific to the α tubulin within). Excitation of DyLight 594 was done at 540nm and TAQ deactivation was done in the NIR (775nm). Apparent sub-70nm resolution (90nm widths seen are including width of actual structures) was achieved with only 40mW applied to the donut “PSF-reducing” beam at the back aperture of the objective (corresponding to less than 12 mW reaching the sample for an illumination power density of ~1.3MW/cm2 and peak power under GW/cm2).
Figure 6.
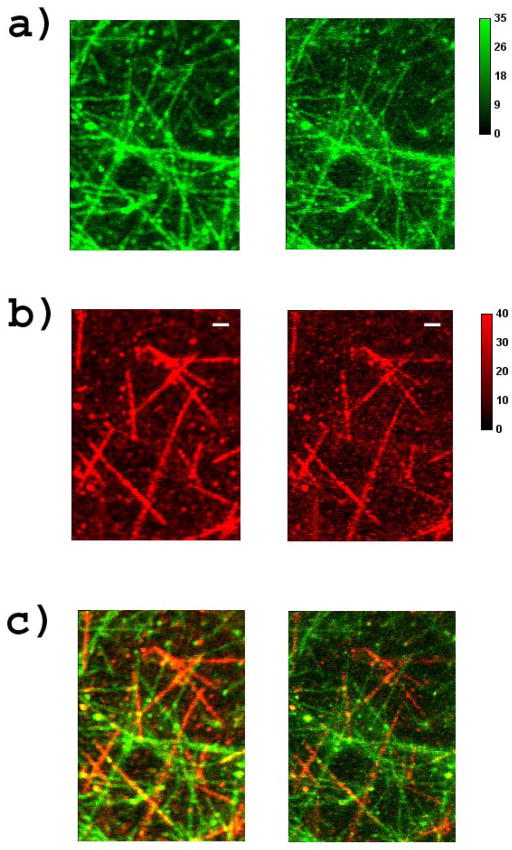
To demonstrate the feasibility of superresolving two colors with just one beam, microtubules were separately labeled with Dylight550 and IR125-disulfo and with Dylight 594 and IR125-disulfo. Later, the mixed sample was excited with 7μW of power at 535nm and deactivated using the same 12mW beam at 775nm. Note there is a 5% bleed through from Dylight 550 into the Dylight 594 detection channel. In this case, we were clearly able to use one green beam to excite and one IR donut beam to simultaneously deactivate both colors, yielding realtime dual-color superresolution. (See Fig. 7).
Figure 7.
DISCUSSION
Our system generates a conventional green excitation pulse in the focal plane of just 4–8μW and a more powerful “donut” beam at ~780nm (usually set below 40mW at the back aperture, resulting in under 12mW at sample) using pulses many picoseconds wide, at 76MHz repetition. The deactivation in STAQ is at the peak of the very strong absorber; thus, our NIR power requirement is typically >10X lower than ordinary STED, and STAQ is done at a redder wavelength (~780nm) that is less damaging to biological structures than red (~680nm) light (Cheng 2013).
We have considered the confounding possibility of generating a pedestal in the PSF via unintended multiphoton excitation of the dye by the 775nm beam; to mitigate this, we extensively stretched the ~1.5ps pulse by passage through 60 meters of single mode fiber. Further motivation came from the fact that STED was previously limited by a picosecond vibrational bottleneck we wished to avoid. In STAQ, however, the generated quencher has a subnanosecond lifetime, so there is no corresponding ground state bottleneck; further, the spectral relaxation needed to generate the transient spectrum should be relatively brief (Khairutdinov 1997; Sudeep 2007). It is possible for a few percent of the dye-TAQ conjugates to adopt configurations on the bead that are incompatible with dipole-dipole FRET coupling; alternatively, a subpopulation of the IR125 may be quasi-statically self-quenched on the bead surface (QSSQ (Chen 1991)). We will be altering TAQ charges and linkers to explore all of these potential pedestal generation phenomena.
Fortunately, any pedestal contributions maintain their original diffraction-limited character and are likely suited to two-term deconvolution, when needed (see Fig. 3). Another donut pedestal reduction strategy has recently been devised called modSTED (Ronzitti 2013); essentially, for CW deactivation (or deactivation at multiples of excitation modulation), the central emission feature can be selected by a lock-in amplifier tuned to an excitation AM modulation frequency, eliminating the incoherent pedestal generated by the donut beam. We have not yet, of course, had time to attempt this very recent strategy. A diffraction-limited pedestal in STED can also arise from mistimed depletion (Galiani 2012); in our case, however, the “incomplete depletion factor” δ for us is due to failed TAQ events rather than early emission:
Depending on the TAQ mechanism chosen, the TAQ moiety may spend a considerable time in the ‘activated state’. One may, in fact, send the quenching (spatial donut) pulse in before the dye excitation and still achieve quenching (data not shown). This is unlike STED, where the deactivation cross section is unavailable until the dye is excited. As a consequence, some STAQ dyes may be better suited to use in CW-STED microscopes (if the TAQ lifetime is not too small compared to the fluorophore). Thus, the cartoon in Fig. 1(a) could include an alternative step showing TAQ activated “early”-while the fluorophore is still in the ground state. This suggests another potential advantage: the use of TAQ moieties with nanosecond lifetimes may enable simplified schemes that employ inexpensive nanosecond diode lasers (e.g. in the computer CD or DVD bands), both for excitation and depletion. Additional hope for reduced photodamage comes from the report that lower powers can be used when a reduced repetition rate, longer pulsed laser is employed (Rankin 2011).
At the wavelengths and power levels we use (esp. with the lowered peak powers of stretched picosecond pulses), illumination of biological samples can be repeated multiple times without cell damage (Konig 1999). Deactivation with ordinary STED is often below the ~690nm range, and ‘bluer’ donut beams likely carry more photodamage risk. Of course, the Dreiklang related RESOLFT schemes (Brakemann 2011) already address this problem.
STAQ is a general concept; the TAQ moiety need not operate by FRET; electronic changes in excited state molecules provides opportunities to transiently generate electron donors or acceptors or photoacids (eg., Napthol, where pKa shifts five units (Laws 1979)). Further, the TAQ process could exploit longer lived quenching states (e.g. triplet transient absorbances, rather than the singlet we employed here)(cf. USPatent 84547533 B2; provisional 61/290282 issued 12/18/09).
We expect “random labeling” STAQ will benefit from compartmentalization in vesicles or other ‘host’ macromolecules We also hope that dendrimeric TAQ will eventually benefit from exciton transfer, thus enhancing the deactivation efficiency. STAQ might be a “STED-helper”, i.e. biological structures being observed now in STED could be also soaked with supplementary TAQ molecules to reduce Is for some of the chromophore colors of interest, or STAQ could be used to add colors to a STED image without changing donut wavelength.
Aside: we note that others have used a very different FRET process to enhance optical resolution (Deng 2010). In their case, however, normal FRET from an excited donor to a ground state acceptor (quite unlike the transiently activated acceptor for STAQ discussed here) is bottlenecked by slow spontaneous deactivation of acceptors. STED deactivates acceptors to help relieve the bottleneck. That method, then, still must employ a high power visible stimulated emission depletion beam, with power requirements close to STED.
Like STED, STAQ represents a temporary depletion process that leaves only a subset of fluorophores in the excited state. Many “photosensitization” processes originate in that excited singlet, meaning STAQ (de)sensitization is still appropriate for nanolithography (Scott 2009). TAQ outlined here is somewhat like ordinary FRET and it should also benefit from time resolution (Bückers 2011; Moffitt 2011; Vicidomini 2011). In fact, for a fixed TAQ transfer rate, the lifetime of quenched species should, theoretically, be relatively homogeneous. In the simplest case, a simple two term lifetime fit of FLIM data would isolate the desired central survivors.
For realtime FLIM analysis, we already employ DAI (Decay Associated Image, (Smirnov 2009) processing to convert net photon counts in defined time intervals (windows or ROI) into amplitude maps for the lifetimes within. Akin to (Coto Hernandez 2014), DAI should extract pure images of “survivors” (donut center dyes, mostly unquenched) vs. depleted pairs. Like gating in STED (Vicidomini 2011), time resolved STAQ should further improve resolution at lower donut power.
We suggest TAQ moieties should next be affixed to genetically engineered targets (e.g., SNAP (Keppler 2003), Cu2+- free click chemistry (Baskin 2007), halogenase (Los 2005), ReASH (Estevez 2006), tubulin tyrosine ligase (Banerjee 2010), nanobodies, aptamers, etc…) to place them within transient Förster distance of fluorescent protein (FP) chromophores. We have already seen some transient quenching using IR125-labeled nanobodies with affinity to RFP (data not shown). Selecting FP with favorable intrinsic TAQ behavior could also be useful.
The pioneering work of Hell and coworkers has opened a broad door to a large family of real time, all optical nanoscopy methods; it is our hope that the intrinsically low-power, multicolor nature of this “add-on” STAQ strategy will serve to hasten and extend the application of that class of nanoscopy to in vivo imaging.
Supplementary Material
Acknowledgments
We thank Drs. C. Combs and R.S. Balaban of NHLBI for helpful discussions; also, J.R.K. thanks Profs. L. Brand and L. Davenport for inspirational discussions about pH-switching of FRET distances. We also thank an anonymous referee for suggesting the addition of appendix I. This research was supported by the Intramural Research Programs of the NIH, NHLBI and NICHD.
References
- Banerjee A, Panosian TD, Mukherjee K, Ravindra R, Gal S, Sackett DL, Bane S. Site-specific orthogonal labeling of the carboxy terminus of alpha-tubulin. Acs Chem Biol. 2010;5:777–785. doi: 10.1021/cb100060v. [DOI] [PMC free article] [PubMed] [Google Scholar]
- Barzda V, Gulbinas V, Kananavicius R, Cervinskas V, Van Amerongen H, Van Grondelle R, Valkunas L. Singlet-singlet annihilation kinetics in aggregates and trimers of LHCII. Biophysical Journal. 2001;80:2409–2421. doi: 10.1016/S0006-3495(01)76210-8. [DOI] [PMC free article] [PubMed] [Google Scholar]
- Baskin JM, Prescher JA, Laughlin ST, Agard NJ, Chang PV, Miller IA, Lo A, Codelli JA, Bertozzi CR. Copper-free click chemistry for dynamic in vivo imaging. Proceedings of the National Academy of Sciences of the United States of America. 2007;104:16793–16797. doi: 10.1073/pnas.0707090104. [DOI] [PMC free article] [PubMed] [Google Scholar]
- Bergermann F, Alber L, Sahl SJ, Engelhardt J, Hell SW. 2000-fold parallelized dual-color STED fluorescence nanoscopy. Optics express. 2015;23:211–223. doi: 10.1364/OE.23.000211. [DOI] [PubMed] [Google Scholar]
- Betzig E, Patterson GH, Sougrat R, Lindwasser OW, Olenych S, Bonifacino JS, Davidson MW, Lippincott-Schwartz J, Hess HF. Imaging intracellular fluorescent proteins at nanometer resolution. Science. 2006;313:1642–1645. doi: 10.1126/science.1127344. [DOI] [PubMed] [Google Scholar]
- Blom H, Widengren J. STED microscopy-towards broadened use and scope of applications. Curr Opin Chem Biol. 2014;20C:127–133. doi: 10.1016/j.cbpa.2014.06.004. [DOI] [PubMed] [Google Scholar]
- Brakemann T, Stiel AC, Weber G, Andresen M, Testa I, Grotjohann T, Leutenegger M, Plessmann U, Urlaub H, Eggeling C, Wahl MC, Hell SW, Jakobs S. A reversibly photoswitchable GFP-like protein with fluorescence excitation decoupled from switching. Nat Biotechnol. 2011;29:942–U132. doi: 10.1038/nbt.1952. [DOI] [PubMed] [Google Scholar]
- Bückers J, Wildanger D, Vicidomini G, Kastrup L, Hell SW. Simultaneous multi-lifetime multi-color STED imaging for colocalization analyses. Optics Express. 2011;19:3130–3143. doi: 10.1364/OE.19.003130. [DOI] [PubMed] [Google Scholar]
- Chen RF, Knutson JR, Ziffer H, Porter D. Fluorescence of tryptophan dipeptides - correlations with the rotamer model. Biochemistry. 1991;30:5184–5195. doi: 10.1021/bi00235a011. [DOI] [PubMed] [Google Scholar]
- Cheng J-X, Xie XS. Series in cellular and clinical imaging. Boca Raton: CRC Press; 2013. Coherent Raman scattering microscopy; p. 127. [Google Scholar]
- Chmyrov A, Keller J, Grotjohann T, Ratz M, D’este E, Jakobs S, Eggeling C, Hell SW. Nanoscopy with more than 100,000 ‘doughnuts’. Nat Methods. 2013;10:737–740. doi: 10.1038/nmeth.2556. [DOI] [PubMed] [Google Scholar]
- Cotlet M, Gronheid R, Habuchi S, Stefan A, Barbafina A, Mullen K, Hofkens J, De Schryver FC. Intramolecular directional Forster resonance energy transfer at the single-molecule level in a dendritic system. Journal of the American Chemical Society. 2003;125:13609–13617. doi: 10.1021/ja036858g. [DOI] [PubMed] [Google Scholar]
- Coto Hernandez I, Peres C, Cella Zanacchi F, D’amora M, Christodoulou S, Bianchini P, Diaspro A, Vicidomini G. A new filtering technique for removing anti-Stokes emission background in gated CW-STED microscopy. J Biophotonics. 2014;7:376–380. doi: 10.1002/jbio.201300208. [DOI] [PubMed] [Google Scholar]
- Deng SH, Chen JF, Huang Q, Fan CH, Cheng Y. Saturated Forster resonance energy transfer microscopy with a stimulated emission depletion beam: a pathway toward single-molecule resolution in far-field bioimaging. Optics Letters. 2010;35:3862–3864. doi: 10.1364/OL.35.003862. [DOI] [PubMed] [Google Scholar]
- Estevez JM, Somerville C. FlAsH-based live-cell fluorescent imaging of synthetic peptides expressed in Arabidopsis and tobacco. Biotechniques. 2006;41:569–570. 572–564. doi: 10.2144/000112264. [DOI] [PubMed] [Google Scholar]
- Galiani S, Harke B, Vicidomini G, Lignani G, Benfenati F, Diaspro A, Bianchini P. Strategies to maximize the performance of a STED microscope. Opt Express. 2012;20:7362–7374. doi: 10.1364/OE.20.007362. [DOI] [PubMed] [Google Scholar]
- Grotjohann T, Testa I, Leutenegger M, Bock H, Urban NT, Lavoie-Cardinal F, Willig KI, Eggeling C, Jakobs S, Hell SW. Diffraction-unlimited all-optical imaging and writing with a photochromic GFP. Nature. 2011;478:204–208. doi: 10.1038/nature10497. [DOI] [PubMed] [Google Scholar]
- Gustafsson MG. Surpassing the lateral resolution limit by a factor of two using structured illumination microscopy. J Microsc. 2000;198:82–87. doi: 10.1046/j.1365-2818.2000.00710.x. [DOI] [PubMed] [Google Scholar]
- Hell SW, Dyba M, Jakobs S. Concepts for nanoscale resolution in fluorescence microscopy. Curr Opin Neurobiol. 2004;14:599–609. doi: 10.1016/j.conb.2004.08.015. [DOI] [PubMed] [Google Scholar]
- Hell SW, Wichmann J. Breaking the diffraction resolution limit by stimulated-emission - Stimulated-Emission-Depletion fluorescence microscopy. Optics Letters. 1994;19:780–782. doi: 10.1364/ol.19.000780. [DOI] [PubMed] [Google Scholar]
- Hess ST, Girirajan TPK, Mason MD. Ultra-high resolution imaging by fluorescence photoactivation localization microscopy. Biophysical Journal. 2006;91:4258–4272. doi: 10.1529/biophysj.106.091116. [DOI] [PMC free article] [PubMed] [Google Scholar]
- Keppler A, Gendreizig S, Gronemeyer T, Pick H, Vogel H, Johnsson K. A general method for the covalent labeling of fusion proteins with small molecules in vivo. Nat Biotechnol. 2003;21:86–89. doi: 10.1038/nbt765. [DOI] [PubMed] [Google Scholar]
- Khairutdinov R, Serpone N. Photophysics of cyanine dyes: subnanosecond relaxation dynamics in monomers, dimers, and H- and J-aggregates in solution. Journal of Physical Chemistry B. 1997;101:2602–2610. [Google Scholar]
- Konig K, Becker TW, Fischer P, Riemann I, Halbhuber KJ. Pulse-length dependence of cellular response to intense near-infrared laser pulses in multiphoton microscopes. Optics Letters. 1999;24:113–115. doi: 10.1364/ol.24.000113. [DOI] [PubMed] [Google Scholar]
- Laws WR, Brand L. Analysis of 2-state excited-state reactions - fluorescence decay of 2-naphthol. J Phys Chem-Us. 1979;83:795–802. [Google Scholar]
- Los GV, Zimprich C, Mcdougall MG, Karassina N, Learish R, Klaubert DH, Darzins A, Bulleit RF, Wood K. The HaloTag (TM): a novel technology for cellular analysis. J Neurochem. 2005;94:15–15. [Google Scholar]
- Moffitt JR, Osseforth C, Michaelis J. Time-gating improves the spatial resolution of STED microscopy. Opt Express. 2011;19:4242–4254. doi: 10.1364/OE.19.004242. [DOI] [PubMed] [Google Scholar]
- Rankin BR, Moneron G, Wurm CA, Nelson JC, Walter A, Schwarzer D, Schroeder J, Colón-Ramos DA, Hell SW. Nanoscopy in a living multicellular organism expressing GFP. Biophysical Journal. 2011;100:L63–65. doi: 10.1016/j.bpj.2011.05.020. [DOI] [PMC free article] [PubMed] [Google Scholar]
- Ronzitti E, Harke B, Diaspro A. Frequency dependent detection in a STED microscope using modulated excitation light. Optics express. 2013;21:210–219. doi: 10.1364/OE.21.000210. [DOI] [PubMed] [Google Scholar]
- Rust MJ, Bates M, Zhuang XW. Sub-diffraction-limit imaging by stochastic optical reconstruction microscopy (STORM) Nat Methods. 2006;3:793–795. doi: 10.1038/nmeth929. [DOI] [PMC free article] [PubMed] [Google Scholar]
- Sackett DL. Natural osmolyte trimethylamine N-oxide stimulates tubulin polymerization and reverses urea inhibition. Am J Physiol-Reg I. 1997;273:R669–R676. doi: 10.1152/ajpregu.1997.273.2.R669. [DOI] [PubMed] [Google Scholar]
- Schroder J, Benink H, Dyba M, Los Georgyi V. In vivo labeling method using a genetic construct for nanoscale resolution microscopy. Biophysical Journal. 2009;96:L1–3. doi: 10.1016/j.bpj.2008.09.032. [DOI] [PMC free article] [PubMed] [Google Scholar]
- Scott TF, Kowalski BA, Sullivan AC, Bowman CN, Mcleod RR. Two-color single-photon photoinitiation and photoinhibition for subdiffraction photolithography. Science. 2009;324:913–917. doi: 10.1126/science.1167610. [DOI] [PubMed] [Google Scholar]
- Smirnov A, Combs C, Balaban RS, Tang K, Knutson JR. A hybrid global fitting alorithm for decay-associated imaes from fluorescence lifetime image microscoopy data. Proceedings of SPIE. 2009;10:71841D.71841–71841D.71846. [Google Scholar]
- Sudeep PK, Takechi K, Kamat PV. Harvesting photons in the infrared. Electron injection from excited tricarbocyanine dye (IR-125) into TiO2 and Ag@TiO2 core-shell nanoparticles. J Phys Chem C. 2007;111:488–494. [Google Scholar]
- Tonnesen J, Nadrigny F, Willig KI, Wedlich-Soldner R, Nagerl UV. Two-color STED microscopy of living synapses using a single laser-beam pair. Biophysical journal. 2011;101:2545–2552. doi: 10.1016/j.bpj.2011.10.011. [DOI] [PMC free article] [PubMed] [Google Scholar]
- Vicidomini G, Moneron G, Han KY, Westphal V, Ta H, Reuss M, Engelhardt J, Eggeling C, Hell SW. Sharper low-power STED nanoscopy by time gating. Nat Methods. 2011;8:571–U575. doi: 10.1038/nmeth.1624. [DOI] [PubMed] [Google Scholar]
- Westphal V, Rizzoli SO, Lauterbach MA, Kamin D, Jahn R, Hell SW. Video-rate far-field optical nanoscopy dissects synaptic vesicle movement. Science. 2008;320:246–249. doi: 10.1126/science.1154228. [DOI] [PubMed] [Google Scholar]
- Willig KI, Keller J, Bossi M, Hell SW. STED microscopy resolves nanoparticle assemblies. New J Phys. 2006;8:106. [Google Scholar]
- Willig KI, Stiel AC, Brakemann T, Jakobs S, Hell SW. Dual-label STED nanoscopy of living cells using photochromism. Nano Lett. 2011;11:3970–3973. doi: 10.1021/nl202290w. [DOI] [PubMed] [Google Scholar]
- Wolff J, Sackett DL, Knipling L. Cation selective promotion of tubulin polymerization by alkali metal chlorides. Protein Sci. 1996;5:2020–2028. doi: 10.1002/pro.5560051008. [DOI] [PMC free article] [PubMed] [Google Scholar]
- Yang B, Przybilla F, Mestre M, Trebbia JB, Lounis B. Large parallelization of STED nanoscopy using optical lattices. Opt Express. 2014;22:5581–5589. doi: 10.1364/OE.22.005581. [DOI] [PubMed] [Google Scholar]
- Zhang ZR, Achilefu S. Design, synthesis and evaluation of near-infrared fluorescent pH indicators in a physiologically relevant range. Chem Commun. 2005;0:5887–5889. doi: 10.1039/b512315a. [DOI] [PubMed] [Google Scholar]
Associated Data
This section collects any data citations, data availability statements, or supplementary materials included in this article.


