

Abstract
Shallot flour was prepared and sieved into three different particle sizes of < 180 μm (sample A), 180 μm (sample B) and 250 μm (sample C). Effect of concentration [0.5%, 1.0%, 1.5% and 2.0% (w/w)], temperature (20, 30, 40, 60 and 80 °C), pH (4, 7 and 10) and freezing (− 20 °C) on rheological properties of shallot flour were studied at increasing shear of 0.1–100 s−1. Effect of dynamic change in temperature (15–95 °C) was also measured at constant shear rate of 50 s−1. Power law (Eq. 2) model with coefficient of determination (R2) above 0.90, well described the rheological behavior of the shallot flour as a shear thinning, non-Newtonian fluid at different concentration, temperature and pH. All the samples had n values below 1 and increase in viscosity or consistency index (k) value with increase in concentration of the sample was observed, while inverse relation was observed when temperature was increased. All samples showed increase in k value when the pH of the dispersion was varied from acidic to alkaline condition. Viscosity of samples were found unaffected even after freezing in freeze–thaw cycle. These data show sample A to be most suitable for their application as thickener, having highest k value. The obtained research provides information for utilization of shallot as a thickener in various food industries.
Keywords: Shallot flour, Shear thinning, Consistency index, Flow behavior index, Thickener
Introduction
Shallot (Allium cepa var. aggregatum) is a type of onion which is widely cultivated globally in China, Asia and Europe. Onion bulb which is a primary edible portion that could be served as ethno-medicine and as a functional food, due to its unique taste, pungent flavor and nutritional properties (Dini et al. 2008). The fresh onion (Allium cepa) bulbs gets softened due to the presence of inherent enzymes, such as polygalacturonase and pectin methyl esterase and are also prone to pathogens during post-harvest (Coolong et al. 2008). Shelf life of onion can be effectively extended by drying of fresh onions to powder as well as chips. Various methods of drying were studied for preparing the dried form of onion like onion powder, strips etc., among these tray drying was found to be most effective, economical and feasible method. The composition of onion powder is very complex because of its nutritional and functional properties which holds better for its prospective sources of antioxidant, food ingredient, anti-browning and bioactive compounds. Major compound like polysaccharides in onion not only have strong biological activity, such as antioxidant property (Shi 2016) but also have anti-cancerous, anticoagulant, antivirus, immune-modulating, anti-inflammatory, anti-complementary and anti-diabetic effects (Zhang et al. 2017; Shi 2016). Other functional attributes, such as moisture retention, hygroscopicity, fat-binding capacity, foam capacity and foam stability. Owing to such functional properties of onion, polysaccharides were sequentially extracted from to investigate its functional, physiological and compositional properties (Zhu et al. 2017).
Hydrocolloids are heterogeneous group which is naturally occurring macromolecules like proteins and polysaccharides, constitute the major categories of food structuring agents and play critical roles in conferring food structure and stability (Phillips and Williams 2009). Hydrocolloids are biological macromolecules also known as hydrophilic colloids due to the presence of hydroxyl (–OH) group which shows affinity toward water molecules. These are used in food, pharmaceutical, textile, cosmetic, paper industries as thickeners, emulsion stabilizers, water retention agents, binders, suspending agents, etc., (Kaewmanee et al. 2014; Archana et al.2013). Recent trends of hydrocolloids in food industry are to perform number of functions including thickening and gelling aqueous solutions, stabilizing foams, emulsions and dispersions, inhibiting ice and sugar crystal formation and the controlled release of flavors (Phillips and Williams 2009). Rheological characterization of this macromolecules have unique property, which is essentially applied for large number of industrial application involving fluid flow like pasteurization, homogenization, evaporation, drying, aseptic processing and other processes (Capitani et al. 2015). It also shows the textural properties of the food products because the process of thickening involves the nonspecific entanglement of conformationally disordered polymer chains (Philips et al. 1986), which in turn influences the sensory of the food products. Hence it is an important additive, Industry is always in lookout for new ingredients with enhanced and/or different performance characteristics for usage of novel food product development as a thickener (Coorey et al. 2014).
Various areas of research involved in food hydrocolloids, which aims to provide an alternate to commercial thickener with enhanced and better properties. Though, shallot powder is used from decades as a seasoning agent for cuisines and culinary preparations as well as food component, but not utilized as functional ingredients because of lack of adequate research on its use as a functional ingredient in food industry. Research has proved that shallot powder can be utilized in food industry as a food additive because of its functional and nutritional properties. These functional properties were found to follow irregular trend with particle size of each flour and powders. Ahmed (2014), Ahmed et al. (2014, 2015, 2016a, b) analyzed various flours like barley, lentil, rice, pumpkin and water chestnut flour for their effect of particle size on various properties like rheological property which finds their application in food products. These studies confirmed the requirement of detail study of rheological properties with variation in their particle size of individual flour/powder used in food products. Therefore, aim of the study is to analyze the rheological characterization of shallot powder in solution with the effect of different concentration, shear rate, particle size, temperature and pH as a source of thickening agent.
Materials and methods
Preparation of shallot powder
Fresh sample of red shallot bulbs were procured from farmer field, near to Chettikulam village, Tamil Nadu and was stored at room temperature. To prepare the shallot for drying, stems of sample bulbs were removed using stem cutter, followed by peeling of skin using the onion peeler designed by IIFPT, Thanjavur. These peeled fresh bulbs were sliced in stainless steel vegetable cutter into uniform size of approximately 2.3 mm and dried in tray drier with a bed thickness of 3-5 mm. The temperature of drier was constantly carried out at 60 °C for 8–10 h with continuous stirring at an interval of 1 h. Dried onion slices were powdered using mixer and sieved into three particle size using graduation test. This powder was packed in HDPE and stored under in refrigeration at 4 °C for further investigation (Bhattacharjee et al. 2013).
Preparation of shallot powder solution
The shallot powder solutions were prepared at the concentration of 0.5%, 1.0%, 1.5% and 2% (w/w) by dispersing sample powder of three different standard particle size of < 180 μm (sample A), 180 μm (sample B) and 250 μm (sample C) in distilled water. This sample solution was stirred for overnight with magnetic stirrer for getting uniform consistency at 300 rpm in ambient temperature. To complete hydration, these stirred samples were tempered at 4 °C for 24 h prior conducting the rheological assessment.
Rheological measurements
Effect of concentration
Rheological measurement was carried out using steady shear tests using rheometer from Anton paar modular compact of model number—MCR 52. For each analysis, 23–24 ml of dispersed solution of shallot sample of 0.5%, 1.0%, 1.5% and 2.0% (w/w) concentration were taken in the measuring cup which was placed in the rheometer and maintained at measuring temperature for 5 min. The viscosity was recorded in triplicates by increasing the shear rate from 0.1 to 100 s−1 at 25 °C obtaining 25 points in a graph at each interval of 200 s with holding time of 5 min after the equipment attains measuring temperature. The flow behavior index (n) and consistency index (k) values were computed by fitting the power law model or Ostwald-de-Waele (Eq. 1):
| 1 |
where is shear stress (Pa), is the shear rate (s−1), k is the consistency coefficient (Pa sn), n is the flow behavior index (dimensionless).
Or in terms of apparent viscosity as
| 2 |
where is apparent viscosity (Pa s), given by relation .
Log–log coordinates were plotted in graph to interpret these parameters from the almost straight line at the given interval of shear rate. Microscopic images of the dispersion were taken using stereo microscope of LEICA S8AP0 model with 100 × resolution for 0.5, 1.0, 1.5 and 2.0% (w/w) for sample A, sample B and sample C.
Effect of the temperature
Sample solution at concentration of 0.5%, 1.0%, 1.5% and 2.0% (w/win triplicates were analyzed for temperature dependency by keeping the shear rate constant as 50 s−1 and calculating apparent viscosity at different elevated temperature ranging from 15 to 95 °C at the heating rate of 5 °C/min. The instrument was set to calculate 20 points in the interval of 15.8 min with evaluating time for each point as 0.789 min.
F the stability study, sample were first measured at 25 °C and then heated or cooled to 100 °C or − 20 °C and held for 1 hand returned to room temperature prior to assessment at 25 °C at the increasing shear rate of 0.1–100 s−1.
Sample solutions of various concentration dispersion were loaded into measuring cup and maintained for 5 min at measurement temperatures of 20, 30, 40, 60 and 80 °C, shear rate was linearly increased from 0.1 to 100 s−1. Measurements were carried out in triplicates. Power law (Eq. 2) was applied for calculating the values of consistency index and flow behavior index.
Flow properties at different pH
The flow property of a powder states the ease with which the powder particles move with respect to each another, that is the resistance to flow. This property is to measure the free-flow characteristics of a powdered sample. Sample solutions of 0.5%, 1.0%, 1.5% and 2.0% (w/w) dispersion in triplicates for all three samples A, B and C were loaded into measuring cup and maintained for 5 min at constant temperature of 25 °C at varying pH of 4, 7 and 10. The pH was adjusted by using 0.1 mol/l standard solution of NaOH and HCl and viscosity were calculated at increasing shear rate of 0.1–100 s−1.
Result and discussion
Effect of concentration
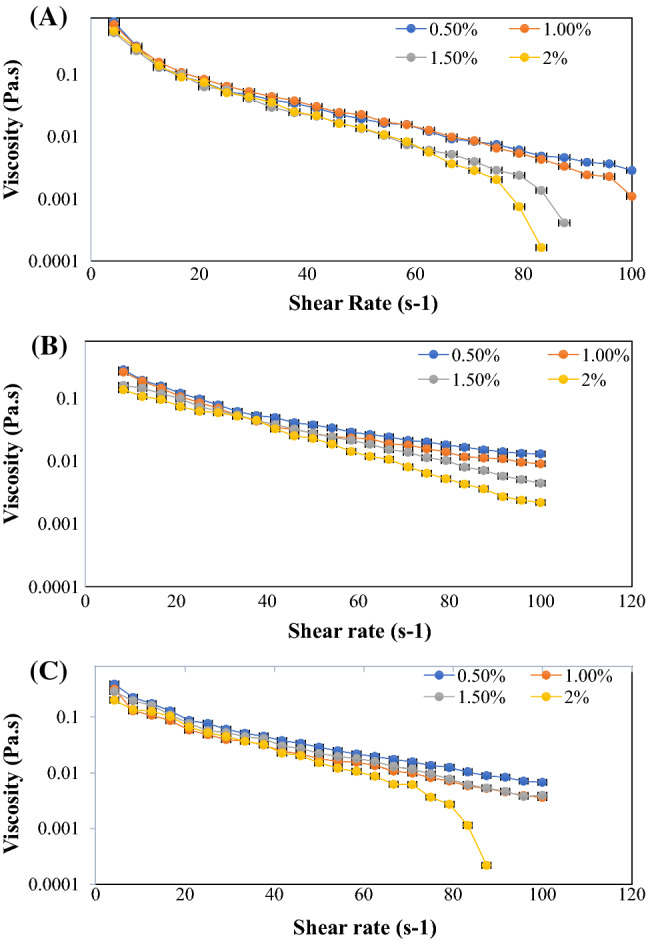
Rheological properties are calculated by using the water suspension of shallot flour using rheometer. These properties vary according to the concentration of sample in solution, type of solvent, temperature, ion concentration and pH. All treated samples exhibited with a typical non-Newtonian behavior which is interpreted directly from the graph having nonlinear relationship between the shear rate as well as shear stress or viscosity using Power law (Eqs. 1 or 2). This nonlinear relation might be due to the structural changes within the shallot flour sample, on the application of exceeding shear rate. Carvalho et al. (2013) reported similar behavior due to unfolding in the gums, leading to thickening effect or thixotropic properties in food products. The similar character of shallot and gum may be attributed to the presence of polysaccharides in both. Zhu et al. (2017) have observed the thickening properties of the polysaccharides of onion flour.
Consistency index (k) and flow behavior index (n) or power law index gives the flow properties of the sample, which was calculated using power law or Oswald–de Waele (Eq. 2) and the values are given in the Table 1. Also, coefficients of determination (R2) values obtained were above 0.90 showing suitability of power law (Eq. 2) model in calculation. Values of ‘n’ lower than 1, categorizes gums into pseudoplastic/shear thinning behavior or in other words, departure from Newtonian to non-Newtonian fluid behavior (Fester et al. 2012), but when n increases and tending to 1, the solution shows Newtonian behavior (Alpizar-Reyes et al. 2017). Graphical representation of solution shows higher apparent viscosity at low shear rate, which dramatically decreases with the increase in shear rate (Capitani et al. 2015). This relation of viscosity at higher shear rate might be due to aligning of particles in the direction parallel to the direction of force applied as well as due to decline in fluid flow resistance. Whereas, viscosity at lower shear rate is due to the stretched polysaccharide structure which intertwine to form aggregate creating very high fluid flow resistance. In this process, bigger particles break into smaller size and creating higher particle–particle interaction and thus, decreasing the viscosity. Such alignment arrangement depends on the concentration of polysaccharides and their structure, which directly affects the viscosity and degree of pseudoplasticity.
Table 1.
The power law or Ostwald-de-Waele parameters of shallot powder samples of different concentration at 25 °C with shear rate of 0.1–100 s−1
| Sample | Concentration (%) | k (Pa sn) | n | R2 |
|---|---|---|---|---|
| Sample A | 0.5 | 5.40 ± 0.51aA | 0.42 ± 0.02 | 0.97 |
| 1.0 | 6.92 ± 0.06aB | 0.44 ± 0.01 | 0.97 | |
| 1.5 | 9.48 ± 1.17aC | 0.62 ± 0.03 | 0.97 | |
| 2.0 | 19.25 ± 1.72aD | 0.63 ± 0.04 | 0.94 | |
| Sample B | 0.5 | 3.90 ± 1.64bA | 0.16 ± 0.08 | 0.99 |
| 1.0 | 6.63 ± 2.61bB | 0.41 ± 0.07 | 0.99 | |
| 1.5 | 7.10 ± 0.48bC | 0.49 ± 0.06 | 0.99 | |
| 2.0 | 14.79 ± 3.01bD | 0.74 ± 0.07 | 0.95 | |
| Sample C | 0.5 | 3.03 ± 1.30cA | 0.32 ± 0.18 | 0.93 |
| 1.0 | 6.21 ± 0.79cB | 0.35 ± 0.04 | 0.97 | |
| 1.5 | 8.47 ± 0.19cC | 0.14 ± 0.03 | 0.90 | |
| 2.0 | 9.46 ± 0.45cD | 0.13 ± 0.02 | 0.90 |
All values are mean ± SE of triplicates
Different small alphabetical letter indicates significant difference between the samples
Different capital alphabetical letter indicates significant difference between the concentrations
Value of n was less than 1 which proves sample to be non-Newtonian fluid; hence its effect can be negligible
Zhu et al. (2017) found higher concentration of polysaccharides, proving the application of onion flour as a source of emulsifying, thickening agent, foam stabilizer. As reported by Ibanoglu (2002) for the gum Arabic study, in our study shallot flour of different particle size also showed almost constant viscosity value at high shear rates, on completion of sharp reduction in viscosity in graphical representations. This might be due to further reduction in size of the dispersion. Also, flow behavior index was found to be less than 1 at all concentration, temperature and pH, like many other hydrocolloids or shear thinning fluids (Alpizar-Reyes et al. 2017; Velázquez-Gutiérrez et al. 2015; Xiu et al. 2011; Philips et al. 1986). Lower values of n are preferred for hydrocolloids (Szczesniak and farkas 1962), because higher value of n (above 0.8) gives a slimy mouth feel and negative consumer appeal. Value of n for the test sample ranges between 0.3 and 0.7 depending on the molecular weight of polymer and few were even smaller like n ~ 0.1–0.15, which corresponds to higher shear thinning behavior or pseudoplasticity. This, results were found to be in accordance with the studies of Majid et al. (2018) on sprouted and unsprouted onion powder. Such lower values of n were mostly observed in fine particle dispersions and are responsible for higher degree of pseudoplasticity (Pongsawatmanit et al. 2006).
Consistency index (k) gives the relation of consistency of the sample or is an indicator of viscous nature of the sample. Increase in concentration of shallot flour increased the k which is directly related to viscosity of the solution for all three samples. Wanchoo et al. (1996) reported k values to be effective function of concentration and temperature than that of n, for the polymeric solution. This increase in consistency index at similar temperature and concentration was observed in many flours like Bengal gram flour (Bhattacharya et al. 1992), chickpea flour (Shanthilal and Bhattacharya 2016), Cheakpea, lentil and pea flour (Sumnu et al. 2016) and various shear thinning fluids like guar gum, xanthan gum (Velázquez-Gutiérrez et al. 2015) and basil seed gum (Naji-Tabasi and Razavi 2017). Sample A was found (Table 1) to have maximum k value with n below 1 for 2.0% (w/w) concentration while for same sample k was least for 0.5% (w/w) concentration. This might be due to the fineness of this sized shallot flour creating low water binding due to the low concentration. Similarly, higher water binding capacity with higher concentration and good network of fine particle might be responsible for higher k value, as evident from the Fig. 1d. Increase in concentration of solutes is also evidence of increase in k value of the solution with the increase in concentration, which is also evident from Fig. 1. The strong and longer network of the solutes formed by the polysaccharides of shallot flour explains the higher k value of sample A at 2% (w/w) concentration as shown in Fig. 1d than sample B and sample C. Similar relation between the particle size and viscosity of the samples were observed in Bengal gram flour (Bhattacharya et al. 1992).
Fig. 1.

Stereo microscope images of shallot flour solution of sample A at 0.5% (a), 1.0% (b), 1.5% (c) and 2.0% (d (w/w) concentration of shallot flour dispersion
Effect of temperature
Effect of temperature on viscosity of different particle size and concentration of shallot flour solution at constant shear rate of 50 s−1, when temperature varied from 15 to 95 °C was calculated to study the dependency of stability of shallot flour on temperature. At this constant shear rate, the viscosity of the shallot flour decreased with the increase in temperature. From the Fig. 2a–c, viscosity had a decline in values when temperature was increased from 15 to 50 °C whereas after these temperatures viscosity of all samples and concentration had almost constant trend, being difficult to differentiate leading to formation of viscosity plateau. Similar results were observed in the xanthan gum which maintained its stability better in the 5–40 °C temperature range (Whitcomb and Macosko 1978) and in sprouted and unsprouted onion powder (Majid et al. 2018). Few more results showing similar results on temperature dependency was observed in hydrocolloids like locust bean gum, guar gum and durian seed gum (Amin et al. 2007). This might be due to maximum hydrophobic interaction above the temperature of 60 °C (Majid et al. 2018). Resch et al. (2004) in his studies also proved further increase in temperature can lead to weakness in molecular bonds which leads to constant viscosity or viscosity plateau. Since, no sharp reduction in viscosity were observed, it shows safe storage or processing temperature range between 15 and 95 °C without deterioration, whereas optimum temperature was found to be 15–50 °C. Sample A was found to have higher viscosity and stability than the other two samples. This might be because, sample B and C had less availability of solids particles for creating resistance flow. This inverse relation between particle size and viscosity was also observed by Majid et al. 2018 in the sprouted onion powder samples. Concentration of the sample also played an important role in such stability; smaller concentration (0.5 and 1.0% (w/w)) had higher viscosity than that of 1.5 and 2.0% (w/w) concentration solution. This was similar to the results observed by Xiu et al. 2011 in his study on stability study of salecan at this temperature range.
Fig. 2.

Effect of dynamic change in temperature (15–95 °C) on apparent viscosity of shallot powder dispersion at various concentration with constant shear rate (50 s−1). a Sample A, b sample B, c sample C
Temperature dependency was also calculated by applying power law (Eq. 2) to study the effect of various temperature on 0.5, 1.0, 1.5 and 2.0% (w/w) concentration for all samples A, B and C. Coefficient of determination (R2) for all the test samples were found to be greater than 0.90 proving best fit of power law for the obtaining relation of temperature and concentration of shallot flour. Shear thinning and pseudoplastic behavior were obtained for all the results with n value less than 1. The k being effective function of concentration and temperature proves non-Newtonian or pseudoplastic or shear thinning behavior of shallot flour. Value of k was found to have inverse relation with temperature. It was found to be higher at lower temperature and vice versa as seen in the Table 2. This in turn describes higher and lower viscosity, because k value is found to have a direct relation with viscosity. Higher viscosity might be due to large hydrodynamic size in the polymer. Similar relation of apparent viscosity was observed in various food waste (Baroutian et al. 2018), Gums like xanthan gum and boza sample (Çelİk et al. 2016).
Table 2.
The power law or Ostwald-de-Waele parameters of shallot powder samples at different concentration and temperature with shear rate 0.1–100 s−1
| Samples | Concentration (%) (w/w) | Temperature (oC) | k (Pa sn) | n | R2 |
|---|---|---|---|---|---|
| Sample A | 0.50 | 20 | 5.98 ± 0.53aAI | 0.51 ± 0.21 | 0.96 |
| 30 | 5.14 ± 0.37aAII | 0.55 ± 0.29 | 0.93 | ||
| 40 | 3.18 ± 0.61aAIII | 0.13 ± 0.05 | 0.99 | ||
| 60 | 3.69 ± 1.29aAIV | 0.45 ± 0.38 | 0.92 | ||
| 80 | 3.12 ± 2.43aAV | 0.43 ± 0.32 | 0.97 | ||
| 1.00 | 20 | 6.88 ± 0.28aBI | 0.24 ± 0.01 | 0.96 | |
| 30 | 6.91 ± 0.24aBII | 0.23 ± 0.02 | 0.96 | ||
| 40 | 6.74 ± 0.31aBIII | 0.25 ± 0.01 | 0.96 | ||
| 60 | 6.27 ± 0.61aBIV | 0.24 ± 0.04 | 0.98 | ||
| 80 | 5.85 ± 0.64aBV | 0.19 ± 0.03 | 0.97 | ||
| 1.50 | 20 | 12.61 ± 1.22aCI | 0.39 ± 0.04 | 0.99 | |
| 30 | 11.26 ± 0.70aCII | 0.36 ± 0.01 | 0.98 | ||
| 40 | 7.50 ± 0.77aCIII | 0.26 ± 0.01 | 0.99 | ||
| 60 | 6.64 ± 0.04aCIV | 0.24 ± 0.04 | 0.96 | ||
| 80 | 5.31 ± 0.29aCV | 0.19 ± 0.00 | 0.98 | ||
| 2.00 | 20 | 12.04 ± 3.41aI | 0.33 ± 0.09 | 0.98 | |
| 30 | 10.69 ± 3.30aDII | 0.34 ± 0.06 | 0.98 | ||
| 40 | 7.95 ± 1.59aDIII | 0.25 ± 0.05 | 0.98 | ||
| 60 | 6.43 ± 0.83aDIV | 0.18 ± 0.01 | 0.97 | ||
| 80 | 6.67 ± 0.98aDV | 0.22 ± 0.02 | 0.96 | ||
| Sample B | 0.50 | 20 | 6.93 ± 0.31bAI | 0.13 ± 0.01 | 1.00 |
| 30 | 4.54 ± 0.38bAII | 0.15 ± 0.04 | 0.99 | ||
| 40 | 3.78 ± 0.42bAIII | 0.25 ± 0.12 | 1.00 | ||
| 60 | 2.47 ± 0.14bAIV | 0.54 ± 0.04 | 0.99 | ||
| 80 | 1.12 ± 2.43bAV | 0.43 ± 0.32 | 0.97 | ||
| 1.00 | 20 | 12.69 ± 0.42bBI | 0.67 ± 0.13 | 0.96 | |
| 30 | 9.43 ± 0.31bBII | 0.57 ± 0.02 | 0.92 | ||
| 40 | 6.31 ± 1.15bBIII | 0.42 ± 0.06 | 0.99 | ||
| 60 | 3.98 ± 0.77bBIV | 0.29 ± 0.12 | 0.97 | ||
| 80 | 2.37 ± 0.80bBV | 0.18 ± 0.04 | 0.97 | ||
| 1.50 | 20 | 11.61 ± 0.02bCI | 0.40 ± 0.02 | 0.99 | |
| 30 | 8.69 ± 0.63bCII | 0.26 ± 0.03 | 0.97 | ||
| 40 | 4.66 ± 0.74bCIII | 0.16 ± 0.03 | 0.98 | ||
| 60 | 3.30 ± 0.79bCIV | 0.14 ± 0.02 | 0.98 | ||
| 80 | 2.92 ± 0.29bCV | 0.19 ± 0.00 | 0.98 | ||
| 2.00 | 20 | 11.52 ± 1.84bDI | 0.37 ± 0.01 | 0.99 | |
| 30 | 9.21 ± 1.74bDII | 0.34 ± 0.02 | 0.32 | ||
| 40 | 7.84 ± 2.25bDIII | 0.25 ± 0.05 | 0.99 | ||
| 60 | 6.77 ± 1.91bDIV | 0.25 ± 0.13 | 0.97 | ||
| 80 | 5.56 ± 0.52bDV | 0.22 ± 0.04 | 0.97 | ||
| Sample C | 0.50 | 20 | 12.39 ± 2.87cAI | 0.31 ± 0.08 | 0.98 |
| 30 | 6.96 ± 1.10cAII | 0.21 ± 0.05 | 0.97 | ||
| 40 | 7.69 ± 1.26cAIII | 0.25 ± 0.05 | 0.96 | ||
| 60 | 6.53 ± 0.35cAIV | 0.16 ± 0.02 | 0.94 | ||
| 80 | 3.86 ± 0.02cAV | 0.37 ± 0.04 | 0.98 | ||
| 1.00 | 20 | 13.01 ± 0.50cBI | 0.36 ± 0.03 | 0.99 | |
| 30 | 8.95 ± 0.78cBII | 0.21 ± 0.03 | 0.94 | ||
| 40 | 8.20 ± 0.43cBIII | 0.2 ± 0.07 | 0.96 | ||
| 60 | 6.73 ± 1.10cBIV | 0.22 ± 0.06 | 0.95 | ||
| 80 | 4.64 ± 1.19cBV | 0.15 ± 0.02 | 0.95 | ||
| 1.50 | 20 | 14.95 ± 3.39cCI | 0.40 ± 0.05 | 0.98 | |
| 30 | 12.10 ± 0.01cCII | 0.37 ± 0.01 | 0.99 | ||
| 40 | 10.49 ± 0.67cCIII | 0.33 ± 0.02 | 0.98 | ||
| 60 | 10.25 ± 1.37cCIV | 0.29 ± 0.03 | 0.96 | ||
| 80 | 6.88 ± 0.54cCV | 0.18 ± 0.01 | 0.92 | ||
| 2.00 | 20 | 11.51 ± 1.05cDI | 0.67 ± 0.12 | 0.97 | |
| 30 | 3.88 ± 1.34cDII | 0.66 ± 0.06 | 0.97 | ||
| 40 | 2.72 ± 0.16cDIII | 0.29 ± 0.03 | 0.99 | ||
| 60 | 9.94 ± 0.02cDIV | 0.14 ± 0.03 | 0.92 | ||
| 80 | 1.54 ± 0.01cDV | 0.50 ± 0.04 | 0.92 |
All values are mean ± SE of triplicates
Different small alphabetical letter indicates significant difference between the samples
Different capital alphabetical letter indicates significant difference between the concentrations of particular sample
Different roman letter indicates significant difference between the temperature of particular sample and concentration
Value of n was less than 1 which proves sample to be non-Newtonian fluid, hence its effect can be negligible
It was found in the study that sample A had higher viscosity and k value which decreased with increase in temperature from 20 to 80 °C and increased with increase in concentration from 0.5 to 2.0% (w/w). This might be due to polysaccharide structure which increases the viscosity or pseudoplastic nature of the hydrocolloid. This in turn was similar to results of various hydrocolloids like xanthan gum, guar gum, galactomannan. Decrease in viscosity or consistency index with increase in temperature might be due to decrease in interaction of polymer with the adjacent polymer due to alignment of molecule in the direction of application of shear rate. On the other hand, k value and viscosity decreased with increase in temperature for both sample B and sample C but had lower values in comparison with sample A. Viscosity was defined as function of water soluble interaction and intermolecular motion which restrict or increases the molecular motion.
Effect of pH
Rheological data calculated for sample A, B and C at 4, 7 and 10 pH were plotted in log–log coordinates to obtain the k and n value in the power law (Eq. 2) as in Table 3. Value of R2 higher than 0.90 proves that power law is best suited to calculate the rheological parameters for the tested samples. Shear thinning or pseudoplastic behavior of shallot flour was observed at all pH conditions (acidic, basic and neutral pH) for all three samples at all concentration. This is evident from the n value which was found to be below 1 as shown in Table 3 and decrease in viscosity of the tested sample as the shear rates were increased. This indicates a shift from a Newtonian to non-Newtonian behavior or a pseudoplasticity behavior. Value of n above 1 would be indication of the Newtonian behavior. Also, value of shallot flour was below 0.8 which makes shallot flour suitable for its use as hydrocolloid having no slimy mouth feel. Increase in pH from acidic to basic condition increased the consistency index of the solution for all samples at all concentration, which is in accordance with data on other hydrocolloids like Tamarind seed mucilage (Alpizar-Reyes et al. 2017), hydroxypropyl guar gum (Wang et al. 2016), Salecan solution (Xiu et al. 2011), bentonite dispersions (Kelessidis et al. 2007) and xanthan gum (Garcıa-Ochoa et al. 2000). This might be due to the increase in charge density, conformational changes in molecule in polymer. It was also noted from the studies that value of k increased with the increase in concentration of the shallot flour when pH values were increased from acidic to basic value for all samples. Highest value of k was observed at higher concentration of sample A having smallest particle size. Similarly, higher values of k or apparent viscosity were observed for all samples at 2.0% (w/w) concentration than other lower concentration, which also indirectly depends on the particle size. It is clear from the studies that apparent viscosity values showed direct relation with pH and indirect relation with the particle size.
Table 3.
The power law or Ostwald-de-Waele parameters of all samples at different concentration of shallot powder solution with different pH conditions
| Samples | Concentration (%) | pH | k (Pa sn) | N | R2 |
|---|---|---|---|---|---|
| Sample A | 0.50 | 4 | 6.85 ± 0.75aAI | 0.33 ± 0.08 | 0.99 |
| 7 | 10.55 ± 0.19aAII | 0.50 ± 0.04 | 0.99 | ||
| 10 | 13.89 ± 0.88aAIII | 0.71 ± 0.06 | 0.98 | ||
| 1.00 | 4 | 13.12 ± 0.74aBI | 0.28 ± 0.01 | 0.9 | |
| 7 | 15.05 ± 0.26aBII | 0.33 ± 0.03 | 0.91 | ||
| 10 | 16.24 ± 0.25aBIII | 0.32 ± 0.01 | 0.95 | ||
| 1.50 | 4 | 13.67 ± 0.06aCI | 0.28 ± 0.03 | 0.89 | |
| 7 | 17.14 ± 0.94aCII | 0.33 ± 0.01 | 0.92 | ||
| 10 | 18.99 ± 0.46aCIII | 0.37 ± 0.01 | 0.93 | ||
| 2.00 | 4 | 15.21 ± 0.59aDI | 0.34 ± 0.01 | 0.93 | |
| 7 | 16.3 ± 0.39aDII | 0.35 ± 0.01 | 0.93 | ||
| 10 | 19.33 ± 0.71aDIII | 0.36 ± 0.04 | 0.95 | ||
| Sample B | 0.50 | 4 | 3.83 ± 0.20bAI | 0.15 ± 0.02 | 0.98 |
| 7 | 5.54 ± 0.62bAII | 0.26 ± 0.04 | 0.99 | ||
| 10 | 9.43 ± 1.20bAIII | 0.48 ± 0.17 | 0.97 | ||
| 1.00 | 4 | 10.68 ± 1.07bBI | 0.22 ± 0.06 | 0.9 | |
| 7 | 15.27 ± 0.52bBII | 0.31 ± 0.02 | 0.92 | ||
| 10 | 16.27 ± 0.17bBIII | 0.35 ± 0.03 | 0.93 | ||
| 1.50 | 4 | 11.79 ± 0.53bCI | 0.23 ± 0.02 | 0.89 | |
| 7 | 13.08 ± 0.48bCII | 0.27 ± 0.02 | 0.89 | ||
| 10 | 13.72 ± 0.70bCIII | 0.26 ± 0.03 | 0.91 | ||
| 2.00 | 4 | 14.06 ± 0.25bDI | 0.31 ± 0.02 | 0.95 | |
| 7 | 14.65 ± 0.12bDII | 0.28 ± 0.03 | 0.92 | ||
| 10 | 15.93 ± 0.15bDIII | 0.33 ± 0.04 | 0.96 | ||
| Sample C | 0.50 | 4 | 3.12 ± 0.13cAI | 0.18 ± 0.03 | 0.97 |
| 7 | 5.43 ± 0.33cAII | 0.34 ± 0.02 | 0.98 | ||
| 10 | 8.37 ± 0.04cAIII | 0.46 ± 0.03 | 0.98 | ||
| 1.00 | 4 | 8.93 ± 0.21cBI | 0.23 ± 0.12 | 0.92 | |
| 7 | 11.21 ± 0.48cBII | 0.23 ± 0.02 | 0.92 | ||
| 10 | 16.53 ± 0.32cBIII | 0.32 ± 0.01 | 0.94 | ||
| 1.50 | 4 | 9.73 ± 1.61cCI | 0.17 ± 0.07 | 0.89 | |
| 7 | 10.38 ± 0.59cCII | 0.32 ± 0.19 | 0.9 | ||
| 10 | 12.51 ± 1.33cCIII | 0.62 ± 0.25 | 0.9 | ||
| 2.00 | 4 | 10.33 ± 1.29cDI | 0.20 ± 0.06 | 0.93 | |
| 7 | 12.34 ± 1.14cDII | 0.26 ± 0.07 | 0.93 | ||
| 10 | 14.37 ± 0.85cDIII | 0.33 ± 0.04 | 0.94 |
All values are mean ± SE of triplicates
Different small alphabetical letter indicates significant difference between the samples
Different capital alphabetical letter indicates significant difference between the concentrations of particular sample
Different roman letter indicates significant difference between the temperature of particular sample and concentration
Value of n was less than 1 which proves sample to be non-Newtonian fluid; hence its effect can be negligible
Effect of freezing
Effect of freezing had no effect on the shear thinning or pseudoplastic behavior of the shallot flour solution, as evident from the rheological data obtained. Decrease in viscosity of the sample was observed with the increase in the shear rate. Almost similar rheological behavior of shallot flour was obtained before and after freezing, showing stable thickening property of shallot flour upon freezing. Several studies on hydrocolloids like xanthan gum and guar gum shows the similar freezing stability in the freezing–thawing cycle, also known as freeze–thaw stability (Vardhanabhuti and Ikeda 2006). Viscosity and stability of smaller concentration like 0.5% and 1.0% (w/w) was found to be maximum as evidence from Fig. 3a–c, for all the samples which is in accordance with the study on salecan powder as thickener (Xiu et al. 2011). Also, the viscosity of the test samples decreased with the increase in particle size. This might be due to better and strong network formed by finer particle of sample A (Fig. 1a–d) followed by sample B and sample C. Though this study proves the application of shallot flour as thickener in product which requires stability after freezing followed by thawing, further work is still needed to measure the effect of continuous freezing or heating of the sample.
Fig. 3.
Effect of freezing (− 20 °C) on apparent viscosity of different shallot flour samples at various concentration at 25 °C with shear rate varying from 0.1 to 100 s−1. a Sample A, b sample B, c sample C
Conclusion
The analyzed dispersions of shallot flour showed non-Newtonian, shear thinning or pseudoplastic behavior with n values below 1. Power law (Eqs. 1 or 2) well described the rheological flow properties of shallot flour at all concentration, temperature and pH with R2 above 0.90. Consistency index (k) and viscosity were found to increase with increase in concentration from 0.5 to 2% (w/w). Whereas, increase in temperature, decreased the k value which has direct relation with the viscosity of the sample. Highest viscosity and k value was found for sample A having particle size of < 180 µm at higher concentration. When studying the effect of dynamic change in temperature, all samples showed dramatic decrease in viscosity until the temperature exceeds 50 °C, which became constant after 60 °C leading to viscosity plateau. Increase in pH from acidic to basic value also increased the consistency index and hence the viscosity for all samples also increased at all the concentration. K values increased with increase in concentration of the samples when their pH was altered. Though effect of freezing also had no deteriorative reaction on the viscosity of samples, but lower concentration of 0.5 and 1.0% (w/w) was found to be more stable in freeze–thaw cycle. This proves the application of shallot flour in the product which requires stability after freezing. This study recommends the use of shallot flour in many food products as a replacer to commercial thickeners.
Acknowledgements
The work was supported by Indian Institute of food processing technology, Thanjavur, Tamil Nadu.
Footnotes
Publisher's Note
Springer Nature remains neutral with regard to jurisdictional claims in published maps and institutional affiliations.
References
- Ahmed J. Effect of particle size and temperature on rheology and creep behavior of barley β-d-glucan concentrate dough. Carbohydr Polym. 2014;111:89–100. doi: 10.1016/j.carbpol.2014.03.098. [DOI] [PubMed] [Google Scholar]
- Ahmed J, Al-Foudari M, Al-Salman F, Almusallam AS. Effect of particle size and temperature on rheological, thermal, and structural properties of pumpkin flour dispersion. J Food Eng. 2014;124:43–53. doi: 10.1016/j.jfoodeng.2013.09.030. [DOI] [Google Scholar]
- Ahmed J, Al-Jassar S, Thomas L. A comparison in rheological, thermal, and structural properties between Indian Basmati and Egyptian Giza rice flour dispersions as influenced by particle size. Food Hydrocolloids. 2015;48:72–83. doi: 10.1016/j.foodhyd.2015.02.012. [DOI] [Google Scholar]
- Ahmed J, Al-Attar H, Arfat YA. Effect of particle size on compositional, functional, pasting and rheological properties of commercial water chestnut flour. Food Hydrocolloids. 2016;52:888–895. doi: 10.1016/j.foodhyd.2015.08.028. [DOI] [Google Scholar]
- Ahmed J, Taher A, Mulla MZ, Al-Hazza A, Luciano G. Effect of sieve particle size on functional, thermal, rheological and pasting properties of Indian and Turkish lentil flour. J Food Eng. 2016;186:34–41. doi: 10.1016/j.jfoodeng.2016.04.008. [DOI] [Google Scholar]
- Alpizar-Reyes E, Carrillo-Navas H, Romero-Romero R, Varela-Guerrero V, Alvarez-Ramírez J, Pérez-Alonso C. Thermodynamic sorption properties and glass transition temperature of tamarind seed mucilage (Tamarindus indica L.) Food Bioprod Process. 2017;101:166–176. doi: 10.1016/j.fbp.2016.11.006. [DOI] [Google Scholar]
- Amin AM, Ahmad AS, Yin YY, Yahya N, Ibrahim N. Extraction, purification and characterization of durian (Durio zibethinus) seed gum. Food Hydrocolloids. 2007;21:273–279. doi: 10.1016/j.foodhyd.2006.04.004. [DOI] [Google Scholar]
- Archana G, Sabina K, Babuskin S, Radhakrishnan K, Fayidh MA, Babu PAS, Sivaranjan M, Sukumar M. Preparation and characterization of mucilage polysaccharide for biomedical applications. Carbohydr Polym. 2013;98(1):89–94. doi: 10.1016/j.carbpol.2013.04.062. [DOI] [PubMed] [Google Scholar]
- Baroutian S, Munir MT, Sun J, Eshtiaghi N, Young BR. Rheological characterisation of biologically treated and non-treated putrescible food waste. Waste Manag. 2018;71:494–501. doi: 10.1016/j.wasman.2017.10.003. [DOI] [PubMed] [Google Scholar]
- Bhattacharjee S, Sultana A, Sazzad MH, Islam MA, Ahtashom M, Asaduzzaman M. Analysis of the proximate composition and energy values of two varieties of onion (Allium cepa L.) bulbs of different origin: a comparative study. Int J Nutr Food Sci. 2013;2(5):246–253. doi: 10.11648/j.ijnfs.20130205.16. [DOI] [Google Scholar]
- Bhattacharya S, Bhat KK, Raghuveer KG. Rheology of Bengal gram (Cicer arietinum) flour suspensions. J Food Eng. 1992;17(2):83–96. doi: 10.1016/0260-8774(92)90054-A. [DOI] [Google Scholar]
- Capitani MI, Corzo-Rios LJ, Chel-Guerrero LA, Betancur-Ancona DA, Nolasco SM, Tomás MC. Rheological properties of aqueous dispersions of chia (Salvia hispanica L.) mucilage. J Food Eng. 2015;149:70–77. doi: 10.1016/j.jfoodeng.2014.09.043. [DOI] [Google Scholar]
- Carvalho FC, Calixto G, Hatakeyama IN, Luz GM, Gremião MPD, Chorilli M. Rheological, mechanical, and bioadhesive behavior of hydrogels to optimize skin delivery systems. Drug Dev Ind Pharm. 2013;39(11):1750–1757. doi: 10.3109/03639045.2012.734510. [DOI] [PubMed] [Google Scholar]
- Çelİk İ, Işik F, Yilmaz Y. Effect of roasted yellow chickpea (leblebi) flour addition on chemical, rheological and sensory properties of boza. J Food Process Preserv. 2016;40(6):1400–1406. doi: 10.1111/jfpp.12725. [DOI] [Google Scholar]
- Coolong TW, Randle WM, Wicker L. Structural and chemical differences in the cell wall regions in relation to scale firmness of three onion (Allium cepa L.) selections at harvest and during storage. J Sci Food Agric. 2008;88(7):1277–1286. doi: 10.1002/jsfa.3219. [DOI] [Google Scholar]
- Coorey R, Tjoe A, Jayasena V. Gelling properties of chia seed and flour. J Food Sci. 2014;79(5):850–866. doi: 10.1111/1750-3841.12444. [DOI] [PubMed] [Google Scholar]
- Dini I, Tenore GC, Dini A. Chemical composition, nutritional value and antioxidant properties of Allium caepa L. Var. tropeana (red onion) seeds. Food Chem. 2008;107(2):613–621. doi: 10.1016/j.foodchem.2007.08.053. [DOI] [Google Scholar]
- Fester V, Slatter P, Alderman N. Resistance coefficients for non-Newtonian flows in pipe fittings. In: Vicente JD, editor. Rheology. Rijeka: InTech; 2012. [Google Scholar]
- Garcıa-Ochoa F, Santos VE, Casas JA, Gomez E. Xanthan gum: production, recovery, and properties. Biotechnol Adv. 2000;18(7):549–579. doi: 10.1016/S0734-9750(00)00050-1. [DOI] [PubMed] [Google Scholar]
- İbanoğlu E. Rheological behaviour of whey protein stabilized emulsions in the presence of gum arabic. J Food Eng. 2002;52(3):273–277. doi: 10.1016/S0260-8774(01)00115-7. [DOI] [Google Scholar]
- Kaewmanee T, Bagnasco L, Benjakul S, Lanteri S, Morelli CF, Speranza G, Cosulich ME. Characterisation of mucilages extracted from seven Italian cultivars of flax. Food Chem. 2014;148:60–69. doi: 10.1016/j.foodchem.2013.10.022. [DOI] [PubMed] [Google Scholar]
- Kelessidis VC, Tsamantaki C, Dalamarinis P. Effect of pH and electrolyte on the rheology of aqueous Wyoming bentonite dispersions. Appl Clay Sci. 2007;38(1–2):86–96. doi: 10.1016/j.clay.2007.01.011. [DOI] [Google Scholar]
- Majid I, Dar BN, Nanda V. Rheological, thermal, micro structural and functional properties of freeze dried onion powders as affected by sprouting. Food Biosci. 2018;22:105–112. doi: 10.1016/j.fbio.2018.01.012. [DOI] [Google Scholar]
- Naji-Tabasi S, Razavi SMA. New studies on basil (Ocimum bacilicum L.) seed gum: part III—steady and dynamic shear rheology. Food Hydrocolloids. 2017;67:243–250. doi: 10.1016/j.foodhyd.2015.12.020. [DOI] [Google Scholar]
- Philips GO, Wedlock DJ, Williams PA. Molecular origin of hydrocolloid functionality. In: Philips GO, Williams PA, Wedlock DJ, editors. Gums and stabilizers for the food industry. Oxford: IRL Press; 1986. pp. 3–5. [Google Scholar]
- Phillips GO, Williams PA, editors. Handbook of hydrocolloids. Amsterdam: Elsevier; 2009. [Google Scholar]
- Pongsawatmanit R, Temsiripong T, Ikeda S, Nishinari K. Influence of tamarind seed xyloglucan on rheological properties and thermal stability of tapioca starch. J Food Eng. 2006;77(1):41–50. doi: 10.1016/j.jfoodeng.2005.06.017. [DOI] [Google Scholar]
- Resch JJ, Daubert CR, Allen Foegeding E. A comparison of drying operations on the rheological properties of whey protein thickening ingredients. Int J Food Sci Technol. 2004;39(10):1023–1031. doi: 10.1111/j.1365-2621.2004.00882.x. [DOI] [Google Scholar]
- Shanthilal J, Bhattacharya S. Time-independent and time-dependent rheological characterization of dispersions with varying contents of chickpea flour and gum arabic employing the multiple loop experiments. J Food Sci. 2016;81(8):E1938–E1948. doi: 10.1111/1750-3841.13355. [DOI] [PubMed] [Google Scholar]
- Shi L. Bioactivities, isolation and purification methods of polysaccharides from natural products: a review. Int J Biol Macromol. 2016;92:37–48. doi: 10.1016/j.ijbiomac.2016.06.100. [DOI] [PMC free article] [PubMed] [Google Scholar]
- Sumnu G, Sahin S, Aydogdu A, Ozkahraman BC (2016) Effects of legume flours on batter rheology and cake physical quality. In III international conference on agricultural and food engineering, vol 1152, pp 175–182
- Szczesniak AS, Farkas E. Objective characterization of the mouthfeel of gum solutions. J Food Sci. 1962;27(4):381–385. doi: 10.1111/j.1365-2621.1962.tb00112.x. [DOI] [Google Scholar]
- Vardhanabhuti B, Ikeda S. Isolation and characterization of hydrocolloids from monoi (Cissampelos pareira) leaves. Food Hydrocolloids. 2006;20(6):885–891. doi: 10.1016/j.foodhyd.2005.09.002. [DOI] [Google Scholar]
- Velázquez-Gutiérrez SK, Figueira AC, Rodríguez-Huezo ME, Román-Guerrero A, Carrillo-Navas H, Pérez-Alonso C. Sorption isotherms, thermodynamic properties and glass transition temperature of mucilage extracted from chia seeds (Salvia hispanica L.) Carbohydr Polym. 2015;121:411–419. doi: 10.1016/j.carbpol.2014.11.068. [DOI] [PubMed] [Google Scholar]
- Wanchoo RK, Sharma SK, Bansal R. Rheological parameters of some water soluble polymers. J Polym Mater. 1996;13(1):49–55. [Google Scholar]
- Wang S, Tang H, Guo J, Wang K. Effect of pH on the rheological properties of borate crosslinked hydroxypropyl guar gum hydrogel and hydroxypropyl guar gum. Carbohydr Polym. 2016;147:455–463. doi: 10.1016/j.carbpol.2016.04.029. [DOI] [PubMed] [Google Scholar]
- Whitcomb PJ, Macosko CW. Rheology of xanthan gum. J Rheol. 1978;22(5):493–505. doi: 10.1122/1.549485. [DOI] [Google Scholar]
- Xiu A, Zhou M, Zhu B, Wang S, Zhang J. Rheological properties of Salecan as a new source of thickening agent. Food Hydrocolloids. 2011;25(7):1719–1725. doi: 10.1016/j.foodhyd.2011.03.013. [DOI] [Google Scholar]
- Zhang F, Shi JJ, Thakur K, Hu F, Zhang JG, Wei ZJ. Anti-cancerous potential of polysaccharide fractions extracted from peony seed dreg on various human cancer cell lines via cell cycle arrest and apoptosis. Front Pharmacol. 2017;8:104. doi: 10.3389/fphar.2017.00102. [DOI] [PMC free article] [PubMed] [Google Scholar]
- Zhu DY, Ma YL, Wang CH, Wang H, Ren YF, Zhang JG, Thakur K, Wei ZJ. Insights into physicochemical and functional properties of polysaccharides sequentially extracted from onion (Allium cepa L.) Int J Biol Macromol. 2017;105:1192–1201. doi: 10.1016/j.ijbiomac.2017.07.164. [DOI] [PubMed] [Google Scholar]