

Abstract
The present work aims to develop a 3-dimensional finite element (FE) model to analyze moisture migration during drying of pineapple ring considering moisture dependent diffusion coefficient (D) and mass transfer coefficient (hm) along with radial and longitudinal shrinkage. Pineapple rings were dried at 70 °C temperature and 0.6 m/s air velocity to study the moisture loss and shrinkage kinetics during drying. Thickness, outer radius and inner radius of hollow cylindrical pineapple slices were reduced by 79.3%, 32.2%, and 51.2%, respectively due to the occurrence of shrinkage during drying. Non-linear regression analysis showed the quadratic model to best fitted to the experimental moisture ratio data for explaining the shrinkage phenomenon in pineapple slice during drying. Shrinkage was accommodated into FE modelling using the arbitrary lagrange-eulerian method. Consideration of variable D showed better agreement with the experimental data than consideration of constant D, however constant and variable hm predicted similar results. Incorporation of shrinkage phenomena during modelling led to prediction of more accurate result showing 0.06% deviation from experimental curve, but neglecting the shrinkage resulted in a 17% deviation. Hence, model developed with consideration of shrinkage along with variable D and hm presented best fit with experimental drying curve. Developed model allowed the visualization of spatial moisture profile within the sample during drying, which would be useful for estimating the correct drying time, optimizing and designing of drying process.
Keywords: Finite element model, Drying, Pineapple, Diffusion coefficient, Shrinkage, Mass transfer coefficient
Introduction
Pineapple is one of the highly perishable fruits containing 85–92% water content that leads to its faster spoilage. Preservation of this fruit can be done by drying process through the removal of moisture resulting in the inhibition of microbial growth and enzymatic reactions leading to its enhanced shelf life. Several researchers have reported different drying methods for preservation of pineapple such as convective drying, vacuum drying, osmotic dehydration, solar drying etc. (Rani and Tripathy 2019; Ramallo and Mascheroni 2012; Bala et al. 2003). Out of these, convective dryers, being simple in their constructional design and least expensive ones are mostly preferred for industrial scale drying of different fruits and vegetables (Junqueira et al. 2017).
Drying is a complex phenomenon involving simultaneous heat and mass transfer between the drying medium and the sample. Mass transfer within the sample is governed by diffusion and water is lost to drying air from the sample surface through evaporation (Dhalsamant et al. 2017). There is non-uniform moisture distribution inside the sample during drying and therefore, it is necessary to carefully analyze the spatial moisture distribution, so that moisture inside the sample can be reduced to safe moisture limit for long term storage of the commodity. However, through experimentation, it is not possible to assess the transient moisture variation within the sample. In this context, mathematical modelling is one of the powerful tools proven useful to study the moisture transfer phenomena for a better understanding of the drying process (Mahapatra and Tripathy 2018a). A considerable work has been reported on development of semi-empirical thin layer mathematical models to analyze the drying behavior of pineapple (Olanipekun et al. 2015) and other fruits such as gooseberry (Junqueira et al. 2017), apricot (Faal et al. 2015). Since they are empirical/semi-empirical in nature and do not include drying process fundamentals; they failed to provide physical explanation of moisture migration occurring inside food samples during drying (Khan et al. 2017). Hence, there is an urge toward the development of more realistic simulation model that accommodates the fundamentals and physics involved in heat and mass transfer and able to solve complex realistic problems along with visualization of moisture distribution inside the sample. In this regard, multi-physics modelling proves to be highly useful, since it can combine many physics such as heat and mass transfer, fluid dynamics, structural deformations etc. in a single computational environment to visualize spatial moisture and temperature distribution along with the structural modifications taking place during the drying process (Kumar et al. 2012). Several researchers have utilized finite element (FE) method for modelling and simulation of drying process (Dhalsamant et al. 2018; Mahapatra and Tripathy 2018b).
Removal of water from the solid matrix during drying leads to changes in shape-size along with food transport properties, which makes the drying process modelling complicated. Most of the researchers have assumed constant transport properties and negligible shrinkage during modelling the drying process (Reddy et al. 2017; Vallespir et al. 2019). However, practically, sample dimensions continuously change with time as the moisture content of sample is reduced with drying time. In some cases, shrinkage phenomena can be quite dominant and neglecting shrinkage could significantly limit the model accuracy. Consideration of shrinkage is important for accurate prediction of moisture during modelling of the drying process as suggested by previous researches (Datta 2007; Golestani et al. 2013). The diffusion coefficient and mass transfer coefficient are important parameters that significantly affect the drying rate and are influenced by many factors like moisture content, temperature, shrinkage during the drying process and hence play a major role in process control, simulation and design (Khan et al. 2017). So, incorporation of accurate values of these parameters during FE modelling improves the model accuracy making the developed model more realistic for practical applications.
The majority of the work done on pineapple is limited to drying kinetics, thin layer mathematical modelling and quality evaluation (Bala et al. 2003; Fasogbon 2013; Rani and Tripathy 2019). Previous studies showed that no computational FE model has been developed till date for prediction of moisture migration in a 3-dimensional hollow cylindrical body like in pineapple ring. Furthermore, model development accounting shrinkage in radial and axial direction has not been attempted yet and studies on consideration of variable diffusion coefficient and mass transfer coefficient for mass transfer modelling are very limited. Hence, the main objective of the present study is to develop a three-dimensional finite element model to predict transient mass transfer and visualize spatial moisture distribution inside pineapple rings by incorporating shrinkage phenomena. Furthermore, the effect of moisture dependent diffusion coefficient and mass transfer coefficient on moisture migration mechanism during modelling has also been studied.
Materials and methods
Experimental study
Fresh pineapples were cut into ring-shaped slices having dimensions as thickness (l): 10 mm; outer diameter (do): 90 mm and inner diameter (di): 30 mm. The initial moisture content of pineapple sample was found in the range of 90–92% (wb) as evaluated using standard AOAC (2002) method. Pineapple slices were dried in a laboratory-scale hot air dryer (SD Instruments, India) at a temperature of 70 °C with a constant air velocity of 0.6 m/s flowing parallel to the sample surface. 100 g sample (4 cut slices of pineapple) was loaded into the dryer in a single layer over stainless-steel trays and dried till the final moisture content of 25% (wb) was reached. The sample weight was measured at regular time interval of 30 min for the entire drying period. The moisture content data obtained from drying experiments were further converted into moisture ratio (MR) in order to normalize the initial moisture content (Mo). The surrounding hot air is considered to be completely dry, hence, Me can be taken as negligible while calculating MR using Eq. 1 (Tripathy 2015).
| 1 |
Where, M: moisture content at any time during drying (kg water/kg dry weight); Me: equilibrium moisture content (kg water/kg dry weight) and Mo: Initial moisture content (kg water/kg dry weight).
Moisture content (M) was plotted with drying time and differentiated using OriginPro 8.5 software to calculate the slope of the curve. The instantaneous drying rate was calculated at every time interval during drying using Eq. 2 (Geankoplis 1983).
| 2 |
Where, DR: drying rate ((kg/h.m2); Ws: weight of dry solid (kg); A: exposed surface area (m2). The average drying rate was estimated by taking the arithmetic mean of instantaneous drying rate data.
Shrinkage study
During drying, the dimensions of pineapple slices (l, di, do) were measured at regular time interval of 1 h using a digital vernier caliper (Moore and Wright, Europe, ± 0.01 mm). Since, change in dimension during drying was not uniform at every point of boundary; hence dimensions were measured at different positions of the pineapple slice. The average values of sample dimensions were used for calculation of volume (V) of pineapple ring as presented in Eq. 3.
| 3 |
Where, do and di are the average outer and inner diameter of the pineapple ring (m), respectively and l is the thickness of the pineapple ring (m).
Further, experimental data of inner radius, outer radius, thickness, and volume change during drying was fitted to mathematical models for the establishment of a relation between shrinkage and moisture ratio. Linear and quadratic models shown in Eqs. 4 and 5 were fitted using non-linear regression analysis in OriginPro 8.5 software and shrinkage kinetics was analyzed (Ponkham et al. 2012).
| 4 |
| 5 |
Where, S is the shrinkage parameter or shrinkage dimension; a, b and c are the equation constants. Statistical analysis was carried out to check the accuracy of the fitted models using the coefficient of determination (R2), root mean square error (RMSE), and reduced chi-square (χ2) as given in Eqs. 6, 7 and 8 respectively (Rani and Tripathy 2019).
| 6 |
| 7 |
| 8 |
Where, Spre,i: predicted shrinkage parameter; Sexp,i: experimental shrinkage parameter; N: number of observations; f: number of constants.
Determination of mass transfer parameters during drying
The governing equation explaining the transient behavior of moisture migration within the food sample for infinite plate is given by Eq. 9.
| 9 |
Where, y = thickness of the slice; y and t are the space and time coordinates, respectively. The initial moisture content of the sample is considered to be uniformly distributed. During drying, moisture migration takes place by diffusion from the sample to surface, governed by effective moisture diffusivity and from the surface to drying air due to convection, which is governed by convective mass transfer coefficient. The term “effective moisture diffusivity (D)” is used to refer to overall transport coefficient which takes in to account all the moisture transport phenomena occurring namely molecular diffusion, liquid diffusion, vapour diffusion, hydrodynamic flow etc.
The integration of analytical solution of Eq. (9) with mentioned consideration provides the volume mean moisture content of the slice and the final solution for dimensionless mean moisture content for infinite slice is given by following expression (10), according to the methodology developed by Tripathy and Kumar (2009).
| 10 |
The surrounding hot air is considered to be completely dry, hence, Me can be taken as negligible, which gives simplified MR as, . Further, after rearrangement, Eq. (10) can be expressed as (Dhalsamant et al. 2017).
| 11 |
The parameter is obtained using the following expressions (Luikov 1968).
| 12 |
Where, Bi is the Biot number for mass transfer; A1 and p, are constants whose values are 1.5708, 2.24 and 1.02, respectively. is the value of when (Luikov 1968).
The biot number for mass transfer is determined using the given Eq. 13 (Pflug and Blaisdell 1963).
| 13 |
Where, co is the lag factor of thin layer equation describing drying characteristics.
Since, moisture diffusivity of the sample varies with changing moisture content during drying; thus, drying time was divided into several small segments while calculating the moisture dependent moisture diffusivity.
Further, the convective mass transfer coefficient (hm) was calculated using the following standard expression (Eq. 14) relating mass transfer coefficient, moisture diffusivity and Biot number (Guine 2012).
| 14 |
Where, ld is the diffusion path (m).
Finite element model development
A 3-D, FE model was developed for visualizing spatial moisture distribution inside the sample and moisture removal from the surface during convective drying of pineapple slices. The pineapple slice was assumed as a hollow cylinder of finite thickness, inner and outer radius. During finite element modelling and simulation of drying process, following assumptions were considered for simplification of the problem.
Initial moisture content is uniform throughout the pineapple sample.
Pineapple sample is assumed to be isotropic and homogenous.
Mass transfer takes place within solid sample only due to diffusion and evaporation occurs at top surface along with internal and external boundaries of pineapple slice.
Deformation of pineapple slice occurs in all directions except in bottom surface.
Air distribution is uniform throughout the dryer and drying takes place at isothermal conditions.
Model formulation physics
In convective drying of food, heat gets transferred from drying air to sample and moisture gets transported from the interior of the food matrix to the surface due to diffusion and further, from the surface to drying air due to evaporation. The rate of the moisture transfer is dependent upon the velocity field, temperature difference as well as moisture concentration difference between sample and drying air (Sabarez 2012). Mass transfer within the food sample is explained by Fick’s second law of diffusion as given in Eq. 15, which was used to model the transient moisture distribution inside the food sample (Valentas et al. 1997).
| 15 |
Where, M is the moisture concentration of sample, D is the diffusion coefficient (m2/s), u is the velocity field of the species and Rsam is the production/consumption of species during reaction. In the present study, pineapple ring was considered at rest and no chemical reaction was involved during drying experiment. Therefore, variables u, Rsam were neglected and the simplified generalized equation for mass transfer due to diffusion inside the food matrix is given by Eq. 16.
| 16 |
Fick’s second law of diffusion equation for transient moisture transfer in three-dimensional hollow cylindrical body with an inner and outer radius as ri and ro respectively, is defined by Eq. 17 (Watson et al. 2010).
| 17 |
Where, r, and z are the distance in radial, angular and longitudinal direction, respectively.
Boundary conditions
In the present case, pineapple slices were placed on stainless steel tray and drying air was flowing over it. Hence, moisture transfer was taking place from top surface, internal and external boundaries which were exposed to drying air. So mass transfer was assumed to be taking place in two directions, i.e., along the radius and thickness. The initial and boundary conditions applied during drying modelling are: moisture is homogeneous in the sample, convective mass transfer takes place from top surface, inner and outer sides of the pineapple ring and null mass flux has been provided at bottom surface as shown in Fig. 1a. Initial and boundary conditions defined are expressed in Eqs. 18–22.
| 18 |
| 19 |
| 20 |
| 21 |
| 22 |
Where, M is the moisture content of sample, is the moisture content at the sample surface. ; where r is the distance in radial direction varying from inner radius (ri) to outer radius (ro) and when r = ro, R = 1. z is the distance varying from bottom (z = 0) to top surface (z = l) in longitudinal direction.
Fig. 1.

Finite element modelling procedure a computational domain of the model showing boundary conditions, b 3-D geometry of pineapple slice, c meshing of geometry in COMSOL Multiphysics software (d) flow chart showing model development strategy in COMSOL software
Shrinkage velocity: The samples undergone structural changes in radial as well as in longitudinal direction during the drying process and the respective dimensional changes measured during the experiment were explained in section “Shrinkage study”. Shrinkage phenomena was accommodated into FE modelling by incorporating shrinkage velocity as an input parameter through moving mesh module. Shrinkage estimation in radial and longitudinal direction was followed by the establishment of a relationship between shrinkage parameter and moisture content using regression analysis for inner radius, outer radius and thickness for the pineapple sample. Further, shrinkage velocity was calculated using the distance and time relationship as shown in Eqs. 23 and 24, respectively.
| 23 |
| 24 |
Where, S is the shrinkage parameter (m) (inner radius, outer radius, thickness); SV is shrinkage velocity (m/s) and t is time (s).
Input parameters to model
The initial moisture content of pineapple slice during FE modelling was given as 12.76 kg water/kg dry solid, as experimentally calculated. The density of the pineapple sample was kept as 980 kg/m3 (Ikegwu and Ekwu 2009). The diffusion coefficient and mass transfer coefficient estimated using Eq. 10–14 were used to model the moisture migration mechanism considering constant and moisture dependent mass transfer parameters.
Simulation procedure
The 3-D model was developed to simulate the moisture migration mechanism of pineapple slice considering structural changes occurring during drying. Along with shrinkage consideration, moisture dependent diffusion coefficient and convective mass transfer coefficient were also included in the model for making it more realistic. The partial differential equations governing the mass transfer process were solved using COMSOL Multiphysics 5.3, a commercial computational software package. The 3-D geometry of pineapple slice was formed and meshed using finer meshing as shown in Fig. 1b, c. The domain was consisted of 29,298 tetrahedral and 4360 triangular elements with minimum element quality of 0.2083 and mesh volume as 5.644 × 10⁻⁵ m3. The stepwise procedure followed during FE modelling of the drying process is shown in Fig. 1d. Transport of diluted species module was used to model the mass transfer phenomena to predict spatial moisture distribution inside the sample. The Arbitrary Lagrangian Eulerian (ALE) approach was attempted in the model to account shrinkage led structural changes occurring in the sample during drying. In the ALE method, equations were adjusted to account mesh movement during the modelling process. The model was solved using a time-dependent study with time step of 900 s up to 37,800 s.
FE model validation
The FE mass transfer COMSOL model was validated with experimental drying results. The correctness of the developed model was evaluated through extensively used statistical error analysis: mean absolute error (MAE), mean relative error (MRE) and standard error (SE) using Eqs. 25–27.
| 25 |
| 26 |
| 27 |
Where, is the average experimental moisture ratio and is the model predicted average moisture ratio for the ith observation. N is the total number of observations.
Results and discussion
Drying kinetics
Pineapple slices were dried from an initial moisture content of 92% to final moisture of 25% (wb) in hot air dryer. The total drying time taken to attain the required final moisture content in the sample was 10.5 h. The drying kinetics of pineapple samples at a constant drying air temperature of 70 °C is shown in Fig. 2a. It can be observed that the slope of the moisture-time curve () was higher during the initial hours of drying and kept on declining with the drying time. Figure 2b represents the variation in drying rate during the drying of pineapple samples. It can be observed that drying rate reduced with the decrease in moisture content and the average drying rate of pineapple slice was found to be 0.47 ± 0.03 kg water/m2.h. Further, a curve was drawn between ln (MR) and drying time as illustrated in Fig. 2c, which clearly depicted the deviation of the curve from linearity. A similar kind of non-linearity was also observed by Younis et al. (2018) during infra-red drying of garlic slices. Such type of non-linearity of ln (MR) and time curve might be the combined effect of different factors like non-uniformity of initial moisture, shrinkage and changing of the diffusion coefficient during drying. Therefore, this is an indication of the variation of diffusion coefficient with the reduction of sample moisture content during drying. A second-order quadratic equation, ; was fitted to experimental data using non-linear regression analysis. It was found that the relation established by fitted second-order quadratic equation between ln (MR) and drying time was in good agreement with experimental data as indicated by a high value of R2 = 0.99.
Fig. 2.
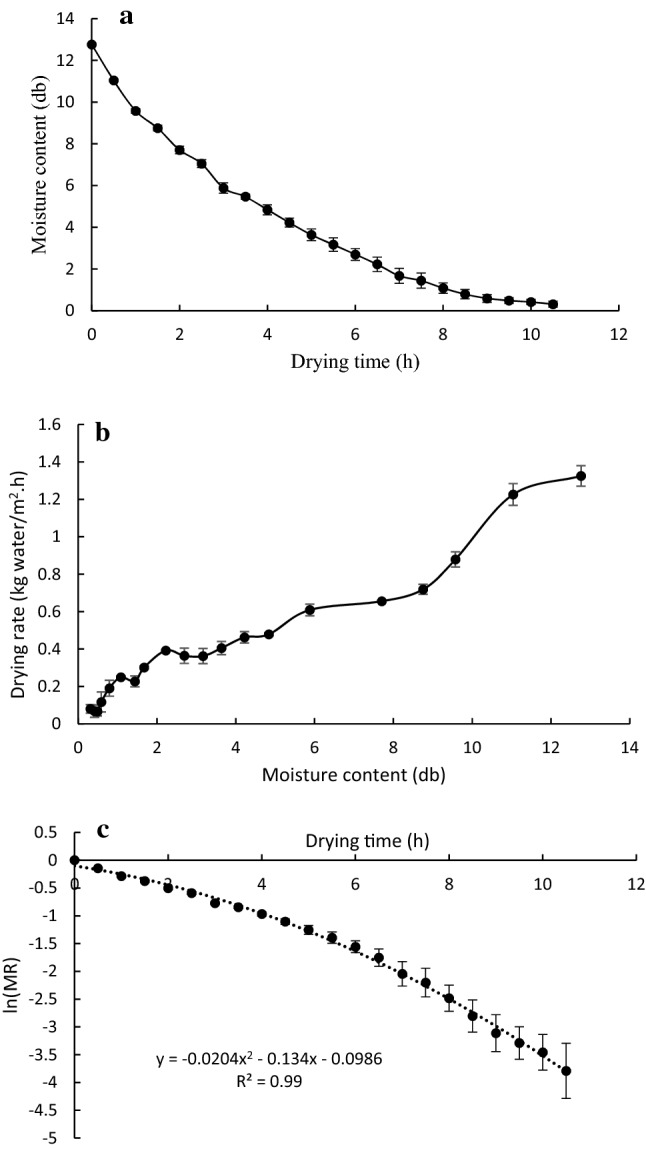
Drying characteristics of pineapple slices under convective drying a drying kinetics, b drying rate, c non-linearity of ln(MR) vs drying time
Shrinkage kinetics
Shrinkage is the common phenomenon observed during hot air drying of most fruits. Pineapple slices dried in the present study showed shrinkage in radial and longitudinal directions, respectively. Pictorial representation of shrinkage phenomena in the radial direction is shown in Fig. 3a. Further, Fig. 3b–e depicted the shrinkage of hollow cylindrical pineapple slices in terms of variation of inner radius, outer radius, thickness and sample volume as a function of moisture ratio. External radius showed a reducing trend from an initial value of 4.51 ± 0.02 cm to a final radius of 3.05 ± 0.04 cm with respect to decreasing moisture content of the sample as drying progressed. It should be taken into notice that during the initial hours of drying, inner radius of the pineapple slice was slightly increased by 0.04 cm, however, after 3 h of drying, inner radius started reducing and sample was shrunk up to 0.7 ± 0.05 cm. Water was migrating from the center towards the boundaries of sample and the sample was shrinking in the opposite direction of moisture removal. Shrinkage from the external boundaries was into the inward direction and inner radius was increasing due to shrinkage in outward direction leading to slight internal expansion. From Fig. 3a, it could be clearly inferred that intensity of shrinkage increased with time. However, after 3–4 h of drying, shrinkage from outer boundaries was more dominated and hence whole body started shrinking inward. Thickness of the sample was continuously reducing with increasing drying time and reducing moisture content. There was a 79.3% reduction in thickness of pineapple slice during the total drying period and thickness of the dried sample was found as 0.21 ± 0.04 cm. Outer and inner diameter showed a 32.2% and 51.28% reduction in sample dimensions, respectively during the drying process. Ponkham et al. (2012) also observed a similar trend of shrinkage kinetics during far-infrared drying of pineapple rings. To explain the relationship between shrinkage and moisture content during drying, linear and second-order polynomial models were fitted to experimental data. Model constants and statistical analysis of fitted model for inner radius, outer radius, thickness and volume change is shown in Table 1. It can be clearly stated that quadratic model showed higher values of R2 and lower values of RMSE and χ2 than that of a linear model for all shrinkage dimensions. It indicates the capability of the quadratic model to establish more accurate relation between shrinkage dimension and reducing moisture ratio as compared to the linear model. These results are in good agreement with the outcomes of work carried out by Ponkham et al. (2012). They also revealed that quadratic model was best fitted for shrinkage modelling during far-infrared and air drying of pineapple rings. However, contradictory to it, linear relationship between shrinkage and moisture ratio was observed during convective drying of potato slab (Aprajeeta et al. 2015) carrot slab (Madiouli et al. 2012) and pumpkin (Mayor et al. 2011).
Fig. 3.

Shrinkage phenomena during pineapple slice drying a pictorial representation of pineapple slices showing the occurrence of shrinkage throughout the drying period; dimensional variations and mathematical models fitted to pineapple slices during hot air drying for b inner radius, c outer radius, d thickness and e volume of sample
Table 1.
Estimated values of equation constants and statistical errors of models fitted to shrinkage dimensions of pineapple slices
| Shrinkage dimension | Model | Equation constants | R2 | χ2 | RMSE |
|---|---|---|---|---|---|
| Inner radius | Linear model | a = 0.00891, b = 0.00856 | 0.76 | 2.20 × 10⁻⁶ | 1.48 × 10⁻³ |
| Quadratic model | a = 0.00701, b = 0.02323, c = − 0.01538 | 0.98 | 9.29 × 10⁻⁸ | 3.05 × 10⁻⁴ | |
| Outer radius | Linear model | a = 0.03218, b = 0.01527 | 0.91 | 2.20 × 10⁻⁶ | 1.48 × 10⁻³ |
| Quadratic model | a = 0.03031, b = 0.02965, c = − 0.01508 | 0.99 | 1.80 × 10⁻⁷ | 4.24 × 10⁻⁴ | |
| Thickness | Linear model | a = 0.00246, b = 0.00881 | 0.96 | 2.69 × 10⁻⁶ | 5.47 × 10⁻⁴ |
| Quadratic model | a = 0.00187, b = 0.01336, c = − 0.00477 | 0.98 | 8.55 × 10⁻⁷ | 3.26 × 10⁻⁴ | |
| Volume | Linear model | a = 0.08793, b = 0.97188 | 0.96 | 0.01159 | 0.0355 |
| Quadratic model | a = 0.06796, b = 1.12556, c = − 0.16112 | 0.98 | 0.00119 | 0.0344 |
Where, a, b, c are the regression equation constants
Mass transfer parameters
The diffusion coefficient and mass transfer coefficient are important parameters that govern the moisture transfer mechanism and were used as input parameters during modelling of drying process. Average values of hm and D were estimated by taking the arithmetic mean of all the values calculated for different time segments during the drying period. Moisture dependent relations of diffusion coefficient and convective mass transfer coefficient were obtained from the non-linear regression analysis (Sharma and Prasad 2004). The average diffusion coefficient and convective mass transfer coefficient for the pineapple slices during hot air drying were estimated as 1.90 × 10⁻⁹ m2/s and 9.58 × 10⁻⁷ m/s, respectively. The moisture dependent diffusion coefficient and convective mass transfer coefficient were determined as a function of moisture content (M) as represented by the following polynomial equations:
D = − 4 × 10–11 M2 + 6 × 10⁻¹⁰ M – 3 × 10⁻¹⁰ (R2 = 0.81) and hm = − 2 × 10⁻⁸ M2 + 3 × 10⁻⁷ M + 4 × 10⁻⁷ (R2 = 0.83) respectively. These values were used for the development of FE model to explain the moisture migration mechanism.
Moisture transfer model validation
In the present work, drying kinetics was investigated through FE modelling under five different set of conditions namely: with and without shrinkage consideration, using constant and moisture dependent diffusion coefficient and mass transfer coefficient. Drying kinetics was studied by developing different models and considering constant average diffusion coefficient (CD) and moisture dependent variable diffusion coefficient (VD). Similarly, the effect of assuming constant mass transfer coefficient (Chm) and moisture dependent mass transfer coefficient (Vhm) on drying kinetics was also analyzed by developing different models incorporating shrinkage study. Developed moisture models were validated with experimental results by comparing the predicted average moisture content of the sample and experimentally estimated moisture content. The predicted average moisture content of the sample was estimated by taking the volumetric average of spatial moisture content as given by the model, calculated using Eq. 28 (Golestani et al. 2013).
| 28 |
Where, is the average moisture content predicted by the model, V is the volume of the sample (m3); is the moisture content at any spatial position inside the sample at any instant t.
Moisture migration considering variable mass transfer coefficient and diffusion coefficient
Figure 4a shows the comparison of moisture ratio obtained from experimental and FE model predicted values for different test conditions while considering shrinkage: with (a) average hm, variable D; (b) average hm, average D; (c) variable hm, average D; (d) variable hm, variable D. As shown in the figure, reduction in moisture ratio during the initial one hour of drying was almost same under all the conditions. However, it was observed that, after 1 h of drying, there was more difference between the experimental values of moisture ratio and those predicted by assuming average moisture diffusivity. The finite element model prediction using moisture dependent diffusion coefficient was found to be very close to experimental data. It is noteworthy to mention that drying curves predicted by taking constant and moisture dependent mass transfer coefficient were not much different, which might be because of less variation in the value of mass transfer coefficient during drying. These results were also confirmed by the statistical analysis given in Table 2. Models developed with the consideration of variable moisture diffusivity presented lower values as compared to models developed with constant diffusivity assumption. Moreover, model developed with consideration of moisture dependent hm and D, showed the lowest values of MAE, MRE and SE, representing the best fitting of model predicted result with experimental values. Simal et al. (2006) also reported that the use of moisture dependent effective moisture diffusivity during modelling of pineapple slices predicted more satisfactory result. Golestani et al. (2013) developed a finite-difference analytical model for heat and mass transfer analysis of disc-shaped apples and concluded that the drying kinetics predicted by consideration of shrinkage and variable diffusion coefficient were in closest agreement with experimental data.
Fig. 4.


Validation of developed finite element model for moisture ratio (MR) a average and moisture dependent diffusion coefficient and mass transfer coefficient with consideration of shrinkage, b with and without shrinkage consideration with varying diffusion coefficient and mass transfer coefficient; Spatial moisture distribution within pineapple slice during drying as predicted by finite element model considering shrinkage, variable diffusion coefficient and mass transfer coefficient, c 3-dimensional view, d top view
Table 2.
Statistical error analysis for validation of finite element model prediction with experiments
| FE model | Statistical errors | ||
|---|---|---|---|
| MAE | MRE | SE | |
| With shrinkage | |||
| Avg hm, Variable D | 0.0246 | 0.1320 | 0.0325 |
| Avg hm, Avg D | 0.0603 | 0.2724 | 0.0754 |
| Variable hm, Avg D | 0.0520 | 0.2541 | 0.0667 |
| Variable hm, Variable D | 0.0171 | 0.1075 | 0.0225 |
| Without shrinkage | |||
| Variable hm, Variable D | 0.0822 | 0.9897 | 0.1044 |
hm convective mass transfer coefficient (m/s), D diffusion coefficient (m2/s), Avg average
Effect of shrinkage consideration on moisture migration during modelling
It was confirmed from the graphical representation (Fig. 4a) and statistical analysis (Table 2) results that moisture migration was best predicted by the model considering shrinkage along with moisture dependent hm and D. Further, the effect of without shrinkage consideration along with variable hm and D during modelling of drying process was analyzed on moisture migration mechanism. Figure 4b shows that variation of moisture ratio predicted by FE model with and without shrinkage consideration. It can be clearly seen that without considering the shrinkage phenomena during modelling, the predicted moisture ratio showed a large deviation, up to 17%, from the experimental curve, in contrast to 0.06% deviation by considering the shrinkage effect. Hence, prediction of moisture migration by FE model without involving shrinkage phenomena was overestimated. This was further supported by higher values of statistical errors between experimental and predicted model assuming no shrinkage as shown in Table 2. Moisture removal causes disturbance in mechanical equilibrium of plant cells resulting in deformation of cells and tissues. This gives rise to shrinkage phenomena taking place towards the center of the body. Shrinkage of food materials during drying leads to reduction in overall dimensions. However, distance traveled by water molecules to diffuse within the food sample (path length) may increase or decrease depending upon the degree of tortuosity effect. In the present study, path length covered by water molecules to diffuse from inside to sample matrix was relatively longer in no shrinkage model than that of considering shrinkage. It is evident from Fig. 4b that the effect of shrinkage dominates the effect of tortuosity thus enhancing the moisture loss.
Spatial moisture distribution
Shrinkage consideration and incorporation of moisture dependent variable hm and D in the model allowed better prediction of moisture profile. Figure 4c, d present the 3-dimensional moisture profile and shrinkage of pineapple slices during convective drying as predicted by the model. It can be clearly observed that there is simultaneous reduction in area along with moisture loss that enhances the mass flux. It is also evident that moisture loss was taking place from the top surface, internal boundaries and external boundaries. Therefore, sample surface presented comparatively very low moisture, whereas, higher moisture was observed inside the body. Model provided better insight of slowest heating zone which remained as thickness, z = 0 in the longitudinal direction, and in the radial direction. In this region, moisture content remained higher as compared to boundaries at any instance and moisture transfer is slow. By visualizing the sample surface, the drying process may look complete, however, higher moisture present inside the sample may still give an invitation to microbial growth leading to spoilage (Khan et al. 2017). However, the developed model allowed estimation of moisture at any point/region of food sample at any instance of time during drying.
Conclusion
In the present study, a finite element approach has been presented to develop a computational model for the prediction of moisture migration and distribution mechanism inside a 3-dimensional pineapple slice during convective drying. Experimental analysis of drying and shrinkage kinetics of pineapple slices during drying was also studied. The total drying time to reduce the moisture from 92% to final moisture content of 25% (wb) was found as 10.5 h. Thickness, outer radius and inner radius of hollow cylindrical pineapple slices were reduced by 79.3%, 32.2% and 51.2%, respectively due to the occurrence of shrinkage during drying. Non-linear regression analysis showed that quadratic model was more effective than linear model for representing the change in shrinkage parameter with reducing moisture ratio during drying. The developed FE model was validated with experimental results in terms of average moisture content and was found in good agreement with low statistical errors. It was observed that consideration of shrinkage phenomena and moisture dependent transport properties (diffusion coefficient and mass transfer coefficient) allowed better prediction of moisture migration mechanism. FE model demonstrated the significance of shrinkage consideration while modelling the drying process, as assumption of negligible shrinkage led to predict moisture with 17% deviation from the experimental results. It can be inferred that deformation occurring during shrinkage strongly influences the moisture migration phenomena; hence shrinkage should not be neglected while developing a food drying model. Developed FE model allowed the visualization and evaluation of spatial moisture profile within the sample during drying process and analysis of slow heating zone of the sample, which would manifest to be a robust tool for correct estimation of drying time, control and optimization of drying process.
List of symbols
- A
Exposed surface area (m2)
- D
Moisture diffusion coefficient (m2/s)
Slope of moisture vs. drying time curve
- DR
Drying rate (kg/h.m2)
- do
Outer diameter of pineapple slice (m)
- di
Inner diameter of pineapple slice (m)
- l
Thickness of pineapple slice (m)
- M
Moisture content (kg water/kg dry weight)
- Me
Equilibrium moisture content (kg water/kg dry weight)
- Mo
Initial moisture content (kg water/kg dry weight)
Moisture content at the sample surface
- MR
Moisture ratio
- N
Number of observations
- R2
Coefficient of determination
- ri
Inner radius of slice (m)
- ro
Outer radius of slice (m)
- t
Time (s)
- wb
Wet basis
- Ws
Weight of dry solid (kg)
- f
Number of constants
- V
Volume of pineapple ring (m3)
- S
Shrinkage parameter
- Spre,I
Predicted shrinkage parameter
- Sexp,I
Experimental shrinkage parameter
- RMSE
Root mean square error
- χ2
Reduced chi-square error
- hm
Convective mass transfer coefficient (m/s)
- SV
Shrinkage velocity (m/s)
- Bi
Biot Number
- MAE
Mean absolute error
- MRE
Mean relative error
- SE
Standard error
Average experimental moisture ratio for the ith observation
Model predicted average moisture ratio for the ith observation
Compliance with ethical standards
Conflict of interest
The authors declare that there is no conflict of interest.
Footnotes
Publisher's Note
Springer Nature remains neutral with regard to jurisdictional claims in published maps and institutional affiliations.
References
- AOAC . Official methods of analysis. 15. Arlington: Association of Official Analytical Chemists; 2002. [Google Scholar]
- Aprajeeta J, Gopirajah R, Anandharamakrishnan C. Shrinkage and porosity effects on heat and mass transfer during potato drying. J Food Eng. 2015;144:119–128. doi: 10.1016/j.jfoodeng.2014.08.004. [DOI] [Google Scholar]
- Bala BK, Mondol MRA, Biswas BK, Das Chowdury BL, Janjai S. Solar drying of pineapple using solar tunnel drier. Renew Energy. 2003;28(2):183–190. doi: 10.1016/S0960-1481(02)00034-4. [DOI] [Google Scholar]
- Datta AK. Porous media approaches to studying simultaneous heat and mass transfer in food processes. I: problem formulations. J Food Eng. 2007;80(1):80–95. doi: 10.1016/j.jfoodeng.2006.05.013. [DOI] [Google Scholar]
- Dhalsamant K, Tripathy PP, Shrivastava SL. Moisture transfer modeling during solar drying of potato cylinders considering shrinkage. Int J Green Energy. 2017;14(2):184–195. doi: 10.1080/15435075.2016.1256290. [DOI] [Google Scholar]
- Dhalsamant K, Tripathy PP, Shrivastava SL. Heat transfer analysis during mixed-mode solar drying of potato cylinders incorporating shrinkage: numerical simulation and experimental validation. Food Bioprod Process. 2018;109:107–121. doi: 10.1016/j.fbp.2018.03.005. [DOI] [Google Scholar]
- Faal S, Tavakoli T, Ghobadian B. Mathematical modelling of thin layer hot air drying of apricot with combined heat and power dryer. J Food Sci Technol. 2015;52(May):2950–2957. doi: 10.1007/s13197-014-1331-9. [DOI] [PMC free article] [PubMed] [Google Scholar]
- Fasogbon Studies on the osmotic dehydration and rehydration characteristics of pineapple slices. J Food Process Technol. 2013 doi: 10.4172/2157-7110.1000220. [DOI] [Google Scholar]
- Geankoplis CJ. Transport processes and unit operations. Boston: Allyn and Bacon; 1983. [Google Scholar]
- Golestani R, Raisi A, Aroujalian A. Mathematical modeling on air drying of apples considering shrinkage and variable diffusion coefficient. Dry Technol. 2013;31(1):40–51. doi: 10.1080/07373937.2012.714826. [DOI] [Google Scholar]
- Guiné RPF, Henrriques F, Barroca MJ. Mass transfer coefficients for the drying of pumpkin (Cucurbita moschata) and dried product quality. Food Bioprocess Technol. 2012;5(1):176–183. doi: 10.1007/s11947-009-0275-y. [DOI] [Google Scholar]
- Ikegwu O, Ekwu F. Thermal and physical properties of some tropical fruits and their juices in Nigeria. J Food Technol. 2009;7(2):38–42. [Google Scholar]
- de Junqueira JRJ, Corrêa JLG, de Oliveira HM, Ivo Soares Avelar R, Salles Pio LA. Convective drying of cape gooseberry fruits: effect of pretreatments on kinetics and quality parameters. LWT Food Sci Technol. 2017;82:404–410. doi: 10.1016/j.lwt.2017.04.072. [DOI] [Google Scholar]
- Khan MIH, Kumar C, Joardder MUH, Karim MA. Determination of appropriate effective diffusivity for different food materials. Dry Technol. 2017;35(3):335–346. doi: 10.1080/07373937.2016.1170700. [DOI] [Google Scholar]
- Kumar C, Karim A, Saha SC, Joardder MUH, Brown RJ, Biswas, D (2012) Multiphysics Modelling of convective drying of food materials. In: Proceedings of the Global Engineering, Science and Technology Conference (December):1–13
- Luikov AV. Analytical heat diffusion theory. New York: Academic Press; 1968. [Google Scholar]
- Madiouli J, Sghaier J, Lecomte D, Sammouda H. Determination of porosity change from shrinkage curves during drying of food material. Food Bioprod Process. 2012;90(1):43–51. doi: 10.1016/j.fbp.2010.12.002. [DOI] [Google Scholar]
- Mahapatra A, Tripathy PP. Modeling and simulation of moisture transfer during solar drying of carrot slices. J Food Process Eng. 2018;41(8):1–15. doi: 10.1111/jfpe.12909. [DOI] [Google Scholar]
- Mahapatra A, Tripathy PP. Experimental investigation and numerical modeling of heat transfer during solar drying of carrot slices. Heat Mass Transf. 2018;55(5):1287–1300. doi: 10.1007/s00231-018-2492-2. [DOI] [Google Scholar]
- Mayor L, Moreira R, Sereno AM. Shrinkage, density, porosity and shape changes during dehydration of pumpkin (Cucurbita pepo L.) fruits. J Food Eng. 2011;103(1):29–37. doi: 10.1016/j.jfoodeng.2010.08.031. [DOI] [Google Scholar]
- Olanipekun BF, Tunde-Akintunde TY, Oyelade OJ, Adebisi MG, Adenaya TA. Mathematical modeling of thin-layer pineapple drying. J Food Process Preserv. 2015;39(6):1431–1441. doi: 10.1111/jfpp.12362. [DOI] [Google Scholar]
- Pflug LJ, Blaisdell JL. Methods of analysis of precooling data. ASHRAE J. 1963;5:33–40. [Google Scholar]
- Ponkham K, Meeso N, Soponronnarit S, Siriamornpun S. Modeling of combined far-infrared radiation and air drying of a ring shaped-pineapple with/without shrinkage. Food Bioprod Process. 2012;90(2):155–164. doi: 10.1016/j.fbp.2011.02.008. [DOI] [Google Scholar]
- Ramallo LA, Mascheroni RH. Quality evaluation of pineapple fruit during drying process. Food Bioprod Process. 2012;90(2):275–283. doi: 10.1016/j.fbp.2011.06.001. [DOI] [Google Scholar]
- Rani P, Tripathy PP. Effect of ultrasound and chemical pretreatment on drying characteristics and quality attributes of hot air dried pineapple slices. J Food Sci Technol. 2019 doi: 10.1007/s13197-019-03961-w. [DOI] [PMC free article] [PubMed] [Google Scholar]
- Reddy RS, Ravula PR, Arepally D. Drying kinetics and modelling of mass transfer in thin layer convective drying of pineapple. Chem Sci Int J. 2017;19(3):1–12. doi: 10.9734/CSJI/2017/32746. [DOI] [Google Scholar]
- Sabarez HT. Computational modelling of the transport phenomena occurring during convective drying of prunes. J Food Eng. 2012;111(2):279–288. doi: 10.1016/j.jfoodeng.2012.02.021. [DOI] [Google Scholar]
- Sharma GP, Prasad S. Effective moisture diffusivity of garlic cloves undergoing microwave-convective drying. J Food Eng. 2004;65(4):609–617. doi: 10.1016/j.jfoodeng.2004.02.027. [DOI] [Google Scholar]
- Simal S, Garau MC, Femenia A, Rosselló C. A diffusional model with a moisture-dependent diffusion coefficient. Dry Technol. 2006;24(11):1365–1372. doi: 10.1080/07373930600952404. [DOI] [Google Scholar]
- Tripathy PP. Investigation into solar drying of potato: effect of sample geometry on drying kinetics and CO2 emissions mitigation. J Food Sci Technol. 2015;52(3):1383–1393. doi: 10.1007/s13197-013-1170-0. [DOI] [PMC free article] [PubMed] [Google Scholar]
- Tripathy PP, Kumar S. A methodology for determination of temperature dependent mass transfer coefficients from drying kinetics: application to solar drying. J Food Eng. 2009;90(2):212–218. doi: 10.1016/j.jfoodeng.2008.06.025. [DOI] [Google Scholar]
- Valentas KJ, Rotstein E, Singh RP. Handbook of food engineering practice. New York: CRC Press; 1997. [Google Scholar]
- Vallespir F, Crescenzo L, Rodríguez Ó, Marra F, Simal S. Intensification of low-temperature drying of mushroom by means of power ultrasound: effect on drying kinetics and quality parameters. Food Bioprocess Technol. 2019;12(5):839–851. doi: 10.1007/s11947-019-02263-5. [DOI] [Google Scholar]
- Watson EB, Wanser KH, Farley KA. Anisotropic diffusion in a finite cylinder, with geochemical applications. Geochim Cosmochim Acta. 2010;74(2):614–633. doi: 10.1016/j.gca.2009.10.013. [DOI] [Google Scholar]
- Younis M, Abdelkarim D, Zein El-Abdein A. Kinetics and mathematical modeling of infrared thin-layer drying of garlic slices. J Saudi Soc Agric Sci. 2018;25:332–338. doi: 10.1016/j.sjbs.2017.06.011. [DOI] [PMC free article] [PubMed] [Google Scholar]