Abstract
The European Commission asked EFSA to undertake a ‘repair action’ of the FOCUS surface water report after the EFSA Pesticide Steering Network had been consulted. The main request was to introduce into all FOCUS surface water scenarios (both run‐off and drainage) a 20‐year assessment period instead of the current 12‐ or 16‐month assessment period. Because of the 20‐year assessment period, the way application dates are defined needed to be reviewed, reconsidering the functionality of the pesticide application timing currently used. Guidance on how substance parameters should be handled when correlated with soil properties has been provided. Foliar wash‐off calculated in MACRO and Pesticide Root Zone Model was aligned and the appropriateness of including rotational crop aspects was discussed. Processing time and how to use the results of the exposure assessment were considered.
Keywords: environmental, exposure, models, pesticides, surface water
Short abstract
This publication is linked to the following EFSA Supporting Publications article: http://onlinelibrary.wiley.com/doi/10.2903/sp.efsa.2020.EN-1850/full
Summary
The European Commission asked European Union Safety Authority (EFSA) in 2016 to undertake this task after a consultation of Member States. The European Commission requested EFSA to address the following Terms of Reference:
Introduce into all FOCUS surface water (sw) scenarios (both run‐off and drainage) a 20‐year assessment period instead of the current 12 or 16 months assessment period.
Because of the 20‐year assessment period, the way application dates are defined needs to be reviewed, i.e. pesticide application timing (PAT) calculator functionality used/modified or not and, if used, which year to run PAT within the context of dates for 20 years, is a critical task to be investigated and approach agreed.
Add substance parameter input selection guidance when these parameters are correlated with the soil properties, e.g. pH.
Foliar wash‐off coefficient used in MACRO and Pesticide Root Zone Model (PRZM) and the equation used to describe foliar wash‐off to be reviewed. The description of wash‐off in FOCUS SW was questioned in the EFSA Opinion on scenarios for PECsoil (EFSA Journal 2012;10(2):2562).
Repair should ensure that processing times of revised weather scenario definitions are not excessive and results are still easily produced and reproduced as part of regulatory assessments.
Repair should consider how the results are to be presented and used in risk assessment.
Repair to consider how rotational crops are to be dealt with in risk assessment.
In the FOCUS run‐off scenarios, complete 20‐year MARS50 weather data have already been implemented by the FOCUS working group (WG) in 2001. The FOCUS Surface Water Repair WG considers these data still appropriate for the multiyear assessment approach without changes. However, a warming‐up period of 6 years has been added also for the run‐off scenarios to account for the potential accumulation in soil and sediment of more persistent substances.
For the FOCUS drainage scenarios, the FOCUS Surface Water Repair WG used the original MARS50 weather data originally considered by the FOCUS WG as far as possible. It is noted that for the two scenarios D1‐Lanna and D6‐Thiva only 14‐year and 18‐year periods, respectively, have been available. To extend the data sets for these two scenarios to cover the entire 20‐year assessment period, the FOCUS Surface Water Repair WG added weather data from the new MARS25 database on the basis of their locations (co‐ordinates) specified by the FOCUS WG. For pragmatic reasons, the FOCUS Surface Water Repair WG simply added the 6 subsequent years (1995–2000) for D1‐Lanna and 2 years (1995–1996) for D6‐Thiva. The FOCUS WG used a 6‐year warming‐up period from 1988 to 1993 for all drainage scenarios without further justification of the selection of years in this period. For the new 20‐year assessment period, a more consistent but simple method to select the 6 warming‐up years for the drainage scenarios was employed.
The FOCUS Surface Water Repair WG concluded that, to avoid inconsistencies with the water balance, irrigation events should not be scheduled with an external model such as ISAREG, but should be calculated within PRZM and MACRO based on internal water balances. Consequently, the FOCUS Surface Water Repair WG made use of the internal irrigation routines in PRZM and adapted them when necessary. Finally, MACRO has been adapted to calculate irrigation in an analogous way to PRZM.
To align crop interception with approaches used in other exposure models (e.g. FOCUS groundwater and soil exposure), the FOCUS Surface Water Repair WG concluded that MACRO and PRZM should no longer internally calculate crop interception. Instead, in the repaired FOCUS sw scenarios predefined default FOCUS crop interception values are used based on the crop BBCH stage. BBCH stands for Biologische Bundesanstalt, Bundessortenamt und CHemische Industrie. This procedure ensures that the same crop interception is used in MACRO and PRZM as well as in all other exposure models. The FOCUS Surface Water Repair WG considers the default crop interception values used in the FOCUS groundwater scenarios and FOCUS surface water Step 2 (for olives only) to be the most appropriate.
The FOCUS Surface Water Repair WG considers the assumption of a cumulative drift probability of the 90th percentile to determine the PECmax no longer justified, as spray drift deposition events should be considered as separate events if they do not lead to accumulation in the simulated watercourse. Very often the mass input to the watercourse due to spray drift has already flowed out before the next spray drift deposition event. In contrast, in ponds, the hydraulic residence time is in the order of at least 50 days and often more, so that spray drift depositions may indeed accumulate and using the cumulative drift deposition is justified. Overall, there is no straightforward solution for a drift percentile approach, which is valid for all types of water bodies (ditch, stream and pond) as well as all environmental compartments (water and sediment). As a pragmatic approach, the FOCUS Surface Water Repair WG changed the current procedure for multiple applications, setting the drift deposition for the last application in an application season to the 90th percentile, keeping the reduced percentile for all other applications. In this way, care is taken that there is at least one 90th percentile drift event in an application season without overestimating the entire load to the waterbody. This approach also makes the usual ‘single application’ run for multiple applications obsolete.
The exposure to metabolites has not been changed compared with the current situation, except for the factor accounting for metabolites formed in the water of the upstream catchment of FOCUS streams. In the repaired FOCUS scenarios, the correction factor for metabolite formation in the upstream catchment is now based on the average water temperature and most conservative residence time of the 20‐year evaluation period for each FOCUS sw scenario. To avoid being overly conservative, it has been checked that the most conservative hydraulic residence time used to calculate the correction factor was not an extreme case (i.e. the last‐but‐one most conservative residence time was used).
Because of the new 20‐year assessment period, the selection procedure for individual application dates was reconsidered by the FOCUS Surface Water Repair WG investigating different PAT options. The FOCUS Surface Water Repair WG kept the initial 2‐mm rainfall criterion (i.e. maximum 2 mm of rainfall on 5 days consecutively around application) introduced with the current FOCUS PAT, as this is considered to mirror good agricultural practice. However, the second initial rainfall criterion (i.e. at least 10 mm of rainfall occurring within the next 10 days) is no longer considered defensible, as different rainfall pattern in the 20 years compensate for each other. Next, the FOCUS Surface Water Repair WG tested shorter application windows as currently used in FOCUS sw. As a result, the FOCUS Surface Water Repair WG considers an application window of 7 days (for a single application) to be a reasonable compromise: (i) allowing a limited number of applications on less favourable days, (ii) excluding extreme run‐off/drainage events, (iii) reducing the day‐to‐day variability in PECs with respect to application timing and (iv) respecting the intended Good Agricultural Practices (GAP) (BBCH stage) as far as possible. So, for a single application, the application window in the revised FOCUS sw scenarios is set to ± 3 days around the intended application date (the so‐called extension period in the revised PAT). For multiple applications, the application window now covers the period from 3 days before the first intended application to 3 days after the last intended application.
In cases in which substance properties depend on soil pH, the FOCUS Surface Water Repair WG recommends performing calculations for two contrasting soil pH values in line with recommendations given for the FOCUS groundwater scenarios. If there is a significant change in substance properties within a soil pH range from 5.1 to 8.0 (i.e. the 10th and 90th percentile, respectively, for arable and permanent crops in the EU), it is recommended to perform two individual calculations assuming substance properties representative for soil pH values of 5.1 and 8.0 and to report the results from both runs. In contrast with soil pH, the clay content (soil texture) is considered part of the scenario definition and clearly linked to scenario vulnerability with respect to losses of pesticides by drainage and run‐off/erosion. So, the FOCUS Surface Water Repair WG does not see the need to use any other clay content to calculate representative substance properties other than the clay contents of the soil horizons of the scenario.
The FOCUS Surface Water Repair WG thoroughly investigated the foliar wash‐off routines in MACRO and PRZM for varying half‐lives on the crop canopy and wash‐off coefficients. It was concluded that wash‐off simulated in the two models is generally similar, except for applications on days with rainfall. For these specific days, the FOCUS Surface Water Repair WG adapted the wash‐off calculation routines in PRZM to bring wash‐off more in line with MACRO, where a rainfall of less than 18 mm on the day of application does not contribute to wash‐off.
The FOCUS Surface Water Repair WG notes that the processing time of PRZM will hardly change as it already runs for 20 years with the current FOCUS scenarios (note that in the revised scenarios, 6 warming‐up years have been added). MACRO is expected to have similar run‐times compared with the FOCUS groundwater scenario Châteaudun, which also runs for a 20‐year assessment period (+6 warming‐up years). TOXic substances in Surface WAters (TOXSWA) was improved by enabling the TOXSWA shell to distribute the runs of one project between available processors of the computer, so considerably shortening the project run‐time.
The FOCUS Surface Water Repair WG changed the procedure for PAT, which reduces the variability of input parameter selections related to application timing and therefore increases user confidence in the simulated surface water concentrations. The new approach is based on a close link between the BBCH stage (which is well defined for each application according to the GAP) and the calendar date at which this BBCH stage is reached at each scenario location. In the new Surface WAter Scenarios Help (SWASH) software, this approach is used to determine the so‐called intended application dates. For a single application, the intended application date is always set at the first calendar date that is specified for a given BBCH stage. For multiple applications, intended application dates are determined according to the BBCH period, the number of applications and a standard interval between applications. The actual application dates, which may vary in each of the 20 assessment years according to rainfall, are finally determined by the revised PAT on the basis of the intended application dates (applying an extension period of ± 3 days) relaxing the rules if necessary.
The FOCUS Surface Water Repair WG excluded drift values for ‘vines early’ in the exposure assessment as these drift values are based on application techniques, which are not standard farming practice for application in early vines. Furthermore, the FOCUS Surface Water Repair WG adapted the SWASH software using the more conservative drift data for ‘pome/stone fruits, early’ from BBCH 09 to 69 and the less conservative drift data ‘pome/stone fruits, late’ from BBCH 71 to 95, switching back to ‘pome/stone fruits, early’ at BBCH 97 and onwards.
In the new 20‐year assessment approach, the selection of a temporal percentile may have a strong impact on the exposure end‐point (i.e. the annual maximum PEC in water or sediment), particularly if the exposure assessment is driven by drainage or run‐off. In this respect, the FOCUS Surface Water Repair WG considers the 50th temporal percentile the lower limit to be selected and the 90th temporal percentile the upper limit. The lower temporal percentile, which is in line with the targeted 50th temporal percentile hydrological year selected by the FOCUS WG in 2001, reveals PECs that are more related to average and lower PECs in the current FOCUS approach, whereas the higher percentile covers the current FOCUS approach in most cases. It is self‐evident that any percentile in between these two values could be selected. The FOCUS Surface Water Repair WG wants to make risk managers (RM) aware that a temporal percentile close to the 90th (rather than the 50th percentile) for the run‐off/drainage entries would correspond better to the original intentions of the FOCUS working group of 1996–2001 of aiming at an overall 90th temporal percentile. At the same time, the FOCUS Surface Water Repair WG wants to mention that the spatial percentile of the FOCUS surface water scenarios was difficult to quantify, but it has not changed between the current and the repaired scenarios. Risk managers should also be aware that a fixed definition of a simple temporal percentile may not be suitable to cover the wide range of possible effect situations. So, a temporal percentile may also be selected by integrating effects modelling and overall exposure pattern.
The current FOCUS sw Step 2 does not necessarily cover the new FOCUS sw Step 3 approach. The FOCUS Surface Water Repair WG therefore recommends reconsidering the parameterisation at FOCUS sw Steps 1 and 2, particularly with respect to default entries into the waterbody by drainage/run‐off. This may also include reconsideration of the period from (last) application to drainage/run‐off (currently 4 days in FOCUS sw Step 2). The revision of FOCUS sw Steps 1 and 2 should also cover the new proposed drift percentile setting for multiple applications.
In the repaired FOCUS scenarios, sediment exposure is now expressed in total content on organic matter (OM) basis (μg/kg OM), total content on dry sediment mass basis (μg/kg dry sediment mass) and pore water basis (μg/L). Moreover, concentrations are averaged over the top 1 and 5 cm for the risk assessment for benthic invertebrates or plants, respectively, as was suggested by the EFSA Opinion on effect assessment on sediment organisms (EFSA PPR Panel, 2015). The FOCUS Surface Water Repair WG demonstrated that the current, as well as repaired, FOCUS surface water scenarios do not result in conservative estimates of the PEC in sediment, due to the relatively low organic carbon content of 5% in the sediment. It also notes that the PECsed values do not represent ‘best‐case’ exposure values, as the concentrations in the overlying water layer are intended to represent ‘realistic worst‐case’ concentrations and these water concentrations form one of the main driving factors for the PECsed. The FOCUS Surface Water Repair WG therefore recommends the development of a second set of scenarios to predict ‘realistic worst‐case’ exposures in sediment to promote a scientifically sound risk assessment for benthic organisms and rooted water plants.
The FOCUS Surface Water Repair WG notes that the upstream catchment concept implemented in the FOCUS surface water scenarios for streams and ditches already account for the fact that not the whole catchment area is treated with the simulated pesticide in any given year. This approach is equivalent to assuming that only a certain fraction of the catchment is covered with the simulated crop during the assessment year (i.e. 33% for ditches and 20% for streams), and so not the whole area of this crop is treated. In other words, effects of crop rotations are already indirectly included in the current FOCUS surface water modelling by ‘space for time’ substitution.
The parameterisation of the run‐off curve numbers (RCN) for perennial tall crops (vines, pome/stone fruit, citrus, olives and hops) in the FOCUS run‐off scenarios (FOCUS, 2001) assumes a fairly good vegetation cover within and between the crop rows. Based on newly available data, it appears no longer defensible to simulate surface run‐off for these crops assuming a complete and well‐established vegetation cover as currently performed in FOCUS sw. The RCNs for these crops have therefore been adapted, leading to a more realistic representation of surface run‐off in tall permanent crops.
The FOCUS Surface Water Repair WG decided to replace the current procedure to calculate subsurface drainage water entering the waterbodies of the run‐off scenarios by a new and more realistic reservoir approach with direct inflow of the daily fluxes.
In the current FOCUS surface water scenarios, a monthly average water temperature is used in the scenario calculations, equal to the monthly average air temperature of the location of the meteorological station belonging to each of the 10 scenarios. In the repaired FOCUS surface water scenarios, this approach was improved by using a moving 3‐day average air temperature (of the day itself and the 2 previous days) to represent the daily water and sediment temperature in the scenario calculations.
Overall, it can be concluded that the new 20‐year assessment delivers annual maximum PECs that are in the range of the current FOCUS approach. However, in contrast with the current single‐year approach, the new assessment is much more robust with significantly less variability in PECs (for a certain temporal percentile) in relation to the application timing.
1. Introduction
1.1. Background and Terms of Reference as provided by the requestor
The European Commission (EC) (DG SANCO1) sent by letter from Ladislav Miko to Berndhard Url, EFSA, dated 20 October 2016, a request for undertaking this task. Requests from Member States (MS) that are already being considered through FOCUS2 version control and by the European Crop Protection Association (ECPA) are considered outside the scope of FOCUS surface water (sw) ‘repair action’. These requests are listed under Annex 3 of the EC letter to EFSA for transparency.
The need for a ‘repair action’ of the FOCUS surface water scenarios has been identified by EFSA. Following a commenting round with MS and discussion at the Pesticide Steering Network (PSN) meeting in November 2014, EFSA prepared the draft Terms of Reference (ToRs) and launched a second consultation. The draft was reviewed according to the provided comments and further discussed at the PSN meeting of February 2015.
The repair action is limited to specific items suitable for a short‐term repair action. Additional proposals received from MS have been included in Annex 2 of the letter from the EC and will be retained by EFSA for a possible future revision of the FOCUS surface water scenarios. Due to the nature and complexity of these proposals they have not been considered in the proposed FOCUS sw ‘repair action’.
The purpose of the ‘FOCUS Surface Water Repair Action’ is to prepare a scientific/technical report for updating the FOCUS surface water report and to update the supporting software tools, Surface WAter Scenarios Help (SWASH)3 including the TOXSWA,4 MACRO5 and PRZM6 components.
As a follow‐up, a comprehensive revision of the FOCUS surface water scenarios might be developed in the future, including revised drift deposition numbers, exposure mapping and landscape‐based approaches. Future developments would depend on the scientific needs identified by the PPR Panel, and would consider, in a consultation with the EU Commission and MS, the actual needs, priorities and the protection goals established by risk managers (RMs).
The scientific developments in this area are intended to support the evaluation of substances under Regulation (EC) No 1107/2009 concerning the placing of plant protection products on the market and repealing Council Directives 79/117/EEC and 91/414/EEC.7
1.2. Terms of Reference from the European Commission (DG SANCO)
Following the request from the EC (DG SANCO) the following Terms of Reference have been addressed:
Introduce into all FOCUS surface water scenarios (both run‐off and drainage) a 20‐year assessment period instead of the current 12‐ or 16‐month assessment period.
Because of the 20‐year assessment period, the way application dates are defined needs to be reviewed, i.e. pesticide application timing (PAT) calculator functionality used/modified or not and if used which year to run PAT within the context of dates for 20 years, is a critical task to be investigated and approach agreed.
Add substance parameter input selection guidance when these parameters are correlated with the soil properties, e.g. pH.
Foliar wash‐off coefficient used in MACRO and PRZM and the equation used to describe foliar wash‐off to be reviewed. The description of wash‐off in FOCUS SW was questioned in EFSA Opinion on scenarios for PECsoil (EFSA Journal 2012;10(2):2562).
Repair should ensure that processing times of revised weather scenario definitions are not excessive and results are still easily produced and reproduced as part of regulatory assessments.
Repair should consider how the results are to be presented and used in risk assessment.
Repair to consider how rotational crops are to be dealt with in risk assessment.
After increasing the assessment period to 20 years and thorough checking of the new procedure with example calculations, EFSA will, together with the FOCUS Surface Water Repair WG, produce a set of alternatives to be presented to RMs and the decision from the RMs will be implemented.
From 24 September to 5 November 2018, a stakeholder web consultation was organised on the draft scientific report. The FOCUS Surface Water Repair WG received 193 comments from MS and other stakeholders. All comments received were carefully reconsidered by the FOCUS Surface Water Repair WG for the final scientific report. The comments and the reply of the WG are published on the EFSA web in a stakeholder report.
2. Model framework
The registration procedure for pesticides according to EU Council Directive 91/414/EEC8 and its successor, EU Regulation (EC) No 1107/20099 includes the possibility of using models for the calculation of Predicted Environmental Concentrations in surface water (PECsw). Ten FOCUS (FOrum for the Co‐ordination of pesticide fate models and their USe) surface water scenarios form the third step in a stepwise approach to calculate the PECsw in ‘realistic worst‐case’ scenarios. The scenarios were developed from 1996 to 2001 and were intended to cover a realistic range of surface water bodies, topography, climate, crops, soil types and related agronomic practices in the major agricultural areas of the European Union, consisting of 15 MSs by that time. The 15 MSs were Belgium, France, Germany, Italy, Luxembourg, the Netherlands, Denmark, Ireland, United Kingdom, Greece, Spain, Portugal, Austria, Finland and Sweden and covered almost the whole of western Europe. In combination with appropriate aquatic ecotoxicological endpoints, model calculated exposure concentrations are used to assess the risk of pesticides in the European Union (FOCUS, 2001; EFSA PPR Panel, 2013b). Active substances in plant protection products can only be approved in the EU according to Regulation (EC) No 1107/2009 if they have a safe use in large areas that can be considered to be one FOCUS scenario. To pass a scenario, all the water bodies defined as being associated with the scenario need to have low risk demonstrated. Four of these 10 scenarios evaluate the importance of pesticide entries into surface water by run‐off and erosion together with spray drift. The other six evaluate the importance of leaching through drainage and spray drift. The four run‐off scenarios make use of the PRZM model (Carsel et al., 2003; Suárez, 2005), which simulates pesticide run‐off from agricultural fields, while the six drainage scenarios make use of the MACRO model (Larsbo et al., 2005), which simulates pesticide leaching through the soil matrix and macropores towards edge‐of‐field surface water bodies. All scenarios make use of the TOXSWA model, which simulates pesticide behaviour in edge‐of‐field ponds, ditches and streams (Adriaanse, 1997; Adriaanse et al., 2013, 2017; Beltman et al., 2018).
To limit the run‐time needed to simulate pesticide behaviour in the FOCUS surface water scenarios, PEC values were calculated for a single ‘representative’ year. As at least some of the soil scenarios were considered to represent a 90th+ percentile worst case, the single climate year was selected to represent a hydrological year with a 50th to 70th percentile worst‐case probability of occurrence. In this way, and as stated in the conclusions of FOCUS (2001) ‘the highest PECsw estimates of the 10 scenarios are likely to represent at least a 90th percentile worst case for surface water exposures resulting from agricultural pesticide use within the European Union’. This 90th percentile worst case (i.e. 90th percentile of occurrence in time and space of the PECsw) can be considered as the operational definition of the term ‘realistic worst case’ mentioned in the ‘uniform principles’.10
Later, it has been repeatedly demonstrated (e.g. Adriaanse et al., 2007; Klein, 2007; Bach et al., 2017a,b) that the PECs of the single simulated year do not necessarily represent a 90th percentile worst‐case PECsw value. On the one hand, in a single‐year simulation, the PEC depends too much on the time period between the day of application and the first rainfall event causing run‐off or macropore flow to drains. On the other hand, the selected weather years pose problems: for example, for the run‐off scenarios, no run‐off events occur in the first 2–4 weeks after application for seven of the 12 combinations of application season (spring, summer, autumn) and location (R1–R4).
Moreover, the concept of combining a 50th to 70th percentile hydrological year with a 90th percentile spray drift deposition to come to an overall 90th percentile of occurrence exposure concentration is not valid for waterbodies where the mass originating from the entry routes run‐off/drainage and spray drift do not accumulate, but can be seen as independent peak concentrations.
Therefore, one of the main tasks of the EFSA working group was to improve the assessment of the ‘realistic worst‐case’ exposure by extending the assessment period to 20 years, while maintaining the FOCUS scenario properties such as locations, crops, soil types and water bodies. The PRZM model already ran for 20 years (1975–1994) but only created a 1‐year output file for TOXSWA, while the MACRO model ran for 16 months (plus a warming‐up period of 6 years), although the meteorological data are available for 20 years for four of the six drainage scenarios. Therefore, TOXSWA simulated a period of 12 months for run‐off scenarios and 16 months for drainage scenarios.
3. Addressing the Terms of Reference from the European Commission
3.1. Introduction of a 20‐year assessment period into all FOCUS surface water scenarios
3.1.1. Weather data
The main task of the FOCUS Surface Water Repair WG was to replace the single‐year assessment period currently in the FOCUS sw scenarios with a 20‐year assessment period. It was not within the remit of this working group to re‐assess the vulnerability or validity of the FOCUS sw scenarios with respect to weather, soil, crop conditions or spray drift deposition considered by FOCUS (2001). This may be performed in the future (please also refer to recommendations).
Weather data used by FOCUS (2001) for the FOCUS sw scenarios were derived from the Joint Research Centre (JRC) in Ispra, Italy, holding long‐term weather data, compiled as part of the Monitoring Agriculture by Remote Sensing (MARS) project (Vossen and Meyer‐Roux, 1995). At the time of FOCUS (2001), the MARS meteorological database contained daily meteorological data spatially interpolated on 50 × 50 km grid cells (MARS50). Using the representative field sites identified for each scenario, the most relevant MARS50 grid cell was identified by FOCUS (2001) and the corresponding long‐term weather data set selected for use (Table 1). Note that, in the meantime, the MARS50 meteorological database hosted by JRC has been replaced by the MARS25 database, which has 25 × 25 km grid cells.
Table 1.
Weather data sets used by FOCUS (2001) to characterise each scenario
| Scenario | FOCUS sw scenario | Latitude | Longitude | MARS50 grid cell no. | Time period available |
|---|---|---|---|---|---|
| D1 | Lanna (SE) | 58°20′N | 13°03′E | 75062 | 1980–1993 |
| D2 | Brimstone (UK) | 51°39′N | 01°38′W | 61043 | 1975–1994 |
| D3 | Vredepeel (NL) | 51°32′N | 05°52′E | 59053 | 1975–1994 |
| D4 | Skousbo (DK) | 55°37′N | 12°05′E | 69061 | 1975–1994 |
| D5 | La Jaillière (FR) | 47°27′N | 00°58′E | 51045 | 1975–1994 |
| D6 | Thiva (GR) | 38°23′N | 23°06′E | 32082 | 1977–1994 |
| R1 | Weiherbach (DE) | 49°00′N | 08°40′E | 54057 | 1975–1994 |
| R2 | Porto (PT) | 41°11′N | 11°24′W(a) | 40028 | 1975–1994 |
| R3 | Bologna (IT) | 44°30′N | 11°24′E | 44061 | 1975–1994 |
| R4 | Roujan (FR) | 43°30′N | 03°19′E | 42048 | 1975–1994 |
This entry seems to be a copy/paste error from the R3‐Bologna scenario in the original FOCUS (2001) report. FOCUS (2001) states ‘field site chosen to represent the R2‐Porto scenario is Valadares, Porto (P)’. Based on this a suitable longitude of the R2 scenario would be 8°38′W (or 8.64°W) which is in the area of Valadares south of Porto.
Based on local data, precipitation data for D1‐Lanna and D4‐Skousbo derived from the MARS50 database appeared to be too low. The MARS‐derived precipitation data for these two scenarios were therefore scaled up by FOCUS (2001) to match the average annual precipitation observed for each site by local meteorological weather stations. The scaling factors used by FOCUS (2001) were 1.431 for D1‐Lanna and 1.246 for D4‐Skousbo.
For the FOCUS run‐off scenarios, complete 20‐year MARS50 weather data have already been implemented in PRZM by FOCUS (2001). The FOCUS Surface Water Repair WG considers these data still appropriate for the multiyear assessment without any changes. However, the FOCUS Surface Water Repair WG proposes to add a warming‐up period of 6 years to account for potential accumulation in soil and sediment for more persistent substances.
For the FOCUS drainage scenarios, the FOCUS Surface Water Repair WG also proposes to stay as close as possible to the original MARS50 weather data used in FOCUS (2001). It is noted that only a 16‐month assessment period has been implemented in MACRO. However, the full MARS50 weather data corrected for precipitation by FOCUS (2001) for D1‐Lanna and D4‐Skousbo as outlined above are still available. In line with the run‐off scenarios, these data are considered most suitable for the 20‐year assessment period. A comparison of these data with the 16‐month period actually implemented in MACRO revealed that there have been additional minor corrections applied by FOCUS (2001) which are not fully described in the FOCUS report (FOCUS, 2001):
In D1‐Lanna, precipitation in the 6 years selected for the warming‐up period (1988–1993) and in the second year of the 16‐month assessment period (1983) has been scaled further by a factor of 1.077 and 1.059, respectively. In contrast, precipitation in the first year of the 16‐month assessment period (1982) has not been scaled further.
In D4‐Skousbo, precipitation in the 6 years selected for the warming‐up period (1988–1993) as well as in both years of the 16‐month assessment period (1985 and 1986) has been scaled further by a factor of 1.006.
The FOCUS Surface Water Repair WG could retrace that for D1‐Lanna, precipitation should indeed be corrected by a factor of approximately 1.07 to account for rain/snow interception measured by standard rain gauges in Sweden underestimating the catch by approximately 7%. Therefore, the local measured values of the Swedish Meteorological and Hydrological Institute were assumed to be 7% too low. The FOCUS Surface Water Repair WG could not figure out why precipitation correction was inconsistently applied to the warming‐up period and the second year of the 16‐month assessment period in FOCUS (2001). The FOCUS Surface Water Repair WG proposes to consistently apply a precipitation scaling factor of 1.077 to the entire data set of the scenario D1‐Lanna. The FOCUS Surface Water Repair WG could not retrace the need for additional precipitation scaling for D4‐Skousbo. As the scaling factor of 1.006 is insignificant, the FOCUS Surface Water Repair WG proposes to ignore this factor in further data processing.
The FOCUS Surface Water Repair WG notes that for D1‐Lanna and D6‐Thiva, only 14‐year and 18‐year periods, respectively, have been available in the MARS50 data set and considered in FOCUS (2001). To extend these data sets to cover the entire 20‐year assessment periods, the FOCUS Surface Water Repair WG added weather data from the new MARS25 database on the basis of their locations (co‐ordinates) as given in FOCUS (2001). For pragmatic reasons, the FOCUS Surface Water Repair WG simply added the 6 subsequent years (1995–2000) for D1‐Lanna and 2 years (1995–1996) for D6‐Thiva. Note that data for the year 1994 are not available at D1‐Lanna, neither in the processed MARS50 data used by FOCUS (2001), nor in the new MARS25 database. For this reason, the 6 years added data (1995–2000) actually start with 1994 (leap years have been corrected as outlined below). The FOCUS Surface Water Repair WG considers the new MARS25 database the best data currently available and does not see the need to process them further.
Finally, the MARS50 weather data (drainage scenarios) available to the FOCUS Surface Water Repair WG have been processed further as follows (also refer to Table 2):
The precipitation of the entire available 14‐year period in D1‐Lanna was multiplied with a factor of 1.077.
The period from 1 January 1995 to 31 December 2000 from MARS25 (MARS25 grid cell number 135117) was added to D1‐Lanna without any changes, starting with 1 January 1994. To account for leap years, 29 February was deleted in 1995 and 1999; in 1996, 29 February was added with average properties from the day before and the day after. There are no extreme weather events on this day.
The period from 1 January 1995 to 31 December 1996 from MARS 25 (MARS25 grid cell number 50155) was added to D6‐Thiva without any changes, starting with 1 January 1995.
Total global radiation expressed in kJ/(m2.day) in the MARS25 database was converted into solar radiation expressed in W/m2 applying a factor of 0.0116 (with 1 W/m2 = 0.024 kWh/(m2.day) and 1 kWh/(m2.day) = 3,600 kJ/(m2.day)).
Table 2.
Changes and amendments for the available FOCUS (2001) weather data
| Scenario | Selected weather data set | MARS50 grid cell no. | MARS25 grid cell no. | Time period available (MARS50) | Time period added (MARS25) | Additional processing |
|---|---|---|---|---|---|---|
| D1 | Lanna (SE) | 75062 | 135117 | 1980–1993 | 1995–2000(a) | Precipitation from 1980 to 1993 (MARS50) scaled by a factor of 1.077 |
| D2 | Brimstone (UK) | 61043 | 107077 | 1975–1994 | None | None |
| D3 | Vredepeel (NL) | 59053 | 104098 | 1975–1994 | None | None |
| D4 | Skousbo (DK) | 69061 | 122115 | 1975–1994 | None | None |
| D5 | La Jaillière (FR) | 51045 | 88082 | 1975–1994 | None | None |
| D6 | Thiva (GR) | 32082 | 50155 | 1977–1994 | 1995–1996 | None |
| R1 | Weiherbach (DE) | 54057 | 93105 | 1975–1994 | None | None |
| R2 | Porto (PT) | 40028 | 66047 | 1975–1994 | None | None |
| R3 | Bologna (IT) | 44061 | 73114 | 1975–1994 | None | None |
| R4 | Roujan (FR) | 42048 | 69088 | 1975–1994 | None | None |
Starting with 1994 (leap years corrected as stated in the text).
The FOCUS Surface Water Repair WG notes that for D4‐Skousbo, the precipitation for the period from 1 January 1980 to 30 April 1980 is given twice in the available MARS50 data set with the second data set having slightly higher precipitation for unknown reasons. For conservative reasons, the FOCUS Surface Water Repair WG proposes to delete the first data set and to keep the second one (with marginally higher precipitation).
Appendices B and C give a graphical representation of daily rainfall, daily drainage and run‐off events, water depth, flow velocity and hydraulic residence time of the waterbodies, as well as a tabulated overview on yearly precipitation, drainage and run‐off for all 10 FOCUS surface water scenarios covering the entire 20‐year assessment period (plus the 6‐year warming‐up period).
3.1.2. Warming‐up period
The warming‐up period is considered particularly relevant for the formation of a ‘concentration plateau’ in the sediment before the 20‐year exposure assessment period starts. So, it is most relevant for the PECsed. Pesticide entries into the sediment originate from pesticide mass in run‐off water and/or sorbed to eroded soil, so these two types of entries were considered while selecting ‘average’ years for the warming‐up period of run‐off scenarios. In line with what was performed for the drainage scenarios in FOCUS (2001), the FOCUS Surface Water Repair WG defined a warming‐up period of 6 years. As demonstrated in Appendix A, this warming‐up period is sufficient to account for potential accumulation in the sediment.
For the run‐off scenarios, the warming‐up period should represent a series of six relatively ‘average’ years, without extreme run‐off‐causing rainfall events and extremely dry periods. Finally, they were selected on the basis of the number of run‐off and soil erosion events occurring in the application period from March to September (also refer to Appendix A). So, for each of the scenarios, a 6‐year warming‐up period was defined, with the data added before the 20 years of data representing the exposure assessment period. The FOCUS Surface Water Repair WG selected the 6 years that have a number of run‐off events during the March–September period that is equal to or greater than the average number for the 20‐year period. The selected years are listed in Table 3.
Table 3.
Selected warming‐up years for the FOCUS surface water run‐off scenarios (R1–R4)
| Year in simulation | R1‐Weiherbach | R2‐Porto | R3‐Bologna | R4‐Roujan |
|---|---|---|---|---|
| 1969 | 1983 | 1978 | 1994 | 1976(a) |
| 1970 | 1982 | 1987 | 1990 | 1990 |
| 1971 | 1985 | 1991 | 1984(a) | 1991 |
| 1972 (leap year) | 1976 | 1993a | 1992 | 1988 |
| 1973 | 1980(a) | 1977 | 1979 | 1992(a) |
| 1974 | 1981 | 1980(a) | 1977 | 1987 |
29 February taken out.
29 February added with average properties from the day before and the day after.
The selection of warming‐up periods is not considered such a critical issue for the drainage scenarios, as only relatively mobile compounds with low to moderate Koc values are expected to leach at ecologically significant concentrations and these compounds should not accumulate in sediment to the same extent. In FOCUS (2001), a 6‐year period from 1988 to 1993 was used for all drainage scenarios without further justification for the selection of the years comprising this period. For the new 20‐year assessment period, a more consistent but simple method to select the warming‐up years for the drainage scenarios was employed. The 6 years with the annual precipitation totals closest to the median value of the entire 20‐year assessment period were selected. These years were ordered according to a scheme in which years with higher and lower precipitation totals than the median alternate. Exceptions to this ordering occurred occasionally to maintain an equivalence of leap years in the real weather data series and the fake years in the warming‐up period. Tables 4 and 5 show the warm‐up years selected for the six scenarios, the annual precipitation totals for these years and the years they represent in the warming‐up period of the simulations. Table 6 shows that the annual average precipitation totals and temperatures for the six scenarios for the full 26‐year periods and the 20‐year assessment periods are nearly identical.
Table 4.
Warming‐up years for the FOCUS surface water drainage scenarios D2–D5
| Year in simulation | D2‐Brimstone | D3‐Vredepeel | D4‐Skousbo | D5‐La Jaillière | ||||
|---|---|---|---|---|---|---|---|---|
| Selected year | Prec. (mm) | Selected year | Prec. (mm) | Selected year | Prec. (mm) | Selected year | Prec. (mm) | |
| 1969 | 1994 | 614 | 1993 | 715 | 1990 | 637 | 1977 | 608 |
| 1970 | 1979 | 697 | 1979 | 787 | 1987 | 687 | 1986 | 685 |
| 1971 | 1986 | 669 | 1982 | 724 | 1982 | 661 | 1978 | 612 |
| 1972 (leap year) | 1988 | 646 | 1980 | 732 | 1984 | 659 | 1988 | 704 |
| 1973 | 1989 | 687 | 1985 | 785 | 1978 | 671 | 1993 | 684 |
| 1974 | 1987 | 642 | 1983 | 783 | 1979 | 661 | 1987 | 638 |
Table 5.
Warming‐up years for the FOCUS surface water drainage scenarios D1 and D6
| D1‐Lanna | D6‐Thiva | ||||
|---|---|---|---|---|---|
| Year in simulation | Selected year | Precipitation (mm) | Year in simulation | Selected year | Precipitation (mm) |
| 1974 | 1991 | 569 | 1971 | 1985 | 818 |
| 1975 | 1982 | 599 | 1972 (leap year) | 1996 | 544 |
| 1976 (leap year) | 1996 | 560 | 1973 | 1982 | 803 |
| 1977 | 1994 | 588 | 1974 | 1987 | 755 |
| 1978 | 1981 | 573 | 1975 | 1991 | 782 |
| 1979 | 1985 | 578 | 1976 (leap year) | 1984 | 648 |
Table 6.
Annual precipitation and annual average temperature at the six FOCUS surface water drainage scenarios (D1–D6)
| Scenario | Full 26‐year period | 20‐year assessment period | ||
|---|---|---|---|---|
| Annual precipitation (mm) | Annual average temperature (°C) | Annual precipitation (mm) | Annual average temperature (°C) | |
| D1‐Lanna | 591 | 6.3 | 595 | 6.3 |
| D2‐Brimstone | 646 | 9.7 | 642 | 9.7 |
| D3‐Vredepeel | 749 | 9.8 | 747 | 9.9 |
| D4‐Skousbo | 660 | 8.1 | 659 | 8.1 |
| D5‐La Jaillière | 652 | 11.7 | 651 | 11.8 |
| D6‐Thiva | 679 | 16.7 | 666 | 16.8 |
3.1.3. Irrigation
In the FOCUS surface water scenarios (FOCUS, 2001), irrigation was simply added to the weather files of PRZM and MACRO as rainfall. Irrigation dates were calculated externally with the model ISAREG (Teixeira and Pereira, 1992). The irrigation volume applied in one irrigation event is always 30 mm. The FOCUS Surface Water Repair WG notes that for three FOCUS run‐off scenarios with irrigated crops (R1‐Weiherbach, R3‐Bologna and R4‐Roujan), every irrigation event causes surface run‐off (Reichenberger, 2015), which is neither realistic nor agronomically efficient. For the drainage scenarios, irrigation has only been calculated for the 16‐month assessment period implemented in MACRO.
The FOCUS Surface Water Repair WG concluded that, to avoid inconsistencies with the water balances, irrigation events should not be scheduled with an external model such as ISAREG, but should be calculated internally within PRZM and MACRO as a consequence of the model specific water balances simulated by the models. This is also the case in the FOCUS groundwater scenarios (European Commission, 2014) as well as in the new soil exposure assessment (EFSA, 2017). In the repaired surface water scenarios, the internal irrigation routines in PRZM have been switched on and adapted when necessary. MACRO was modified to calculate irrigation amounts and timings in an analogous way to the PRZM irrigation routines (see Appendix D). In both MACRO and PRZM, irrigation events and pesticide application events are handled separately. It is ensured that on days with pesticide application, there is no irrigation event. In PRZM, the irrigation routine (which checks the soil moisture status, triggers irrigation events and calculates the irrigation volume) is simply not called on days with pesticide application.
As outlined more in detail in Appendix D, PRZM offers a number of options for irrigation other than adding the irrigation volume to the rainfall file (e.g. Carsel et al., 2003). The PRZM code has been updated for the purposes of this working group. Notably, irrigation options 5–7 have been modified. The following seven irrigation options are available in the new PRZM version (parameter IRTYP in the PRZM.inp file):
1 = flood irrigation
2 = furrow irrigation
3 = sprinkler irrigation over the crop canopy, with surface run‐off
4 = sprinkler irrigation under the crop canopy, with surface run‐off
5 = sprinkler irrigation over the crop canopy, without surface run‐off
6 = sprinkler irrigation under the crop canopy, without surface run‐off
7 = sprinkler irrigation under the crop canopy, user‐defined rates, without surface run‐off
Among these seven irrigation options, the FOCUS Surface Water Repair WG considers option 5 (sprinkler irrigation over the crop canopy, without surface run‐off) the most appropriate for annual crops and option 6 (sprinkler irrigation under the crop canopy, without surface run‐off) the most suitable for tall permanent crops (pome/stone fruits, vines, citrus, olives and hops). This proposal for different irrigation settings in different crop types is in line with EFSA (2017). Following sensitivity analyses of all irrigation options in the current version of PRZM (Appendix D), the revised options 5–7 indeed prevent the generation of surface run‐off during irrigation and appear to be bug free. In the new PRZM version, all annual crops have finally been linked to option 5 (sprinkler irrigation over the crop canopy, without surface run‐off), whereas pome/stone fruits and citrus (both irrigated in R4‐Roujan only) have been linked to option 6 (sprinkler irrigation under the crop canopy), irrespective of the crop stage. Note that cereals (winter and spring), oil seed rape (winter and spring), grass/alfalfa, vines, hops and olives are not irrigated in the FOCUS run‐off scenarios. In the same way as for PRZM, annual crops have been linked in MACRO to option 5 (sprinkler irrigation over the crop canopy, without surface run‐off), whereas pome/stone fruits (irrigated in D3‐Vredepeel) and citrus (irrigated in D6‐Thiva) are irrigated under the canopy.
A calibration exercise (Appendix D) with irrigation option 6 (sprinkler irrigation under the crop canopy) and the irrigated run‐off scenarios (R1‐Weiherbach, R3‐Bologna and R4‐Roujan), conducted to match cumulative irrigation volumes as calculated in FOCUS (2001), showed that setting the maximum water application rate (RATEAP) in PRZM to 0.125 cm/h (= 30 mm/day), the leaching factor (FLEACH, as a fraction of irrigation water depth) to zero and the fraction of available water capacity at which irrigation is applied (PCDEPL) to 0.4, leads to cumulative irrigation amounts similar to FOCUS (2001) for most crop/scenario combinations. In line with FOCUS (2001), individual irrigation events are limited to 30 mm/day in this case. Note that the ISAREG water balance simulations to establish the irrigation regimes in FOCUS (2001) used the same irrigation threshold (p = 0.4) for all crops except grass. However, the crop coefficients for evapotranspiration differed between crops (cf Appendix M in FOCUS, 2001) and were mostly different from the values of the ‘pan evaporation factor’ (PFAC) which is used to adjust upscale or downscale potential evapotranspiration in PRZM (Appendix D in FOCUS (2001)). The FOCUS Surface Water Repair WG recommends reviewing the values of PFAC used in the run‐off scenarios (e.g. by checking against the Kc factors against those recommended by FAO) and adapting them if necessary. Appendix D gives a tabulated overview on mean annual irrigation applied for each crop/location combination based on the full 20‐year assessment period.
For crops with two cropping seasons per year, the FOCUS Surface Water Repair WG notes that in FOCUS (2001), irrigation also occurs outside of the cropping season, i.e. between the 1st and the 2nd crop cycle (which is most probably a mistake). With the new irrigation routine implemented in PRZM and MACRO, this is no longer the case. The calibration exercise also revealed that in FOCUS (2001) for the scenario R4‐Roujan some crops appear to be treated differently from the usual procedure in ISAREG for unknown reasons (e.g. applied amounts of irrigation in soybeans are very low, refer to Appendix D). In the revised models, irrigation is calculated internally in the models with consistent parameter settings for all crops (see above).
3.1.4. Crop interception
In the current FOCUS sw scenarios, crop interception is internally calculated by MACRO and PRZM based on crop development subroutines. As the crop development subroutines are different in MACRO and PRZM calculated crop interceptions are different as well. It is noted that crop interception calculated by the models is usually not part of the output reports.
To align crop interception with approaches used in other exposure assessments (e.g. FOCUS groundwater and the new soil exposure), the FOCUS Surface Water Repair WG proposes not to allow MACRO and PRZM to internally calculate crop interception anymore, but rather to apply predefined default FOCUS crop interception values based on the crop BBCH stage. This procedure ensures that the same crop interception is used in MACRO and PRZM as well as in all other exposure models. The FOCUS Surface Water Repair WG considers the default crop interception values used in the FOCUS groundwater scenarios as given in EFSA (2014) and at FOCUS surface water Step 2 (for olives only, FOCUS, 2001) to be the most appropriate (Table 7). Background for this decision was that the interception values for FOCUS groundwater are also considered for the new EFSA soil scenarios and are more detailed than the FOCUS surface water Step 2 numbers (see e.g. cereals).
Table 7.
Proposed crop interception (%) at FOCUS sw STEP 3 depending on the growth stage (in alignment with EFSA, 2014)
| BBCH stage | Germination/sprouting | Leaf development | Formation of side shoots | Stem elongation rosette growth | Vegetative plant parts | Inflorescence emergence | Flowering | Development of fruit | Ripening | Senescence | |
|---|---|---|---|---|---|---|---|---|---|---|---|
| BBCH stage | 00–09 | 10–13 | 14–19 | 20–29 | 30–39 | 40–49 | 50–59 | 60–69 | 70–79 | 80–89 | 90–99 |
| Cereals, spring | 0 | 0 | 0 | 20 | 80 | 90 | 90 | 90 | 80 | 80 | (80) |
| Cereals, winter | 0 | 0 | 0 | 20 | 80 | 90 | 90 | 90 | 80 | 80 | (80) |
| Citrus(a) | 80 | 80 | 80 | – | 80 | – | 80 | 80 | 80 | 80 | 80 |
| Cotton | 0 | 30 | 30 | 60 | 60 | – | 75 | 75 | 75 | 75 | (90) |
| Field beans | 0 | 25 | 25 | 40 | – | – | 70 | 70 | 70 | 70 | (80) |
| Grass/alfalfa(a),(b) | 90 | 90 | 90 | 90 | 90 | 90 | 90 | 90 | 90 | 90 | 90 |
| Grass below the crop canopy in pome/stone fruits and vinesa | (45) | 45 | 45 | 45 | 45 | 45 | 45 | 45 | 45 | 45 | (45) |
| Hopsb | 0 | 20 | 20 | 50 | 50 | – | 60 | 60 | 70 | 70 | (70) |
| Legumesd | 0 | 35 | 35 | – | 55 | – | 85 | 85 | 85 | 85 | (85) |
| Maize | 0 | 25 | 25 | – | 50 | – | 75 | 75 | 75 | 75 | (90) |
| Oil seed rape, spring | 0 | 40 | 40 | 80 | 80 | – | 80 | 80 | 80 | 80 | (90) |
| Oil seed rape, winter | 0 | 40 | 40 | 80 | 80 | – | 80 | 80 | 80 | 80 | (90) |
| Olives(a),(g) | 70 | 70 | 70 | – | 70 | – | 70 | 70 | 70 | 70 | 70 |
| Pome/stone fruits | (50) | 60 | 60 | – | 60 | – | 60 | 60 | 65 | 65 | (#)c |
| Potatoes | 0 | 15 | 15 | 60 | 60 | – | 85 | 85 | 85 | 85 | (50) |
| Soybeans | 0 | 35 | 35 | 55 | – | 85 | 85 | 85 | 85 | 85 | (65) |
| Sugar beetse | 0 | 20 | 20 | – | 70 | 90 | (90) | (90) | (90) | (90) | (90) |
| Sunflower | 0 | 20 | 20 | – | 50 | – | 75 | 75 | 75 | 75 | (90) |
| Tobacco | 0 | 50 | 50 | 70 | – | – | 90 | 90 | 90 | 90 | (90) |
| Vegetables, bulb(h),(i) | 0 | 10 | 10 | – | – | 40 | (40) | (40) | (40) | (40) | (60) |
| Vegetables, fruitingf | 0 | 50 | 50 | 70 | – | – | 80 | 80 | 80 | 80 | (50) |
| Vegetables, leafy(h),(k) | 0 | 25 | 25 | – | – | 70 | (70) | (70) | (70) | (70) | (90) |
| Vegetables, root(h),(l) | 0 | 25 | 25 | – | – | 80 | (80) | (80) | (80) | (80) | (80) |
| Vines | (40) | 50 | 60 | – | – | – | 60 | 60 | 75 | 75 | (#)c |
Non‐existing crop stages according to the BBCH Compendium are represented by a dash (–).
Crop interception values in parentheses are not applicable at FOCUS sw Step 3 as there is no crop present in the models at this BBCH stage (e.g. after harvest); default crop interception set to zero in SWASH.
Evergreen all year round, constant crop interception not related to BBCH stage.
Considered to represent established turf all year round.
In line with revised run‐off parameterisation for tall permanent crops in PRZM; note that there is no soil cover (bare soil, no crop interception) below the crop canopy in citrus, hops and olives (also refer to Section 3.8.1 and Appendix Q).
Adopted from Olesen and Jensen (2013); according to this reference crop interception at BBCH 92 and 97 is 70% and 0%, respectively (no other BBCH stage exists in hops for BBCH 90–99).
No crop interception given in EFSA (2014) for this BBCH stage; default crop interception set to zero in SWASH.
Same as peas in FOCUS groundwater.
Same as in FOCUS surface water Step 2.
Harvested at BBCH 50; default crop interception set to zero in SWASH for BBCH 50 and onwards.
Same as onions in FOCUS groundwater.
Same as tomatoes in FOCUS groundwater.
Same as cabbage in FOCUS groundwater.
Same as carrots in FOCUS groundwater.
EFSA (2014) gives crop interception for olives and hops only on level of FOCUS surface water Step 2. For olives (evergreen), the FOCUS Surface Water Repair WG proposes to retain the crop interception specified in FOCUS surface water Step 2 (i.e. 70% all year round, FOCUS, 2001). For hops, it is proposed to use more detailed crop interception given in Olesen and Jensen (2013).
The selection of the default crop interception (Table 7) is internally managed by SWASH depending on the BBCH stage calculated for each application date. However, the user is allowed to change the default crop interception values implemented in the new version of SWASH if justified, e.g. for herbicide applications on non‐established grass.
In the new SWASH shell, ground spray is also possible in tall permanent crops. In line with Beulke et al. (2015), it is assumed that there is no soil coverage in citrus, olives and hops (no crop interception), whereas there is some soil coverage (grass, weeds) in pome/stone fruits and vines (also refer to Section 3.8.1 and Appendix Q). The FOCUS Surface Water Repair WG agreed to set the default crop interception for soil coverage in pome/stone fruits and vines for downward spraying to 45% (half of the default crop interception in grass/alfalfa). There is no differentiation into in‐row and between‐row areas. Note that in the models, ground spraying in tall permanent crops is ‘targeted’ to the permanent crop canopy for technical reasons (there is no additional crop present in the models). Wash‐off (from soil coverage) is considered to be sufficiently covered by this workaround.
As harvest is usually at BBCH 90 (with the exception of sugar beets and leafy, bulb and root vegetables, which are harvested at BBCH 50, and evergreen crops, e.g. citrus and olives), there is no crop present in the models from BBCH 90 and onwards. This implies that crop interception at BBCH 90–99, stated in EFSA (2014), is not applicable if applications are intended to be made at BBCH 90 and onwards. In this case, the crop interception in SWASH is set to zero (bare soil application).
For sugar beets and leafy, bulb and root vegetables, SWASH provides default crop interception only up to BBCH 50 as these crops are harvested at BBCH 50. So, if a user wants to make calculations for later crop development stages (e.g. for seed production), he has to be aware that this implies a bare soil application with no crop present any more (zero crop interception in SWASH).
3.1.5. Reassessment of the drift percentile approach
The current FOCUS sw scenarios aim to estimate the maximum annual PEC (PECmax) caused by entries of pesticides by spray drift deposition coupled to either drainage or run‐off/erosion entries (FOCUS, 2001). In the FOCUS surface water scenarios, experimental spray drift deposition data are used for each crop and growth stage combination as a function of distance from the edge of the treated field. Experimental data at certain distances have been analysed to determine the probabilities of observing various amounts of drift values. If the 90th percentile drift values are calculated for each distance, this experimental data set can be used to determine a 90th percentile regression curve for the crop/growth stage combination being considered.
FOCUS (2001) recommended that a 90th percentile cumulative drift probability is used for all drift applications made during a single cropping season. The basic concept of this approach is to select appropriate drift values so that the cumulative drift for the entire application season is the 90th percentile of drift probabilities. For a single application, the cumulative 90th percentile drift amount has a value of μ + 1.282 σ in a normal distribution, which is equivalent to stating that 90% of the values in the distribution are below this value. For example, for a series of six applications, the cumulative 90th percentile drift amount has a value of μ + 1.282 σ/60.5 or μ + 0.523 σ. The cumulative percentile which corresponds to a value of 0.523 standard deviations above the mean in a normal distribution is the 70th percentile. Therefore, a series of six individual spray drift events, each with a 70th percentile probability, has an overall 90th percentile probability for the entire season of application period.
However, the FOCUS Surface Water Repair WG considers the assumption of a cumulative drift probability of 90th percentile to determine the PECmax not justified, as spray drift deposition events should be considered as separate events if they do not lead to accumulation in the simulated watercourse. Very often the mass input to the watercourse due to spray drift has already flowed out before the next spray drift deposition event. The FOCUS streams in the scenarios D1‐Lanna, D4‐Skousbo, D5‐La Jaillière, R1‐Weiherbach, R2‐Porto, R3‐Bologna and R4‐Roujan all even have hydraulic residence times of less than 1 day (refer to Appendix F of FOCUS, 2001), so for these streams no accumulation occurs for application intervals larger than 1 day. Therefore, for spray drift depositions that are independent from each other, the basic concept should not aim for the cumulative drift for the entire application season, but instead for the maximum drift event of the entire application season (as this maximum drift event generates the PECmax). Taking again the example of a series of six applications, the correct procedure would be to calculate the distribution of the maximum of six samplings from a normal distribution and taking the 90th percentile of this distribution. This 90th percentile value is of course a higher number than the 90th percentile of the original normal distribution for a single application (it is then still a point of debate which number to select for the remaining five applications). In their Appendix G, van de Zande et al. (2012) quantified the order of magnitude of the difference in 90th percentile values. For 500 sequences of 10 applications on each of the 66 Dutch standard waterbody profiles, they showed that the percentile where the PECmax of the multiple applications equals the 90th percentile single application, PECmax is at a level of about 60% which is well below the aimed 90%. The 90th percentile PECmax of 10 multiple applications would be approximately 2.5 times the 90th percentile PECmax of a single application. van de Zande et al. (2012) gave a number of reasons why their findings were so different from the ones of FOCUS (2001) that included differences in approach, so preventing their results to be directly applicable in FOCUS. Sideways and upward sprayed fruit and tree crops and drift to surface water in the Netherlands is presented in van de Zande et al. (2019).
For ponds, the reasoning above is not valid, as in ponds the hydraulic residence time is in the order of at least 50 days and often more, so that spray drift depositions do accumulate and using the cumulative drift deposition is justified. So for FOCUS ponds, the PECmax by the 90th percentile of the single deposition is indeed too conservative (the cumulative drift deposition approach resulting in lower percentiles would be justified), while for FOCUS ditches and streams, the PECmax by the 90th percentile of the single deposition is insufficiently worst case (the higher 90th percentile deposition of multiple, consecutive applications would be justified). For the PECmax in sediment of pond, streams and ditches, where accumulation may indeed occur, the 90th percentile deposition may also be too conservative.
It is noted that exposure patterns and effect modelling are becoming increasingly important in the ecotoxicological risk assessment. Also for this type of assessment, care has to be taken to not introduce overly conservative assumptions.
There is no straightforward solution for a drift percentile approach, which is valid for all types of water bodies (ditch, stream and pond) as well as all environmental compartments (water and sediment). In line with what has been performed in the German GERDA project (Bach et al., 2016, 2017b), the FOCUS Surface Water Repair WG changed the current procedure for multiple applications, setting the drift percentile for the last application in an application season to the 90th percentile drift deposition, keeping the reduced percentile for all other applications (depending on the total number of applications). In this way, care is taken that there is at least one 90th percentile drift event in an application season without overestimating the entire load to the waterbody. For example, for six applications in a year, the first five drift percentiles are set to the usual 70th percentile, whereas the last one is set to the 90th percentile. This pragmatic approach ensures that the single 90th percentile drift load is always included within one run, so there is no longer the need to perform an additional ‘single application’ assessment in the case of multiple applications (also refer to Section 3.5.2).
3.1.6. Exposure to metabolites
The exposure to metabolites in the repaired FOCUS surface water scenarios has not been changed compared with the current situation, except for the factor accounting for metabolites formed in the water of the upstream catchment of FOCUS streams.
So, unchanged is:
It has been assumed that no metabolites are formed in air, so only parent molecules enter the waterbody via spray drift deposition.
It has also been assumed that no metabolites are formed on the crop canopy, so only parent molecules wash off onto the soil surface.
The applied compound or washed‐off compound on the soil surface penetrates into the soil where soil metabolites are formed. The MACRO model can deal with only one metabolite, while the PRZM model can handle two metabolites (either in parallel or sequential).
In the FOCUS water bodies (pond, ditch and stream), metabolites may be formed in water and in the sediment. The TOXSWA model has a flexible reaction scheme for formation and transformation of metabolites, allowing for sequential as well as parallel pathways (Adriaanse et al., 2014).
In the upstream catchment of FOCUS streams, metabolites may be formed in the water layer of the upstream sections of the FOCUS stream (i.e. upstream of x = 0, with x being the distance in the direction of flow in the 100‐m stream). It has been assumed that no metabolites are formed in the sediment of the upstream catchment.
So, in the upstream catchment of FOCUS streams, only aqueous metabolites are formed. The formation is governed by the time the parent molecules resides in the water of the upstream catchment (the so‐called hydraulic residence time in the catchment) as well as by the degradation rates in water of the parent and the metabolite. To estimate metabolite formation in the upstream catchment of FOCUS streams in a conservative way, the time needed to form the maximum metabolite fraction is compared to the most conservative residence time in the catchment of the 20 evaluation years. Next, a factor is calculated, converting the run‐off/drainage flux of the parent coming out of the catchment into the metabolite flux coming out of the catchment and entering the 100‐m FOCUS stream across its upstream boundary. The time for formation of the maximum metabolite fraction depends on the degradation rates of the parent and the metabolite, which are a function of the temperature of the water according to the Arrhenius equation (Adriaanse et al., 2014).
In the current FOCUS surface water scenarios, an evaluation period of 12 months (R scenarios, with three different selected years according to the application season) and 16 months (D scenarios) is used. For each scenario, the average water temperature and most conservative hydraulic residence time are determined over the evaluation period of 12, respectively 16 months, resulting in a correction factor for metabolite formation that is unique for each scenario. For the repaired FOCUS scenarios, the correction factor has been calculated according to the same methodology as described above, but now based on the daily 3‐day moving average water temperature (see Appendix P) and most conservative residence time of the 20‐year evaluation period. To avoid being over‐conservative, it has been checked that the most conservative hydraulic residence time used to calculate the correction factor was not an extreme case, i.e. the last‐but‐one most conservative residence time was used (Beltman et al., in preparation).
3.1.7. Spring point implementation in PRZM
The existing PRZM model considers already a spring point for FOCUS groundwater modelling. However, this option employs the crop evapotranspiration coefficients Kc and differs conceptionally significantly to the implementation of a spring point in the MACRO model. Taking into account the mandate of the working group, it was decided to implement in PRZM an alternative spring point approach aligned to the methodology of MACRO. So, this use of a spring point was implemented in PRZM as new option (IPEIND = 9). The spring point is intended to represent for winter crops an accelerated plant growth at some time point in early spring after winter dormancy. Basic concept is a linear shoot and root growth from emergence to spring point and an increased linear growth from spring point to maturity. The accelerated plant growth goes hand in hand with a significant increase in evapotranspiration. The spring point was considered for scenario‐specific parametrisation of winter cereals (R1, R3 and R4) and winter oil seed rape (R1 and R3).
Four parameters are used to describe the new spring point in PRZM:
date of the spring point;
root depth at spring point (RDSPR);
ground cover at spring point (COVSPR);
crop height spring point (HTSPR).
Default values are 20 cm for root depth and crop height and 20% for the ground cover. Spring point dates are scenario specific:
R1 cereals, winter: 24.04. (origin: FOCUS groundwater (gw), Kremsmünster);
R1 oil seed rape, winter: 15.04. (origin: FOCUS gw, Kremsmünster);
R3 cereals, winter: 19.03. (origin: FOCUS gw, Piacenza);
R3 oil seed rape, winter: 07.03. (origin: FOCUS gw, Piacenza);
R4 cereals, winter: 28.02. (origin: analysis of growing degree‐days (GDD) of underlying agro‐climatic data).
3.2. Review of pesticide application timing
In the current FOCUS sw scenarios, potential application dates for pesticide are defined by the user based on a so‐called application window covering at least 31 days for a single application and at least 31 + [(number of applications − 1) × interval] days for multiple applications. So if the intended use is four applications at 7‐day intervals, the minimum application window is 31 + [(4 − 1) × 7] = 52 days. Note that the application window selected by the user may also be longer than the minimum number of days required. The application window, which is specified by the user upon expert judgement depending on the intended use, determines the first and last possible day of application. The number of applications is restricted to a maximum of 8. In the current procedure, it is not possible to define irregular application intervals. The exact date of application within the application window is determined by an algorithm, the so‐called PAT, which checks that:
application is not performed in wet periods with a minimum time period of 2 days before the first significant rainfall (i.e. less than 2 mm of rain each day in a 5‐day period, starting 2 days before application, extending to 2 days following the day of application);
application is followed by significant rainfall (i.e. at least in total 10 mm in the next 10 days).
If no solution can be found, the criteria are systematically relaxed step‐by‐step until a solution is always found (refer to Appendix H).
For a 1‐year assessment period, this kind of algorithm to calculate application timing was considered essential by FOCUS (2001) to minimise the influence of the user on the outcome of the assessment, as run‐off and drainage losses of pesticides are highly event‐driven, being determined by the rainfall after application.
Because of the new 20‐year assessment period, the selection procedure for individual application dates was reconsidered by the FOCUS Surface Water Repair WG investigating different PAT options (also refer to Appendix I). Overall, the FOCUS Surface Water Repair WG agrees with the initial 2‐mm rainfall criterion (maximum 2 mm of rainfall on 5 days consecutively around application) introduced by FOCUS (2001) with the current FOCUS PAT as this is considered to mirror good agricultural practice. A simple analysis of the rainfall data of the entire 20‐year assessment periods indicates that this situation is actually given in 36.4–59.8% of all possible application dates, depending on the scenario (Table 8). Making it possible to shift the actual application date within a large 31‐day application window (± 15 days around the intended application date), similar to what is currently implemented in the FOCUS PAT, the 2‐mm rainfall criterion (at 5 days consecutively) is actually met by 95.9–99.7% of all possible application dates in the 20‐year assessment periods. This implies that for a single application, with an application window of 31 days, such favourable (i.e. non‐conservative) conditions are practically always given for each scenario throughout the entire 20‐year assessment period. This is certainly not the case in agricultural practice where unfavourable conditions at application (e.g. application close to thunderstorm rainfall) may indeed occur in some years. Note that the situation is more complex for multiple applications, limiting the freedom of the PAT to find suitable dates for all applications without relaxing this initial 2‐mm rainfall criterion. However, increasing the number of applications also increases the likelihood of less favourable application dates, so limiting the overall impact of the PAT with respect to run‐off/drainage events.
Table 8.
Percentage (%) of days in the entire 20‐year assessment period of all FOCUS sw scenarios fulfilling the initial rainfall criteria of maximum 2 mm on 5 days consecutively around application and maximum 2 mm on 3 days consecutively around application, respectively, applying an application window of 1 (no‐PAT situation), 7, 15 or 31 days
| Rainfall criterion around application | Application window | D1 | D2 | D3 | D4 | D5 | D6 | R1 | R2 | R3 | R4 |
|---|---|---|---|---|---|---|---|---|---|---|---|
| Max. 2 mm/5‐day period | 1 day (No PAT) | 45.3 | 39.4 | 36.4 | 38.5 | 42.8 | 59.8 | 37.1 | 43.4 | 52.7 | 57.3 |
| 7 days | 76.6 | 69.4 | 66.4 | 68.4 | 71.8 | 84.0 | 69.0 | 68.9 | 82.7 | 86.3 | |
| 15 days | 92.2 | 88.3 | 85.9 | 86.8 | 87.9 | 94.0 | 88.8 | 85.2 | 95.5 | 97.1 | |
| 31 days | 99.3 | 97.9 | 97.2 | 97.2 | 97.8 | 98.2 | 97.9 | 95.9 | 99.7 | 97.1 | |
| Max. 2 mm/3‐day period | 1 day (No PAT) | 59.3 | 53.4 | 50.9 | 52.7 | 56.1 | 70.6 | 52.0 | 54.6 | 65.8 | 69.7 |
| 7 days | 92.3 | 87.5 | 87.0 | 88.9 | 88.4 | 94.9 | 89.1 | 83.9 | 94.9 | 96.6 | |
| 15 days | 99.2 | 97.7 | 97.8 | 98.5 | 97.5 | 99.5 | 98.3 | 95.3 | 99.6 | 99.9 | |
| 31 days | 99.9 | 99.9 | 99.9 | 99.9 | 99.8 | 99.9 | 99.9 | 99.5 | 99.9 | 99.9 |
Note that the current FOCUS PAT additionally requires that application is made on days with at least 10 mm of rainfall (in total) occurring within the next 10 days (relaxing this initial criterion if necessary). Because of the 20‐year assessment period, this second rainfall criterion is not considered defensible anymore, as different rainfall patterns in the 20 years compensate each other. So, if there is a period without rainfall in all 20 years, there is no justification to force a PAT to find an application date with some ‘minimum rainfall’ afterwards. So, this second rainfall criterion was excluded FOCUS Surface Water Repair WG in further PAT reconsiderations.
It is also noted that a large application window may lead to quite substantial shifts between the intended and the actual application date, which may result in actual application dates far outside the intended BBCH stage. This would need reconsideration of the crop interception for each individual application. From a regulatory point of view, application dates outside the intended BBCH stage reported in the proposed good agricultural practices (GAPs) are not acceptable. In fact, under Regulation (EC) No 1107/2009, the GAP is an important element, as it defines the details of the product representative uses to be assessed.
To overcome the limitations of a large application window, the FOCUS Surface Water Repair WG proposes shorter application windows. Allowing a shift in the actual application date by, for example, only 7 or 15 days, the initial 2‐mm rainfall criterion on 5 days consecutively is still met by 66.4–86.3% and 85.2–97.1%, respectively, of all possible application dates in the entire 20‐year assessment periods (Table 8). This implies that for 13.7–33.6% (7‐day application window) relaxing of this initial 2‐mm rainfall criterion is necessary to find a suitable application date. The first relaxing step in the current FOCUS PAT is to reduce the 5‐day period for the 2‐mm rainfall criterion to 3 days only (see Appendix H). This situation is already given for 50.9–70.6% of all possible application dates in the 20‐year assessment period. Applying an application window of 7 or 15 days these numbers increase to 83.9–96.6% and 95.3–99.9%, respectively (Table 8). In other words, considering an application window of, for example, 7 days for a single application, there will be roughly 5–15% of applications with rainfall conditions less favourable than the 2‐mm rainfall criterion on 3 days consecutively. Without having ‘real world’ data available, the FOCUS Surface Water Repair WG considers these numbers more in line with risk assessment expectations.
Finally, the FOCUS Surface Water Repair WG tested the overall impact of shorter application windows in an extensive modelling exercise, applying several dummy substances with contrasting substance properties in all of the 10 FOCUS sw scenarios, with applications made all year round (Appendix I). Because of these results, the FOCUS Surface Water Repair WG considers a 7‐day application window for a single application a reasonable compromise: (i) allowing a limited number of applications on less favourable (i.e. more conservative) days, (ii) excluding extreme run‐off/drainage events, (iii) reducing the day‐to‐day variability in PECs with respect to application timing and (iv) respecting the proposed GAP (BBCH stage) as far as possible. So, for a single application, the application window (i.e. the so‐called extension period in the revised PAT) is set to ± 3 days around the intended application date. For multiple applications, the application window in the revised FOCUS sw scenarios covers the period from 3 days before the first intended application to 3 days after the last intended application, without allowing the user to modify this extension period.
As there are only minor shifts in the actual application date compared with the intended application date (at maximum ± 3 days), the FOCUS Surface Water Repair WG sees no need to reconsider the BBCH stage or crop interception on the basis of actual application dates. So, BBCH stage and crop interception for the intended and actual application dates are considered to be the same.
In very rare cases, the revised PAT (accounting for an extension period of ± 3 days) may allocate applications on days with a rainfall above 18 mm. In this event, drainage is strongly pronounced as MACRO assumes that application actually takes place during rainfall (note that rainfall in MACRO starts at midnight with a rainfall intensity of 2 mm/h, whereas application is assumed to take place at 9.00). To avoid such unrealistic application dates, a rainfall cut‐off criterion (rainfall on day of application < 18 mm) was implemented in the revised PAT. If the PAT cannot find a solution on the basis of a ± 3 days’ extension period, the extension period is successively increased (±4 days, and so on) until a solution is found.
3.3. Substance parameters depending on soil properties (e.g. pH or clay)
Substance parameters, determining pesticide sorption and degradation in soil, water and sediment in environmental exposure models, are usually estimated based on average values (geometrical or arithmetic means) for a given sample set. The FOCUS Surface Water Repair WG acknowledges that it is probably more the rule than the exception that these substance parameters depend on soil properties. This is particularly the case for weak acids and bases that change their dissociation status within environmentally relevant pH ranges, but also for cations whose sorption may strongly depend on the clay content. The FOCUS Surface Water Repair WG is aware that there is no dedicated guidance available on how to investigate and demonstrate such a relationship by statistical means. Because of the limited data sets usually available in pesticide dossiers (quite often only three or four soils, which is the minimum number of soils according to Commission Regulation (EU) No 283/2013), statistically robust relationships between substance and soil properties are indeed difficult, or even impossible, to establish. Nevertheless, in pesticide dossiers, substance parameters based on average values are often replaced by substance parameters varying with certain soil properties, particularly, if soil sorption (Kd, Koc) is considered to depend on the soil pH.
Among other soil properties, the soil pH and clay content are indeed defined for each FOCUS surface water scenario (refer to annexes C and D of FOCUS, 2001). No such properties are given for the water and sediment compartments. However, it has to be kept in mind that, with the exception of the OM content and soil texture (soil structure), soil properties have not been taken into account in the scenario selection procedure of the FOCUS surface water scenarios (FOCUS, 2001). Water and sediment properties have been completely ignored. Therefore, properties such as pH in soil, water or sediment are meaningless with respect to the vulnerability of the FOCUS surface water scenarios. As a consequence, running the FOCUS surface water scenarios with substance properties defined on the basis of, for example, the soil pH, defined for a given scenario, may drastically alter the intended vulnerability of the scenario, particularly if these soil properties result in best‐ or worst‐case substance properties. This implies that it is not defensible to run the FOCUS surface water scenarios relying on substance parameters specific to certain soil properties. Basically, the same reasoning is true for the FOCUS groundwater scenarios as already outlined in EFSA PPR Panel (2013a) and European Commission (2014).
If substance properties depend on the soil pH, the FOCUS Surface Water Repair WG therefore recommends performing calculations for two contrasting soil pH values in line with recommendations already given for the FOCUS groundwater scenarios (European Commission, 2014). On the basis of the EFSA spatial data set 1.1 (Hiederer, 2012), pH values for arable soils (with annual and permanent crops) vary from 4.1 to 8.8 (pH measured in water) with pH values of 5.1 and 8.0 representing the 10th and 90th spatial percentiles, respectively (median pH of 6.5). These 10th, 50th and 90th spatial soil pH values for arable and permanent crops are broadly in line with data obtained on the basis of EC‐JRC (2010) and the LUCAS database (Tóth et al., 2013). This soil pH range is also roughly covered by the FOCUS surface water scenarios with topsoil pH values in the range 4.5–8.4 (matrix for pH measurement not specified).
If there is a significant change in substance properties within a soil pH range 5.1–8.0, the FOCUS Surface Water Repair WG recommends performing two individual calculations at ‘contrasting pH values’, so assuming substance properties representative for a soil pH(water) of 5.1 and 8.0, respectively, and to report the results from both runs. To keep the overall complexity low, sorption parameters used in the modelling should be the same in all environmental compartments (soil, water and sediment, assuming that they all have the same pH). Note that peak concentrations in water are hardly influenced by sorption to suspended solids in water and sorption to the upper layer of the sediment, as the pesticide mass involved in the sorption processes are small (except for compounds with very high Koc values such as pyrethroids). The small sample size of (usually) only two water/sediment systems does not allow the establishment of a statistically robust correlation between degradation and water/sediment properties. So, degradation in the water/sediment is usually not considered to depend on water or sediment pH.
Representative substance properties for soil pH values of 5.1 and pH 8.0, respectively, may be obtained by: (i) applying a sigmoid equation (as outlined in EFSA, 2017, particularly for weak acid substances), (ii) applying a linear or any other suitable mathematical equation and calculating substance properties at pH 5.1 and pH 8.0 on the basis of this equation or (iii) splitting the data into two subsets and calculating mean sorption values for both subsets. Because of the median pH values in the EU being close to a pH(water) of 6.5, it is recommended to set the split point close to this pH value, if applicable. In principle, these approaches apply to both the sorption constant (Kd, Koc or Kfoc) and the Freundlich sorption exponent (1/n) as well as to the formation fraction and the properties of any metabolites. In any case, the correlation between substance properties and soil pH should be proven to be significant by means of adequate statistical tests (e.g. Kendall's tau‐b (τb) test, two‐sided or Pearson's test for small samples sizes). Note that pH values measured in matrices other than water (e.g. CaCl2 or KOH) should be converted into pH values measured in water applying a suitable transfer equation (e.g. EFSA, 2017). Care should be taken if experimental data do not cover the entire pH range avoiding extensive extrapolation.
A FOCUS surface water scenario is considered to be fully covered if both runs (with contrasting substance properties) indicate an acceptable risk. If only one of the two runs results in an acceptable risk, application of risk mitigation measures may be necessary (e.g. excluding application on soils with certain properties). Risk mitigation may be applied at the EU, zonal or MS level taking into account specific data sets, e.g. pH or crop distribution maps (e.g. EFSA spatial data set, Hiederer, 2012; LUCAS topsoil survey, Tóth et al., 2013).
The FOCUS Surface Water Repair WG is aware that there is a mismatch for pH limits stated in the generic guidance on substance input parameter selection for PEC gw (European Commission, 2014) and given here. Note that soil pH limits stated in European Commission (2014) are uncertain, as the matrix for pH measurement is not specified further. Preferably, the same substance properties are used in all exposure assessments. Because of the extensive analysis of spatial data made to address this mandate within this WG, the FOCUS Surface Water Repair WG recommends adapting the generic guidance on substance input parameter selection for PEC gw (European Commission, 2014) accordingly. This may include the recommendation for a dedicated soil pH split point for the split approach as stated above, as well as specifying the pH measurement matrix.
In contrast with the soil pH, the clay content (in terms of soil texture) is considered part of the scenario definition and is clearly linked to the scenario vulnerability with respect to losses of pesticides by drainage and run‐off/erosion. The FOCUS Surface Water Repair WG therefore does not see the need to use any other clay content to calculate representative substance properties than the clay content of the soil horizons of the given scenario. In line with the approach given for soil pH, representative substance properties for the clay content of the scenario may be obtained by linear or any other suitable mathematical equation, which should also be proven by adequate statistical tests.
3.4. Review of the foliar wash‐off in MACRO and PRZM
The FOCUS Surface Water Repair WG thoroughly investigated the foliar wash‐off routines in MACRO and PRZM for varying half‐lives on the crop canopy (5, 10 and 20 days) and wash‐off coefficients (0.05, 0.1 and 0.2 mm−1). It was concluded that wash‐off simulated by the two models is generally similar, except for applications on days with rainfall (see Appendices E and F). For simulations with rainfall on the day of application, PRZM simulates significantly larger wash‐off than MACRO. The reason is that PRZM runs with a daily time step, so that wash‐off is generated by throughfall calculated on the day of application. In MACRO, which runs with a maximum time step of half an hour, application takes place at 9.00 in FOCUS (2001), while any rainfall on that day always starts at midnight. So, no wash‐off will occur in MACRO on the day of application unless the daily rainfall exceeds 18 mm (because rain in MACRO is assumed to fall at an intensity of 2 mm/h in FOCUS, 2001). So, in MACRO, even on rainy application days, wash‐off will almost always be delayed until the next rainfall event (on the following day), during which time the pesticide stored on the canopy is subject to dissipation.
To harmonise wash‐off predictions for application days with rainfall, the FOCUS Surface Water Repair WG agreed to adapt PRZM such that wash‐off on the day of application only occurs if the daily rainfall exceeds 18 mm. To calculate wash‐off on the day of application, the total amount of rainfall generating wash‐off in PRZM is reduced by these 18 mm. Furthermore, a bug has been corrected in the PRZM code considering now the throughfall instead of rainfall for wash‐off computation.
Overall, the analysis shows no systematic differences in wash‐off predicted by the models arising from variations in wash‐off coefficient or half‐life on the crop canopy. Therefore, the FOCUS Surface Water Repair WG does not see any need to further harmonise foliar wash‐off in MACRO and PRZM.
Nevertheless, the FOCUS Surface Water Repair WG proposes to replace the default wash‐off coefficient of 0.05 mm−1 currently used in FOCUS surface water (2001) with the value of 0.1 mm−1 as proposed by the PPR Panel in the scientific opinions on the selection of soil scenarios and groundwater assessment as well as in the EFSA guidance document on soil exposure (EFSA PPR Panel, 2012, 2013a,b; EFSA, 2017). This will result in a complete harmonisation of the wash‐off coefficient values to be used in the surface water, groundwater and soil exposure procedures.
3.5. Processing times and user friendliness of the revised FOCUS surface water scenarios
3.5.1. Processing time
The FOCUS Surface Water Repair WG notes that the processing time of PRZM will hardly change as it already runs for 20 years with the current FOCUS (2001) scenarios (note that in the revised approach, 6 warming‐up years have been added). MACRO is expected to have similar run‐times as for the FOCUS groundwater scenario Châteaudun, which is already run for a 20‐year assessment period (+ 6 warming‐up years). The speed of TOXSWA was improved by enabling the TOXSWA shell to distribute runs of one project between available processors of the computer, so reducing the project run‐time. Keeping processing times of TOXSWA as short as possible is considered most important, as TOXSWA may be re‐run several times at FOCUS surface water Step 4, applying different risk mitigation options, for example, using the software tool SWAN (Surface Water Assessment eNabler, see https://showcase.tessella.com/products/swan, assisting the user to incorporate mitigation measures for spray drift and run‐off into FOCUS surface water Step 4). Run‐times for the example calculations in Appendix K were a few seconds for PRZM and approximately 45 min for TOXSWA (R1 stream), 20 min for MACRO and 25 min for TOXSWA (D1 ditch), respectively, for a computer with Intel i7‐6700 processor with CPU 3.40 GHz.
The FOCUS Surface Water Repair WG considers the option of automatically running MACRO and PRZM within SWASH (without starting them from individual shells) desirable from the users’ point of view. However, because of the time frame available for this mandate, the FOCUS Surface Water Repair WG considers this only as a feasible option for the future, given sufficient funding.
Note that there is no longer the need to perform an additional ‘single application’ assessment for multiple applications (see next section).
3.5.2. Dealing with single application assessments if the GAP indicates multiple applications
In the current FOCUS sw exposure assessment, simulations considering both single and multiple applications have to be provided if the GAP indicates that the plant protection product (PPP) may be used several times in a year. This is simply based on the fact that if spray drift is the dominant entry route and if there is no accumulation, the simulation based on a single application always results in higher initial PECs than for multiple applications due to the higher drift percentile applied (90th percentile for single application vs., e.g. the 70th percentile for six applications).
With respect to the 1‐year assessment period, it cannot be excluded that farmers will apply the PPP only once, even it is foreseen that it should be applied several times in a year. Because of a 20‐year assessment period, such a procedure is no longer defensible, as it is unrealistic to assume that PPPs that can be applied several times a year, will be applied only once in a year throughout the entire 20‐year assessment period. Therefore, the FOCUS Surface Water Repair WG proposes to ignore the additional ‘single application’ approach for multiple applications and to allow for simulations with multiple applications only, in line with the GAP. This implies that, for multiple applications, the run‐time for a project (combinations of pesticide, application and crop) will be halved. Note that the FOCUS Surface Water Repair WG also proposes to always set the drift percentile for the last application in a year to the 90th percentile drift deposition, keeping all other applications in a year at the reduced percentile (depending on the total number of applications). So, there is no need for an additional single application run from this point of view (also refer to Section 3.1.5, Reassessment of the drift percentile approach, and Appendix J).
3.5.3. Revised application timing in SWASH
In the current version of FOCUS SWASH, the selection of the application window is subjective and may influence the credibility of the calculated concentrations in surface water (also refer to Section 3.2). In the new SWASH software tool, the FOCUS Surface Water Repair WG has implemented an alternative procedure, which strongly reduces the subjectivity for application timing and consequently increases confidence in the simulated surface water concentrations. The new procedure for determining application timing is based on a close link between the BBCH stage (which is well defined for each application and location according to the GAP) and the calendar date at which this BBCH stage is reached at each scenario location. The link between the BBCH stage and the calendar date is based on the approach used in the software AppDate (Klein, 2006, 2018). AppDate uses a database containing suitable application dates for major crop development stages (e.g. BBCH 10, 20, 30). The dates are linearly interpolated between these BBCH stages (refer to Appendix G). In the new SWASH software tool, this approach is used to determine the so‐called intended application dates. As crop development (BBCH stages) is identical in all years of the 20‐year assessment period, the intended application dates are the same in each year. The actual application dates, which may vary in each of the 20 assessment years according to rainfall, are finally determined by the revised PAT based on the intended application dates (applying an extension period of ± 3 days) relaxing the initial rainfall criterion if necessary. As already stated, the application window for the revised PAT, necessary to allow for some flexibility in finding suitable application dates, starts 3 days before the first intended application date and ends 3 days after the last intended application date (also refer to Section 3.2, Review of pesticide application timing).
A complete set of individual tables on BBCH stage/calendar dates for each individual crop and for each individual FOCUS sw scenario is provided by the AppDate software in a separate file (BBCH.out), which is read by the new SWASH software tool. These tables also define default crop interception for each BBCH stage/calendar date (see Section 3.1.4, Crop interception).
By default, intended applications are always set at the first calendar date, which is specified for a given BBCH stage. For multiple applications, the user specifies the BBCH period (e.g. BBCH 20–39), the number of applications in this period and a standard interval between applications. In SWASH, the first intended application is then automatically allocated to the calendar date which is specific for the lowest BBCH stage of this period (BBCH 20 in this example), with subsequent applications following at the given interval. For irregular application intervals, the user may change individual application intervals or application dates afterwards. Note that the user is always allowed overwriting the intended application dates determined by SWASH if justified. However, because of consistency the FOCUS Surface Water Repair WG strongly recommends keeping the intended application dates selected by SWASH unless there is justification to adapt them.
In the new FOCUS SWASH software tool, it is also possible to specify application dates related to the last day for a given BBCH period, specifying additional applications ‘backwards’.
The new procedure allows for flexibility, e.g. for winter crops, for which BBCH 20–39 covers the time period from late autumn to early spring with BBCH 20–21 representing the dormancy period. If, for example, application in spring is considered most appropriate for BBCH 20–39 for a given winter crop, the user may fix the first application to the BBCH stage 21 instead of 20.
Some biennial crops (sugar beets and several bulb, leafy and root vegetables) are usually harvested in the first year at BBCH 50, and therefore, no recommendations can be given beyond BBCH 50. However, if a simulation at a later stage is necessary (for instance for seed production), a respective date can be entered manually. However, the user should be aware that bare soil conditions would be simulated in such a situation.
Because of the number of applications possible within a GAP, the FOCUS Surface Water Repair WG increased the number of possible applications in SWASH from the current eight to 50. However, drift percentiles for more than eight applications are not considered to be reduced further.
3.5.4. Handling of different spray drift curves for vines and pome/stone fruits
Spray drift rates considered in the current FOCUS sw scenarios (FOCUS, 2001) are based on the Rautmann drift values (Ganzelmeier et al., 1995; Rautmann, 2000, 2001). These data include two drift curves (‘early’ and ‘late’ application) for vines and pome/stone fruits.
Underlying drift trials for the drift values for ‘vines early’ are based on specific drift reducing application techniques (with air assistance switched off). Such techniques are used in many vineyards, but are not standard farming practice for application in early vines. In Germany, the official Rautmann drift tables have therefore been adapted in 2006, excluding the lower ‘vines early’ drift values (BVL, 2006). Only the drift values for ‘vines late’ should be considered for standard exposure assessments. The FOCUS Surface Water Repair WG decided to follow this approach in the FOCUS sw scenarios also, so excluding drift values for ‘vines early’ in the exposure assessment.
For pome/stone fruits, Rautmann drift tables do not contain any recommendation for a dedicated split point (e.g. on the basis of a certain BBCH stage) between ‘early’ and ‘late application’. The experimental trials used in selecting the higher, early drift percentiles were conducted on crops at either BBCH stage 21/22 (leaf development) or 98/99 (after leaf fall). The trials used in selecting the lower, late drift percentiles were conducted on crops at either BBCH stage 85 (advanced ripening) or 91 (shoot growth complete, foliage still fully green). However, there is considerable uncertainty over which drift percentile to use for growth stages between those specifically covered by the Rautmann data (i.e. between BBCH stages 22 and 85). A cut‐off point for selecting either the early or late spray drift curve for pome/stone fruits has so far not been agreed at the EU level.
Following consultation with efficacy experts and grower information, the FOCUS Surface Water Repair WG considers ‘post blossom’ the time when the canopy is well developed. Efficacy would term this crop stage ‘late season’, and drift can be expected to be greatly reduced by the presence of the crop canopy. Flowering occurs from BBCH stages 60–69, and therefore, the more conservative drift percentiles for early applications should be used up to BBCH stage 69. The late (lower) drift data are then to be used from BBCH stage 71 onwards (note that BBCH 70 does not exist for pome/stone fruits). This interpretation was also accepted by EFSA and MSs during the peer review of trifloxystrobin (EFSA, 2017). The proposed split point around BBCH 69/71 is also consistent with Holterman et al. (2016), who demonstrated for different wind speeds a sharp decline in the downwind spray drift deposits from BBCH 70 onwards, and increasing from BBCH 90 and onwards.
To facilitate the exposure assessment and to increase consistency in the peer review process, the FOCUS Surface Water Repair WG adapted SWASH to use the more conservative drift data for ‘pome/stone fruits, early’ up to BBCH 69 and the less conservative drift data ‘pome/stone fruits, late’ from BBCH 71 to 95, switching back to ‘pome/stone fruits, early’ at BBCH 97 and onwards (BBCH stage 70 and 96 do not exist for pome/stone fruits). Note that the selection of the appropriate drift curve is internally managed in the SWASH shell based on the application date determined by the BBCH stage and cannot be modified by the user.11
The new SWASH shell also allows for downward spraying in tall permanent crops. If the user selects this option, the drift is internally set to the standard drift curve for low arable crops respecting the default distances to water bodies in tall permanent crops (i.e. 3 m from the crop to the top of the bank).
3.6. Use and presentation of the results of the revised FOCUS surface water scenarios
3.6.1. Reconsideration of the temporal percentile approach
In the current FOCUS sw scenarios, a single year out of a 20‐year assessment period (14 and 18 years for D1 and D6, respectively) was selected for PEC calculation. For both, drainage as well as run‐off scenarios, it was the intention of the FOCUS WG to select a year that best represents the 50th percentile simulated water balance for the long‐term time series (FOCUS 2001). Note, that for run‐off scenarios, actually 3 years (one for each season) have been selected. This implies that the current FOCUS approach was originally targeted to represent a 50th temporal percentile hydrology year. In combination with a 90th percentile spray drift deposition, the intention of the original FOCUS WG was to come to an approximate overall 90th percentile exposure concentration.
In the new 20‐year assessment approach, annual maximum PECs in water and sediment are calculated for each individual year. Results for these 20 years, therefore, represent the temporal variability in terms of annual maximum PECs obtained for a given scenario. In the TOXSWA summary file (.sum file), annual maximum PECs in water and sediment are already ranked in an increasing order with the lowest PEC representing the 2.5th temporal percentile, and the highest PEC representing the 97.5th temporal percentile.12 Note that the 50th temporal percentile PEC has a return period of 2, in other words: in 1 out of 2 years the PEC will be higher than the 50th percentile PEC. The question now is which temporal percentile to select for the final exposure assessment.
With respect to drift deposition, the percentile selection is considered less critical. In the FOCUS sw exposure assessment, drift deposition is considered to be constant, so peak concentrations in water due to drift deposition are similar throughout the year and within all 20 assessment years. There may of course be some variability in PECs, for example, due to temporal changes in the water depths of the water bodies (with maximum concentrations in periods with no additional water inflow). However, application (and drift deposition) usually takes place in periods with less rainfall, so most of the annual peak concentrations will be close, if not identical to, the overall maximum peak concentration possible based on a given drift deposition. For ponds, where accumulation in the water phase may occur if there are multiple applications, maximum PECs may also vary from year to year due to different degradation rates (due to different temperatures) in the water phase. However, when compared to entries via drainage or run‐off, the variability in maximum annual PECs due to drift deposition is considered low. Overall, this implies that spray drift‐driven PECs in each of the 20 assessment years are expected not to vary significantly. So, the selection of the temporal percentile is expected to have a minor impact on the exposure result as long as PECs are driven by spray drift deposition.
It may be noted that, for multiple applications, with the final application set to the 90th percentile drift, PECs obtained based on the new 20‐year assessment approach will be consistently higher as long as the entire assessment is driven by drift. As outlined in Appendix J, the new exposure assessment for multiple applications will give results close to the single application approach in the current approach.
In contrast with drift deposition, substance entries into the waterbody via drainage and run‐off may vary to a great extent within a year, but also between the individual years, depending on the rainfall. Therefore, the selection of the temporal percentile may have a strong impact on PECs obtained if peak concentrations are driven by drainage or run‐off. This is particularly the case for substances that are sensitive to the rainfall pattern, so for substances with a fast degradation in soil (DegT50 = 3 days for the dummy substances tested) and a low sorption constant (Koc of approximately 100 mL/g or lower). As demonstrated in extensive modelling runs (see Appendix I), drainage or run‐off PECs for substances with longer half‐lives in soil are much less affected by the selection of the temporal percentile. Mainly, it can be concluded that an increase in the temporal percentile by 10 (so, e.g. from the 70th to the 80th temporal percentile) increases the PEC by a factor of roughly 1.5 and 1.1 for substances with a DegT50 of 3 and 30 days, respectively, depending on the Koc as well. Note that for short‐living substances, differences in PECs based on different temporal percentiles may be much higher, particularly in periods with less rainfall (summer) (also refer to Appendix I).
When selecting a certain temporal percentile, RMs may also consider results obtained based on the current FOCUS single‐year approach. As already noted, the new 20‐year assessment approach is much less sensitive to the (actual) application timing compared with the current FOCUS approach. This does of course not imply that the new 20‐year assessment approach delivers higher PECs in general. As demonstrated more in detail in Section 4 (Comparison of the old and revised FOCUS surface water scenarios), the current single‐year approach may represent the entire range of temporal percentile PECs in the multiyear approach with a strong ‘erratic’ seasonal pattern (depending on the rainfall in the selected evaluation year). So, if one wants to cover maximum PECs occurring in the current single‐year approach, a rather high temporal percentile has to be selected for the new 20‐year assessment approach (around the 90th temporal percentile). In some exceptional cases, the current single‐year approach is indeed equal to the maximum temporal percentile (97.5th percentile) in the multiyear approach. Conversely, if one considers ‘average’ PECs of the current single‐year approach to be sufficiently conservative, a significantly lower temporal percentile (e.g. around the 50th temporal percentile) may be considered appropriate.
It is not in the remit of this working group to recommend a certain temporal percentile, as this may include risk management considerations. However, because of the considerations made above, the FOCUS Surface Water Repair WG considers the 50th and 90th percentile as the lower and upper limit, respectively, of the temporal percentile to be finally selected (represented by the 52.5th and the 87.5th temporal percentile based on the 20 years available):
The 52.5th temporal percentile of the 20‐year assessment approach (i.e. the 10th highest value out of 20, corresponding to a return period of 2.1 years) yields PECs similar to average and lower PECs obtained for the current FOCUS single‐year approach. Note that the assessment year in the current FOCUS approach was originally selected having a 50th percentile water balance in mind. In some cases, the 52.5th temporal percentile may result in PECs that are below the minimum PEC based on the current approach.
The 87.5th temporal percentile of the 20‐year assessment approach (i.e. the thirrd highest values out of 20, corresponding to a return period of 8 years) covers the current FOCUS single‐year assessment in most cases. In a few periods, PECs for the multiyear approach may be lower than for the current single‐year approach. This percentile is sufficiently low to exclude unrealistic high PECs, which may occur if pesticide application takes place on rainy days.
In principle, any percentile in between the 50th and 90th temporal percentile could be selected. As already noted before, the selection of the temporal percentile becomes particularly noticeable for substances for which inputs into surface water are sensitive to the rainfall pattern, and for periods with less rainfall (particularly in summer). For less rainfall sensitive substances with a DegT50 around 30 days, PECs obtained based on the 52.5th percentile are, on average, half of the PECs obtained at the 87.5th temporal percentile. For substances with a DegT50 of only 3 days, PECs obtained at the 52.5th temporal percentile are, on average, one‐fifth of the PECs obtained at the 87.5th percentile. Figure 1, showing drainage/run‐off induced PECsw obtained in the drainage scenario D2 and in the run‐off scenario R2 for substances with different sensitivities to the rainfall pattern (dummy substances A and F), may illustrate the effect of either choosing a 52.5th or a 87.5th temporal percentile (or something in between), compared with the current FOCUS single‐year assessment. Note that these figures give PECsw on a logarithmic scale to demonstrate the full range of PECs possible in these example calculations. Drift entries are not accounted for in these calculations.
Figure 1.
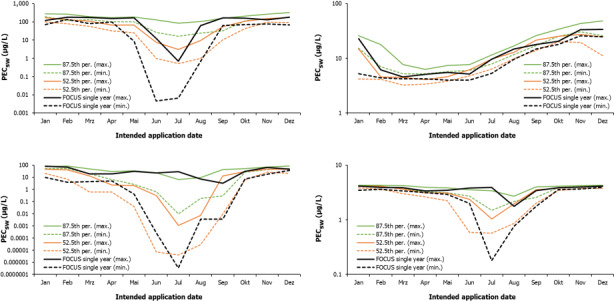
Monthly maximum/minimum drainage/run‐off induced PEC sw (μg/L) of a substance that is sensitive to the rainfall pattern (dummy substance A, DegT50 = 3 days, Koc = 10 mL/g, left) and a substance that is less sensitive to the rainfall pattern (dummy substance F, DegT50 = 30 days, Koc = 1,000 mL/g, right) in the drainage scenario D2 (top) and in the run‐off scenario R2 (bottom) at the 52.5th and 87.5th temporal percentile of the new 20‐year assessment approach, compared with the current FOCUS single‐year approach (1 × 1 kg/ha in winter cereals (D2) or in potatoes (R2), drainage or run‐off only, no drift)
The FOCUS Surface Water Repair WG also wants to make RMs aware of the following developments in risk assessments related to temporal percentile of occurrence in case the risk is due to a combination of two entry routes, such as drift deposition and drainage, or drift deposition and run‐off:
At the time of development of the current FOCUS surface water scenarios (1996–2001), it was assumed that a combination of a 50th percentile drainage or run‐off entry and a 90th percentile spray drift deposition entry would result in an approximate overall 90th percentile peak concentration in the waterbody.
In later years, it became apparent that this concept was not valid: in many FOCUS ditches and practically all FOCUS streams, the entries of spray drift deposition on the one hand and drainage or run‐off on the other hand do not accumulate (often the water containing the mass deposited by drift has already flowed out), and so there is no sound basis for combining a 50th and a 90th percentile probability to obtain a 90th percentile in time. So, concentration peaks in FOCUS ditches and streams are better represented by a 90th temporal percentile entry both for spray drift deposition and for drainage/run‐off entries. For FOCUS ponds, both types of entry often do accumulate, but generally their concentrations are significantly lower than those in the FOCUS ditches and streams, and so they are less relevant for the aquatic risk assessment.
This implies that the selection of a temporal percentile close to the 90th (rather than the 50th percentile) for the run‐off/drainage entries would correspond better to the original intentions of the FOCUS working group of 1996–2001 aiming at an overall 90th temporal percentile. At the same time, the current working group wants to mention here that the spatial percentile of the FOCUS surface water scenarios was difficult to quantify (FOCUS, 2001), but this has not changed between the current and the repaired scenarios.
The multiyear exposure profiles of the repaired scenarios also allow for more comprehensive risk assessments of aquatic organisms as outlined by the EFSA Aquatic Guidance document (EFSA PPR Panel, 2013b). In this respect, a fixed definition of a simple temporal percentile may not be sufficient to cover the wide range of possible effect situations. A detailed effect assessment should be based on an in‐depth evaluation of the overall exposure pattern over time. This is important, as the effects on aquatic organisms are characterised by complex dependencies. In addition to acute lethal effects, sublethal or chronic effects on individuals also have an influence on the abundance of populations and the composition of communities. In addition, there may be delayed effects in individuals or so‐called carry‐over toxicity, in which higher effect rates are observed through successive exposure events. So, the risk for aquatic organisms is typically not only determined by the maximum exposure concentration (PECmax) but also by the cumulative exposure (quantifiable as area under the curve (AUC)) and the time for recovery between peaks. A possible method for integrating effects of the overall exposure pattern based on TK/TD models is set out in the final report of the German GERDA project (Bach et al., 2016, 2017a,b). As part of GERDA, various effect models were run through with a wide variety of exposure scenarios. The evaluations showed that PECmax and AUC are the two most suitable individual parameters to rank exposure profiles according to their ecotoxicological potential. A more tailored temporal percentile may therefore be selected by methods of integrating effects modelling and the overall exposure pattern.
3.6.2. Consistency of the tiered approach
In the current approach (FOCUS, 2001), care was taken to keep the stepped approach in the FOCUS surface water exposure assessment (Steps 1–4) consistent, with lower steps leading to more conservative (higher) PECs. To do so, the different run‐off/drainage entries (i.e. 2–5% of the applied dose depending on the region and season) applied at FOCUS surface water Step 2 have been calibrated against the results obtained at Step 3 (note that at tier 1, a more conservative default run‐off/drainage percentage of 10% is applied). Comparing drainage/run‐off PECsw results for several dummy substances based on the revised FOCUS sw Step 3 (20‐year assessment period) with results obtained based on the current FOCUS sw Steps 1 and 2, it is obvious that the current FOCUS Step 2 does not necessarily cover the new FOCUS Step 3 approach (refer to Appendix I). This is particularly true for short‐living substances in the drainage scenarios D1 and D2 with higher PECsw results obtained at Step 3 (if based on the 47.5th temporal percentile and above) compared with Step 2. For the run‐off scenarios, FOCUS sw Step 2 may also be inadequate to cover revised STEP 3 results, depending on the temporal percentile selected.
Based on the limited data available, the FOCUS Surface Water Repair WG recommends reconsidering the parameterisation at FOCUS sw Steps 1 and 2, particularly with respect to default entries into the waterbody by drainage/run‐off. This may also include reconsideration of the period from (last) application to drainage/run‐off event (currently 4 days in FOCUS sw Step 2). The revision of FOCUS sw Steps 1 and 2 should also take care of the new proposed drift percentile setting (for multiple applications).
3.6.3. Analysis of peak pattern in water and sediment
The FOCUS Surface Water Repair WG acknowledges that, instead of applying the maximum annual PEC value in the aquatic risk assessment, peak patterns from FOCUS surface water scenarios are more frequently analysed and used to support aquatic organism testing strategies (e.g. exposure patterns in aquatic tests) as well as to allow for refinement approaches in the aquatic risk assessment (e.g. effect modelling applying TK/TD models). To facilitate evaluation of peak patterns, software tools analysing TOXSWA output files (e.g. the daily concentration in the water phase) have been provided by industry (e.g. EPAT). Among others, these tools are capable of analysing the height, the area and the duration of each individual exposure peak as well as the intervals between individual peaks. The FOCUS Surface Water Repair WG is aware that such analyses could in principle also be provided by a revised FOCUS SWASH tool. However, because of the time frame available for this mandate, the FOCUS Surface Water Repair WG recommends reconsidering this issue in future updates of SWASH.
3.6.4. Considering accumulation in sediment and worst‐casedness of PECsed
In the public consultation of the draft EFSA scientific report, some stakeholders commented on the lack of guidance on how to deal with accumulation in sediment. In this section, considerations and some advice are provided on how to deal with this issue. Additionally considerations on the use and worst‐casedness of the predicted PECsed values are presented. Details can be found in Appendices A, M, N and O.
Appendix A demonstrates that adding a warming‐up period of 6 years allows the PECsed to increase over 6 years and reach a plateau value before the 20 years’ evaluation period starts.
Appendix M briefly summarises the current methodologies applied to estimate the accumulation in sediment for the current single‐year simulations and explains why three exposure metrics are necessary to simplify the linking between the predicted PECsed and the sediment toxicity experiments for the assessment of effects to sediment‐dwelling organisms, algae or vascular plants. In the repaired FOCUS scenarios, sediment exposure is expressed in total content on OM basis (μg/kg OM), total content on dry sediment mass basis (μg/kg dry sediment mass) and pore water basis (μg/L). Moreover, concentrations are averaged over the top 1 cm or top 5 cm for the risk assessment for benthic invertebrates or plants, respectively, as was suggested by the EFSA Opinion on effect assessment on sediment organisms (EFSA PPR Panel, 2015).
Appendix N demonstrates that PECsed of the repaired FOCUS surface water scenarios do not represent a ‘realistic worst‐case’ exposure for sediment‐dwelling organisms and plants, because the 5% organic carbon content of the FOCUS sediment is not likely to result in a realistic worst‐case exposure in sediment across the EU. The appendix also demonstrates that, for compounds with Koc values of approximately up to 1,000 mL/g, the PECsw values are virtually not influenced by a significantly higher organic carbon (OC) content in sediment. For compounds with Koc values that are significantly higher than 1,000 mL/g (e.g. pyrethroids), the PECsw values are expected to become lower in cases in which the underlying sediment would contain substantially more than 5% OC. This indicates that the PECsw for the current FOCUS sediment with 5% OC are indeed on the conservative side, as is required in risk assessments. However, this also indicates that it is not possible to predict both, the PECsed and the PECsw, in a conservative way by one set of scenarios. There is indeed a need for separate scenarios: one set (with a sediment having a relatively low OC value) to predict realistic worst‐case PECsw values and another set of scenarios (with a sediment having a relatively high OC value) to predict realistic worst‐case PECsed values. So, RMs should be aware that the PECsed values obtained based on the repaired FOCUS sw scenarios are underestimated.
Appendix O finally demonstrates that the current thickness of 10 cm for the simulated sediment system is sufficient to obtain robust PECsed values for the top 1 and 5 cm layers and the 26‐year simulation period.
3.7. Dealing with rotational crops in the aquatic exposure assessment
The FOCUS Surface Water Repair WG was mandated with the task to consider whether the FOCUS modelling system should consider rotational cropping and, if so, how to deal with this. What is primarily meant here is not whether the models should simulate different crop types within the 20‐year assessment period (as this would be very complicated), but rather that allowance should be made because compounds are not usually applied year after year on the same field, as crops are grown in rotation. For example, in FOCUS groundwater, simulations can be run either for 26 years with applications every year, or for 46 years with applications every other year, or 66 years with applications every third year to account in a simple manner for crop rotations. Compared with the former case, the latter two cases result in a reduction of the applied amounts by a factor of approximately 2 and 3, respectively, and consequently, a roughly proportional dilution of the pesticide loads reaching groundwater. In the FOCUS surface water system, simulations were only run for 12–16‐month assessment periods. However, although it is not written explicitly in the FOCUS surface water report (FOCUS, 2001), the issue of crop rotations is already considered (indirectly) through the introduction of a virtual upstream catchment area that supplies water to the inlet section of the streams and ditches modelled by TOXSWA. This results in an effective dilution factor of approximately 3 for ditch scenarios and 5 for the streams on the loads by run‐off, erosion or drainage entering the waterbody simulated by MACRO and PRZM. These numbers are based upon the 1‐ha adjacent field being treated and 2‐ha upstream area not treated for the FOCUS ditch (i.e. 1 ha treated of the total of 3 ha delivering water fluxes), or upon the 1‐ha adjacent field plus 20‐ha upstream area being treated and the remaining 80 ha in the upstream catchment not treated for the FOCUS stream (i.e. 21 ha treated of the total of 101 ha delivering water fluxes). Note that both ditches and streams always receive a small pesticide‐free baseflow that becomes negligible as soon as run‐off or drainage water fluxes start. (Note: for the pond scenarios, water entering the pond from the treated field is not subject to dilution from any upstream water inputs except for a small pesticide‐free constant base flow.) This approach is actually equivalent to assuming that only a certain fraction of the catchment has been sprayed with the active substance of concern during the assessment year (i.e. 33% for ditches and 20% for streams). In other words, crop rotations are already included in the current FOCUS surface water modelling by ‘space for time’ substitution.
Spray drift entries are duly added to the run‐off/erosion and drainage entries in the simulated year. Note that for FOCUS ponds and ditches, spray drift only enters from the adjacent field (30 and 100 m in length, respectively), while for FOCUS streams, the spray drift deposition from the 100 m stretch is multiplied by a factor of 1.2 to account for a presumed 20% spray drift deposition from the upstream catchment, passing through the simulated stretch of stream at the same time as the 100% deposition from the adjacent 1‐ha field (FOCUS, 2001).
With this in mind, the FOCUS Surface Water Repair WG considers that there are two options, now that the assessment period will be extended from 12–16 months to 20 years:
Follow the approach taken in the FOCUS groundwater group, by creating extended weather data sets of 46 and 66 years, allowing the users to select application ‘every other year’ (46 years simulation) or ‘every third year’ (66 years simulation). In this case, the upper boundary condition defining the pesticide concentration in the water entering the 100 m reach simulated by TOXSWA should be re‐defined to prevent any additional dilution.
Continue to use the virtual upstream catchment supplying water and the active substance of concern to the inlet of the ditch and stream in TOXSWA. In this case, applications should be made to the simulated field every year, as the upstream catchment already accounts for the fact that not all the catchment is sprayed in any single year. However, it is not clear how the pond scenarios should be handled if this option is chosen, as it may be considered far too conservative to simulate applications every year to the treated field for 20 years, without allowing for dilution from an upstream catchment area.
Because of the additional model development that would be needed and also to maintain consistency with the current approach, the FOCUS Surface Water Repair WG recommends the second option (keeping the virtual upstream catchment and implicitly accounting for crop rotations already in the standard Step 3 calculations). As concentrations in the water phase of the FOCUS ponds are usually much lower than in the FOCUS streams and ditches, the FOCUS Surface Water Repair WG does not see the need to adapt the FOCUS pond modelling strategy in Step 3 accordingly.
3.8. Other changes made in the models outside the mandate
3.8.1. Revision of the run‐off curve numbers in perennial tall crops
The parameterisation of the RCN for perennial tall crops (vines, pome/stone fruit, citrus, olives and hops) in the FOCUS run‐off scenarios (FOCUS, 2001) assumes a fairly good vegetation cover within and between the crop rows. Based on a survey by Beulke et al. (2015), it appears no longer defensible to simulate surface run‐off for these crops, assuming a complete and well‐established vegetation cover as currently performed in FOCUS sw. According to Beulke et al. (2015), there is no vegetation cover (grass, weeds, etc.) within the crop rows in the majority of these crops. Usually, citrus, olives and hops also do not have a vegetation cover between the crop rows, whereas pome/stone fruit and vines often do have cover (Beulke et al., 2015). The issue of ground coverage in perennial tall crops was also discussed in the GERDA report in the context of pesticide interception (Bach et al., 2016, 2017a,b). Finally, two additional crops were defined in the GERDA database to account for partially or missing vegetation cover in vineyards. These two crops have lower values of maximum ground cover (PRZM parameter COVMAX) and higher RCNs than the standard FOCUS sw crops, assuming full vegetation cover. The RCNs of the new crops were set to ‘fallow’ for ‘vineyards and orchards without grass cover’ and ‘woods, fair conditions’ for ‘vineyards with partial grass cover’. In analogy to the parameterisation of the two additional crops in GERDA, the FOCUS Surface Water Repair WG recommends changing the RCN parameterisation of the five perennial tall crops in FOCUS sw as given in Table 9. The proposed changes have been made in the FOCUS PRZM version resulting from this working group.
Table 9.
Current and new proposed run‐off curve number (RCN) parameterisation (antecedent moisture conditions II) of perennial tall crops in FOCUS sw
| Current parameterisation | New parameterisation | |||||||||
|---|---|---|---|---|---|---|---|---|---|---|
| FOCUS sw scenario | R1 | R2 | R3 | R4 | Land use, hydrologic conditionsa | R1 | R2 | R3 | R4 | Land use, hydrologic conditionsa |
| Hydraulic soil group | C | B/C | C | C | C | B/C | C | C | ||
| Citrus | na | na | na | 70 | ‘Woods, good’ | na | na | na | 91 | ‘Fallow’ |
| Hops | 70 | na | na | na | 91 | na | na | na | ||
| Olives | na | na | na | 70 | na | na | na | 91 | ||
| Pome/stone fruit | 70 | 63a | 70 | 70 | 73 | 67a | 73 | 73 | ‘Woods, fair’ | |
| Vines | 70 | 63a | 70 | 70 | 73 | 67a | 73 | 73 | ||
It is noted that these changes substantially increase the frequency and magnitude of surface run‐off events in citrus, hops and olives. However, this is partly compensated, as due to changes in the modelling approach, irrigation does no longer cause surface run‐off. In summary, both changes lead to a more realistic representation of surface run‐off in tall permanent crops.
3.8.2. Calculation of subsurface drainage water by PRZM entering the FOCUS waterbodies in the run‐off scenarios
In the FOCUS run‐off scenarios, the PRZM model calculates a daily downward water flux at 1 m soil depth. A fraction of this flux drains into the streams or pond as a third discharge component (in addition to baseflow and surface run‐off) representing shallow groundwater flow. In the current scenarios, this has been performed based on monthly averages of the daily fluxes. The daily downward water fluxes at 1 m soil depth are summed up for each month and expressed as hourly fluxes, which are therefore constant during the month (Adriaanse et al., 2017). A scenario‐specific fraction of these hourly fluxes (0.03 for R2 and R3 and 0.1 for R1 and R4) forms an input to the water balance of the TOXSWA model (FOCUS, 2001). The remaining fraction is assumed to be deep groundwater recharge. This procedure was designed to avoid strong peak subsurface fluxes into the FOCUS waterbodies at the day of the run‐off event, which would lead to dilution of pesticide concentrations in the streams. However, a consequence of this procedure using calendar months is that precipitation events occurring later in the month already increase the shallow groundwater inflow occurring earlier during the month.
This does not reflect reality, and therefore, the FOCUS Surface Water Repair WG decided to replace the current procedure by a new linear reservoir approach having direct inflow of the daily fluxes. The daily downward water fluxes calculated by PRZM are assumed to enter a fictitious shallow groundwater reservoir that discharges a daily flux to the stream (mm/day) equal to a factor KGW (1/day) times the groundwater storage (mm),13 with KGW representing the inverse of the mean residence time in the reservoir (or transit time), having a value of 0.05/day (corresponding to a transit time of 20 days). The rest of the procedure is unchanged: the daily fluxes are evenly distributed over 24 h and a scenario‐specific constant fraction of these fluxes is fed into the TOXSWA water balance equation.
3.8.3. Revision of the water temperature in TOXSWA
In the current FOCUS surface water scenarios, a monthly average water temperature is used in the scenario calculations, equal to the monthly average air temperature of the location of the meteorological station belonging to each of the 10 scenarios. In the repaired FOCUS surface water scenarios, this approach was improved by using a moving 3‐day average air temperature (of the day itself and the 2 previous days) to represent the daily water and sediment temperature in the scenario calculations (Appendix R). Note that the temperature in water and sediment will influence not only the transformation rates in water and sediment but also the volatilisation rate (Beltman et al., 2017).
To obtain insight in the effect of the changed temperature on the concentration profiles, two simulations were performed with the current model suite (i.e. unrepaired) for winter cereals: the R1 pond in Weiherbach and the D5 pond in La Jaillière with two applications of 1 kg/ha and a 2‐week application interval in autumn and spring, respectively. The used application window in SWASH was 27 October to 15 December, resulting in selected application dates of 27 November and 11 December 1978 for the D5 pond, and 1 March to 30 April, resulting in selected application dates of 17 March and 26 April 1984 for the R1 pond. The used dummy substance was E (DegT50,soil = DegT50,sed = 30 days, DegT50,water = 10 days and Koc = 100 mL/g). The two simulations were performed for the current temperature input (i.e. monthly values) and next with changed temperature input files (.met), containing the moving 3‐day average daily temperatures.
Concentrations as a function of time for the R1 pond (Figure 2) show that the changes in temperature in water and sediment only have a slight effect. Both in water and in sediment, the difference is largest from approximately day 30 to day 40 after 1 March 1984, i.e. 1 April to 10 April 1984. Scrutinising the temp. input files reveals that the monthly average temperature is 281.5 K, while from 1 April to 9 April included the daily temperature ranges from 277 to 279 K. These lower temperatures result in a slower degradation in water and sediment, and so in higher concentrations for the simulation with daily temperatures.
Figure 2.
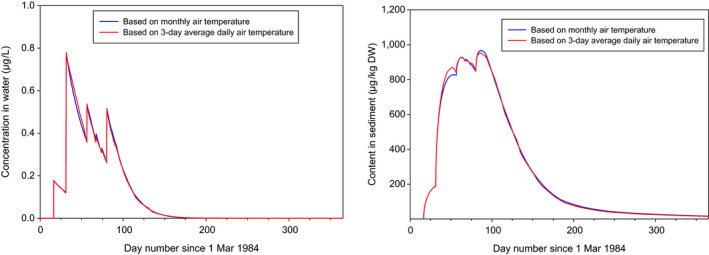
Comparison of concentration in water (μg/L) and sediment (0–5 cm, μg/kg dry sediment) of the R1 FOCUS pond (Weiherbach, Germany) with monthly vs. daily temperatures
A similar slight effect is seen for the D5 pond (Figure 3). The changed temperature hardly influences the water concentration and 0–5 cm sediment content as a function of time. A clear difference can be seen at the peak concentration in water around day 410, i.e. 14 February 1979. The monthly average temperature for February 1979 is 279.4 K, while the daily temperatures from 6 February to 14 February 1979 included range from 281 K up to 283 K. These higher temperatures lead to faster degradation, and therefore, the concentration peak in water is lower for the daily temperature input than for the higher constant monthly temperature.
Figure 3.
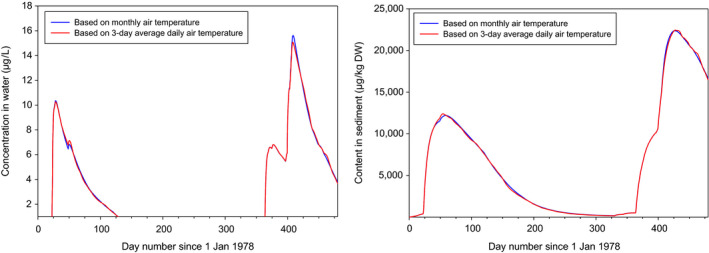
Comparison of concentration in water (μg/L) and sediment (0–5 cm, μg/kg dry sediment) of the D5 FOCUS pond (La Jaillière, France) with monthly vs. daily temperatures
So, the conclusion is that the new daily temperature in water and sediment (based upon a moving 3‐day average air temperature) does not lead to significant changes in simulated water and sediment concentrations in the repaired FOCUS surface water scenarios.
4. Comparison of old and revised FOCUS surface water scenarios
Based on an extensive modelling exercise, performed by the FOCUS Surface Water Repair WG to investigate drainage or run‐off induced PECs of several dummy substances with different PAT options, it can be concluded that the current FOCUS approach inadequately reflects PECs obtained for the full 20‐year assessment period (Appendix I). This is particularly true for substances that are sensitive to the rainfall pattern, i.e. for substances with a short DegT50 and a low Koc. Note that the current FOCUS approach is based on a single‐year assessment period, which of course does not adequately mirror seasonal patterns observed based on the entire 20‐year assessment period. Although the FOCUS PAT was introduced to reduce variability in PECs in relation to the intended application date, the current FOCUS approach is clearly affected by significant ‘erratic’ changes in PECs depending on the actual application date. Shifting the application window of the current FOCUS PAT by only 1 day may lead to drastic changes in the PEC that are no longer the case for the 20‐year assessment period (also refer to the example calculations, Appendix K). Note that this sensitivity towards the application timing is one of the major criticisms of the current approach.
As the single‐year period of the current FOCUS approach is part of the new 20‐year assessment period, maximum PECs obtained with the current FOCUS approach are within the range of the annual maximum PECs obtained for the individual 20 years based on the new assessment approach (disregarding other changes made in the models). However, depending on the actual application date, the current approach fluctuates considerably between the low and high temporal percentiles of the new multiyear approach. So, in some time periods, the current FOCUS approach may give PECs far below, for example, the 52.5th temporal percentile PEC in the new approach, whereas in other, more limited time periods, the current FOCUS approach may give PECs close or identical to the maximum (97.5th temporal percentile) PECs in the new approach. Note that the alignment between the new 20‐year assessment approach and the current FOCUS approach is much better for substances that are less sensitive to the rainfall pattern (i.e. substances with a longer DegT50 and higher Koc). Differences between the current and new approach are, of course, most evident for PECs driven by drainage or run‐off. Differences are much less pronounced for PECs driven by drift, as drift deposition is constant throughout the entire assessment period. Note, that for multiple applications, PECs in the new assessment approach are systematically higher due to changes in the setting of the drift percentiles (also refer to Appendix I).
Overall, it can be concluded that the new 20‐year assessment delivers annual maximum PECs which are in the range of the current FOCUS approach. Higher temporal percentiles in the new approach are more related to the upper extremes in the current approach, whereas average temporal percentiles (e.g. the 52.5th percentiles) are more in line with lower PECs in the current approach. However, in contrast with the current approach, the new assessment is much more robust, with significantly less variability in PECs (for a given temporal percentile) in relation to the actual application date.
Example calculations on how the new 20‐year assessment period performs in comparison with the current FOCUS approach are given in Appendix K.
5. Overview on changes made in the models (including the revised PAT)
Table 10 gives an overview on all changes finally made by the FOCUS Surface Water Repair WG in the models SWASH, MACRO, PRZM and TOXSWA, including the revised PAT. For details, please refer to the sections given for each of the topics.
Table 10.
Overview on changes made in weather data and in the models SWASH, MACRO, PRZM and TOXSWA, including the revised PAT
| Topic | Current approach (FOCUS, 2001) | New approach | Reasoning | Section |
|---|---|---|---|---|
| SWASH | ||||
| Intended application date(s) | Not applicable; user specific application window (see PAT) | Selected by SWASH based on the BBCH stage; predefined application dates for each BBCH stage for each crop/scenario combination; may be changed by user if justified; data read from AppDate output file (BBCH.out) | Increase in robustness and transparency | 3.5.3 |
| Maximum number of applications | 8 | 50; drift percentiles do not decrease further if number of applications > 8 | Increase in user friendliness | 3.5.3 |
| Application interval | Fixed | Individual intervals possible | Increase in user friendliness | 3.5.3 |
| Crop interception | Internally calculated by PRZM/MACRO | Specified by SWASH based on the BBCH stage applying predefined crop interception values; may be changed by user if justified | Harmonisation of exposure models; increase in transparency and user friendliness | 3.1.4 |
| Drift percentiles for multiple applications | Same for all applications | Last application set to the 90th percentile | Increase in robustness | 3.1.5 |
| Vines (spray drift curves) | ‘Vines, early applications’ or ‘vines, late applications’ with different spray drift curves; expert judgement | ‘Vines’ only (with late applications drift curve attached); drift curves for ‘vines, early applications’ removed | Increase in reliability | 3.5.4 |
| Pome/stone fruit (spray drift curves) | ‘Pome/stone fruit, early applications’ or ‘pome/stone fruit, late applications’ with different spray drift curves; expert judgement | ‘Pome/stone fruits’ only; SWASH applies ‘early applications’ drift curve to BBCH 09–69 and BBCH 97–99; ‘late applications’ spray drift curve is applied to BBCH 71–95; cannot be changed by user | Increase in robustness and user friendliness | 3.5.4 |
| Ground spray in tall permanent crops | Not applicable | Yes; no soil coverage below the crop canopy in citrus, olives and hops (no crop interception); some soil coverage below the crop canopy in pome/stone fruits and vines (default crop interception = 45%); drift curve in line with low arable crops | Increase in user friendliness | 3.1.4 |
| Pre‐harvest Interval | Not applicable | User entered, to cross check application dates | Increase in user friendliness | Not mentioned |
| Report file | Existing | Expanded; e.g. information on final application dates and warnings when user changed input on, e.g. crop interception are included | Increase user friendliness | Not mentioned |
| PAT | ||||
| Application window | At least 31 + [(n − 1) × i] days (n = number of applications; i = interval); first and last day specified by user; expert judgement | Not applicable; replaced by the so‐called extension period starting 3 days before the first intended application date and ending 3 days after the last intended application date; length of extension period cannot be changed by user | Increase in robustness and transparency | 3.4 |
| Initial rainfall criteria | 2‐mm rainfall criterion (max. 2 mm rainfall on 5 days consecutively around the day of application); 10‐mm rainfall criterion (10 mm rainfall within the next 10 days) | Only 2‐mm rainfall criterion (max. 2 mm rainfall on 5 days consecutively of application); 10‐mm rainfall criterion removed | 10‐mm rainfall criterion not considered defensible because of multiyear assessment | 3.4 |
| Rainfall cut‐off criterion | No | Yes (no application on day with a rainfall ≥ 18 mm) | Necessary to avoid application on days with rainfall ≥ 18 mm | 3.4 |
| MACRO | ||||
| Assessment time period | 16 months | 20 years; new MARS25 data added for D1 and D6 | Increase in robustness and reliability | 3.1.1 |
| Warming‐up period | 6‐year warming‐up period (1988–1993) | New 6‐year warming‐up period added; years selected based on average properties | Necessary to account for accumulation in soil and sediment | 3.1.2 |
| Irrigation | Predefined irrigation amounts added as rainfall | Irrigation calculated internally based on water balance; no irrigation on days with application | Increase in robustness; harmonisation with other exposure models | 3.1.3 |
| Irrigation options | Not applicable; irrigation added as rainfall | Irrigation over the crop canopy (annual and low permanent crops); irrigation under the crop canopy (tall permanent crops) | Increase in robustness; harmonisation with other exposure models | 3.1.3 |
| Crop interception | Calculated based on internal crop growth model | Predefined crop interception provided by SWASH (see SWASH) | Increase in robustness; harmonisation with other exposure models | 3.1.4 |
| PRZM | ||||
| Warming‐up period | No warming‐up period | 6‐year warming‐up period added; years selected based on average properties | Necessary to account for accumulation in soil and sediment | 3.1.2 |
| Irrigation | Predefined irrigation amounts added as rainfall; irrigation induces run‐off | Irrigation calculated internally based on water balance; no run‐off due to irrigation; no irrigation on days with application | Increase in robustness; harmonisation with other exposure models | 3.1.3 |
| Irrigation options | Not applicable; irrigation added as rainfall | Sprinkler irrigation over the crop canopy (annual crops); sprinkler irrigation under the crop canopy (tall permanent crops) | Increase in robustness; harmonisation with other exposure models | 3.1.3 |
| Crop interception | Calculated based on internal crop growth model | Predefined crop interception provided by SWASH (see SWASH) | Increase in robustness and transparency; harmonisation with other exposure models | 3.1.4 |
| Wash‐off | On days with application rainfall generating wash‐off is not reduced | On days with application rainfall generating wash‐off is reduced by 18 mm (assuming 9 h of rainfall before application with a rainfall intensity of 2 mm/h) | Harmonisation between models | 3.4 |
| Wash‐off calculation | Based on rainfall | Based on throughfall | Bug | 3.4 |
| Spring point for winter crops | Not present | Implemented | Increase in robustness and transparency; harmonisation with other exposure models | 3.1.7 |
| Run‐off curve number (RCN) parameterisation for pome/stone fruits, vines, hops, citrus and olives | RCNs based on ‘woods, good conditions’ | RCNs for citrus, olives and hops based on ‘fallow conditions’; RCNs for pome/stone fruits and vines based on ‘woods, fair conditions’ | Increase in reliability taking into account new data on soil coverage in tall permanent crops (Beulke et al., 2015) | 3.8.1 |
| Calculation of subsurface drainage water at 1‐m soil depth | Monthly average values; constant hourly flux for the entire month | Linear reservoir approach based on daily percolation | Increase in reliability | 3.8.2 |
| TOXSWA | ||||
| Warming‐up period | No warming‐up period | 6‐year warming‐up period in line with MACRO/PRZM | Necessary to account for accumulation in sediment | 3.1.2 |
| Exposure end‐point | Annual maximum and time weighted average PECsw and PECsed for an evaluation period of 12 months (run‐off) or 16 months (drainage) | Annual maximum and time weighted average PECsw and PECsed for the XXth temporal percentile (Hazen plotting position) | Necessary to account for multiyear assessment | 3.6.1 |
| Type of PECsed end‐point | μg/kg dry sediment mass | μg/kg dry sediment mass; μg/kg organic matter mass; μg/L pore water | New guidance requirement (EFSA PPR Panel, 2015) | 3.6.4 |
| Averaging depth for PECsed | 5 cm | 1 cm; 5 cm | New guidance requirement (EFSA PPR Panel, 2015) | 3.6.4 |
| Metabolite formation in the upstream catchment of streams | Correction factor for metabolite formation in upstream catchment of stream based upon hydrology of 12‐ to 16‐month evaluation year | Correction factor for metabolite formation in upstream catchment of stream based upon hydrology of 20 evaluation years | Necessary to account for multiyear assessment | 3.1.6 |
| Water temperature | Monthly average air temperature | Moving 3‐day average air temperature (on the day itself and the 2 previous days) | Increase in reliability | 3.8.3 |
| Output files | One output file, not user friendly | Five additional column‐oriented.csv files | Increase in user friendliness | Not mentioned |
6. Conclusions
The European Commission asked EFSA in 2016 to undertake this task after a consultation of Member States. The European Commission requested EFSA to address the following Terms of Reference:
Introduce into all FOCUS surface water scenarios (both run‐off and drainage) a 20‐year assessment period instead of the current 12‐ or 16‐month assessment period.
Because of the 20‐year assessment period, the way application dates are defined needs to be reviewed, i.e. PAT ((Pesticide Application Timing calculator) functionality used/modified or not and if used which year to run PAT within the context of dates for 20 years, is a critical task to be investigated and approach agreed.
Add substance parameter input selection guidance when these parameters are correlated with the soil properties, e.g. pH.
Foliar wash‐off coefficient used in MACRO and PRZM and the equation used to describe foliar wash‐off to be reviewed. The description of wash‐off in FOCUS SW was questioned in EFSA Opinion on scenarios for PECsoil (EFSA Journal 2012;10(2):2562).
Repair should ensure that processing times of revised weather scenario definitions are not excessive and results are still easily produced and reproduced as part of regulatory assessments.
Repair should consider how the results are to be presented and used in risk assessment.
Repair to consider how rotational crops are to be dealt with in risk assessment.
In the FOCUS run‐off scenarios, complete 20‐year MARS50 weather data have already been implemented by the FOCUS WG in 2001. The FOCUS Surface Water Repair WG considers these data still appropriate for the multiyear assessment approach without changes. However, a warming‐up period of 6 years has been added also for the run‐off scenarios to account for the potential accumulation in soil and sediment of more persistent substances.
For the FOCUS drainage scenarios, the FOCUS Surface Water Repair WG used the original MARS50 weather data originally considered by the FOCUS WG as far as possible. It is noted that for the two scenarios D1‐Lanna and D6‐Thiva only 14‐year and 18‐year periods, respectively, have been available. To extend the data sets for these two scenarios to cover the entire 20‐year assessment period, the FOCUS Surface Water Repair WG added weather data from the new MARS25 database on the basis of their locations (co‐ordinates) specified by the FOCUS WG. For pragmatic reasons, the FOCUS Surface Water Repair WG simply added the 6 subsequent years (1995–2000) for D1‐Lanna and 2 years (1995–1996) for D6‐Thiva. The FOCUS WG used a 6‐year warming‐up period from 1988 to 1993 for all drainage scenarios without further justification of the selection of years in this period. For the new 20‐year assessment period, a more consistent but simple method to select the 6 warming‐up years for the drainage scenarios was employed.
The FOCUS Surface Water Repair WG concluded that, to avoid inconsistencies with the water balance, irrigation events should not be scheduled with an external model such as ISAREG, but should be calculated within PRZM and MACRO based on internal water balances. Consequently, the FOCUS Surface Water Repair WG made use of the internal irrigation routines in PRZM and adapted them when necessary. Finally, MACRO has been adapted to calculate irrigation in an analogous way to PRZM.
To align crop interception with approaches used in other exposure models (e.g. FOCUS groundwater and soil exposure), the FOCUS Surface Water Repair WG concluded that MACRO and PRZM should no longer internally calculate crop interception. Instead, in the repaired FOCUS sw scenarios, predefined default FOCUS crop interception values are used based on the crop BBCH stage. This procedure ensures that the same crop interception is used in MACRO and PRZM as well as in all other exposure models. The FOCUS Surface Water Repair WG considers the default crop interception values used in the FOCUS groundwater scenarios and FOCUS surface water Step 2 (for olives only) to be the most appropriate.
The FOCUS Surface Water Repair WG considers the assumption of a cumulative drift probability of 90th percentile to determine the PECmax no longer justified, as spray drift deposition events should be considered as separate events if they do not lead to accumulation in the simulated watercourse. Very often the mass input to the watercourse due to spray drift has already flowed out before the next spray drift deposition event. In contrast, in ponds, the hydraulic residence time is in the order of at least 50 days and often more, so that spray drift depositions may indeed accumulate and using the cumulative drift deposition is justified. Overall, there is no straightforward solution for a drift percentile approach, which is valid for all types of water bodies (ditch, stream and pond) as well as all environmental compartments (water and sediment). As a pragmatic approach, the FOCUS Surface Water Repair WG changed the current procedure for multiple applications, setting the drift deposition for the last application in an application season to the 90th percentile, keeping the reduced percentile for all other applications. In this way, care is taken that there is at least one 90th percentile drift event in an application season without overestimating the entire load to the waterbody. This approach also makes the usual ‘single application’ run for multiple applications obsolete.
The exposure to metabolites has not been changed compared with the current situation, except for the factor accounting for metabolites formed in the water of the upstream catchment of FOCUS streams. In the repaired FOCUS scenarios, the correction factor for metabolite formation in the upstream catchment is now based on the average water temperature and most conservative residence time of the 20‐year evaluation period for each FOCUS sw scenario. To avoid being overly conservative, it has been checked that the most conservative hydraulic residence time used to calculate the correction factor was not an extreme case, i.e. the last‐but‐one most conservative residence was used.
Because of the new 20‐year assessment period, the selection procedure for individual application dates was reconsidered by the FOCUS Surface Water Repair WG investigating different PAT options. The FOCUS Surface Water Repair WG kept the initial 2‐mm rainfall criterion (i.e. maximum 2 mm of rainfall on 5 days consecutively around application) introduced with the current FOCUS PAT, as this is considered to mirror GAP. However, the second initial rainfall criterion (i.e. at least 10 mm of rainfall occurring within the next 10 days) is not considered defensible anymore, as different rainfall patterns in the 20 years compensate each other. Next, the FOCUS Surface Water Repair WG tested shorter application windows as currently used in FOCUS sw. As a result, the FOCUS Surface Water Repair WG considers an application window of 7 days (for a single application) a reasonable compromise: (i) allowing a limited number of applications on less favourable days, (ii) excluding extreme run‐off/drainage events, (iii) reducing the day‐to‐day variability in PECs with respect to application timing and (iv) respecting the proposed GAP (BBCH stage) as far as possible. So, for a single application, the application window in the revised FOCUS sw scenarios is set to ± 3 days around the intended application date (the so‐called extension period in the revised PAT). For multiple applications, the application window now covers the period from 3 days before the first intended application to 3 days after the last intended application.
In cases in which substance properties depend on soil pH, the FOCUS Surface Water Repair WG recommends performing calculations for two contrasting soil pH values in line with recommendations given for the FOCUS groundwater scenarios. If there is a significant change in substance properties within a soil pH range from 5.1 to 8.0 (i.e. the 10th and 90th percentile, respectively, for arable and permanent crops in the EU), it is recommended to perform two individual calculations assuming substance properties representative for soil pH values of 5.1 and 8.0 and to report the results from both runs. In contrast to soil pH, the clay content (soil texture) is considered part of the scenario definition and clearly linked to scenario vulnerability with respect to losses of pesticides by drainage and run‐off/erosion. So, the FOCUS Surface Water Repair WG does not see the need to use any other clay content to calculate representative substance properties than the clay contents of the soil horizons of the scenario.
The FOCUS Surface Water Repair WG thoroughly investigated the foliar wash‐off routines in MACRO and PRZM for varying half‐lives on the crop canopy and wash‐off coefficients. It was concluded that wash‐off simulated in the two models is generally similar, except for applications on days with rainfall. For these specific days, the FOCUS Surface Water Repair WG adapted the wash‐off calculation routines in PRZM to bring wash‐off more in line with MACRO, in which a rainfall of less than 18 mm on the day of application does not contribute to wash‐off.
The FOCUS Surface Water Repair WG notes that the processing time of PRZM will hardly change as it already runs for 20 years with the current FOCUS scenarios (note that in the revised scenarios 6 warming‐up years have been added). MACRO is expected to have similar run‐times compared with the FOCUS groundwater scenario Châteaudun, which also runs for a 20‐year assessment period (+ 6 warming‐up years). TOXSWA was improved by enabling the TOXSWA shell to distribute the runs of one project between available processors of the computer, so considerably shortening the project run‐time.
The FOCUS Surface Water Repair WG changed the procedure for PAT, which reduces the variability of input parameter selections related to application timing and therefore increases user confidence in the simulated surface water concentrations. The new approach is based on a close link between the BBCH stage (which is well defined for each application according to the GAP) and the calendar date at which this BBCH stage is reached at each scenario location. In the new SWASH software, this approach is used to determine the so‐called intended application dates. For a single application, the intended application date is always set at the first calendar date, which is specified for a given BBCH stage. For multiple applications, intended application dates are determined according to the BBCH period, the number of applications and a standard interval between applications. The actual application dates, which may vary in each of the 20 assessment years according to rainfall, are finally determined by the revised PAT based on the intended application dates (applying an extension period of ± 3 days) relaxing the rules if necessary.
The FOCUS Surface Water Repair WG excluded drift values for ‘vines early’ in the exposure assessment as these drift values are based on application techniques, which are not standard farming practice for application in early vines. Furthermore, the FOCUS Surface Water Repair WG adapted the SWASH software using the more conservative drift data for ‘pome/stone fruits, early’ from BBCH 09 to 69 and the less conservative drift data ‘pome/stone fruits, late’ from BBCH 71 to 95, switching back to ‘pome/stone fruits, early’ at BBCH 97 and onwards.
In the new 20‐year assessment approach, the selection of a temporal percentile may have a strong impact on the exposure end‐point (i.e. the annual maximum PEC in water or sediment), particularly if the exposure assessment is driven by drainage or run‐off. In this respect, the FOCUS Surface Water Repair WG considers the 50th temporal percentile the lower limit to be selected and the 90th temporal percentile the upper limit. The lower temporal percentile, which is in line with the targeted 50th temporal percentile hydrological year selected by the FOCUS WG in 2001, reveals PECs that are more related to average and lower PECs in the current FOCUS approach, whereas the higher percentile covers the current FOCUS approach in most cases. It is self‐evident that any percentile in between these two values could be selected. The FOCUS Surface Water Repair WG wants to make RMs aware that a temporal percentile close to the 90th (rather than the 50th percentile) for the run‐off/drainage entries would correspond better to the original intentions of the FOCUS working group of 1996–2001 of aiming at an overall 90th temporal percentile. At the same time, the FOCUS Surface Water Repair WG wants to mention that the spatial percentile of the FOCUS surface water scenarios was difficult to quantify, but it has not changed between the current and the repaired scenarios. Risk managers should also be aware that a fixed definition of a simple temporal percentile may not be suitable to cover the wide range of possible effect situations. So, a temporal percentile may also be selected by integrating effects modelling and overall exposure pattern.
The current FOCUS sw Step 2 does not necessarily cover the new FOCUS sw Step 3 approach. The FOCUS Surface Water Repair WG, therefore, recommends reconsidering the parameterisation at FOCUS sw Steps 1 and 2, particularly with respect to default entries into the waterbody by drainage/run‐off. This may also include reconsideration of the period from (last) application to drainage/run‐off (currently 4 days in FOCUS sw Step 2). The revision of FOCUS sw Steps 1 and 2 should also take care of the new proposed drift percentile setting for multiple applications.
In the repaired FOCUS scenarios, sediment exposure is now expressed in total content on OM basis (μg/kg OM), total content on dry sediment mass basis (μg/kg dry sediment mass) and pore water basis (μg/L). Moreover, concentrations are averaged over the top 1 and 5 cm for the risk assessment for benthic invertebrates or plants, respectively, as was suggested by the EFSA Opinion on effect assessment on sediment organisms (EFSA PPR Panel, 2015). The FOCUS Surface Water Repair WG demonstrated that the current, as well as repaired, FOCUS surface water scenarios do not result in conservative estimates of the PEC in sediment, due to the relatively low OC content of 5% in the sediment. It also notes that the PECsed values do not represent ‘best‐case’ exposure values, as the concentrations in the overlying water layer are intended to represent ‘realistic worst‐case’ concentrations and these water concentrations form one of the main driving factors for the PECsed. The FOCUS Surface Water Repair WG, therefore, recommends the development of a second set of scenarios to predict ‘realistic worst‐case’ exposures in sediment to promote a scientifically sound risk assessment for benthic organisms and rooted water plants.
The FOCUS Surface Water Repair WG notes that the upstream catchment concept implemented in the FOCUS surface water scenarios for streams and ditches already accounts for the fact that not the whole catchment area is treated with the simulated pesticide in any given year. This approach is equivalent to assuming that only a certain fraction of the catchment is covered with the simulated crop during the assessment year (i.e. 33% for ditches and 20% for streams), and so not the whole area of this crop is treated. In other words, effects of crop rotations are already indirectly included in the current FOCUS surface water modelling by ‘space for time’ substitution.
The parameterisation of the RCNs for perennial tall crops (vines, pome/stone fruit, citrus, olives and hops) in the FOCUS run‐off scenarios (FOCUS, 2001) assumes a fairly good vegetation cover within and between the crop rows. Based on newly available data, it appears no longer defensible to simulate surface run‐off for these crops assuming a complete and well‐established vegetation cover as currently performed in FOCUS sw. The RCNs for these crops have therefore been adapted leading to a more realistic representation of surface run‐off in tall permanent crops.
The FOCUS Surface Water Repair WG decided to replace the current procedure to calculate subsurface drainage water entering the waterbodies into the run‐off scenarios by a new and more realistic reservoir approach having direct inflow of the daily fluxes.
In the current FOCUS surface water scenarios, a monthly average water temperature is used in the scenario calculations, equal to the monthly average air temperature of the location of the meteorological station belonging to each of the 10 scenarios. In the repaired FOCUS surface water scenarios, this approach was improved by using a moving 3‐day average air temperature (of the day itself and the 2 previous days) to represent the daily water and sediment temperature in the scenario calculations.
Overall, it can be concluded that the new 20‐year assessment delivers annual maximum PECs which are in the range of the current FOCUS approach. However, in contrast with the current single‐year approach, the new assessment is much more robust with significantly less variability in PECs (for a certain temporal percentile) in relation to the application timing.
7. Recommendations
Beside major changes of the FOCUS surface water scenarios proposed to meet the Terms of Reference, the FOCUS Surface Water Repair WG recommends some minor improvements to the scenarios to improve user friendliness. Suggested smaller, technical improvements are listed in Appendix J.
While the aquatic effect assessment is based on well‐defined effect protection goals (the so‐called Specific Protection Goals (SPG), further operationalised in effect assessment goals (EfAGs)), the FOCUS surface water scenarios are not based upon explicit and well‐defined exposure assessment goals (ExAGs), as was already indicated in EFSA PPR Panel (2013b, aquatic guidance document, p. 12) Although some major flaws in the current FOCUS surface water scenarios (developed at the end of the 1990s) were repaired, as was requested by the mandate, the overall level of protection of the aquatic ecosystem is still not well defined. Therefore, the FOCUS Surface Water Repair WG recommends the development of entirely new surface water scenarios complying with the most recent exposure assessment methodology based upon the explicit definition of ExAGs specifying the desired percentile of the magnitude of exposure in time and space, considering all possible exposure concentrations in all relevant waterbodies as a function of time (i.e. the space–time domain). The EFSA has already gained experience with defining ExAGs according to this methodology for, e.g. soil organisms (EFSA, 2010) and bees (EFSA, 2013c. A proposal for ExAGs for aquatic risks at EU level has recently been worked out by Boesten (2018).
The FOCUS Surface Water Repair WG recommends the development of specific European scenarios for exposure in sediment, as the FOCUS Surface Water Repair WG demonstrated that the level of the protection of PECsed of the current FOCUS surface water scenarios with their relatively low OC content of 5% may result in an underestimation of risks (Appendix N).
Abbreviations
- AUC
area under the curve
- CV
coefficient of variation
- DegT50
Degradation half‐life for the total system (day)
- DW
drain water
- ECPA
European Crop Protection Association
- ERC
Ecotoxicological relevant concentration
- FOCUS
FOrum for the Co‐ordination of pesticide fate models and their USe
- GAP
Good Agricultural Practice
- GDD
Growing degree‐days
- ISAREG
Soil water balance simulation model aimed at establishing irrigation scheduling programs for a given soil‐climate‐crop combination
- JRC
Joint Research Centre
- KOC
Sorption coefficient for sorption on soil organic carbon (mL/g organic carbon)
- LAI
Leaf area index
- MACRO
Leaching model, specifically developed for addressing macroporous water flow in soils
- MARS
Monitoring Agriculture by Remote Sensing
- OC
Organic carbon
- OM
Organic matter
- PAT
Pesticide Application Timer
- PEC
Predicted environmental concentration
- PPP
Plan Protection Product
- PRZM
Pesticide Root Zone Model for calculating fate and behaviour of substances in the unsaturated zone of the soil
- PSN
Pesticide Steering Network
- RCN
Run‐off curve number
- RM
Risk manager
- RMSE
Root mean squared error
- SPG
Specific protection goal
- SWASH
Surface WAter Scenarios Help
- ToRs
Terms of reference
- TOXSWA
TOXic substances in Surface WAters
- VBA
Visual Basic for Applications
- VS
Variability score
- WG
Working Group
Appendix A – Selection of the warming‐up period for the FOCUS surface water run‐off scenarios
1.
The FOCUS Surface Water Repair WG concluded that the series of warming‐up years for the FOCUS surface water run‐off scenarios should be a series of 6 relatively ‘average’ years, not having extreme run‐off‐causing rainfall events, nor being extremely dry. Moreover, the last 2 years of the warming‐up period should have a reasonably regular distribution of the rainfall and associated run‐off and erosion events in time, i.e. there should be no series of months without any run‐off and erosion.
The warming‐up period is especially relevant for the formation of a ‘concentration plateau’ in the sediment before the exposure assessment period starts, so it is relevant for the PECsed. Pesticide entries into the sediment originate from pesticide mass in run‐off water and/or sorbed to eroded soil, so these two types of entries were considered while selecting ‘average’ years for the warming‐up period of run‐off scenarios.
The FOCUS Surface Water Repair WG ran the PRZM model for the non‐irrigated crops of winter cereals (R1‐Weiherbach, R3‐Bologna and R4‐Roujan) and maize (R2‐Porto) for 20 years and determined the number of run‐off and soil erosion events during the main application season (March to September included) and the winter season (October to February included, Tables A.1, A.2, A.3–A.4). The tables show that the number of run‐off events is always equal to the number of events with eroded soil entries.
Table A.1.
Overview of number of days with run‐off and eroded soil entries (for the non‐irrigated crop winter cereals) for the R1‐Weiherbach scenario from 1975–1994. The.zts file was used for the analysis
| March–September | October–February | Calendar year | |||
|---|---|---|---|---|---|
| Run‐off | Eroded soil | Run‐off | Eroded soil | Rainfall | |
| Number of days | Number of days | mm | |||
| 1975 January–February | – | – | 2 | 2 | – |
| 1975 | 15 | 15 | 7a | 7a | 806 |
| 1976 | 13 | 13 | 12 | 12 | 631 |
| 1977 | 7 | 7 | 6 | 6 | 680 |
| 1978 | 19 | 19 | 13 | 13 | 909 |
| 1979 | 8 | 8 | 15 | 15 | 658 |
| 1980 | 15 | 15 | 14 | 14 | 789 |
| 1981 | 13 | 13 | 20 | 20 | 882 |
| 1982 | 13 | 13 | 17 | 17 | 864 |
| 1983 | 13 | 13 | 11 | 11 | 679 |
| 1984 | 19 | 19 | 10 | 10 | 817 |
| 1985 | 13 | 13 | 11 | 11 | 602 |
| 1986 | 19 | 19 | 11 | 11 | 867 |
| 1987 | 18 | 18 | 13 | 13 | 777 |
| 1988 | 17 | 17 | 9 | 9 | 910 |
| 1989 | 6 | 6 | 14 | 14 | 628 |
| 1990 | 7 | 7 | 7 | 7 | 615 |
| 1991 | 5 | 5 | 8 | 8 | 500 |
| 1992 | 5 | 5 | 8 | 8 | 587 |
| 1993 | 9 | 9 | 7 | 7 | 623 |
| 1994 | 5 | 5 | 1b | 1b | 404 |
| Average 1975–1994 | 12.0 | 12.0 | 11.2 | 11.2 | 706 |
Numbers for October 1975 to February 1976 (etc. for entire column, except last cell).
Numbers for October 1994 to December 1994.
Table A.2.
Overview of number of days with run‐off and eroded soil entries (for the non‐irrigated crop maize) for the R2‐Porto scenario from 1975 to 1994. The.zts file was used for the analysis
| March–September | October–February | Calendar year | |||
|---|---|---|---|---|---|
| Run‐off | Eroded soil | Run‐off | Eroded soil | Rainfall | |
| Number of days | Number of days | mm | |||
| 1975 January–February | – | – | 13 | 13 | – |
| 1975 | 13 | 13 | 26a | 26a | 1,126 |
| 1976 | 13 | 13 | 71 | 71 | 1,434 |
| 1977 | 21 | 21 | 51 | 51 | 1,905 |
| 1978 | 21 | 21 | 55 | 55 | 1,706 |
| 1979 | 24 | 24 | 47 | 47 | 1,712 |
| 1980 | 21 | 21 | 22 | 22 | 1,240 |
| 1981 | 23 | 23 | 44 | 44 | 1,354 |
| 1982 | 10 | 10 | 39 | 39 | 1,301 |
| 1983 | 23 | 23 | 42 | 42 | 1,377 |
| 1984 | 16 | 16 | 53 | 53 | 1,838 |
| 1985 | 22 | 22 | 44 | 44 | 1,505 |
| 1986 | 22 | 22 | 33 | 33 | 1,586 |
| 1987 | 21 | 21 | 59 | 59 | 1,866 |
| 1988 | 13 | 13 | 21 | 21 | 1,256 |
| 1989 | 13 | 13 | 52 | 52 | 1,368 |
| 1990 | 6 | 6 | 43 | 43 | 1,161 |
| 1991 | 18 | 18 | 24 | 24 | 1,309 |
| 1992 | 10 | 10 | 17 | 17 | 806 |
| 1993 | 19 | 19 | 36 | 36 | 1,053 |
| 1994 | 11 | 11 | 21b | 21b | 1,126 |
| Average 1975–1994 | 17.0 | 17.0 | 41.0 | 41.0 | 1,416 |
Numbers for October 1975 to February 1976 (etc. for entire column, except last cell).
Numbers for October 1994 to December 1994.
Table A.3.
Overview of number of days with run‐off and eroded soil entries (for the non‐irrigated crop winter cereals) for the R3‐Bologna scenario from 1975–1994. The.zts file was used for the analysis
| March–September | October–February | Calendar year | |||
|---|---|---|---|---|---|
| Run‐off | Eroded soil | Run‐off | Eroded soil | Rainfall | |
| Number of days | Number of days | mm | |||
| 1975 Jan–Feb | – | – | 1 | 1 | – |
| 1975 | 9 | 9 | 21a | 21a | 815 |
| 1976 | 14 | 14 | 13 | 13 | 790 |
| 1977 | 14 | 14 | 13 | 13 | 688 |
| 1978 | 11 | 11 | 11 | 11 | 764 |
| 1979 | 13 | 13 | 12 | 12 | 725 |
| 1980 | 10 | 10 | 15 | 15 | 724 |
| 1981 | 15 | 15 | 4 | 4 | 545 |
| 1982 | 10 | 10 | 10 | 10 | 632 |
| 1983 | 7 | 7 | 4 | 4 | 461 |
| 1984 | 12 | 12 | 11 | 11 | 726 |
| 1985 | 4 | 4 | 14 | 14 | 406 |
| 1986 | 18 | 18 | 7 | 7 | 969 |
| 1987 | 5 | 5 | 10 | 10 | 450 |
| 1988 | 9 | 9 | 4 | 4 | 496 |
| 1989 | 16 | 16 | 2 | 2 | 692 |
| 1990 | 12 | 12 | 2 | 2 | 557 |
| 1991 | 5 | 5 | 13 | 13 | 486 |
| 1992 | 14 | 14 | 26 | 26 | 1,118 |
| 1993 | 10 | 10 | 21 | 21 | 832 |
| 1994 | 14 | 14 | 9b | 9b | 705 |
| Average 1975–1994 | 11.1 | 11.1 | 11.2 | 11.2 | 672 |
Numbers for October 1975 to February 1976 (etc. for entire column, except last cell).
Numbers for October 1994 to December 1994.
Table A.4.
Overview of number of days with run‐off and eroded soil entries (for the non‐irrigated crop winter cereals) for the R4‐Roujan scenario from 1975–1994. The.zts file was used for the analysis
| March–September | October–February | Calendar year | |||
|---|---|---|---|---|---|
| Run‐off | Eroded soil | Run‐off | Eroded soil | Rainfall | |
| Number of days | Number of days | mm | |||
| 1975 Jan–Feb | – | – | 4 | 4 | – |
| 1975 | 13 | 13 | 11a | 11a | 702 |
| 1976 | 11 | 11 | 20 | 20 | 1,023 |
| 1977 | 12 | 12 | 18 | 18 | 995 |
| 1978 | 8 | 8 | 10 | 10 | 720 |
| 1979 | 6 | 6 | 13 | 13 | 815 |
| 1980 | 8 | 8 | 6 | 6 | 497 |
| 1981 | 9 | 9 | 5 | 5 | 622 |
| 1982 | 11 | 11 | 10 | 10 | 648 |
| 1983 | 9 | 9 | 7 | 7 | 547 |
| 1984 | 8 | 8 | 8 | 8 | 811 |
| 1985 | 8 | 8 | 14 | 14 | 572 |
| 1986 | 9 | 9 | 15 | 15 | 931 |
| 1987 | 11 | 11 | 20 | 20 | 1,118 |
| 1988 | 11 | 11 | 11 | 11 | 959 |
| 1989 | 5 | 5 | 7 | 7 | 444 |
| 1990 | 10 | 10 | 13 | 13 | 582 |
| 1991 | 11 | 11 | 9 | 9 | 493 |
| 1992 | 11 | 11 | 13 | 13 | 997 |
| 1993 | 5 | 5 | 13 | 13 | 659 |
| 1994 | 9 | 9 | – | – | – |
| Average 1975–1994 | 9.3 | 9.3 | 11.7 | 11.7 | 752 |
Numbers for October 1975 to February 1976 (etc. for entire column, except last cell).
Numbers for October 1994 to December 1994.
Note that the analysis was based on the data in the.zts output file. In the.zts file, the precipitation is not equal to the precipitation in the RxNOIRR.MET files of PRZM, the annual precipitation is lower. The reason is that the precipitation variable (PRCP) in the.zts file does not contain precipitation in the form of snow. For example, for R1‐Weiherbach, the annual precipitation in 1980 is 833 mm in the R1NOIRR.MET file, while it is 789 mm in the.zts file for 1980; and for R3‐Bologna for 1985 the numbers are 423 mm (R3NOIRR.MET file) and 406 mm (.zts file).
As the precipitation data from the.zts file represent rainfall only (not including snowfall as precipitation), these data were used for the analysis because they reflect better the potential for surface run‐off generation. While snowmelt can contribute to surface run‐off in PRZM, snowfall does not. Note that in PRZM, snowfall only occurs on days with daily mean air temperature (Tmean) < 0°C, while rainfall and snowmelt only occur on days with Tmean > 0°C. Hence, on a day with snowfall, there will be no surface run‐off in PRZM. Also the graphs in this appendix are based upon the information in the.zts files, so the precipitation does not include snowfall.
For each of the FOCUS run‐off scenarios, the FOCUS Surface Water Repair WG defined 6 years for the warming‐up period that were added in front of the 20 years of the 20‐year exposure assessment period from 1975 to 1994. The FOCUS Surface Water Repair WG selected the 6 years that have a number of run‐off events during the March to September period that is equal or greater than the average number of the 20 years for the March to September period. Care was taken that the last 2 years of the warming‐up period had a reasonably regular distribution of the rainfall and associated run‐off and erosion events in time, i.e. they had no series of months without any run‐off and erosion (also compare with Appendix C). The selected years are listed in Table A.5.
Table A.5.
Selected warming‐up years for the FOCUS surface water run‐off scenarios (R1–R4)
| Year in simulation | R1‐Weiherbach | R2‐Porto | R3‐Bologna | R4‐Roujan |
|---|---|---|---|---|
| 1969 | 1983 | 1978 | 1994 | 1976a |
| 1970 | 1982 | 1987 | 1990 | 1990 |
| 1971 | 1985 | 1991 | 1984a | 1991 |
| 1972 (leap year) | 1976 | 1993b | 1992 | 1988 |
| 1973 | 1980a | 1977 | 1979 | 1992a |
| 1974 | 1981 | 1980a | 1977 | 1987 |
29 February taken out.
29 February added with average properties from the day before and the day after.
A.1. Is a 6‐year warm‐up period sufficient for run‐off scenarios?
The FOCUS Surface Water Repair WG checked that 6 years of warm‐up for the run‐off scenarios are sufficient, i.e. a plateau concentration in the sediment has been reached, by performing simulations for a persistent compound (dummy substance I, Table A.6), with a single application of 1 kg/ha and six applications of 1 kg/ha each with a minimum interval of 10 days. The FOCUS model versions used were FOCUS_SWASH 5.3, including SPIN 2.2, FOCUS_PRZM_SW 4.3.1 and FOCUS_TOXSWA 5.5.3.14 so the released FOCUS PAT (with rules according to FOCUS, 2001) was applied. Details on the total simulated period, input on the application window and the selected application are presented in Table A.7.
Table A.6.
Physicochemical properties of the test compound (dummy substance I)
| Property(a) | Units | Value |
|---|---|---|
| Molar mass | g/mol | 300 |
| Saturated vapour pressure (20°C) | Pa | 1E‐7 |
| Solubility (20°C) | mg/L | 1 |
| DegT50soil | d | 1,000 |
| Kfoc | mL/g | 1,000 |
| Freundlich exponent (1/n) | – | 1 |
| DegT50water | d | 100 |
| DegT50sediment | d | 1,000 |
For other properties, default values are used. The default values are similar for the values used for the PRZM and TOXSWA models in FOCUS (2001), except for the molar enthalpy of transformation in water and in sediment, which changed from 54 to 65.4 kJ/mol.
Table A.7.
Simulation period and application window entered in SWASH for the 20‐year simulations
| R1‐Weiherbach | R2‐Porto | R3‐Bologna | R4‐Roujan | |
|---|---|---|---|---|
| Simulation period | 1 January 1975 to 31 December 1994 | 1 January 1975 to 31 December 1994 | 1 January 1975 to 31 December 1994 | 1 January 1975 to 31 December 1994 |
| Application window | ||||
| One application | 109–139 | 107–137 | 107–137 | 86–116 |
| Six applications | 109–200 | 107–198 | 107–198 | 86–177 |
| (19 April onwards) | (17 April onwards) | (17 April onwards) | (27 March onwards) | |
The target value to assess whether the plateau value for the PECsed was reached is as suggested by the EFSA Scientific Opinion on sediment (EFSA PPR Panel, 2015) for assessing the risks for sediment organisms and macrophytes. They suggest to express:
‘the PECsed and RACsed at least in terms of total sediment concentration based on dry weight, either normalised to the organic carbon (OC) content in the dry sediment or normalised to standard OECD sediment with an organic matter content of 5% (which approximates 2.5% OC on dry weight basis). In addition the PPR Panel advocates the expression of PECsed and RACsed estimates in terms of freely dissolved PPP fraction in pore water’. (EFSA PPR Panel, 2015, p. 52)
Currently, the TOXSWA model gives the total sediment content based on dry mass as standard output. As this variable is a linear function to the sediment content based upon the OC content, or to the concentration in the sediment pore water, the FOCUS Surface Water Repair WG based its analysis on the standard output of total sediment content based on dry sediment mass of TOXSWA.
Concerning its spatial dimensions, the FOCUS Surface Water Repair WG used the total content of pesticides based on dry mass (μg/kg) in the top 1 cm and top 5 cm sediment, which follows the recommendations by the EFSA Scientific Opinion (2015) for the assessment of effects on benthic organisms, respectively macrophytes. Following the standard FOCUS procedure, the PECsed value below the last segment in the water layer is used for the analysis. In the stream, this segment is the last 5 m of the 100 m stream, while for the pond, there is only a single segment of 30 m long.
Figures A.1–A.4 present examples of simulations for the R1‐Weiherbach pond, R2‐Porto stream (single applications) and R1‐Weiherbach pond and R4‐Roujan stream (six applications). As expected, the concentrations in the water layer do not build up in the course of the years. The test compound (dummy substance I, DegT50sed of 1,000 days) was defined in such a way that it has a relatively strong tendency to build up in the sediment. The results of the four simulations presented in Figures A.1–A.4 show that concentrations may build up for approximately 2–4 years and that this process is slower for the 5 cm layer than for the 1 cm layer. As expected, the 1 cm sediment layer has a faster response to concentration peaks in the water layer above than does the 5 cm layer. Based upon these results, the FOCUS Surface Water Repair WG decided to adopt a 6‐year warming‐up period for all repaired FOCUS run‐off scenarios, equivalent to that performed in the drainage scenarios of FOCUS (2001).
Figure A.1.
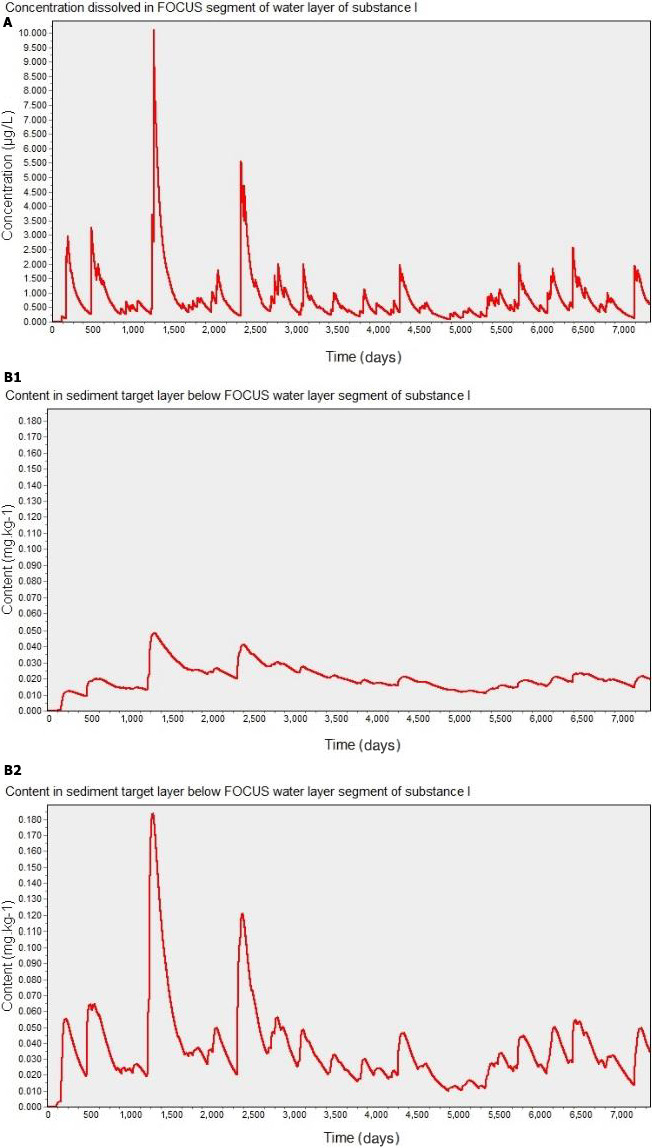
R1‐Weiherbach, pond simulated with dummy substance I; single application of 1 kg/ha in maize. (A) Concentration in water layer (μg/L), (B1) Content in upper 5 cm of sediment, (B2) Content in upper 1 cm of sediment (both in mg/kg dry sediment)
Figure A.4.
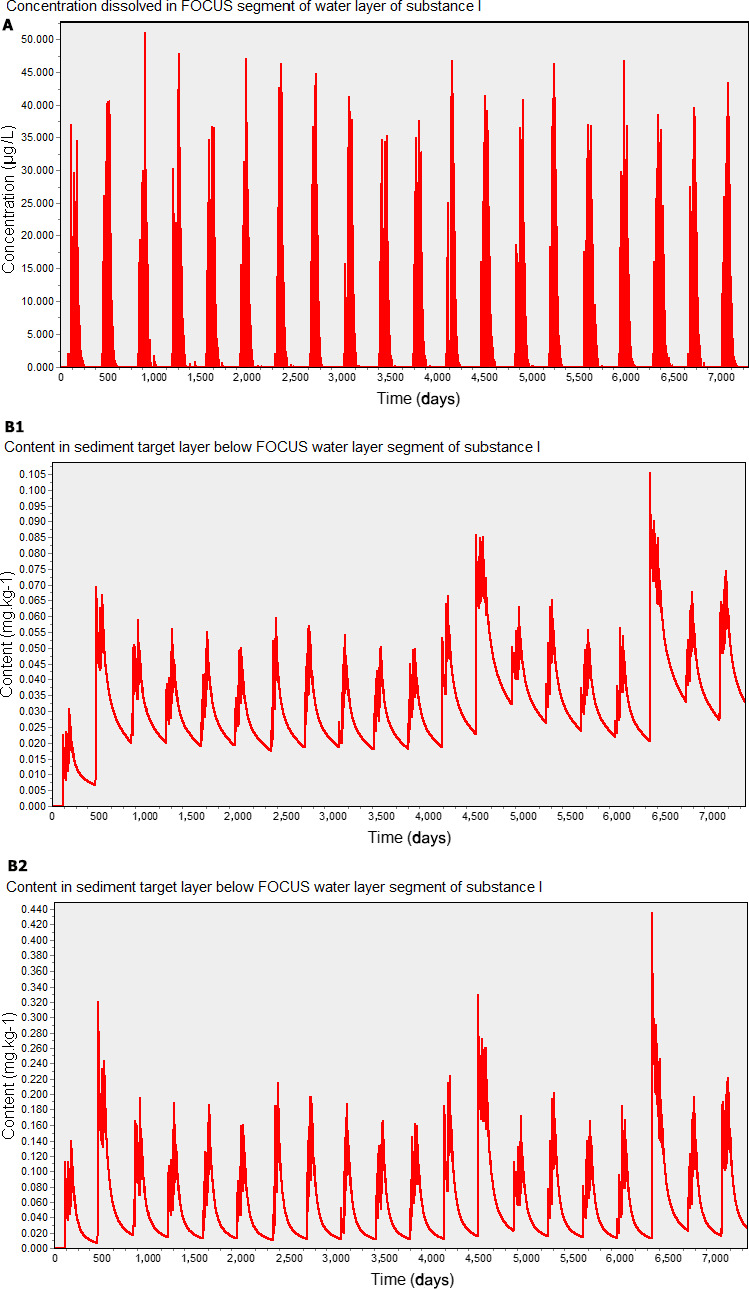
R4‐Roujan, stream simulated with dummy substance I; six applications of 1 kg/ha in maize. (A) Concentration in water layer (μg/L), (B1) Content in upper 5 cm of sediment, (B2) Content in upper 1 cm of sediment (both in mg/kg dry sediment)
Figure A.2.
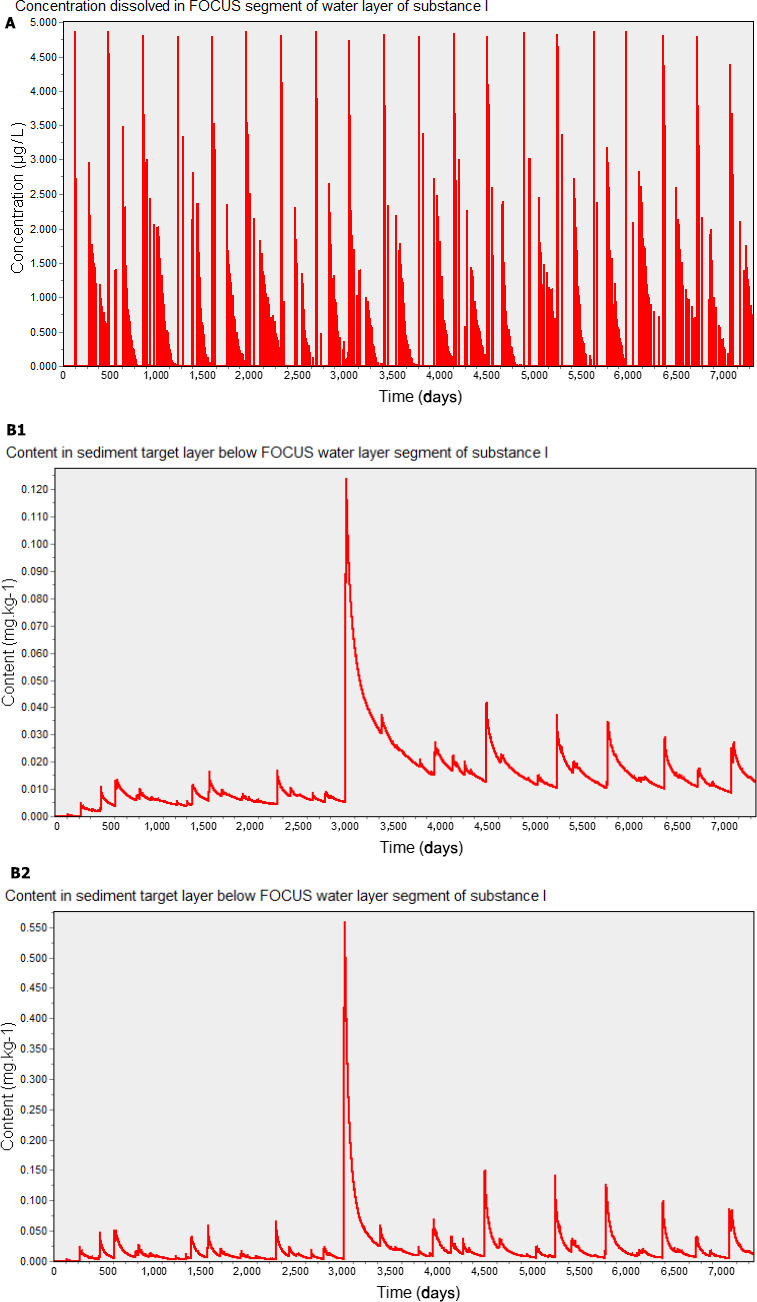
R2‐Porto, stream simulated with dummy substance I; single application of 1 kg/ha in maize. (A) Concentration in water layer (μg/L), (B1) Content in upper 5 cm of sediment, (B2) Content in upper 1 cm of sediment (both in mg/kg dry sediment)
Figure A.3.
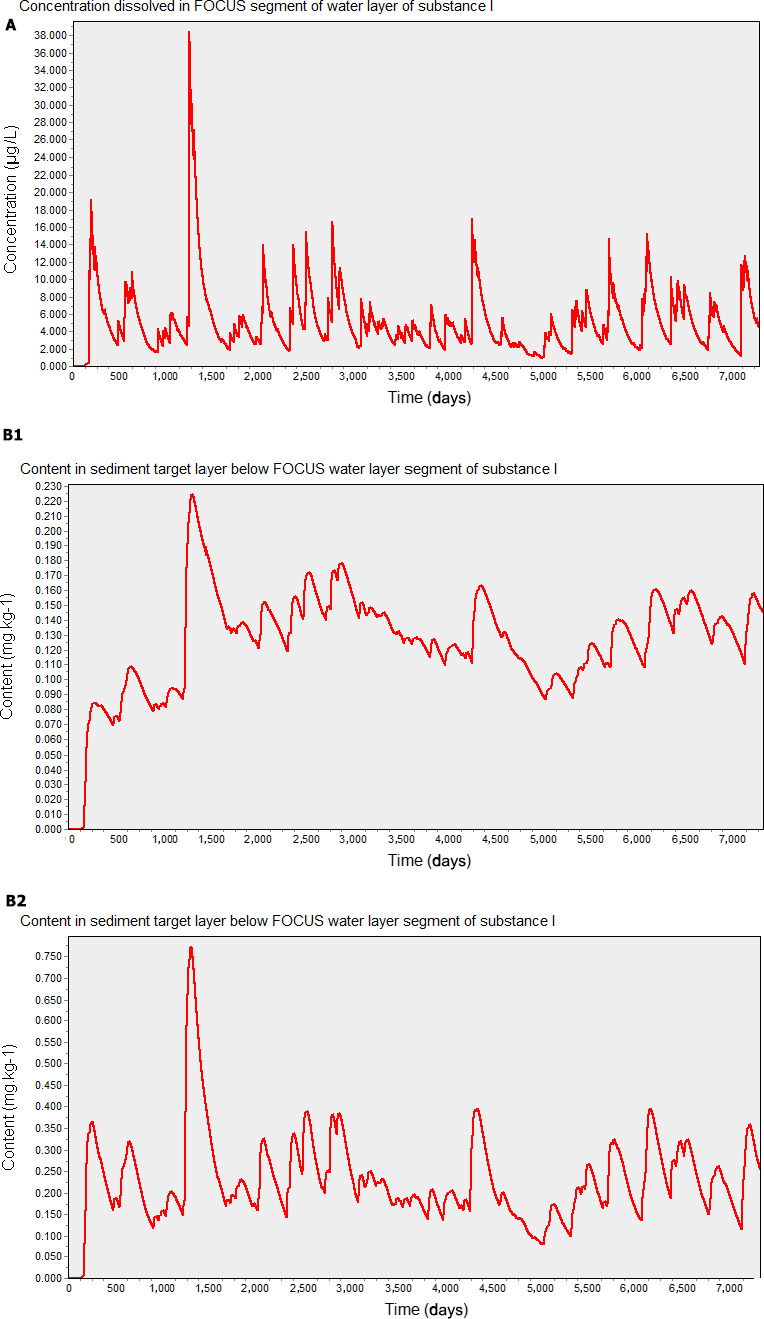
R1‐Weiherbach, pond simulated with dummy substance I; six applications of 1 kg/ha in maize. (A) Concentration in water layer (μg/L), (B1) Content in upper 5 cm of sediment, (B2) Content in upper 1 cm of sediment (both in mg/kg dry sediment)
Note that the peak in sediment content (1 and 5 cm layers) around 3,200 days for the R2 stream scenario is caused by the entry of a high mass of pesticide sorbed to eroded soil, not shown in the graphs.
Appendix B – Rainfall and drainage events as well as water depth, flow velocity and hydraulic residence time in the waterbody as a function of time for the revised FOCUS surface water drainage scenarios
1.
Precipitation data were derived from the Microsoft® Excel file and drainage data from the MACRO.m2t output file (MACRO_FOCUS.exe version for FOCUS Repair of 15 December 2019). Data for the hydrological response graphs (water depth, flow velocity and hydraulic residence time in the waterbody) were derived from FOCUS_TOXSWA output, version 6.6.4 (model 3.3.7‐R, created 11 November 2019). Data are given for non‐irrigated crops (winter cereals for D1‐Lanna, D2‐Brimstone, D4‐Skousbo, D5‐La Jaillière, D6‐Thiva; winter oil seed rape for D3‐Vredepeel).
Time period covered (20‐year assessment period):
D1‐Lanna: 1980–1999
D6‐Thiva: 1977–1996
All other scenarios: 1975–1994.
A large precipitation event in D1‐Lanna (144.2 mm on 9 July 1989) has been indicated in the graph.
Following the figure section, Tables B.1 and B.2 give a summary on annual precipitation and drainage for each of the six drainage scenarios.
Table B.1.
Summary of annual precipitation (mm) and drainage (mm) for the D1‐Lanna, D2‐Brimstone and D3‐Vredepeel scenario (winter cereals for D1 and D2, winter oil seed rape for D3; all non‐irrigated crops)
| D1‐Lanna | D2‐Brimstone | D3‐Vredepeel | ||||||
|---|---|---|---|---|---|---|---|---|
| Year | Precipitation | Drainage | Year | Precipitation | Drainage | Year | Precipitation | Drainage |
| 1974 | 569 | 157 | 1969 | 614 | 226 | 1969 | 715 | 41 |
| 1975 | 599 | 261 | 1970 | 697 | 356 | 1970 | 787 | 357 |
| 1976 | 560 | 163 | 1971 | 669 | 317 | 1971 | 724 | 281 |
| 1977 | 588 | 204 | 1972 | 646 | 314 | 1972 | 732 | 329 |
| 1978 | 573 | 211 | 1973 | 687 | 345 | 1973 | 785 | 258 |
| 1979 | 578 | 255 | 1974 | 642 | 311 | 1974 | 783 | 331 |
| 1980 | 443 | 133 | 1975 | 531 | 200 | 1975 | 643 | 236 |
| 1981 | 573 | 215 | 1976 | 545 | 255 | 1976 | 503 | 151 |
| 1982 | 599 | 284 | 1977 | 735 | 390 | 1977 | 819 | 274 |
| 1983 | 441 | 109 | 1978 | 573 | 248 | 1978 | 682 | 258 |
| 1984 | 639 | 244 | 1979 | 697 | 360 | 1979 | 787 | 322 |
| 1985 | 578 | 239 | 1980 | 639 | 310 | 1980 | 732 | 321 |
| 1986 | 486 | 134 | 1981 | 759 | 400 | 1981 | 842 | 334 |
| 1987 | 647 | 315 | 1982 | 719 | 401 | 1982 | 724 | 306 |
| 1988 | 765 | 403 | 1983 | 562 | 233 | 1983 | 783 | 358 |
| 1989 | 549 | 157 | 1984 | 635 | 326 | 1984 | 891 | 427 |
| 1990 | 602 | 225 | 1985 | 715 | 376 | 1985 | 785 | 286 |
| 1991 | 569 | 219 | 1986 | 669 | 315 | 1986 | 846 | 320 |
| 1992 | 518 | 175 | 1987 | 642 | 315 | 1987 | 844 | 397 |
| 1993 | 410 | 64 | 1988 | 646 | 311 | 1988 | 916 | 413 |
| 1994 | 588 | 213 | 1989 | 687 | 345 | 1989 | 629 | 276 |
| 1995 | 531 | 187 | 1990 | 477 | 178 | 1990 | 646 | 237 |
| 1996 | 560 | 174 | 1991 | 603 | 305 | 1991 | 613 | 246 |
| 1997 | 785 | 427 | 1992 | 691 | 337 | 1992 | 728 | 278 |
| 1998 | 796 | 421 | 1993 | 698 | 350 | 1993 | 715 | 250 |
| 1999 | 827 | 456 | 1994 | 614 | 289 | 1994 | 816 | 397 |
| Mean of 20 years | 595 | 240 | Mean of 20 years | 642 | 312 | Mean of 20 years | 747 | 304 |
B.1. D1‐Lanna ditch and stream: precipitation and drainage fluxes
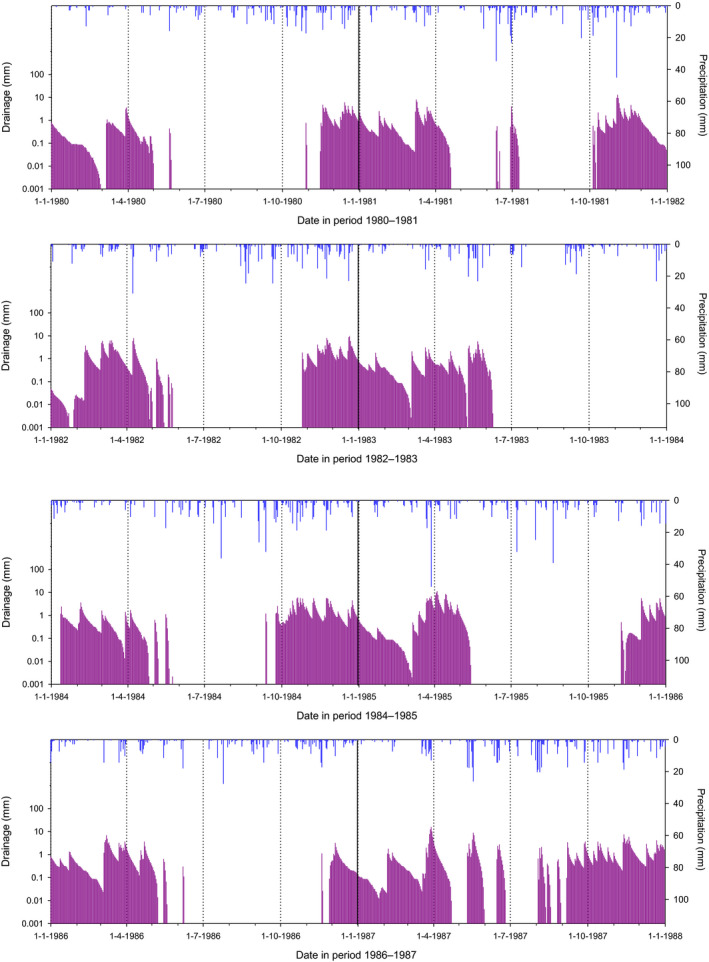
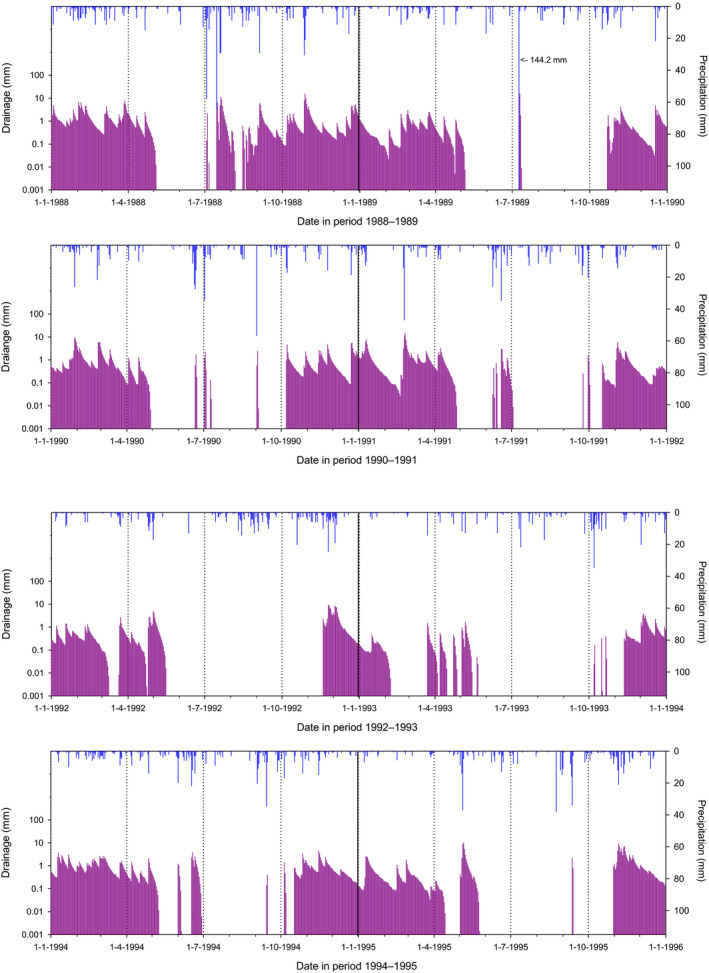
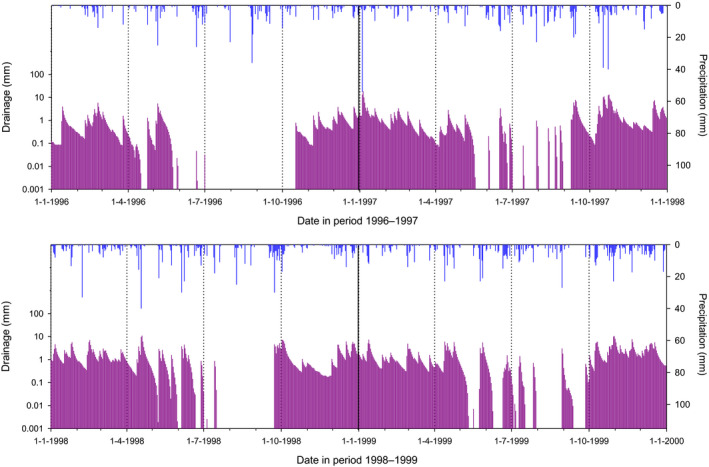
D1‐Lanna ditch: water depth, flow velocity and hydraulic residence time
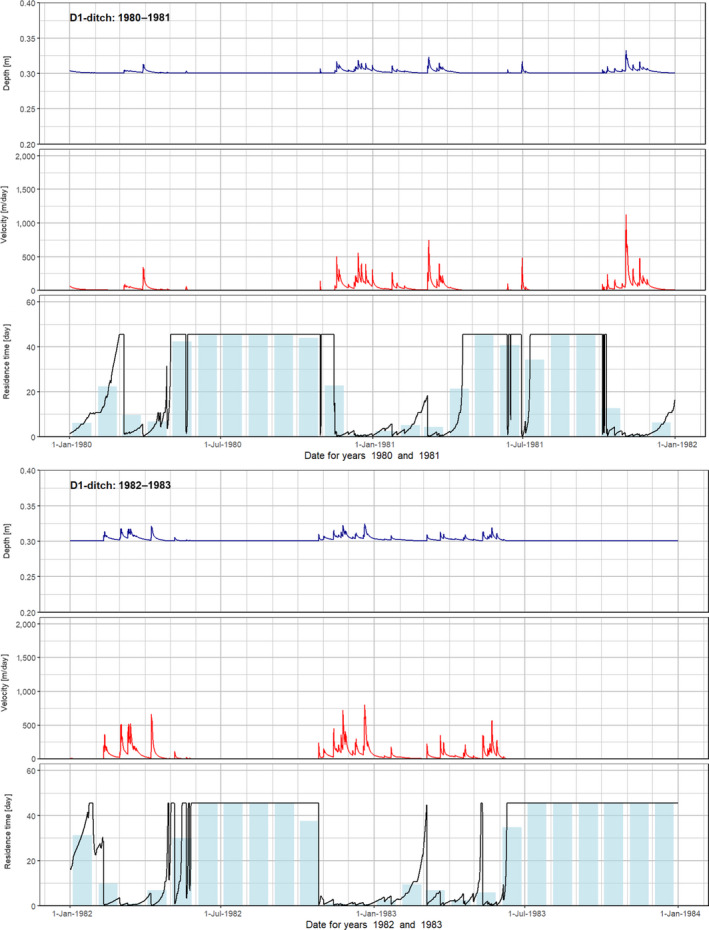
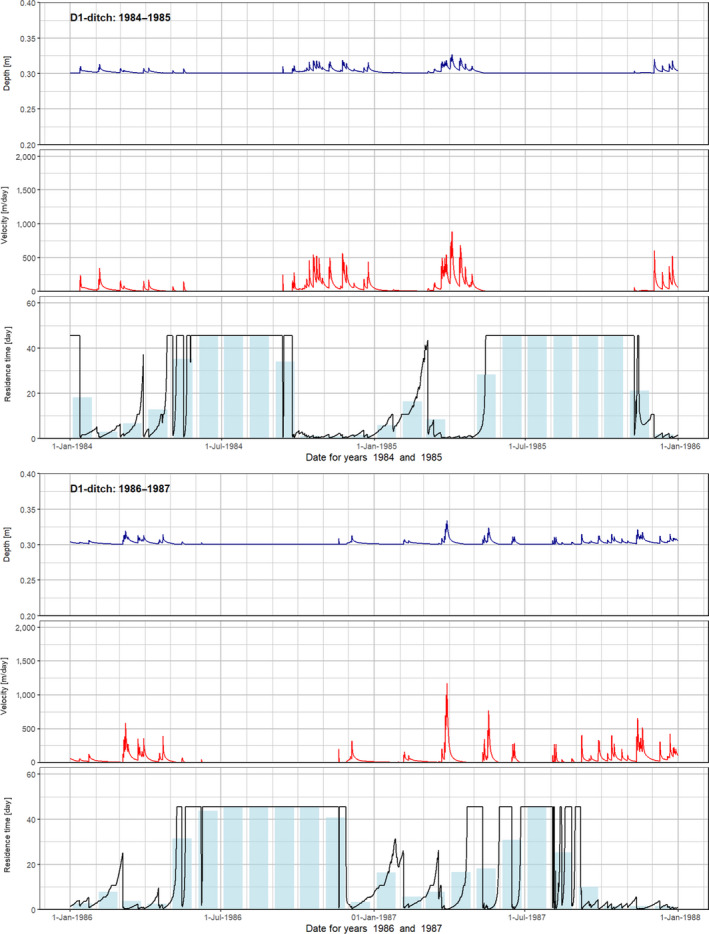
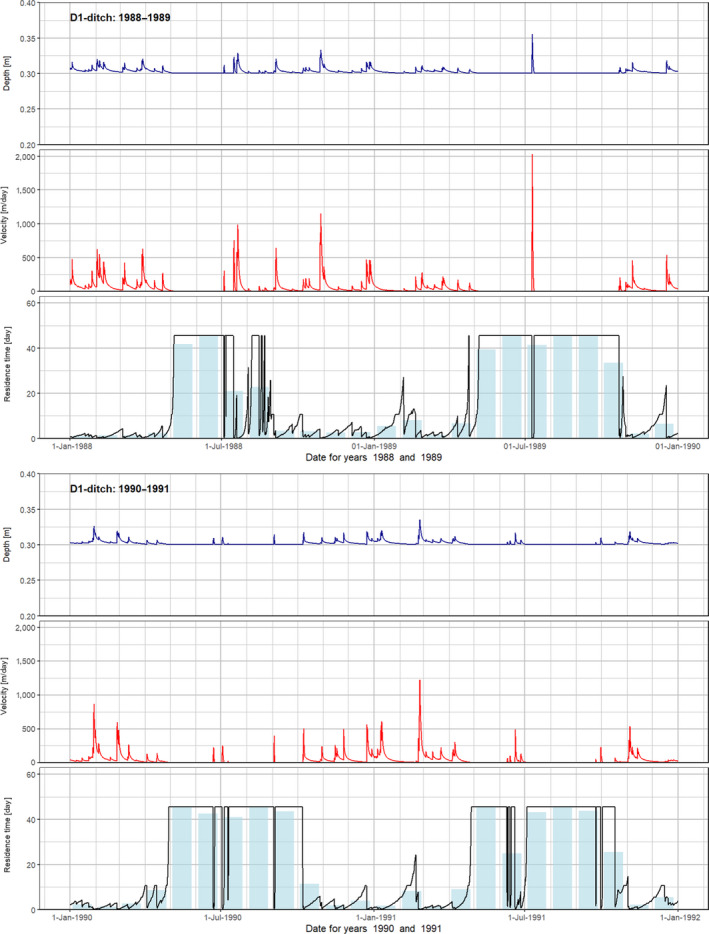
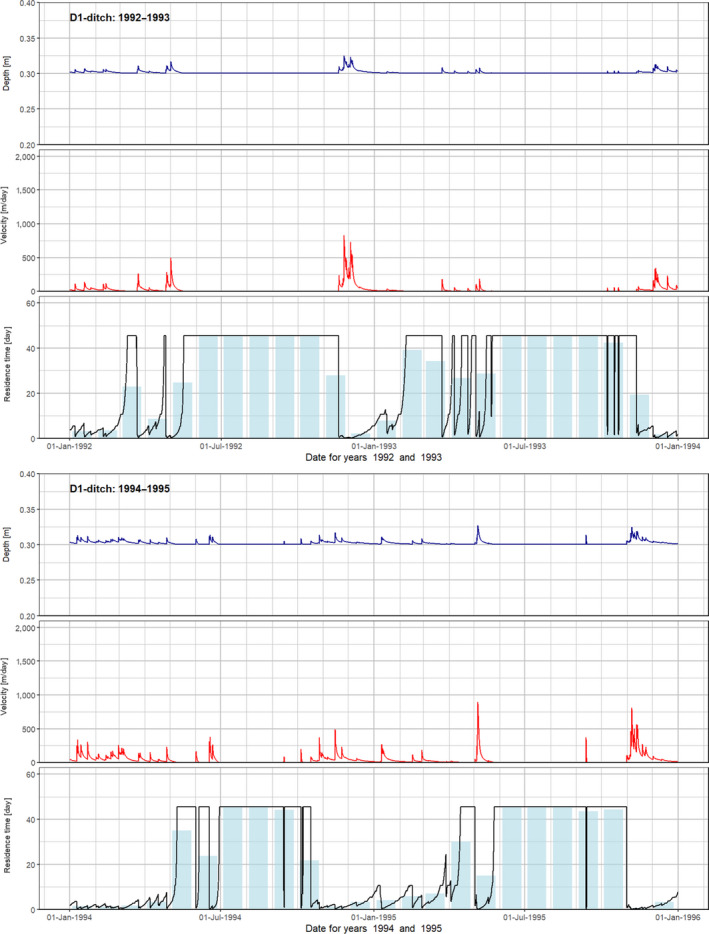
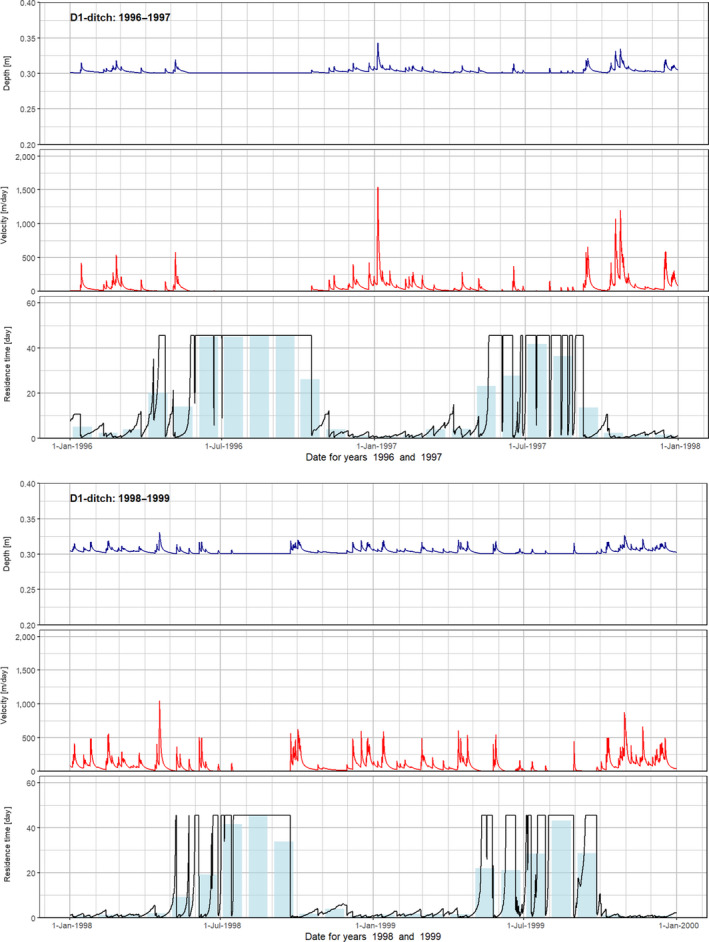
D1‐Lanna stream: water depth, flow velocity and hydraulic residence time
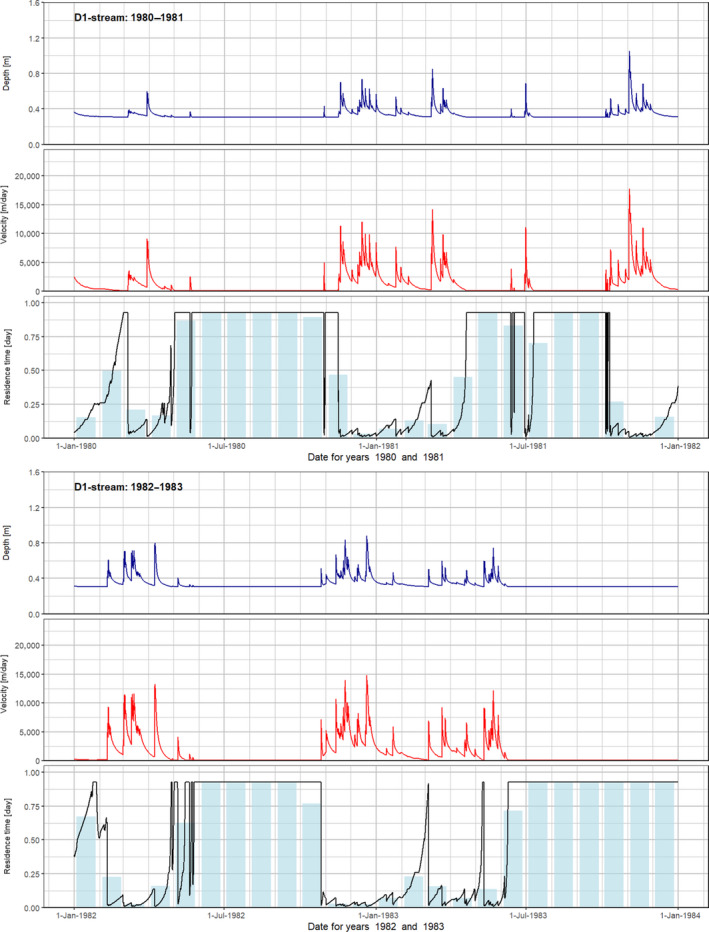
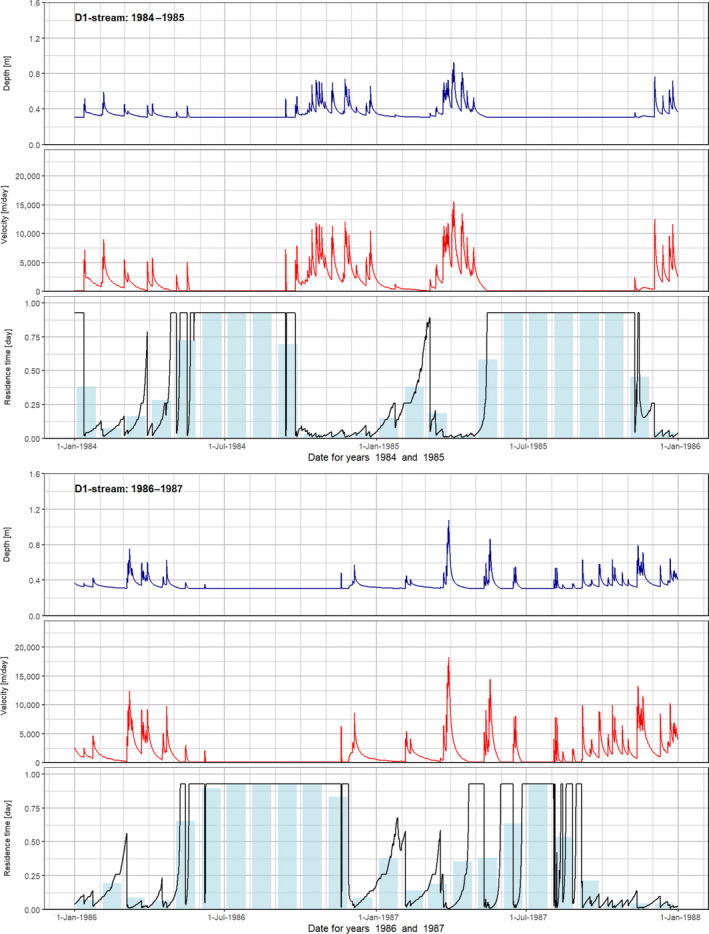
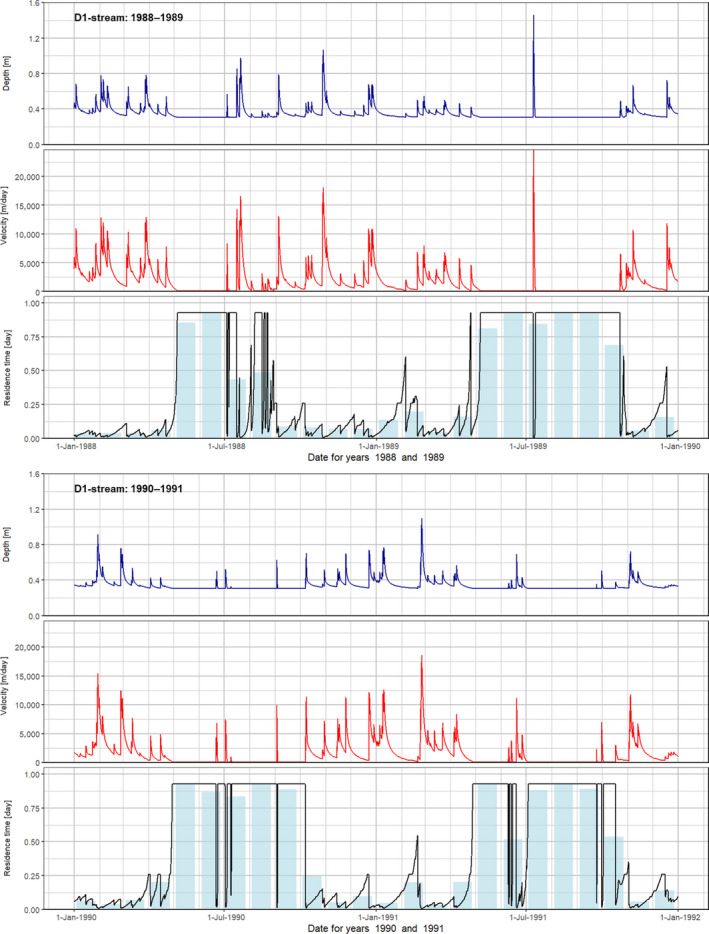
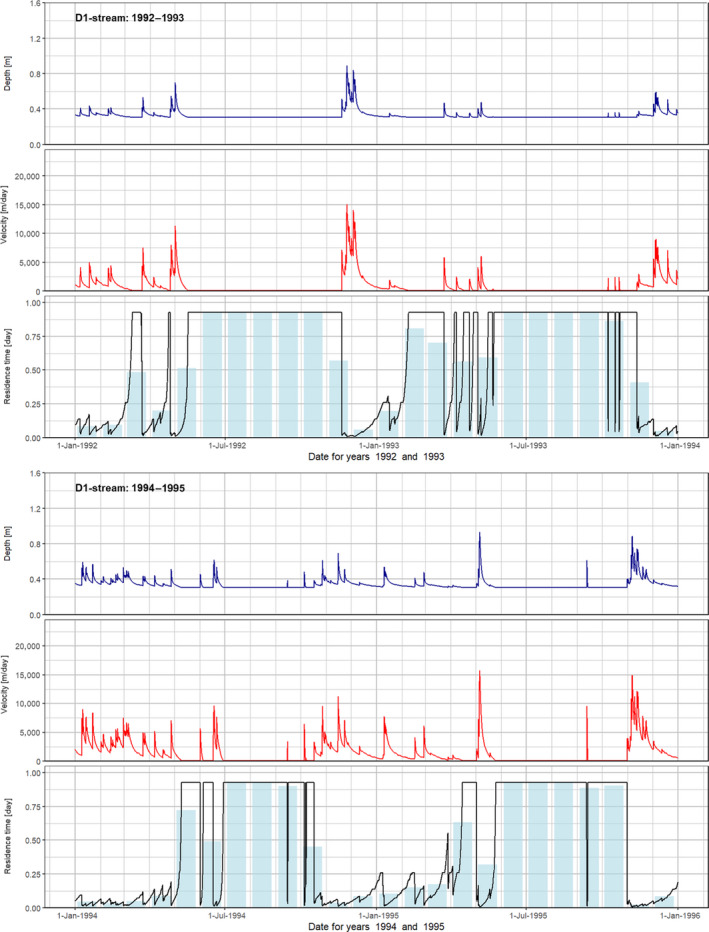
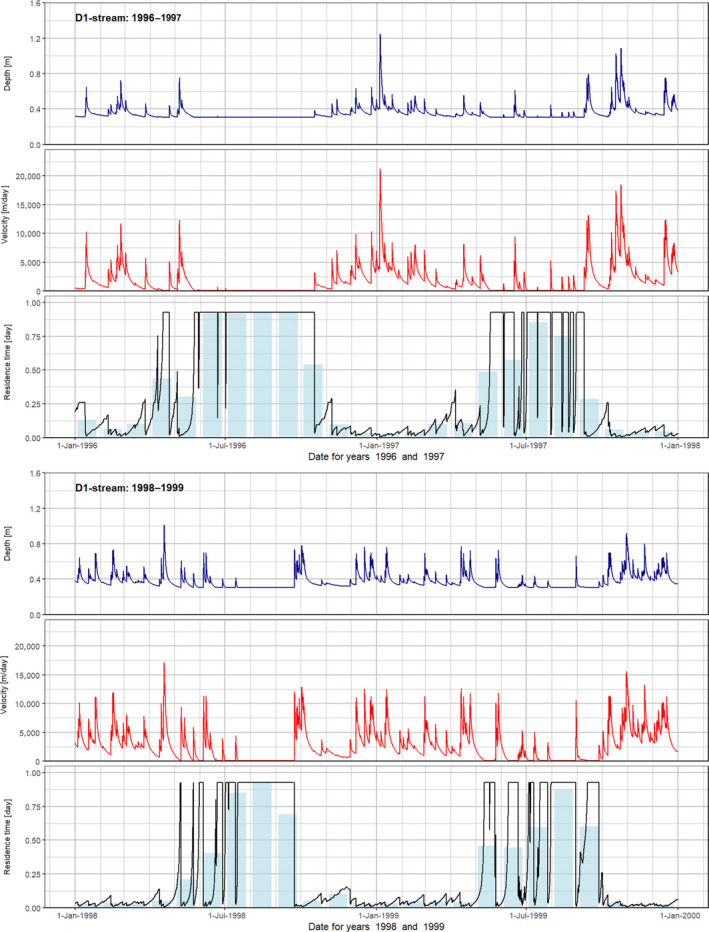
B.2. D2‐Brimstone ditch and stream: precipitation and drainage fluxes
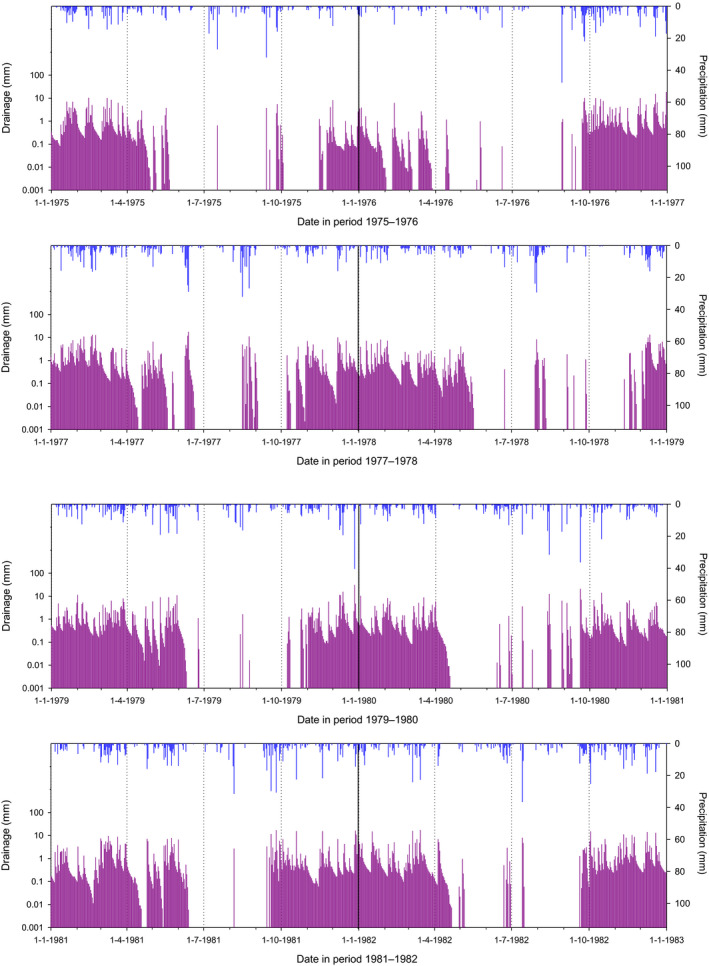
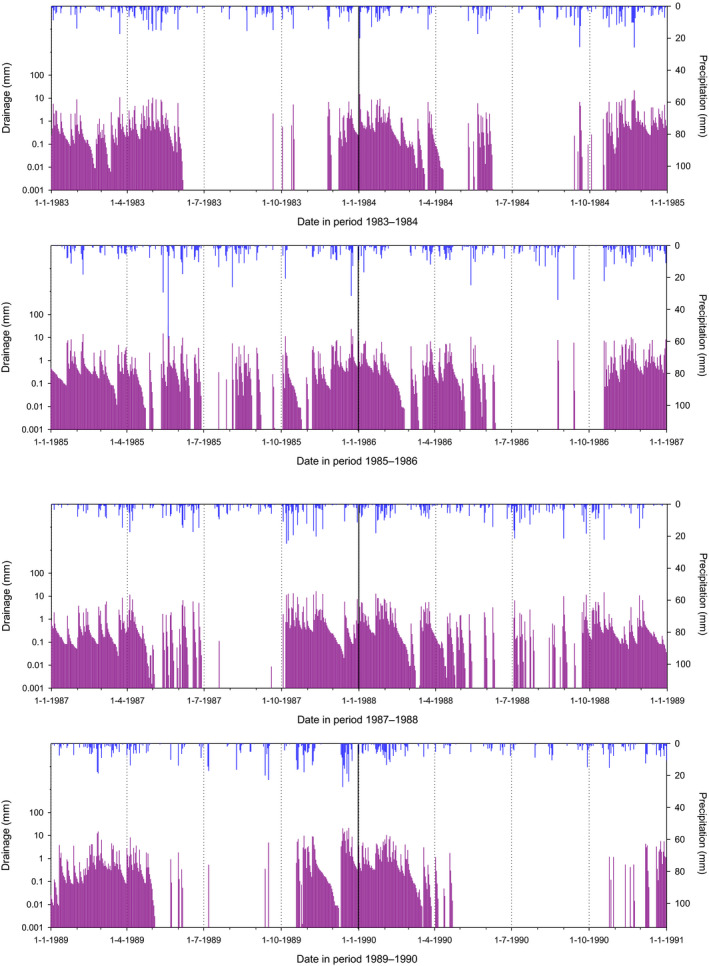
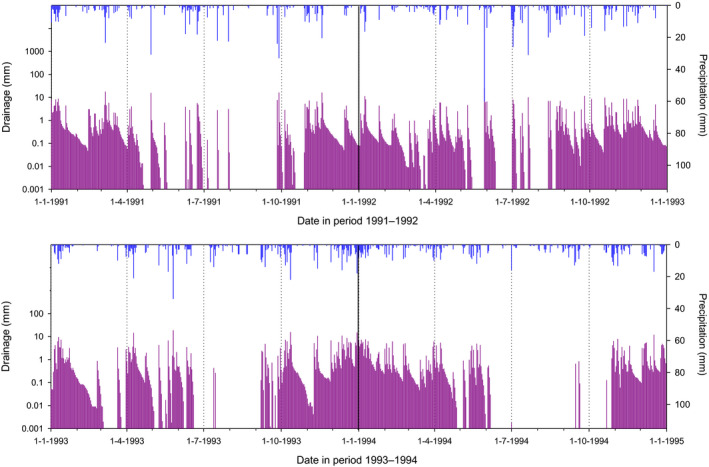
D2‐Brimstone ditch: water depth, flow velocity and hydraulic residence time
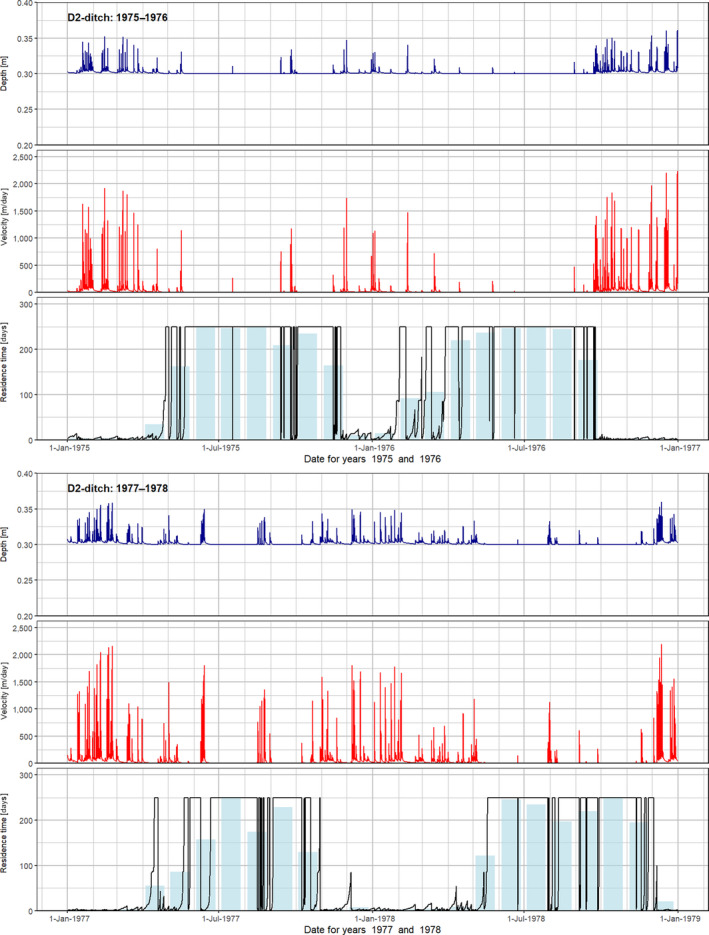
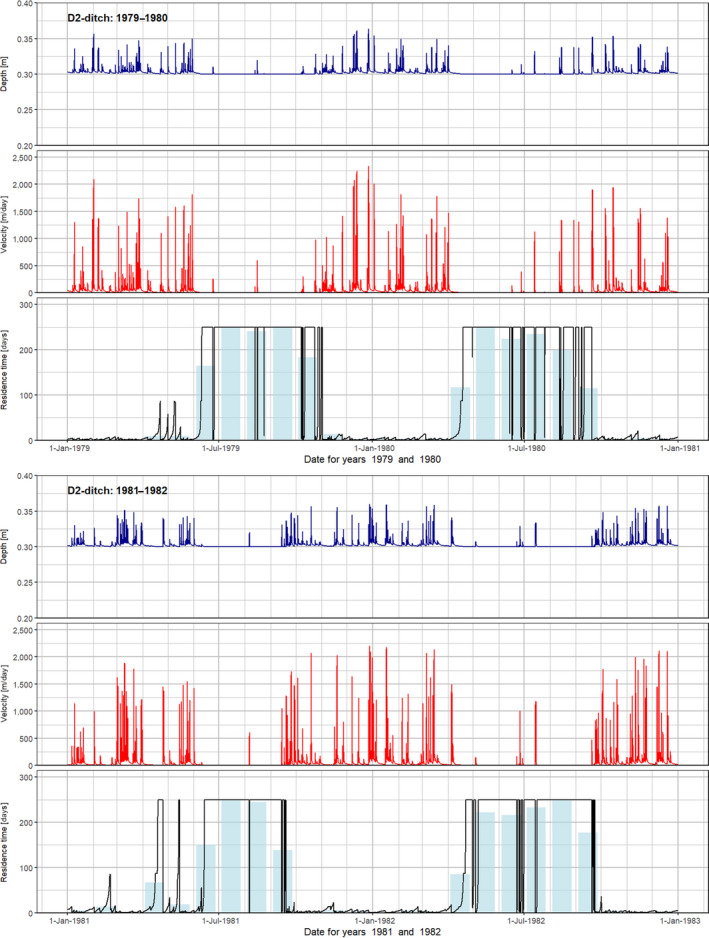
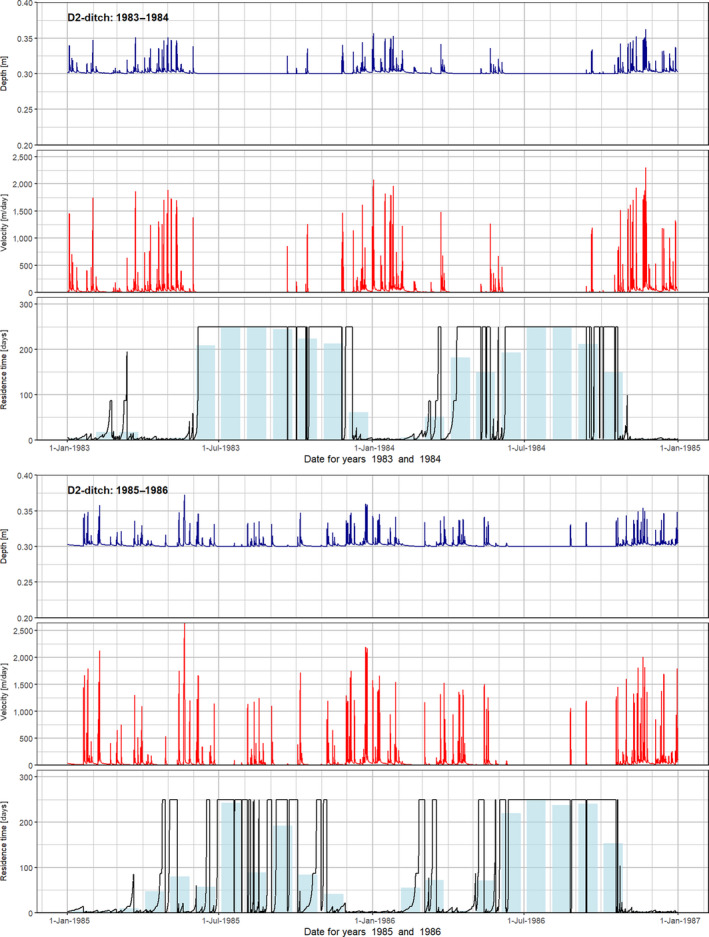
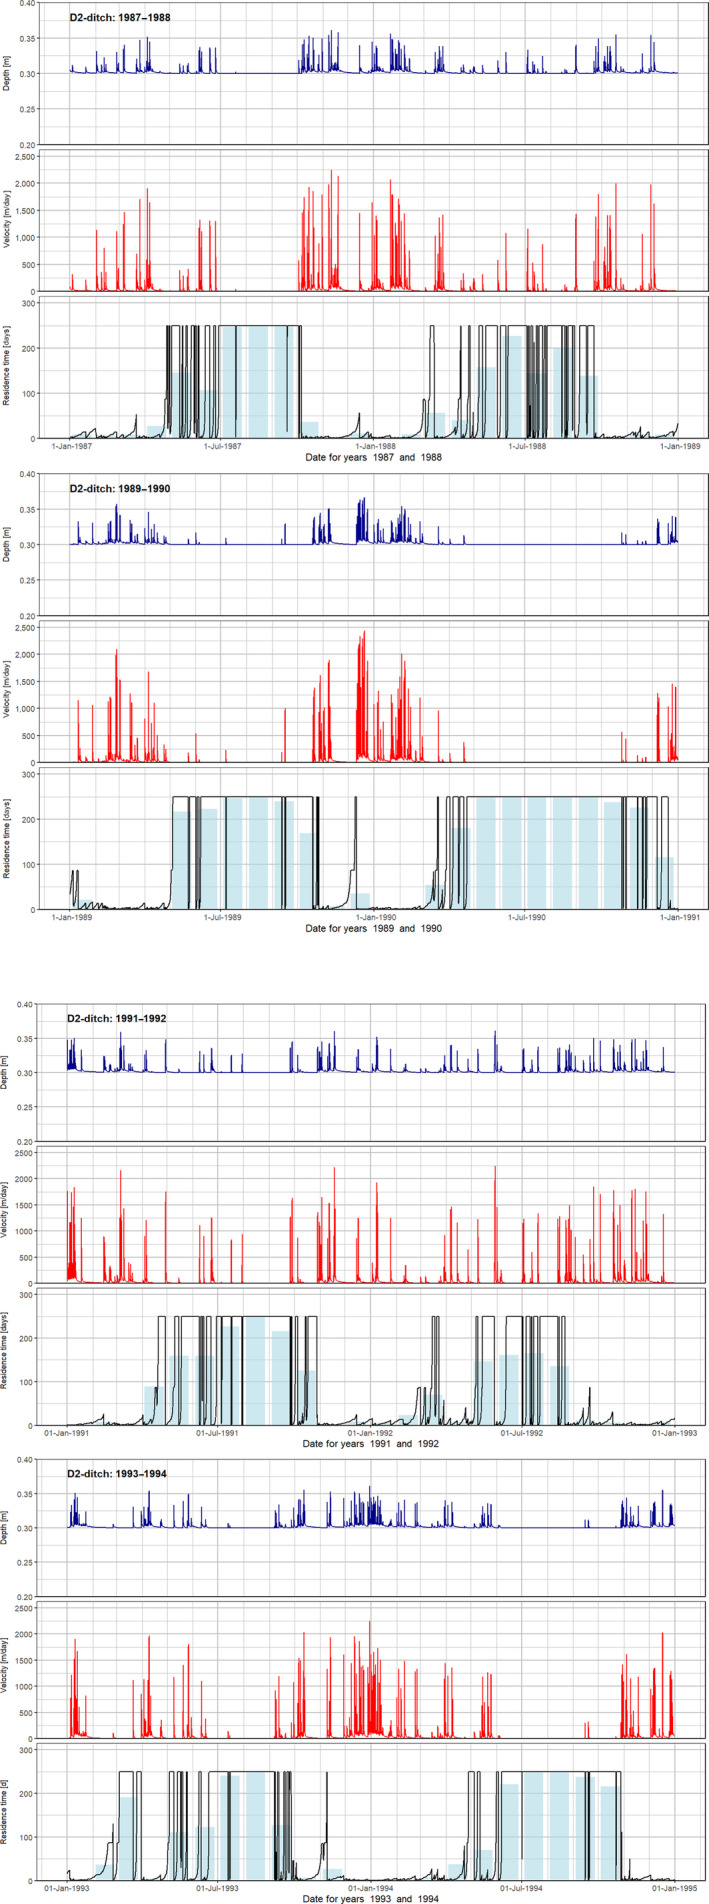
D2‐Brimstone stream: water depth, flow velocity and hydraulic residence time
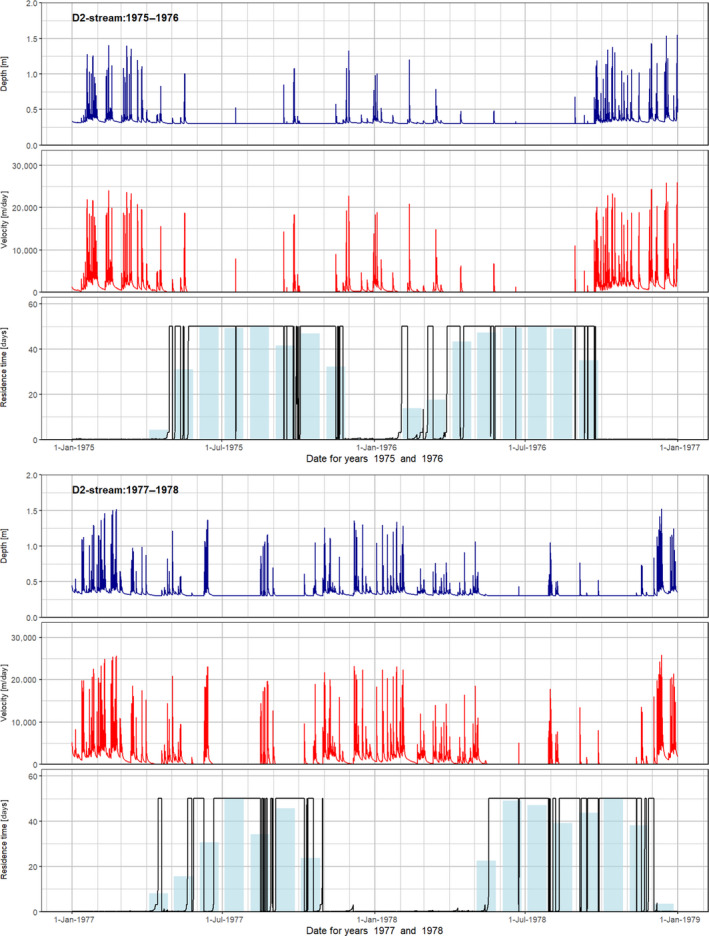
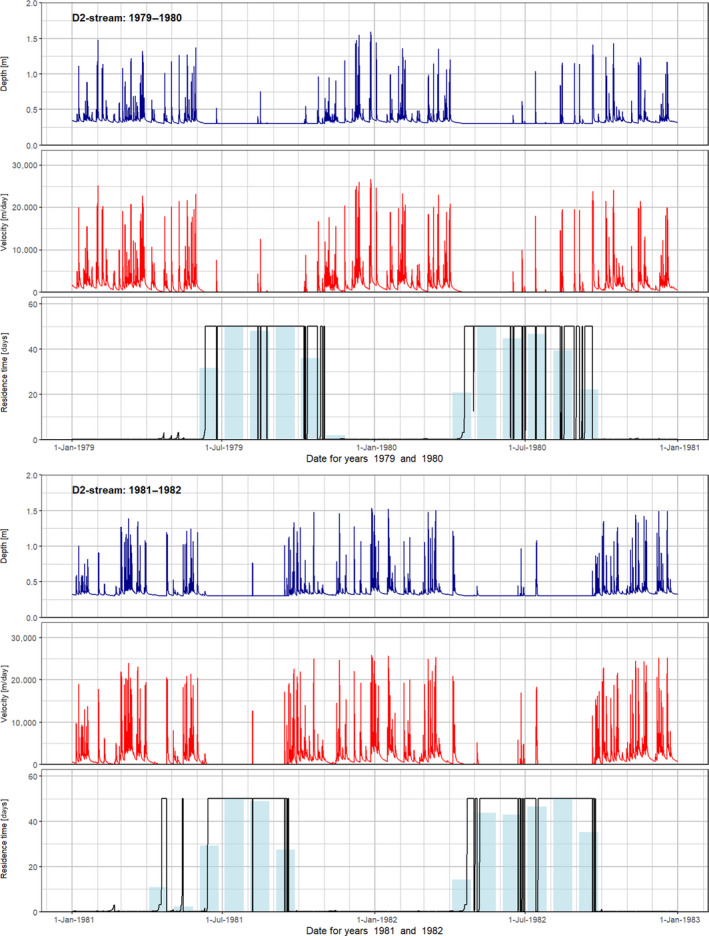
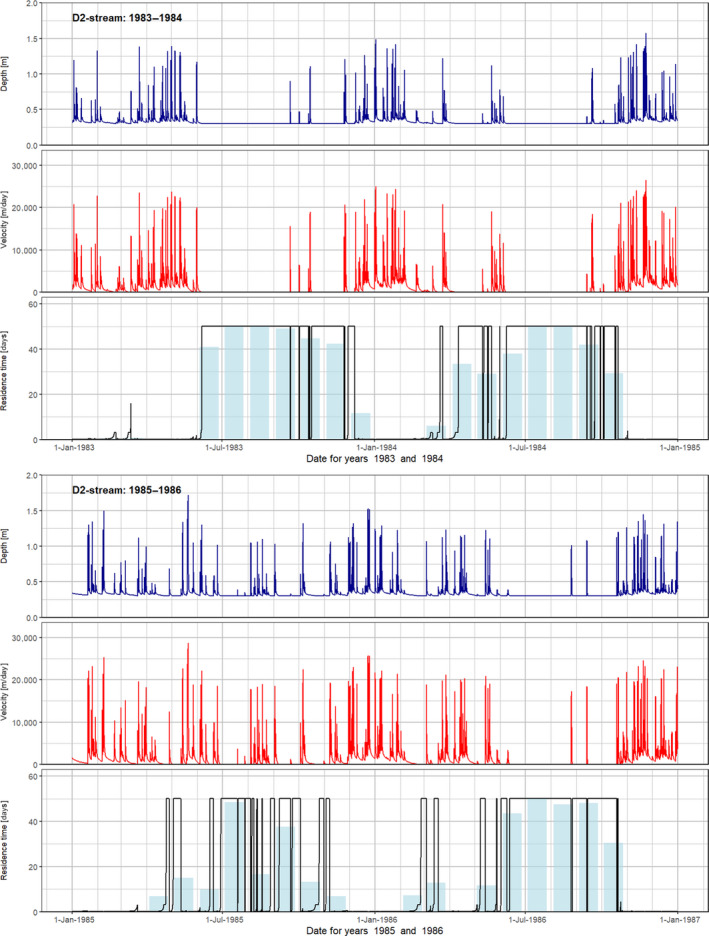
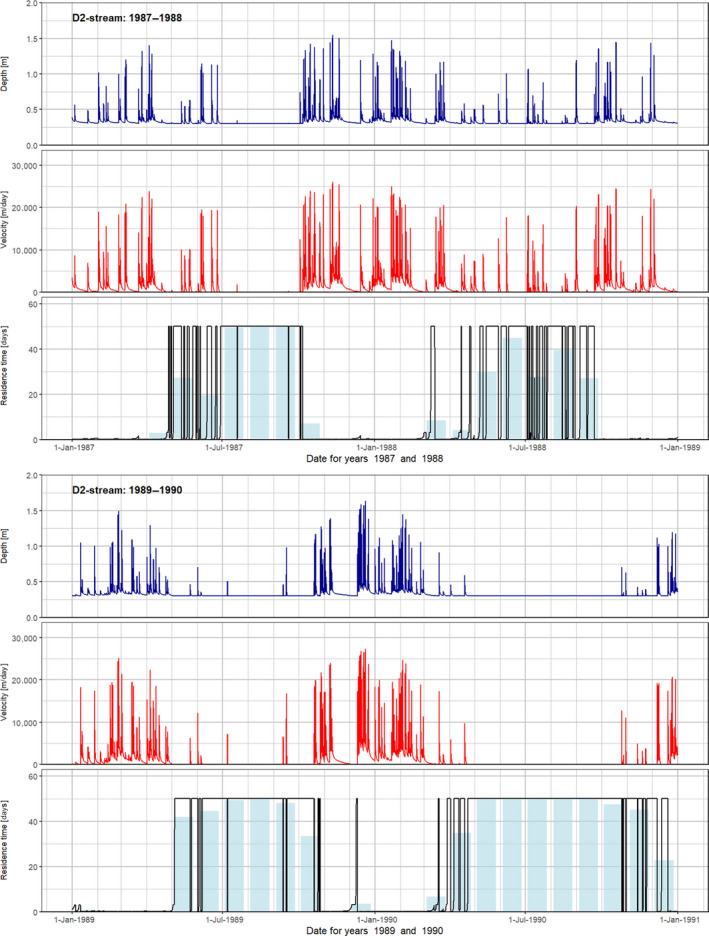
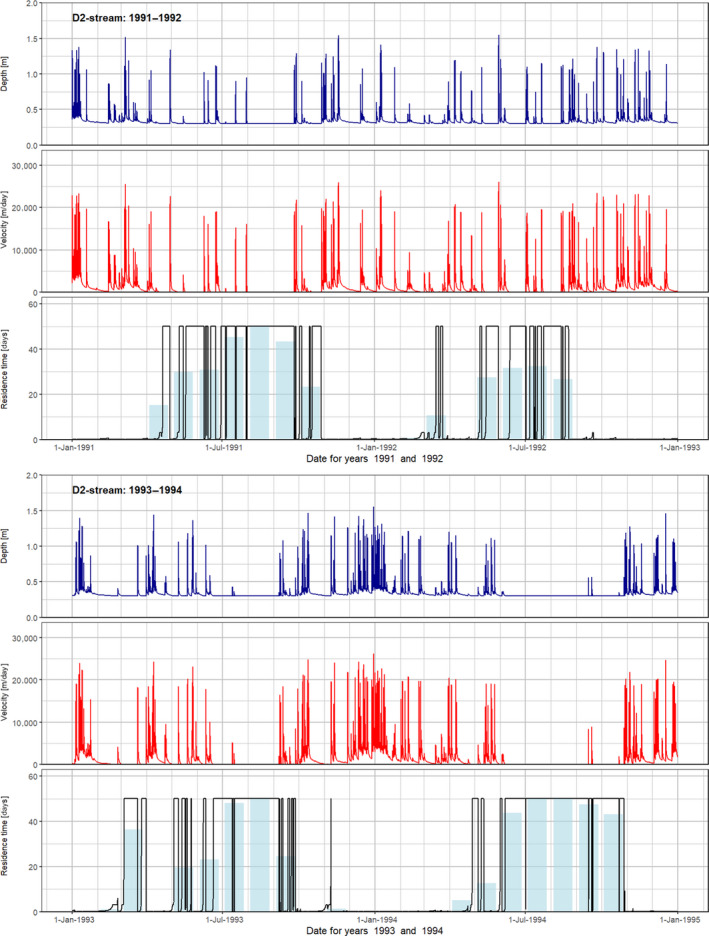
B.3. D3‐Vredepeel ditch: precipitation and drainage fluxes
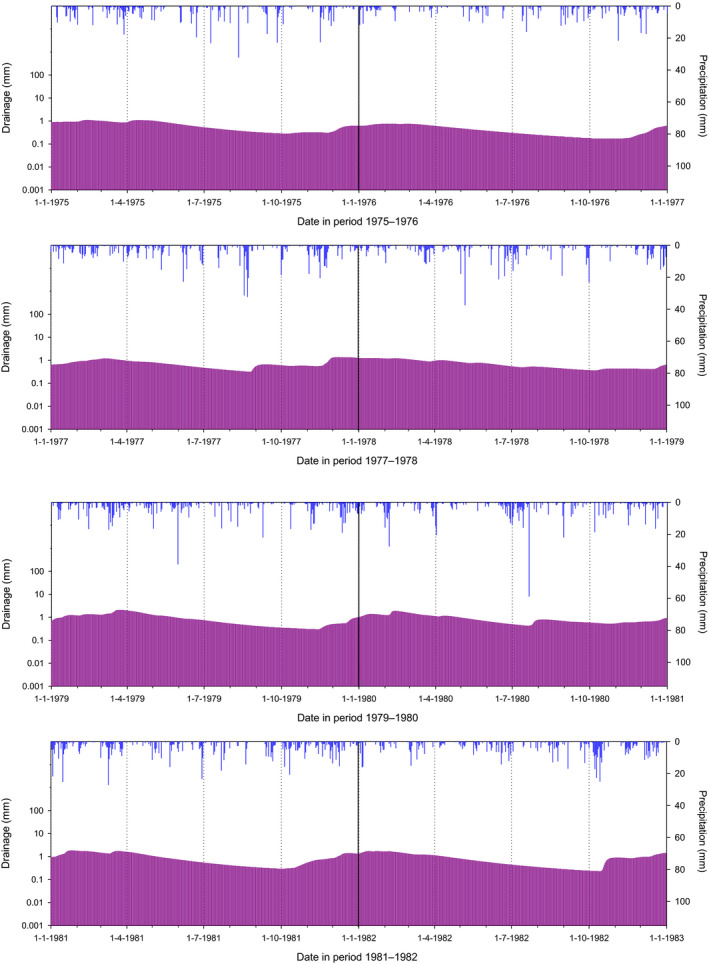
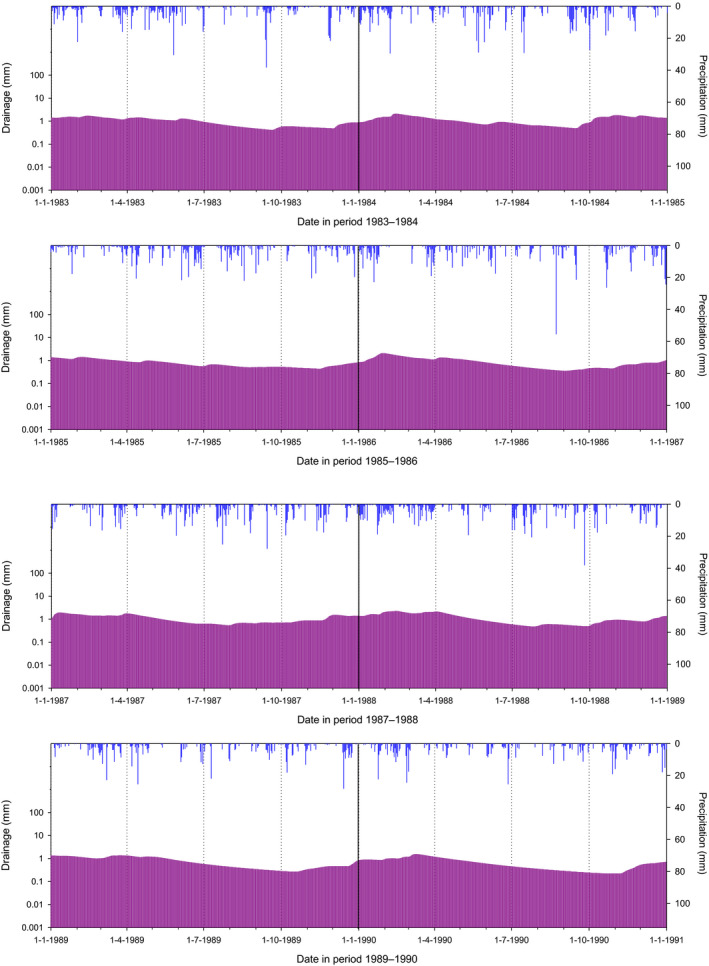
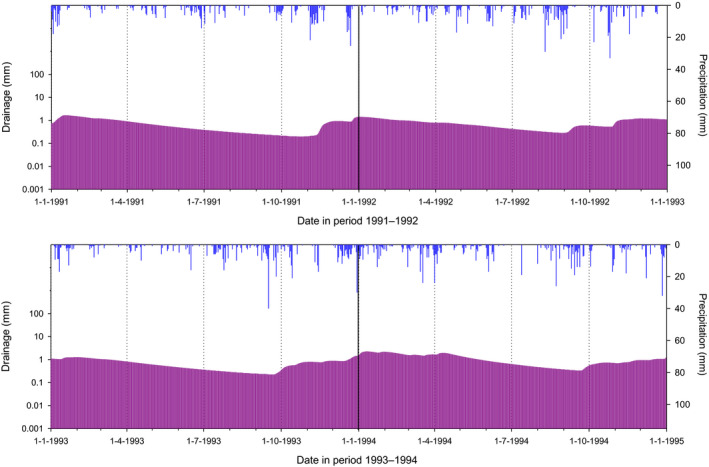
D3‐Vredepeel ditch: water depth, flow velocity and hydraulic residence time
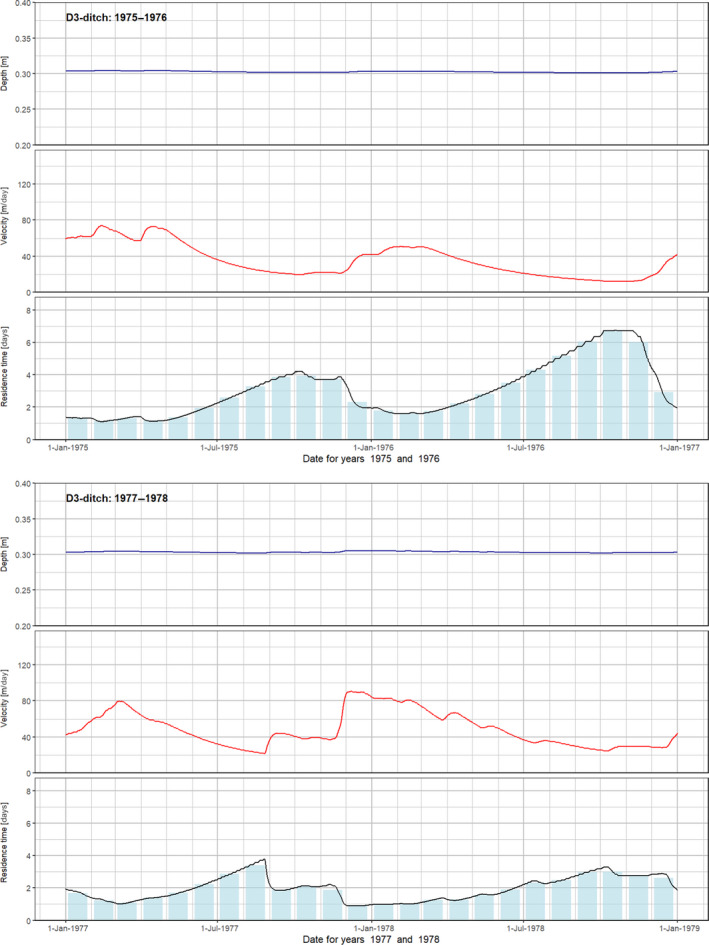
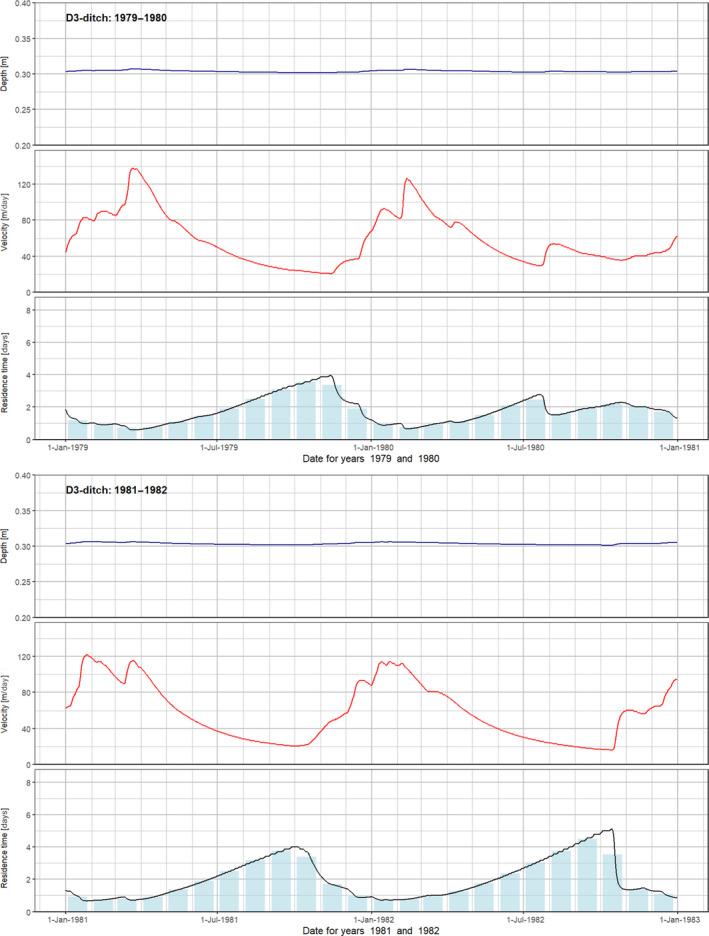
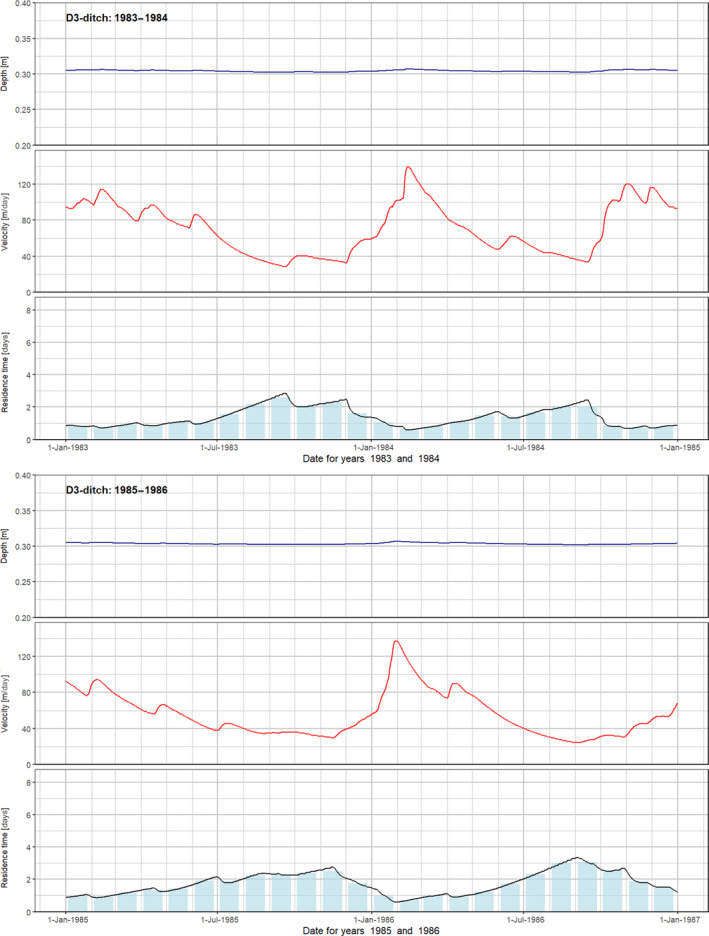
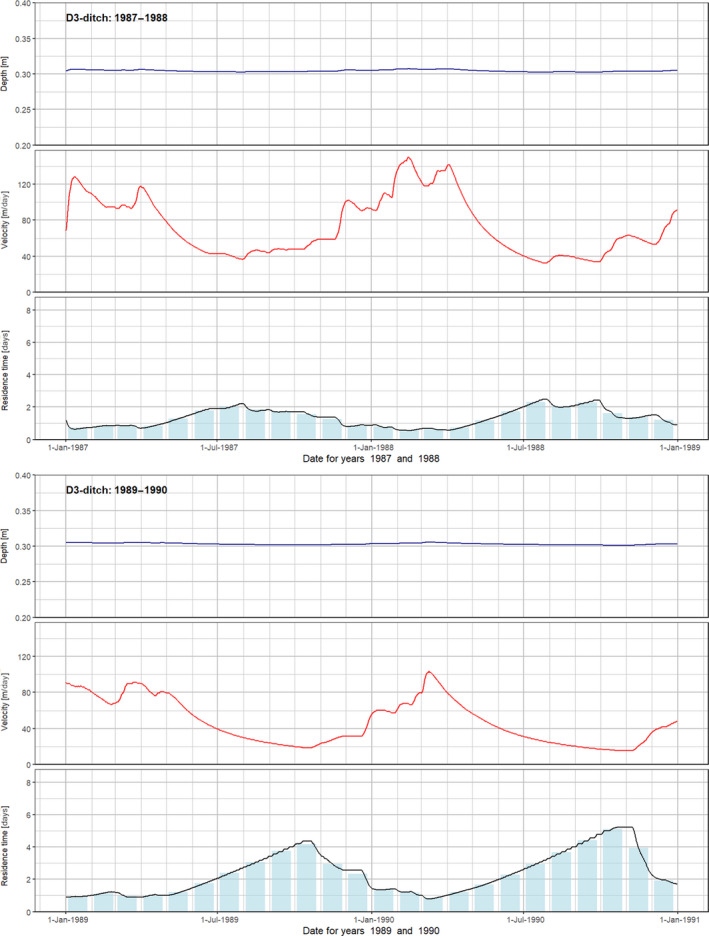
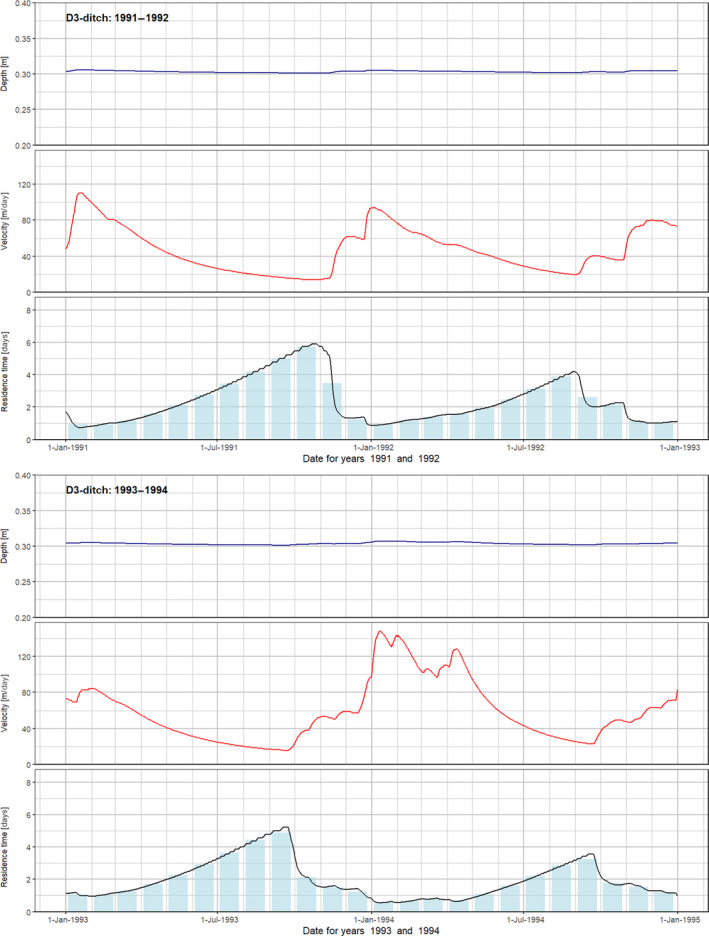
B.4. D4‐Skousbo pond and stream: precipitation and drainage fluxes
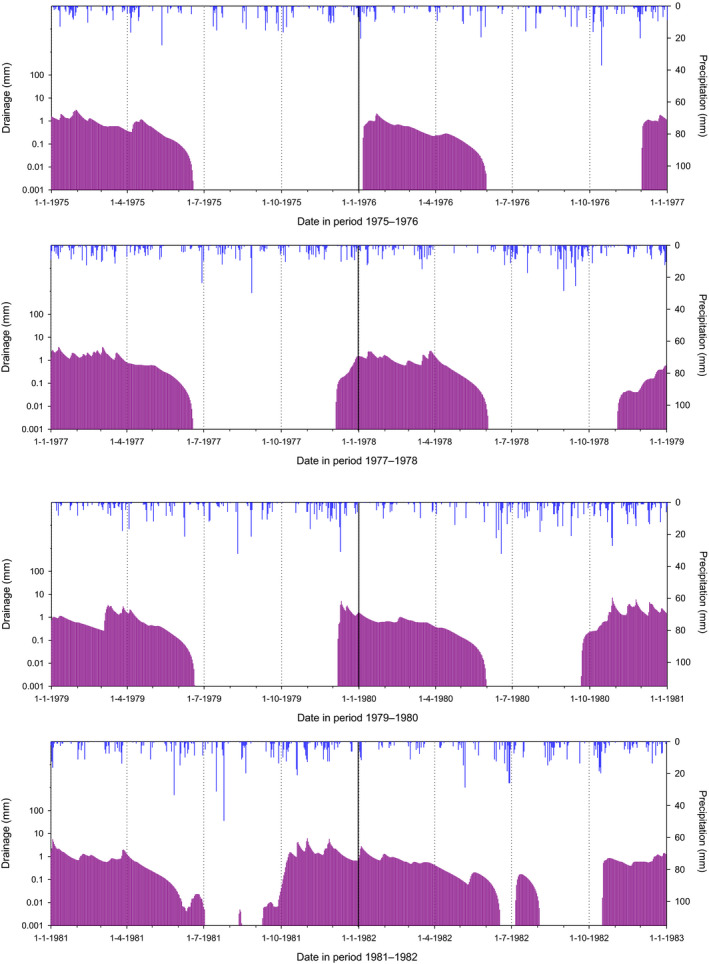
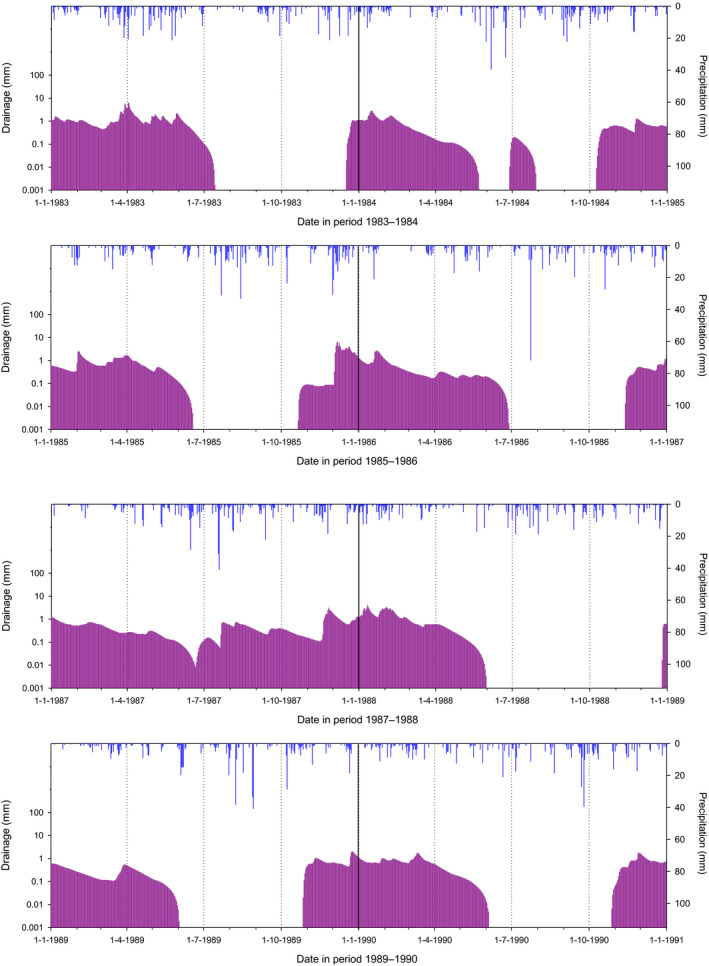
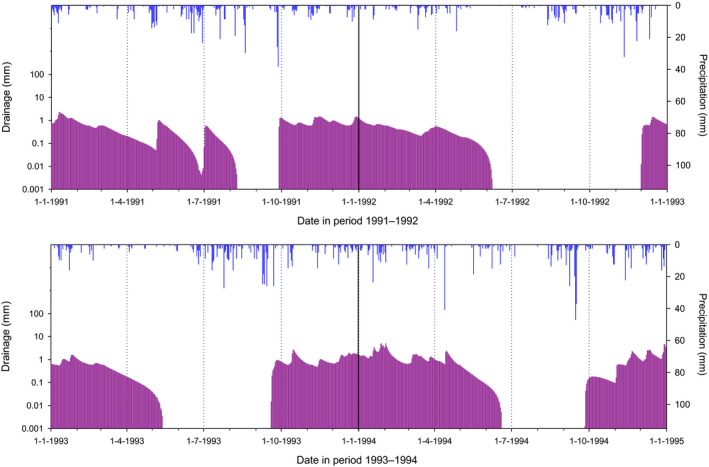
D4‐Skousbo pond: water depth, flow velocity and hydraulic residence time
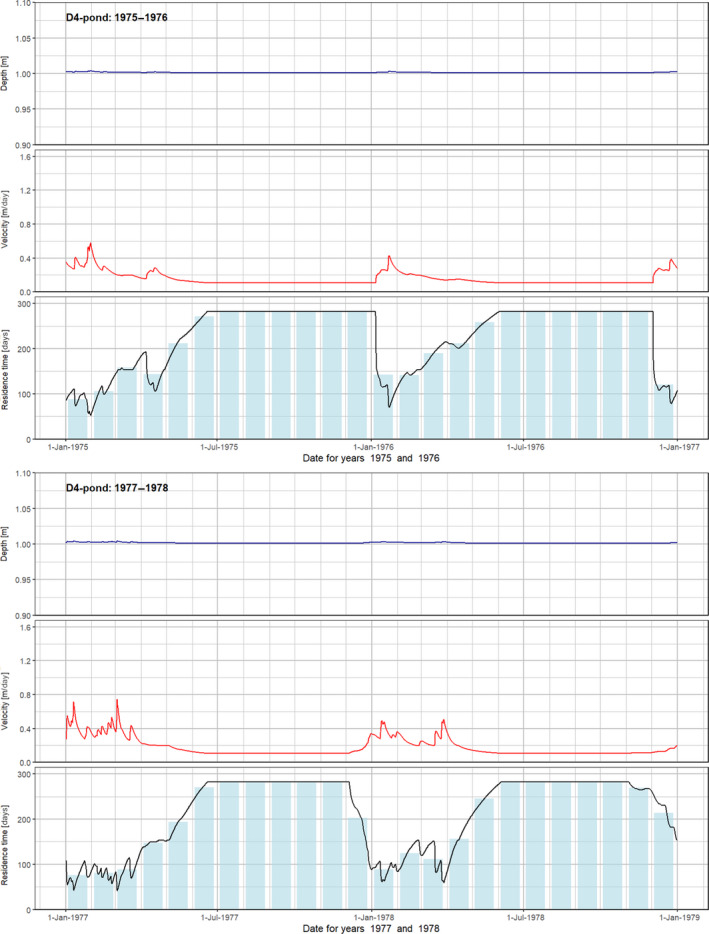
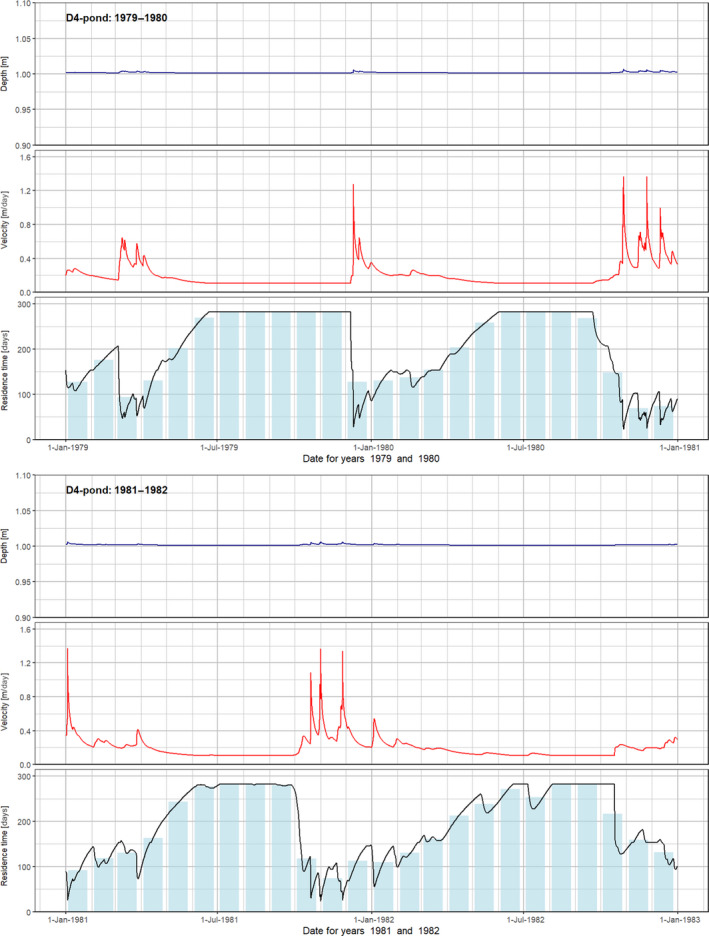
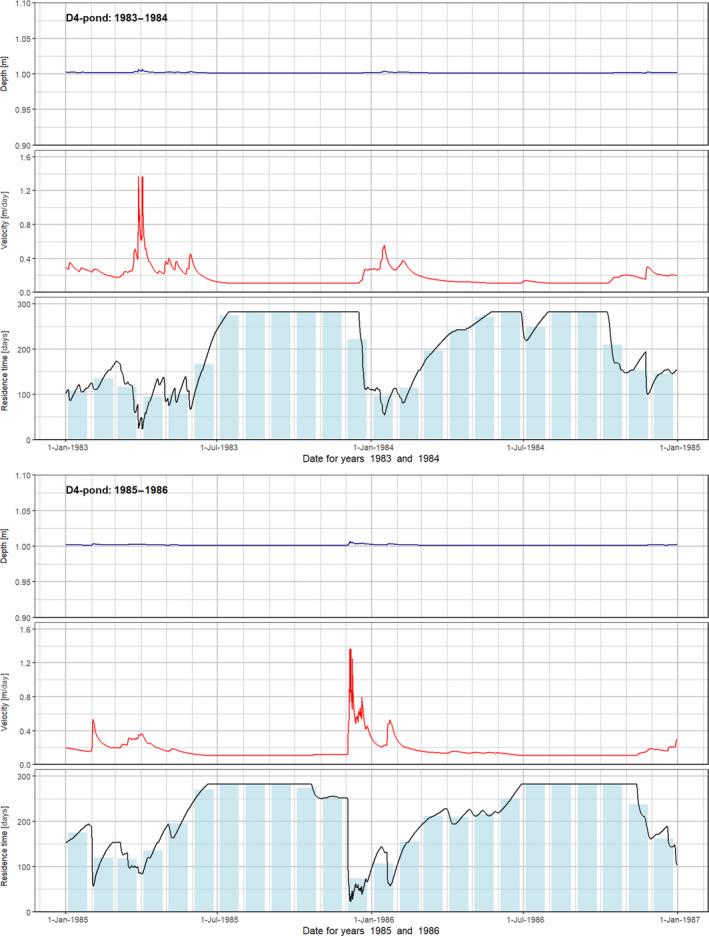
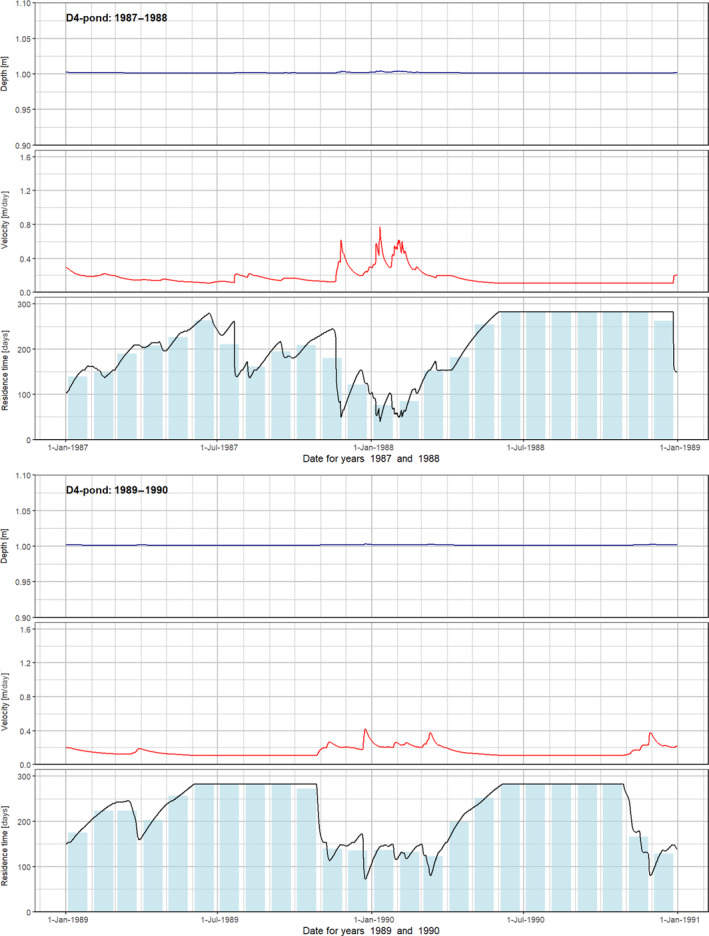
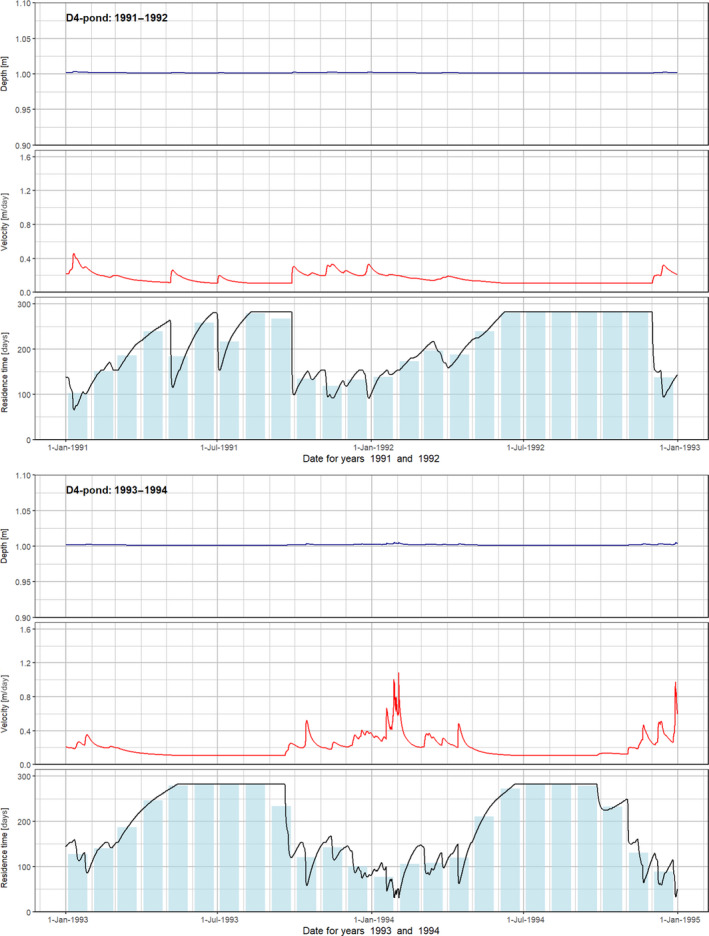
D4‐Skousbo stream: water depth, flow velocity and hydraulic residence time
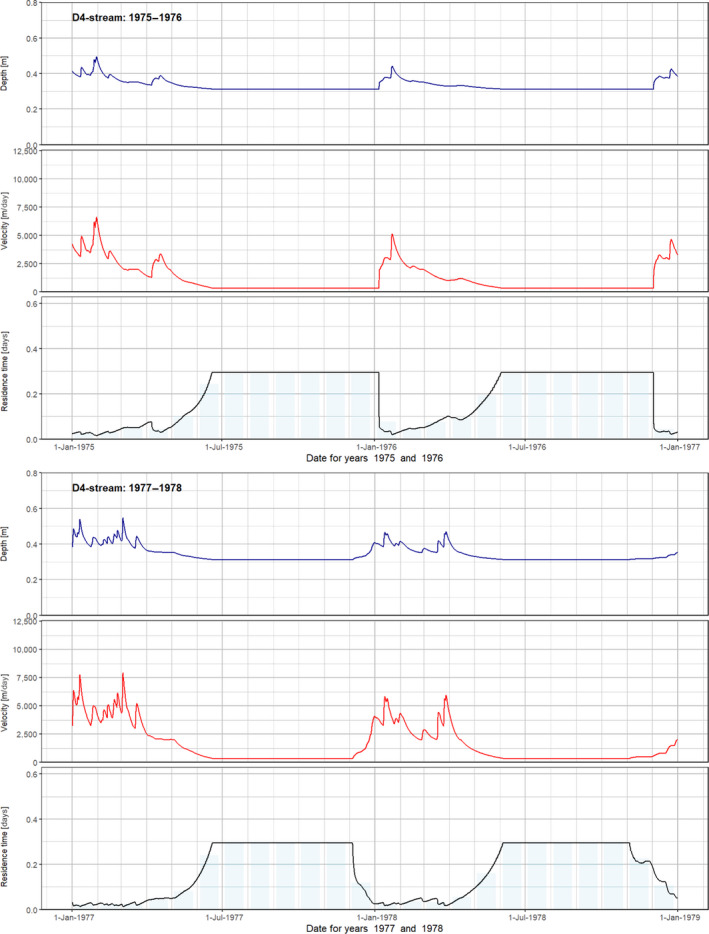
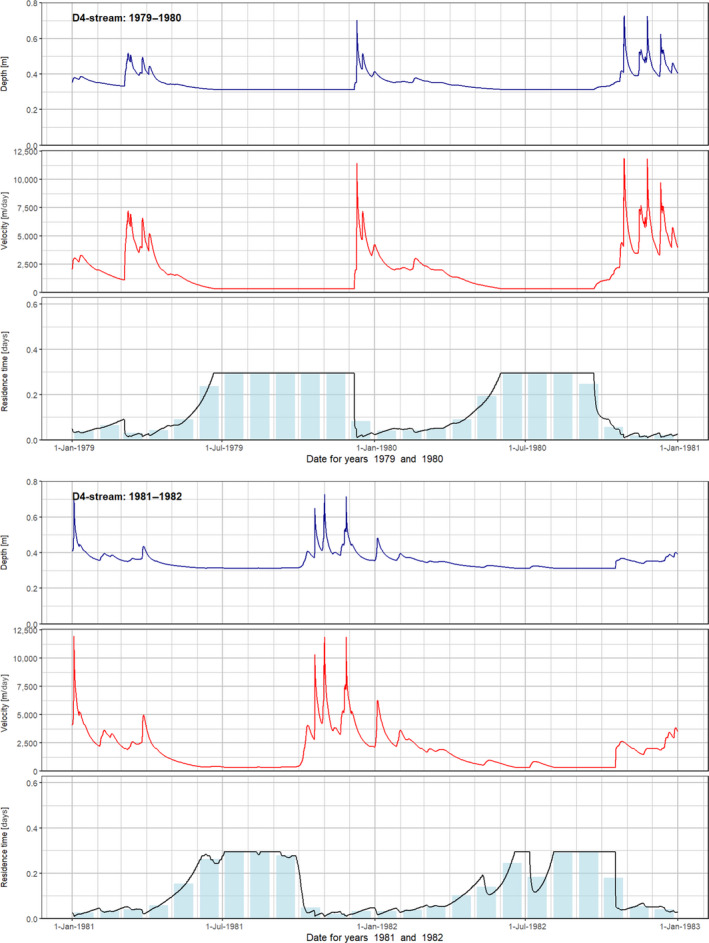
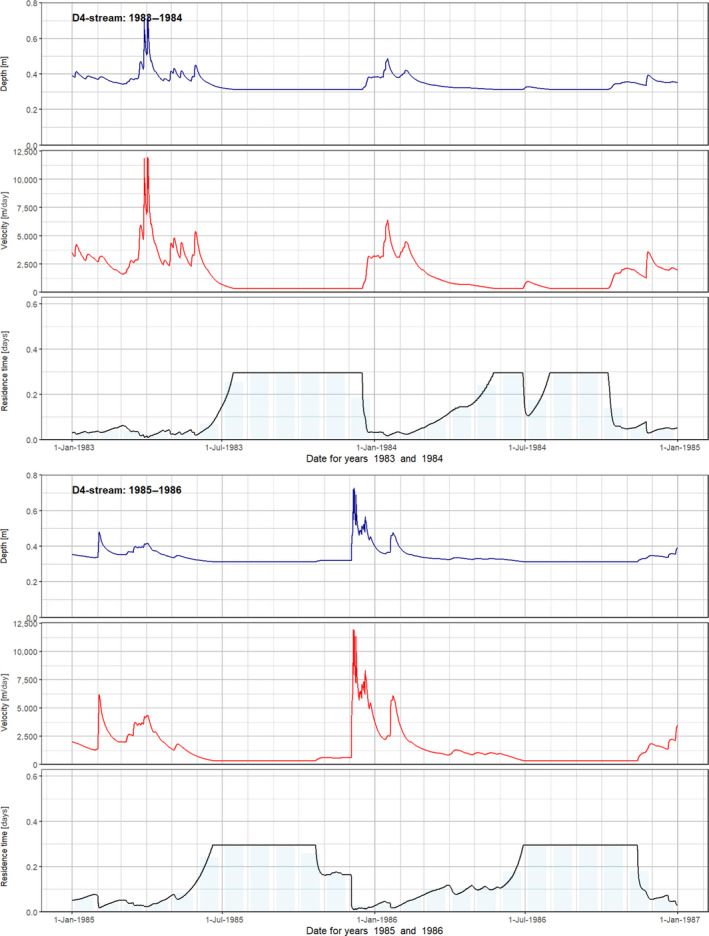
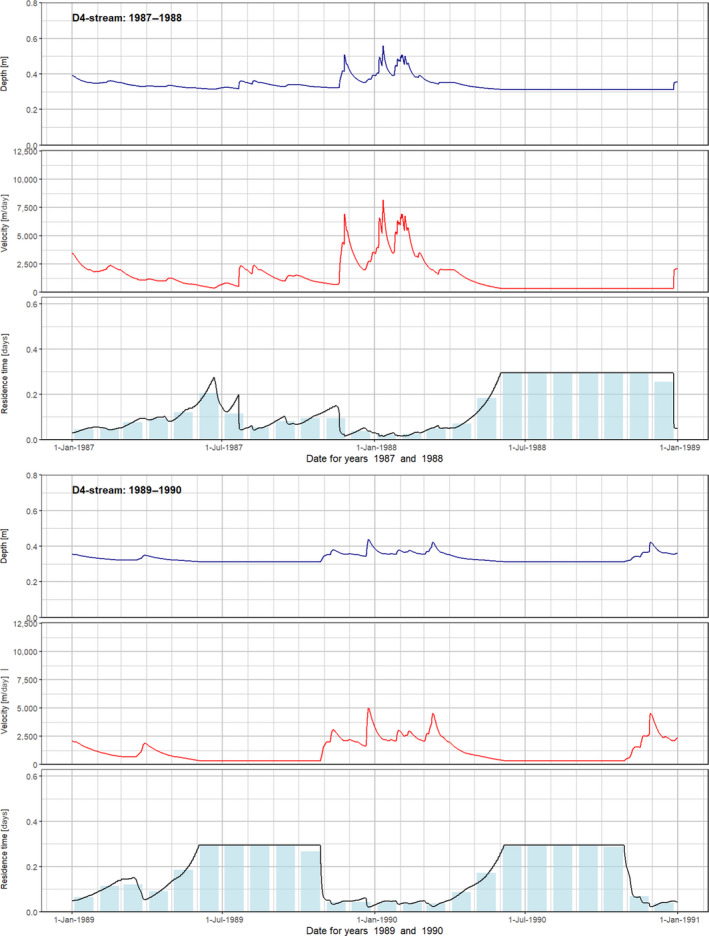
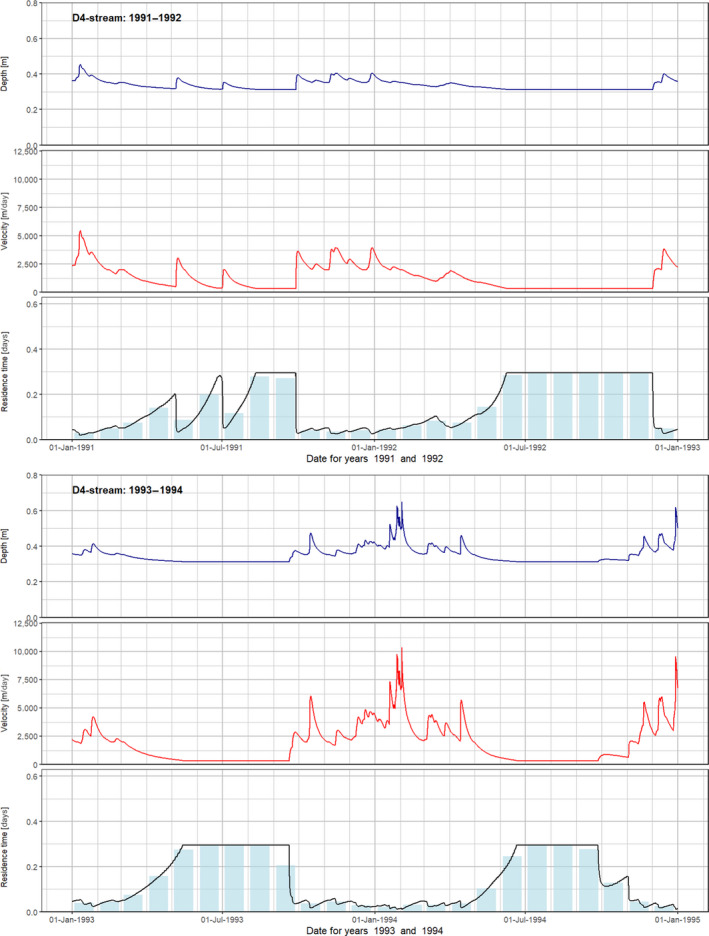
B.5. D5‐La Jaillière pond and stream: precipitation and drainage fluxes
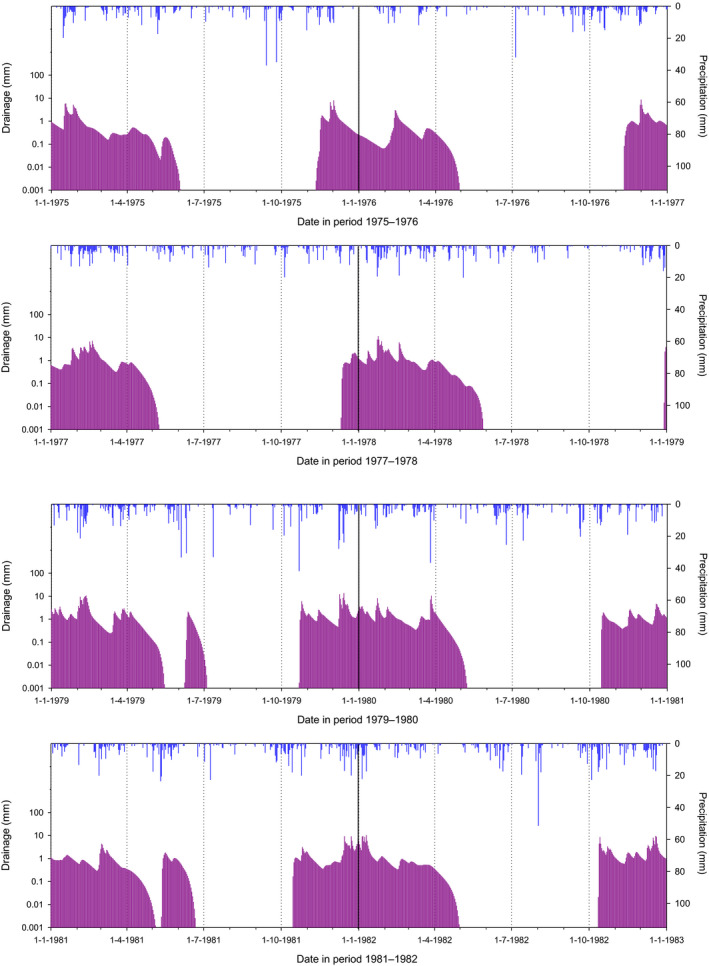
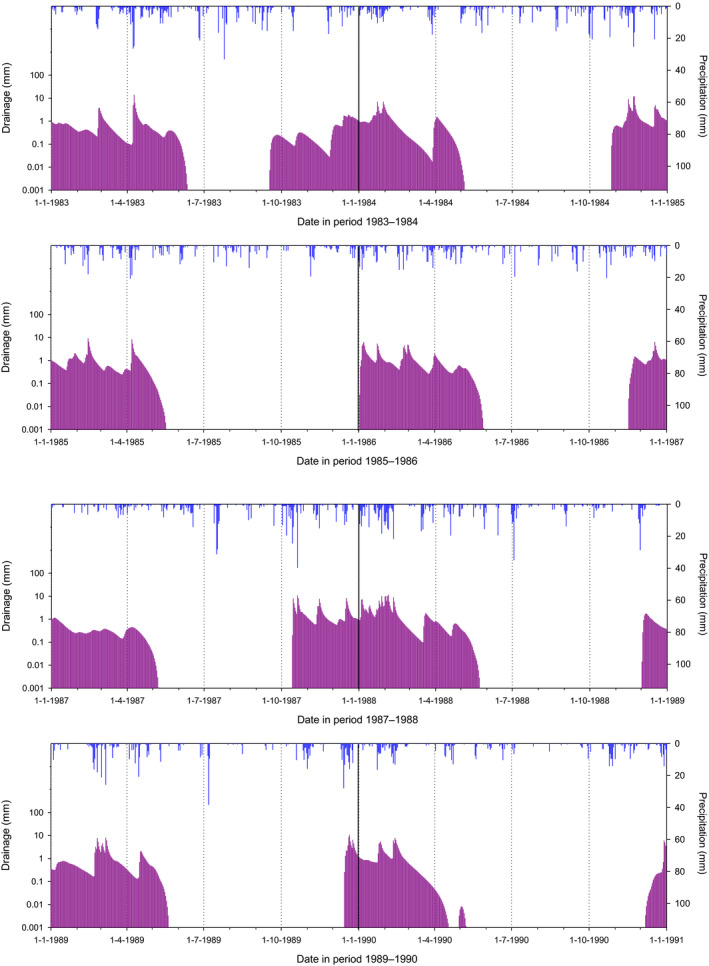
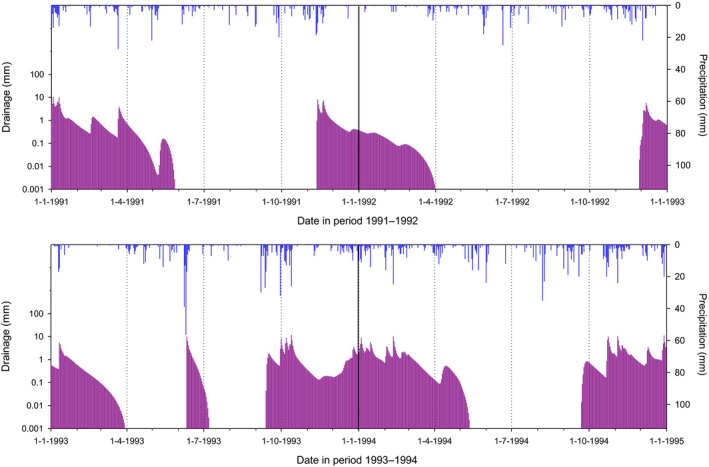
D5‐La Jaillière pond: water depth, flow velocity and hydraulic residence time
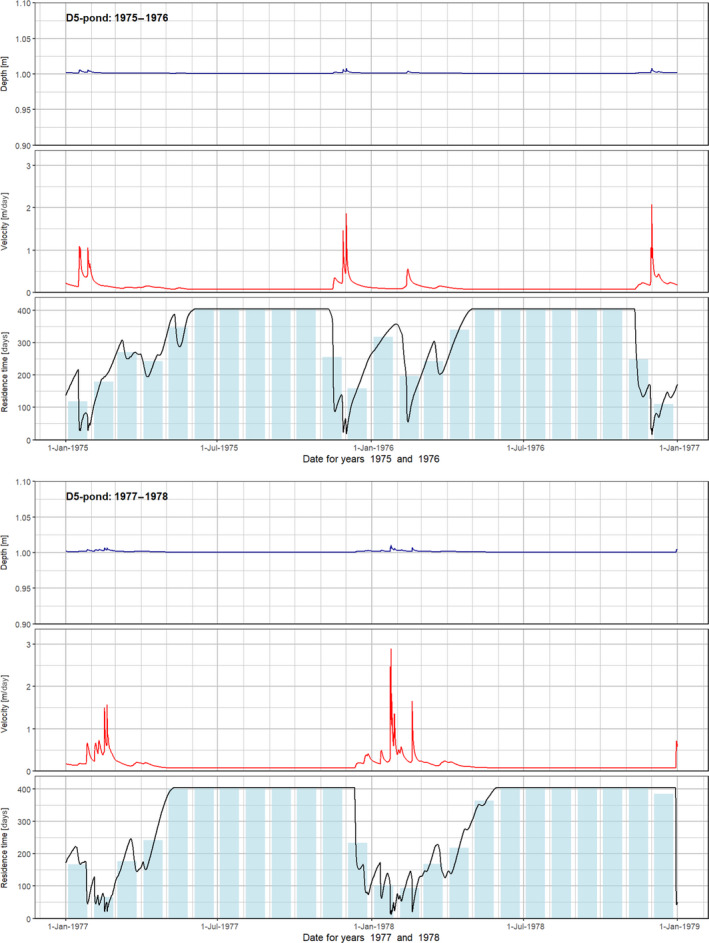
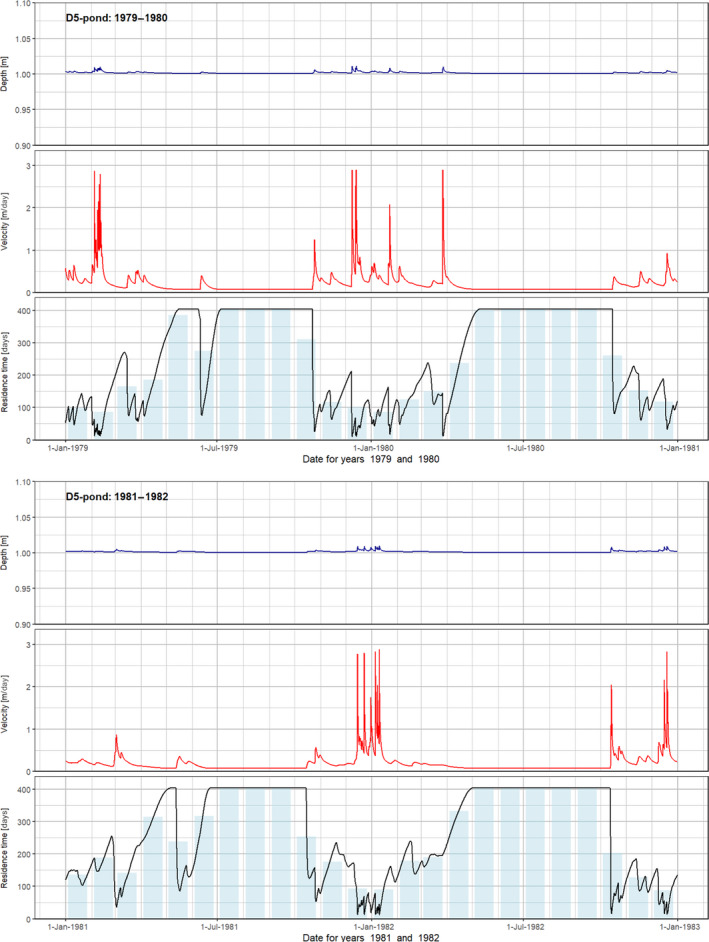
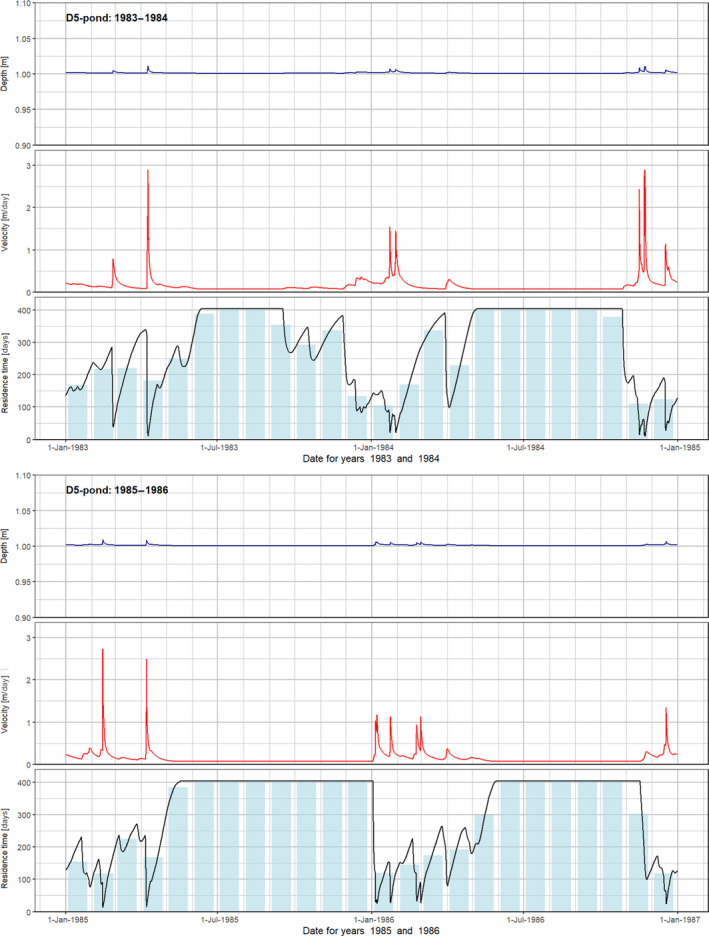
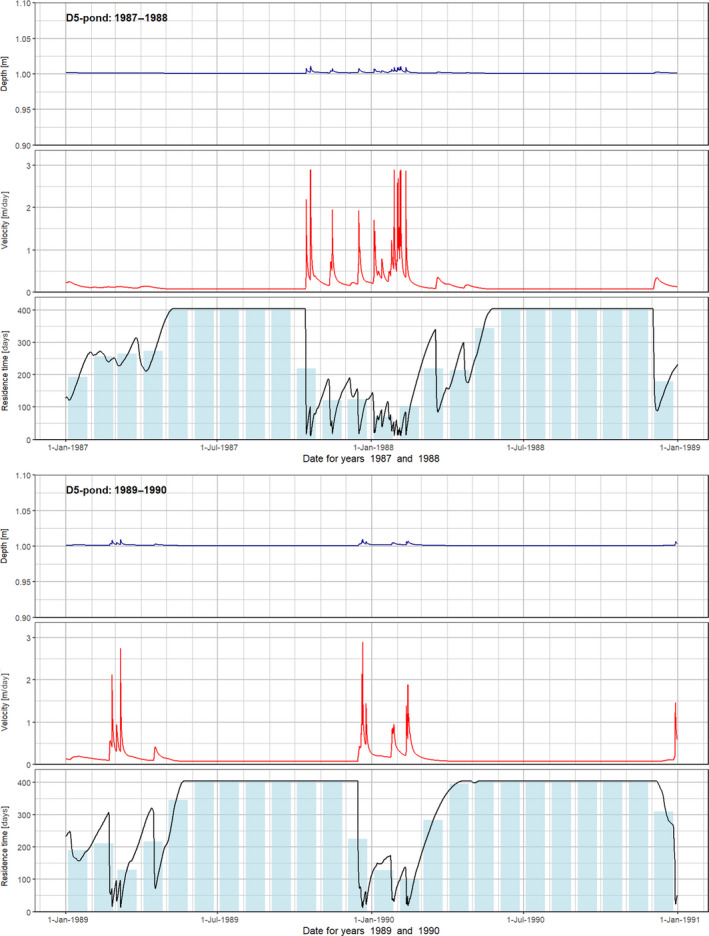
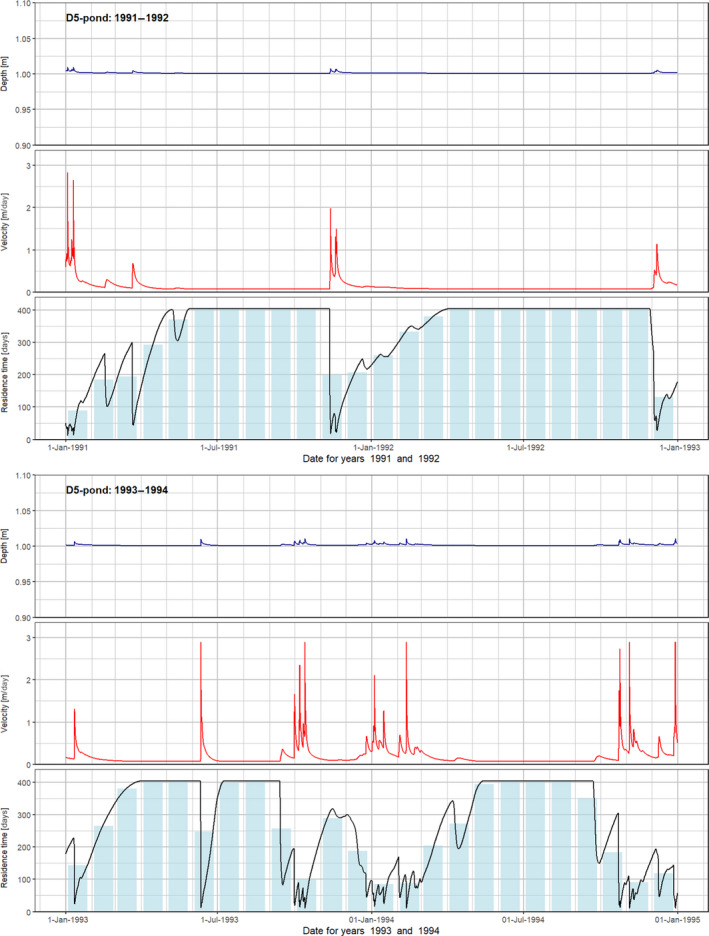
D5‐La Jaillière stream: water depth, flow velocity and hydraulic residence time
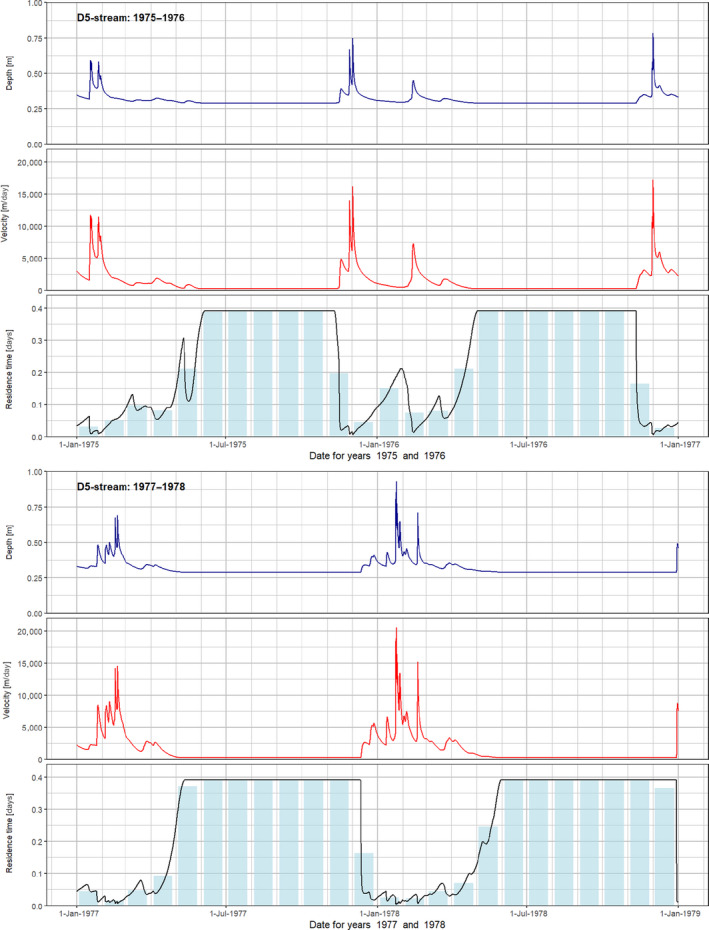
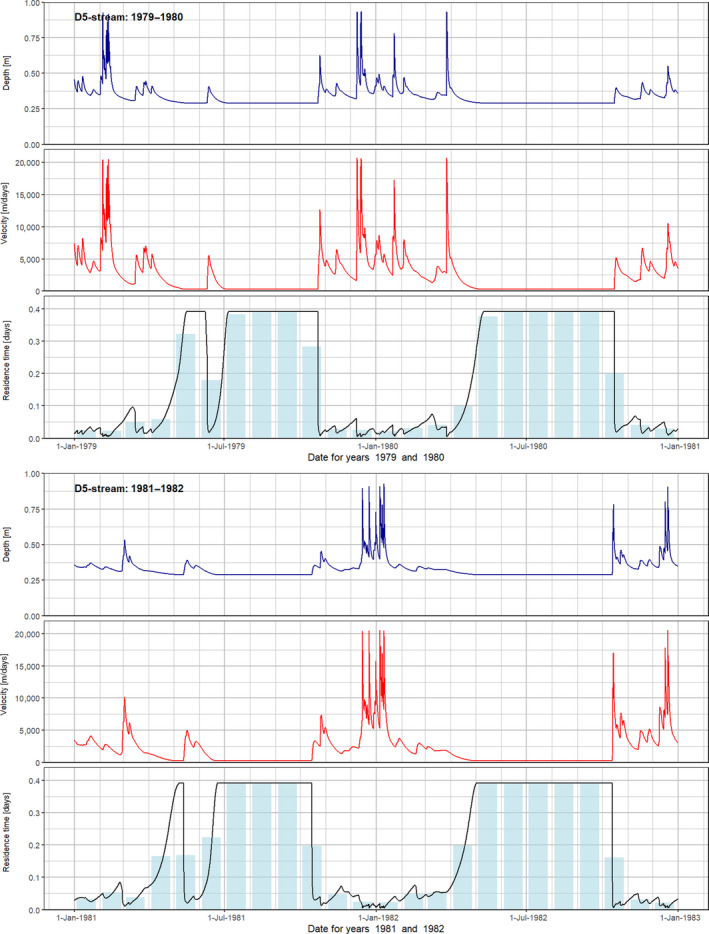
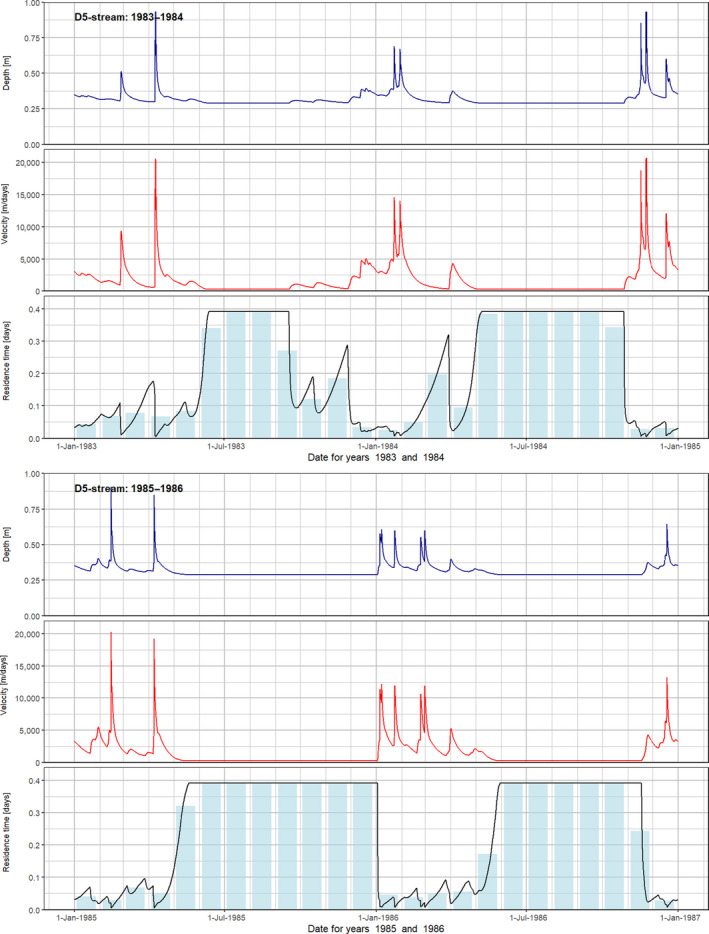
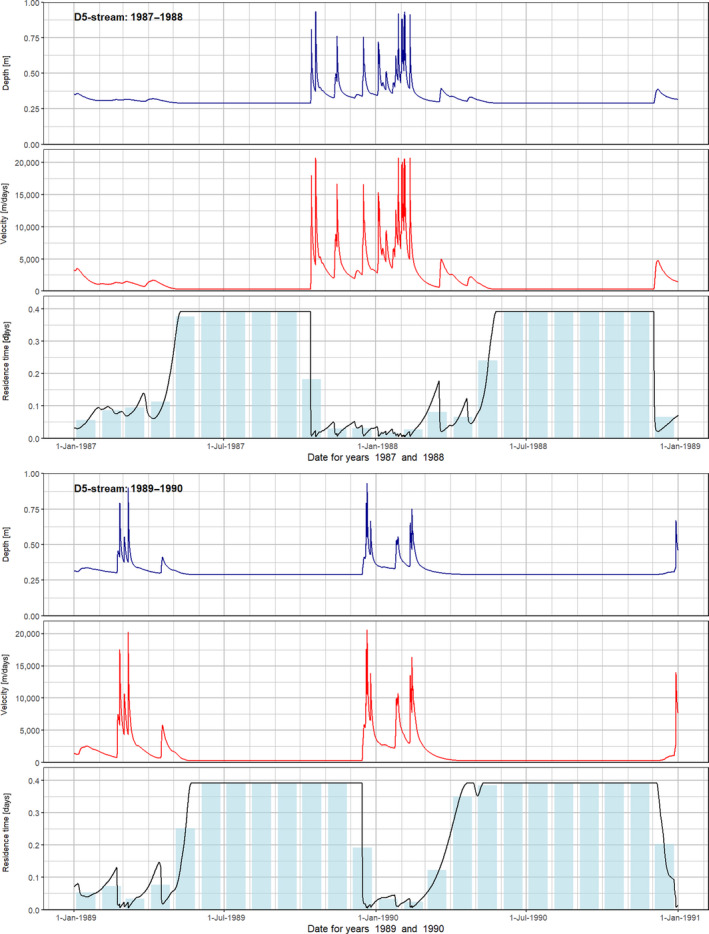
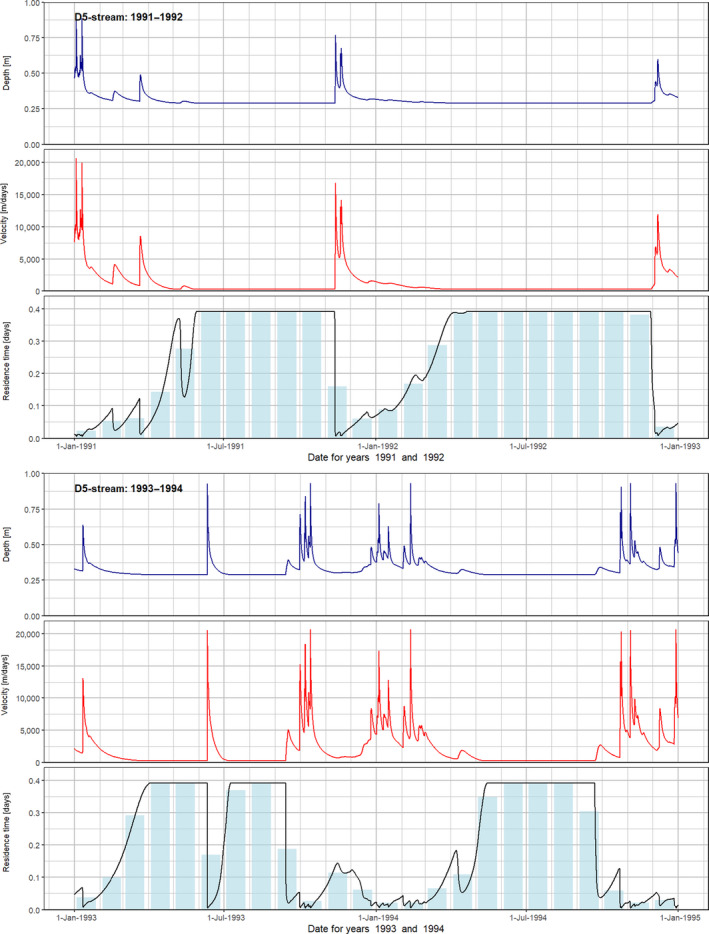
B.6. D6‐Thiva ditch: precipitation and drainage fluxes
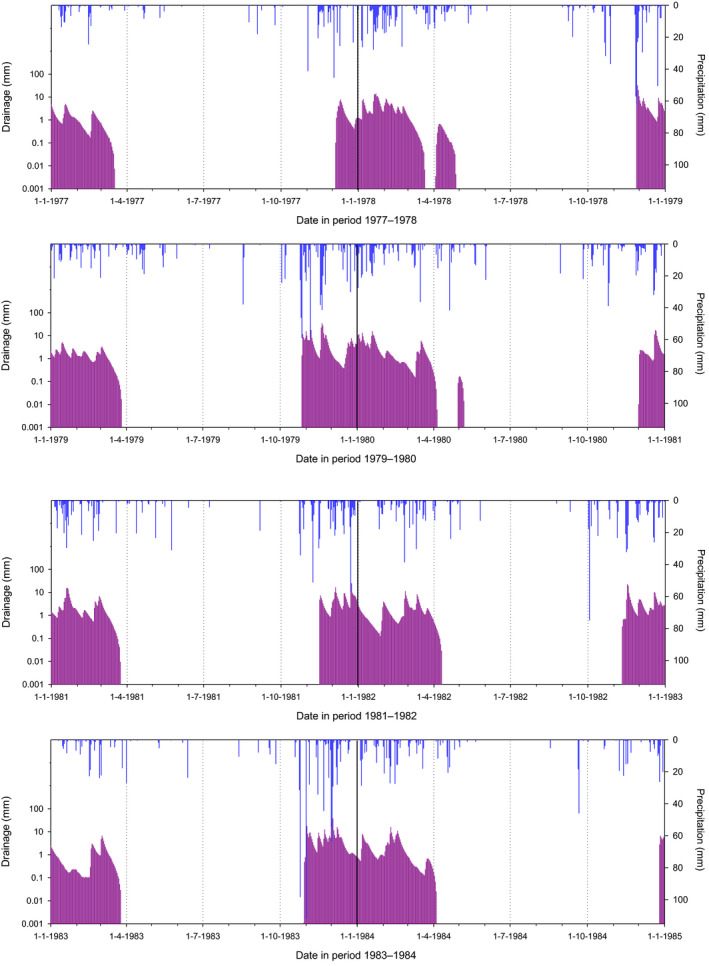
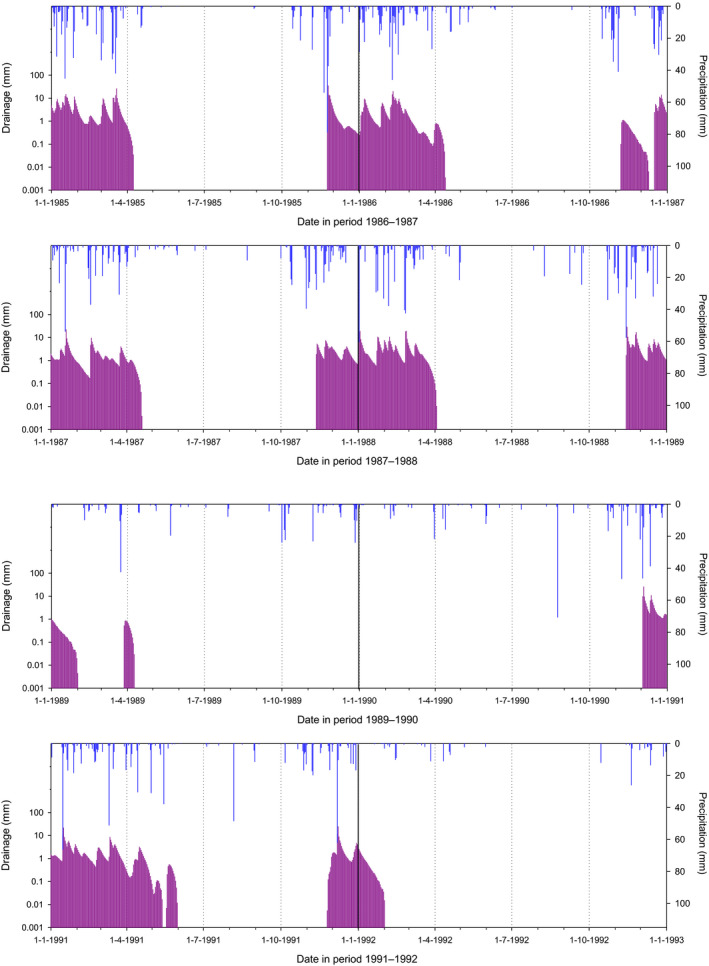
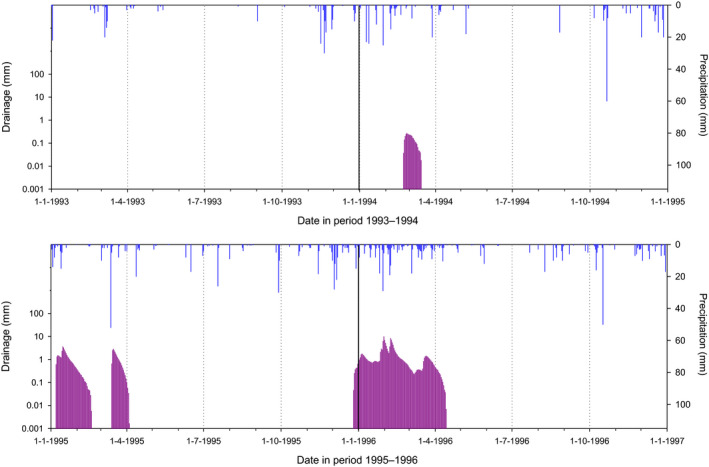
D6‐Thiva ditch: water depth, flow velocity and hydraulic residence time
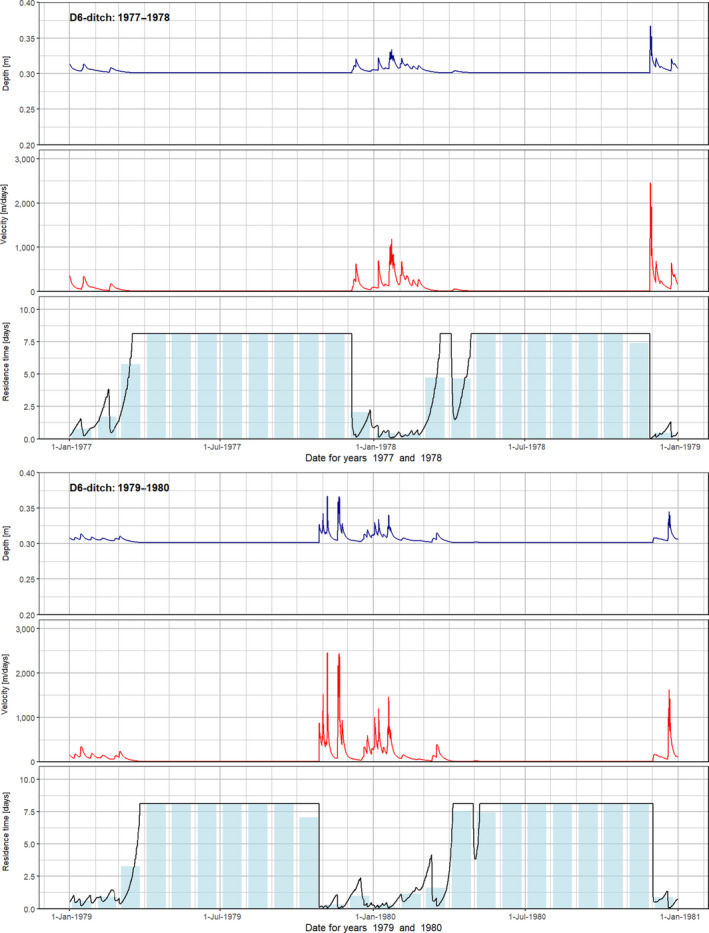
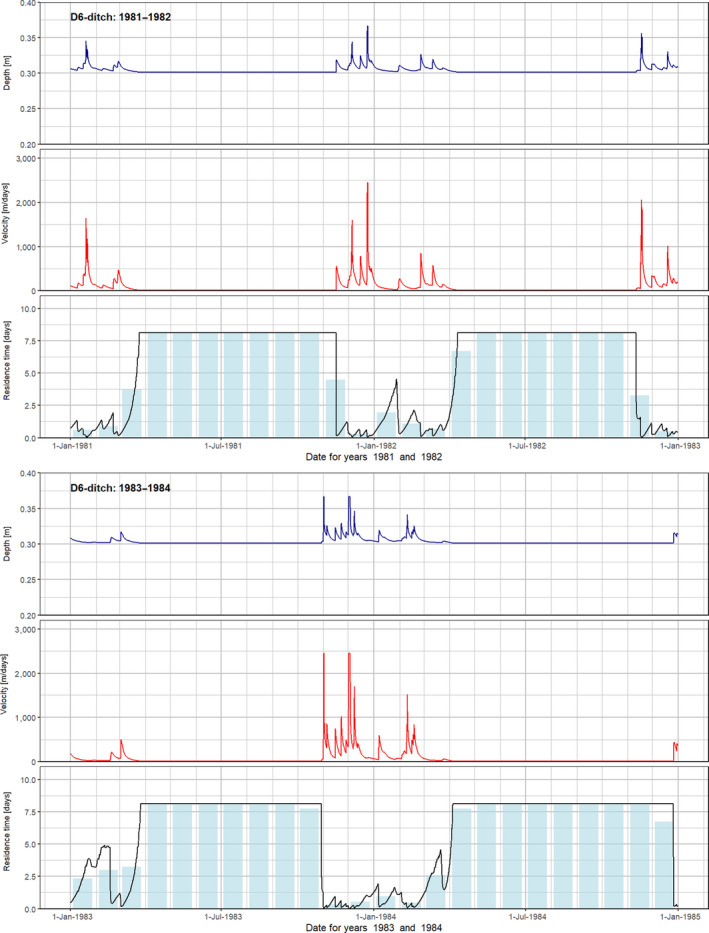
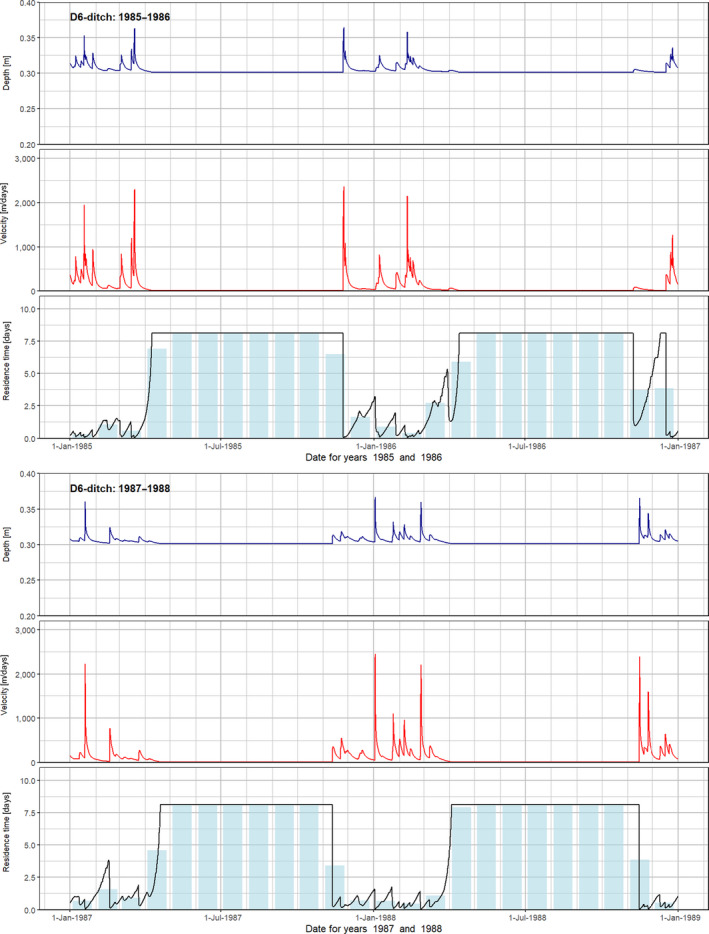
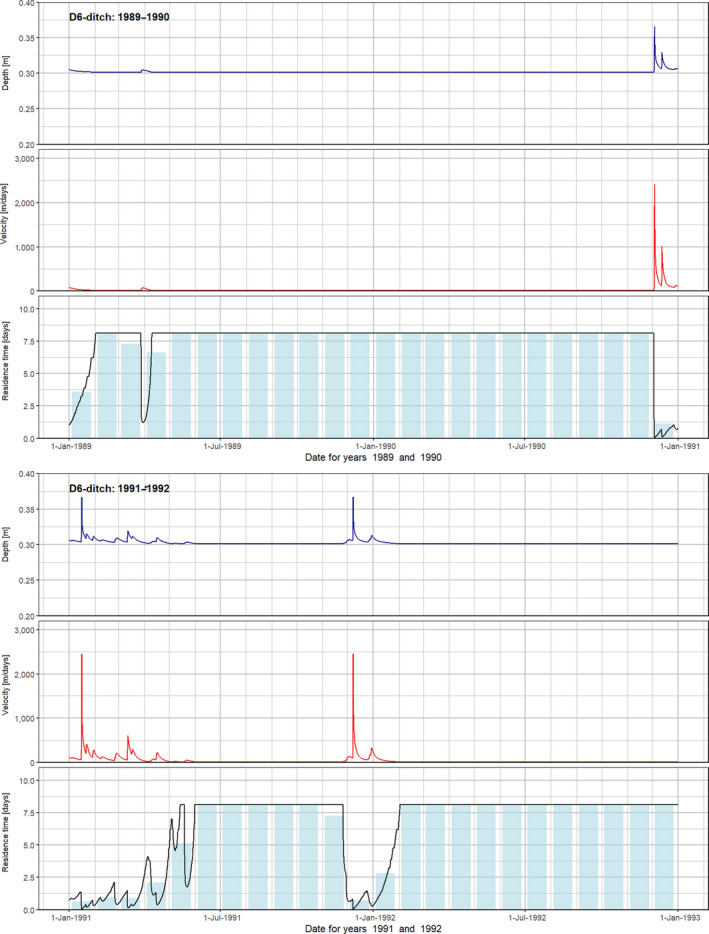
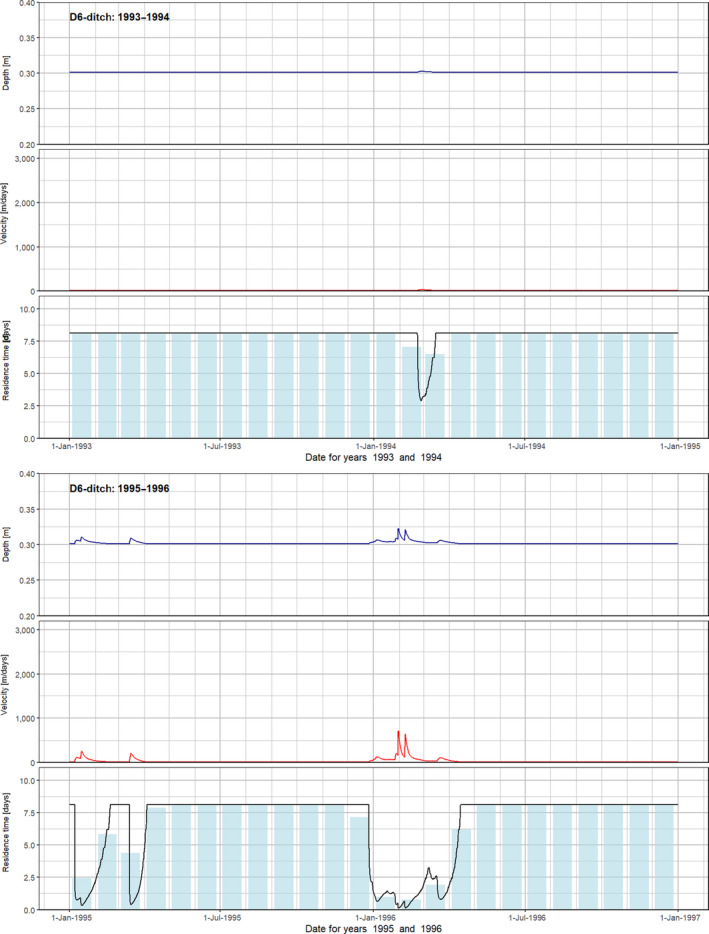
Appendix C – Rainfall and run‐off events as well as water depth, flow velocity and hydraulic residence time in the waterbody as a function of time for the revised FOCUS surface water run‐off scenarios
1.
Data presented in this appendix are based upon the.zts file (of WINPRZM.exe of 28 October 2019), in which the precipitation is zero on days when the temperature is below zero, i.e. on days with snowfall. Data for the hydrological response graphs (water depth, flow velocity and hydraulic residence time in the waterbody) were derived from FOCUS_TOXSWA output, version 6.6.4 (model 3.3.7‐R, created 11 November 2019). Considered crops are winter cereals for R1‐Weiherbach, R3‐Bologna and R4‐Roujan and maize for R2‐Porto (all non‐irrigated crops).
Time period covered (20‐year assessment period): 1975–1994 for all run‐off scenarios.
Four large precipitation events in scenario R4‐Roujan have been indicated in the graphs: 129 mm on 26 August 1987, 228 mm on 3 October 1988, 125 mm on 26 September 1992 and 122 mm on 20 October 1994.
Following the figure section, Table C.1 gives a summary of annual precipitation and run‐off for each of the four scenarios.
C.1. R1‐Weiherbach pond and stream: precipitation and run‐off fluxes
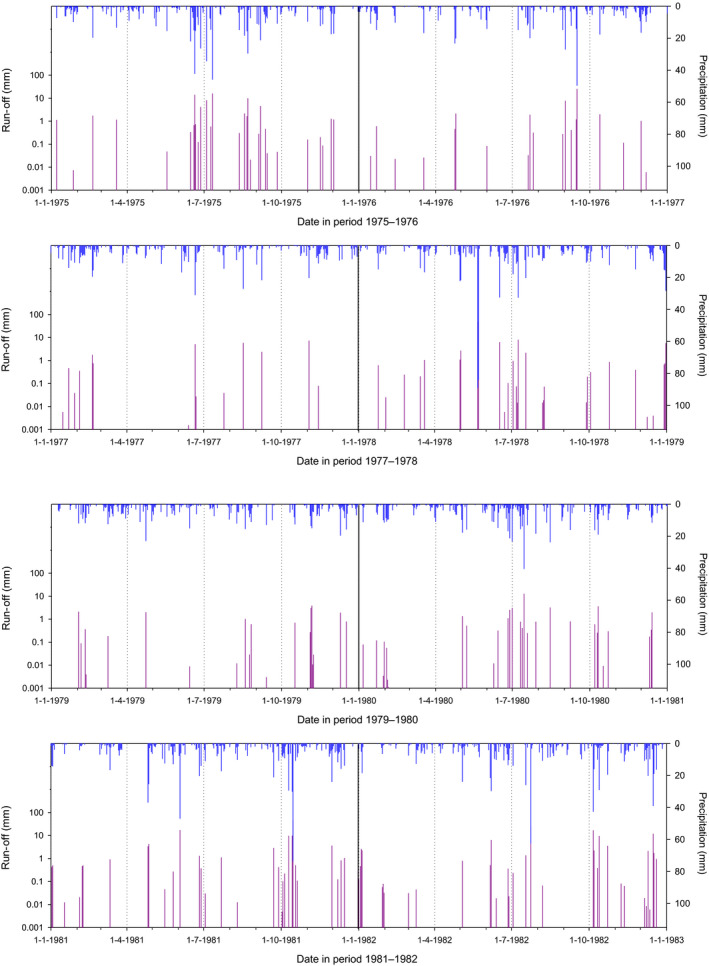
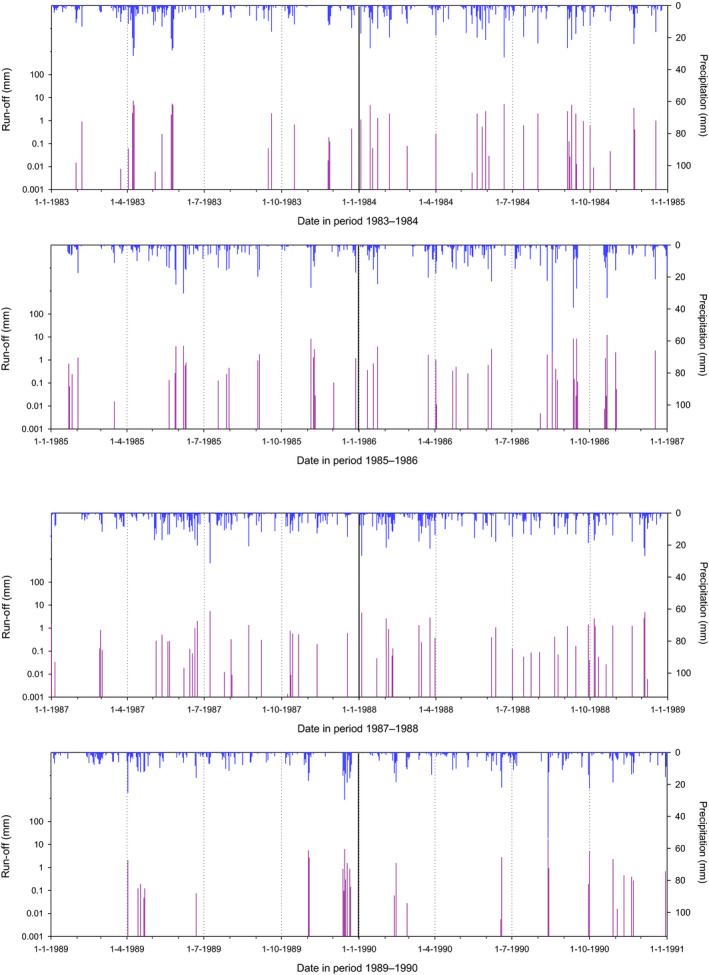
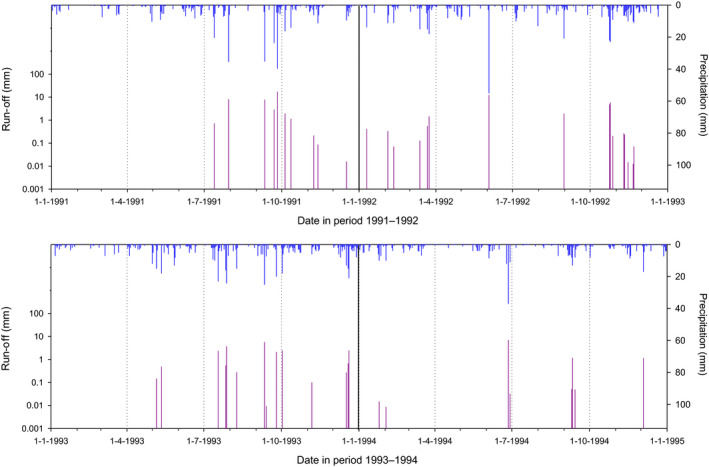
R1‐Weiherbach pond: water depth, flow velocity and hydraulic residence time
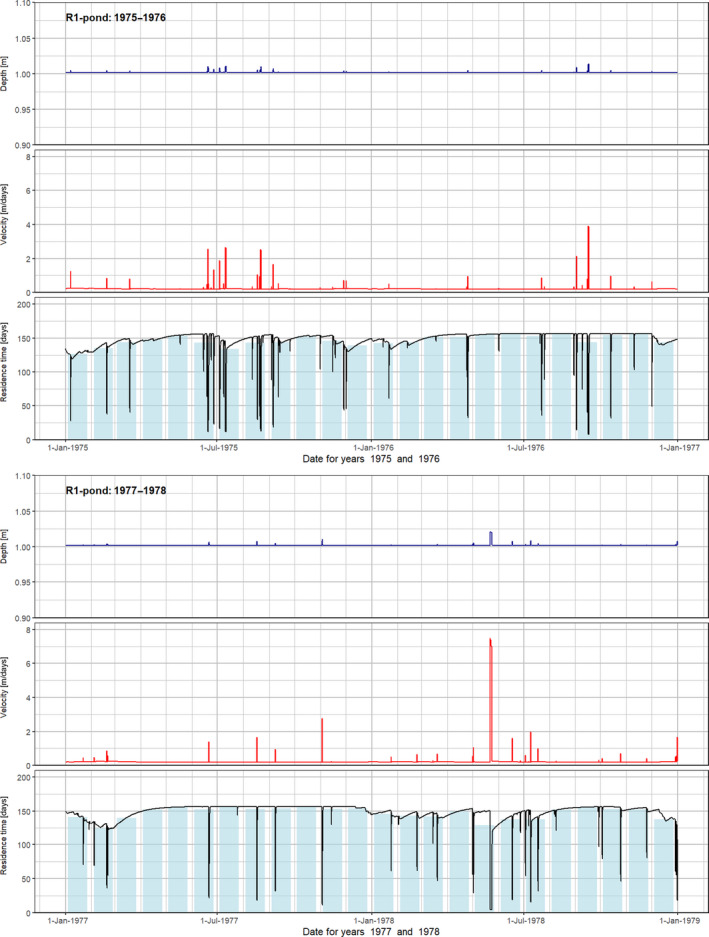
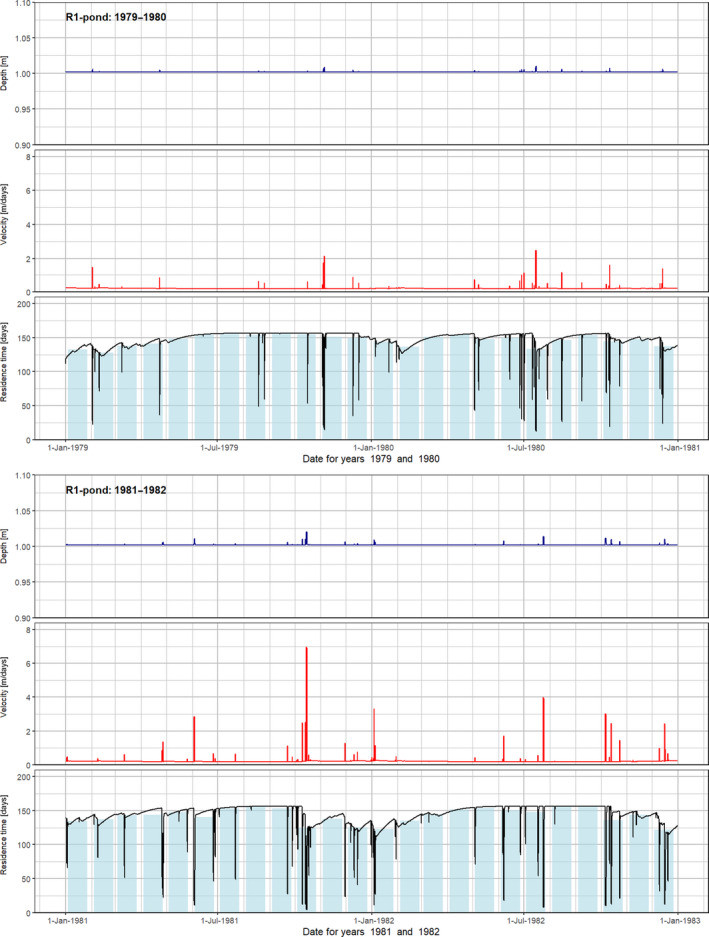
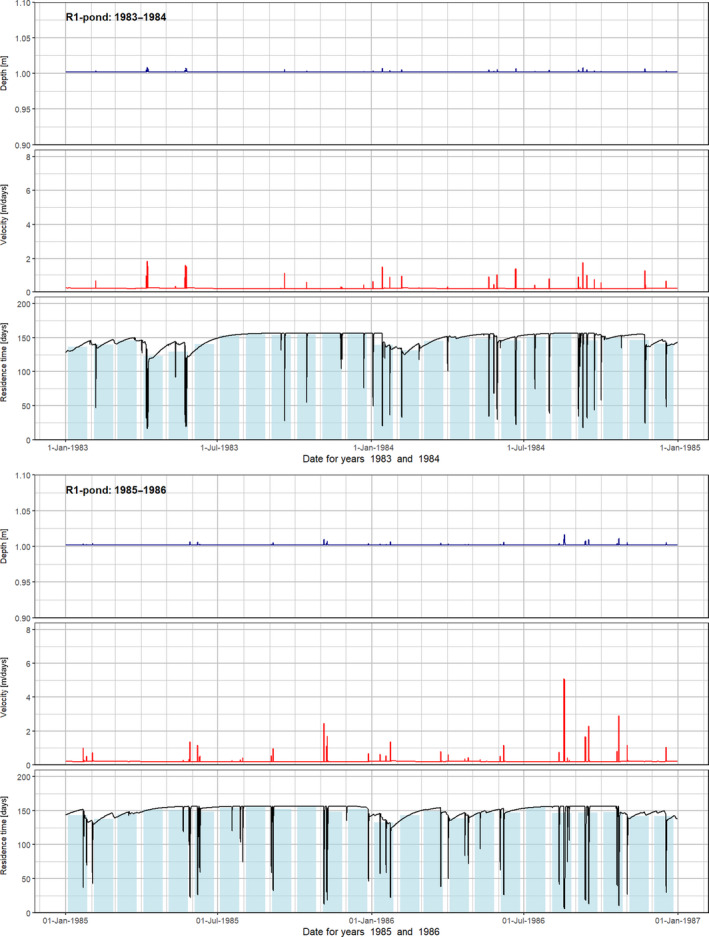
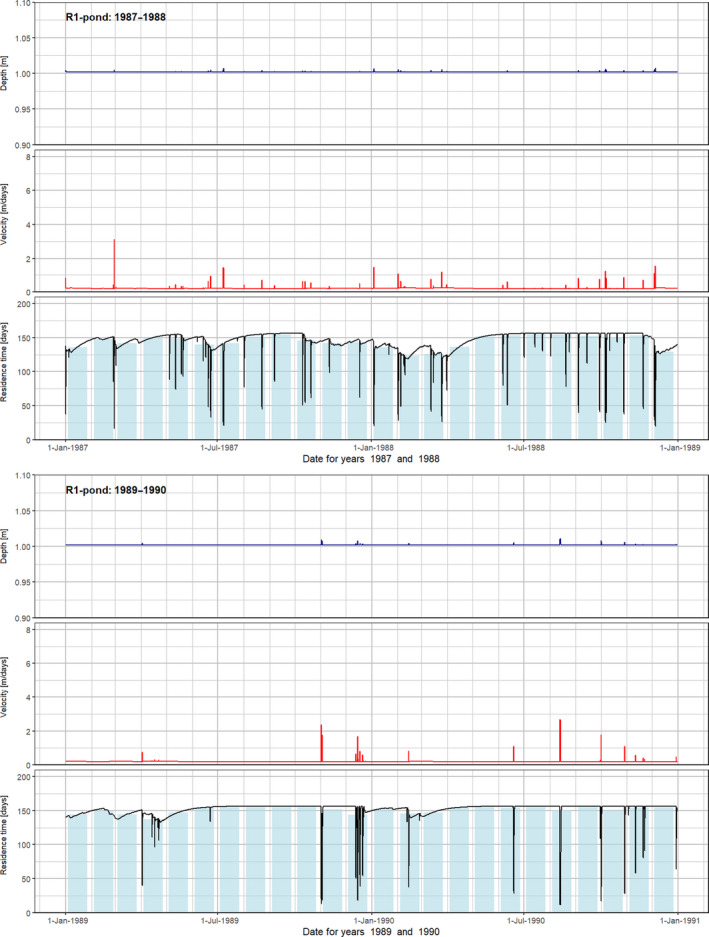
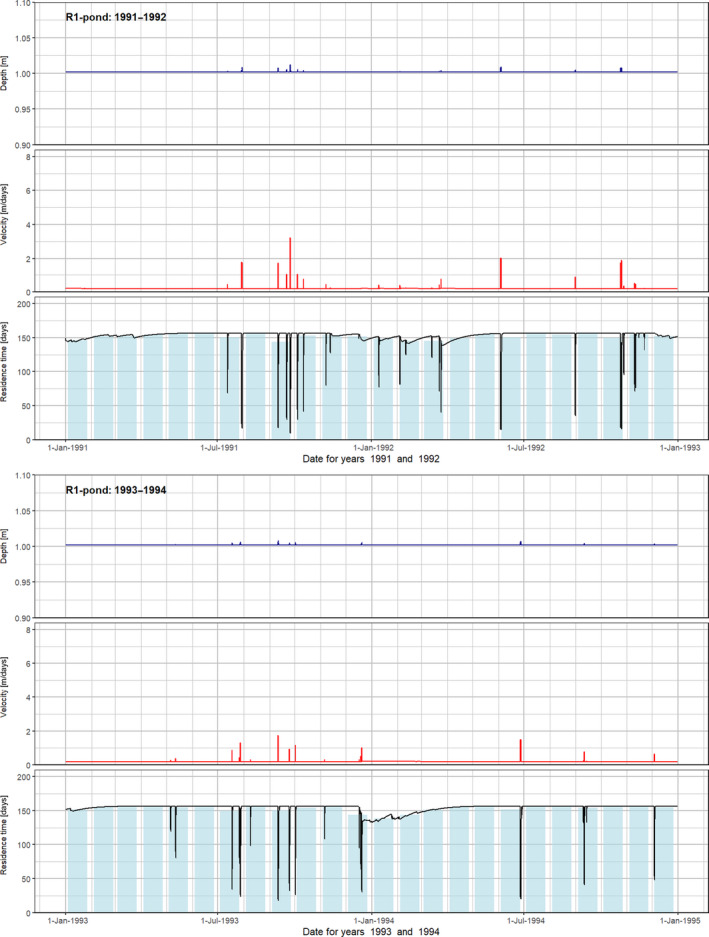
R1‐Weiherbach stream: water depth, flow velocity and hydraulic residence time
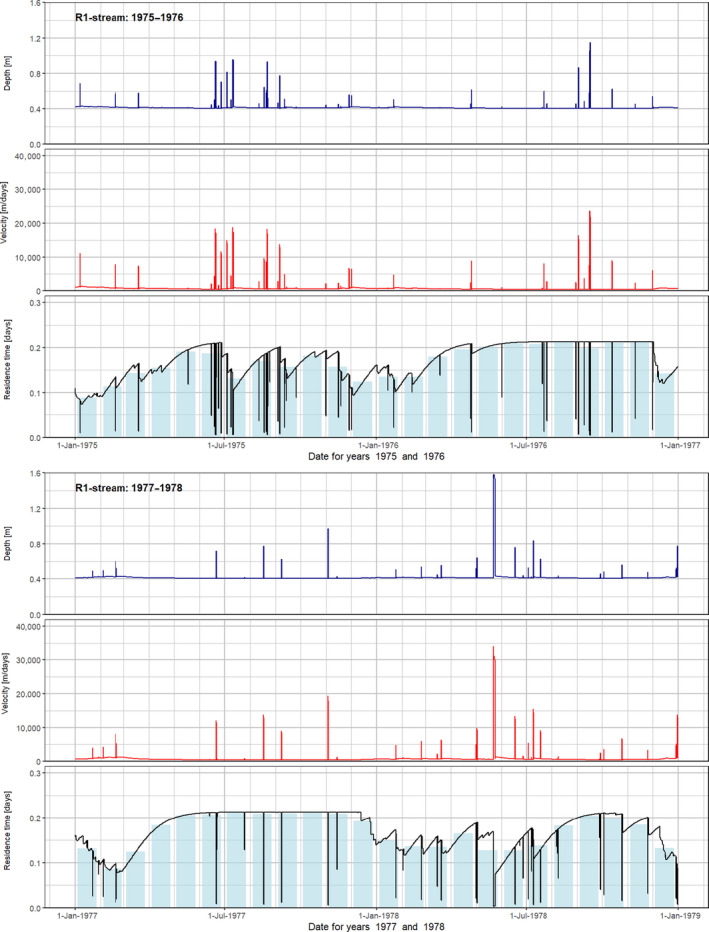
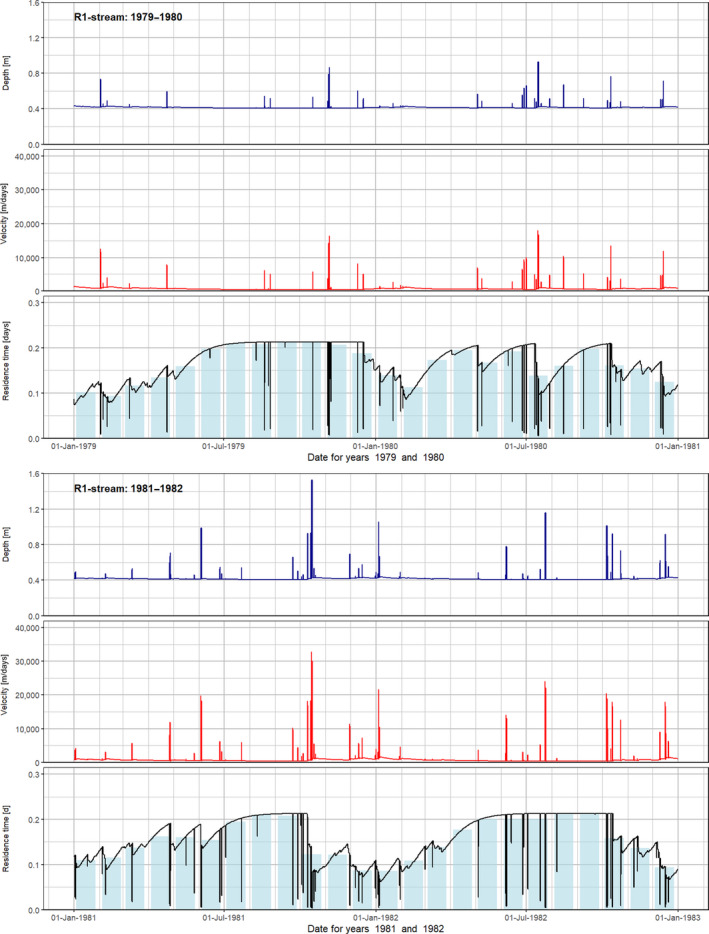
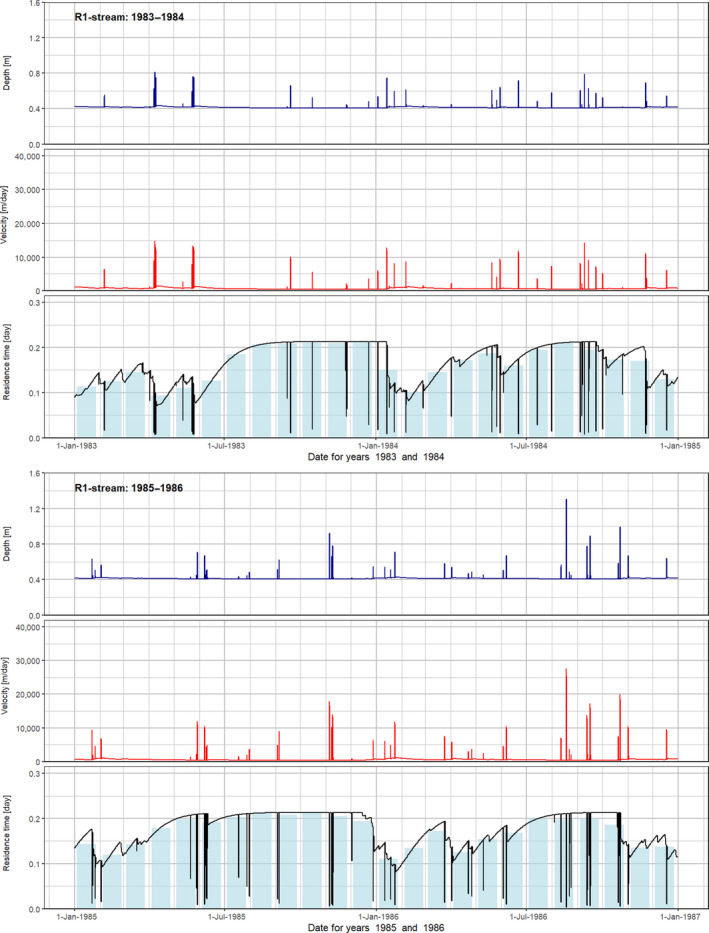
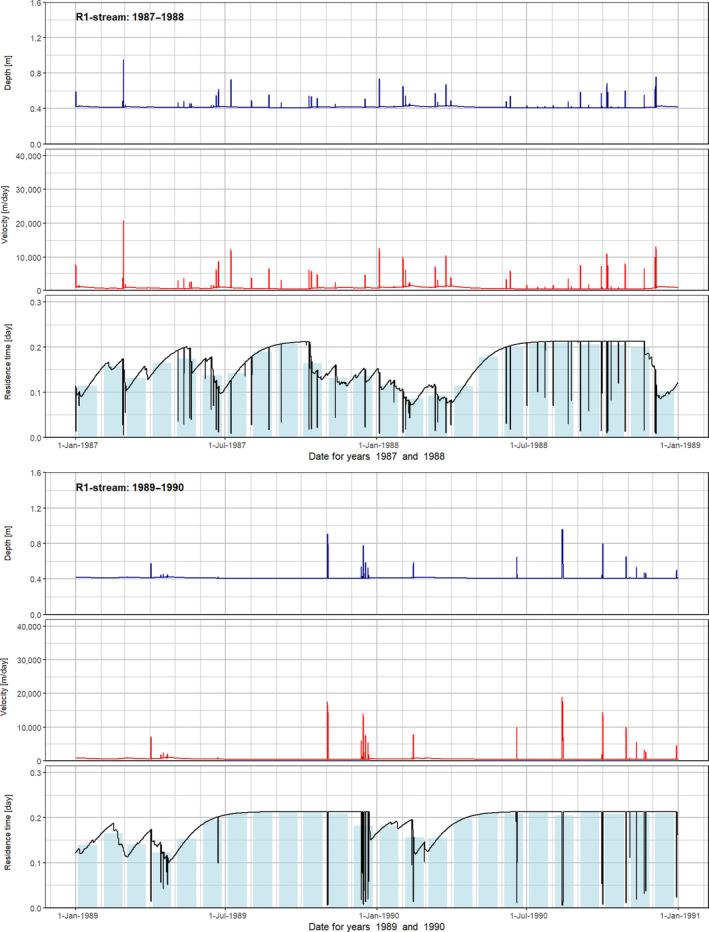
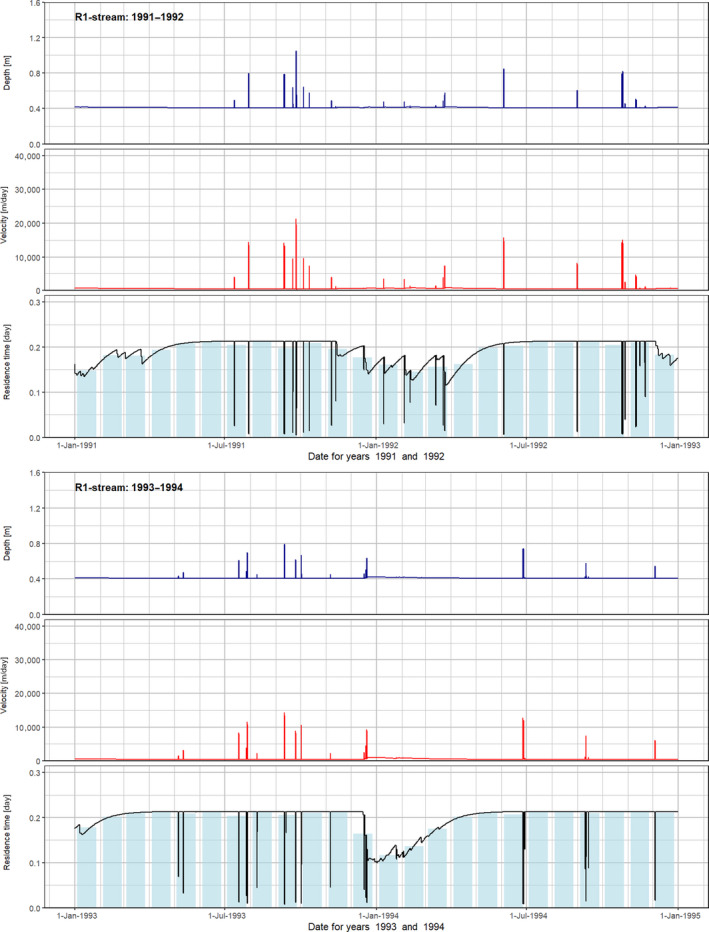
C.2. R2‐Porto stream: precipitation and run‐off fluxes
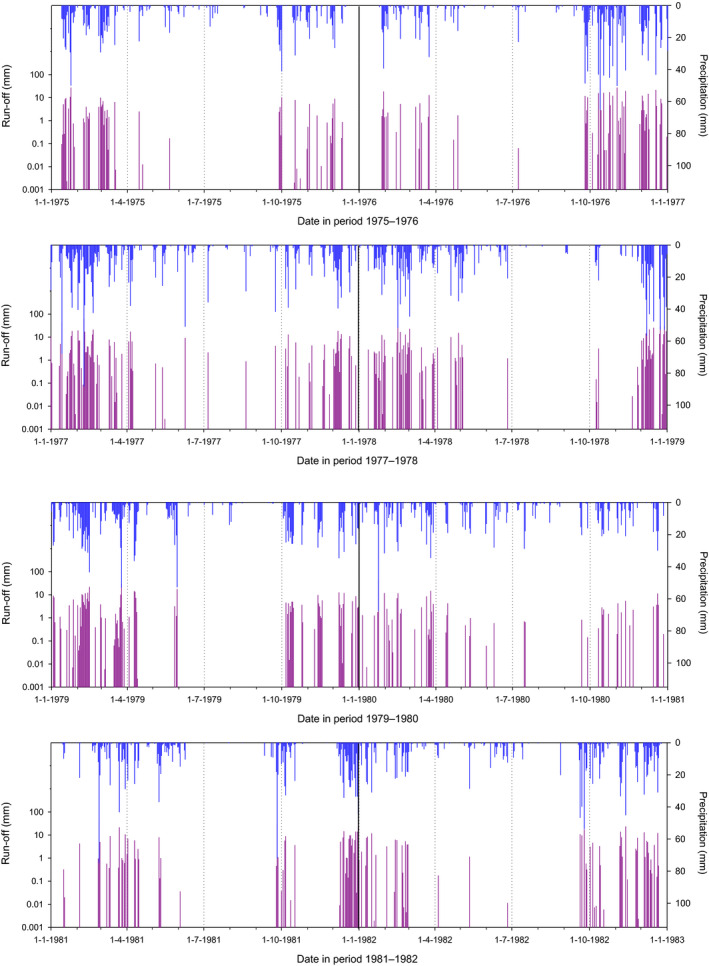
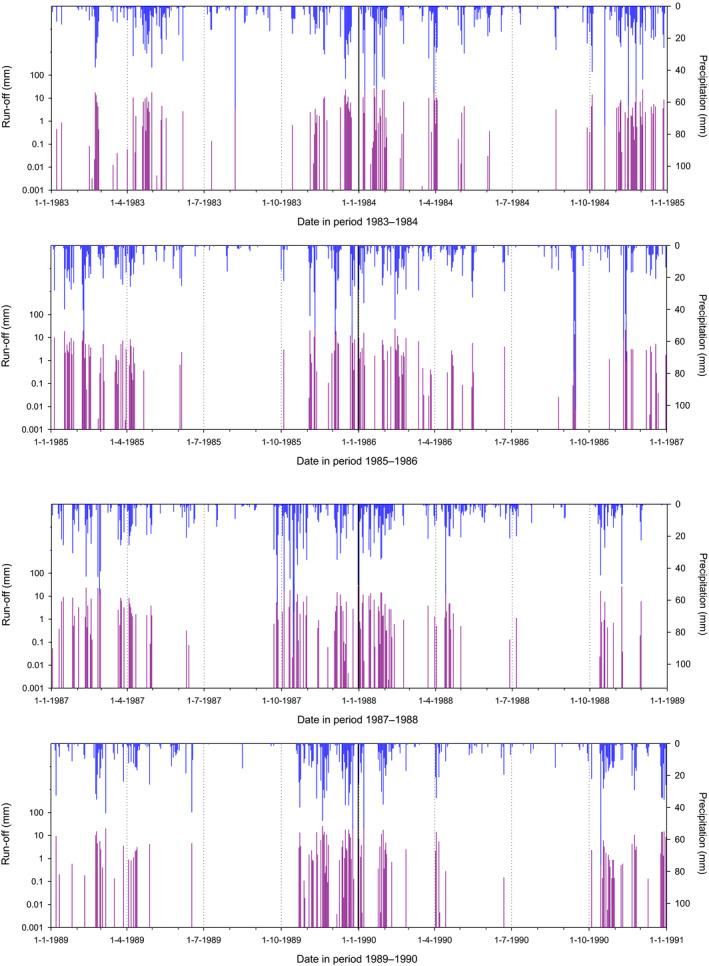
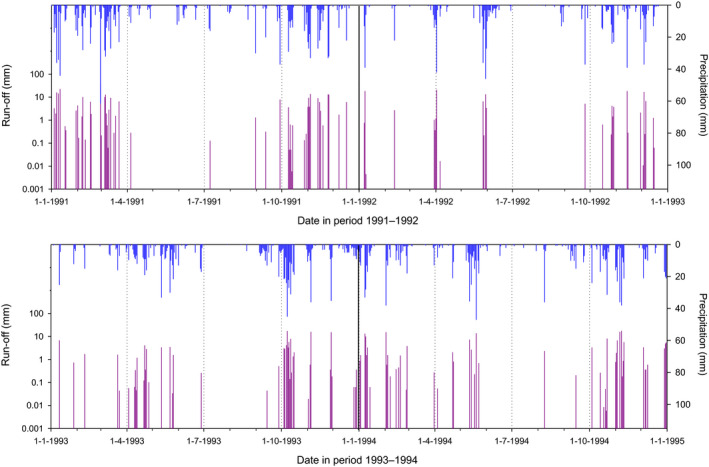
R2‐Porto stream: water depth, flow velocity and hydraulic residence time
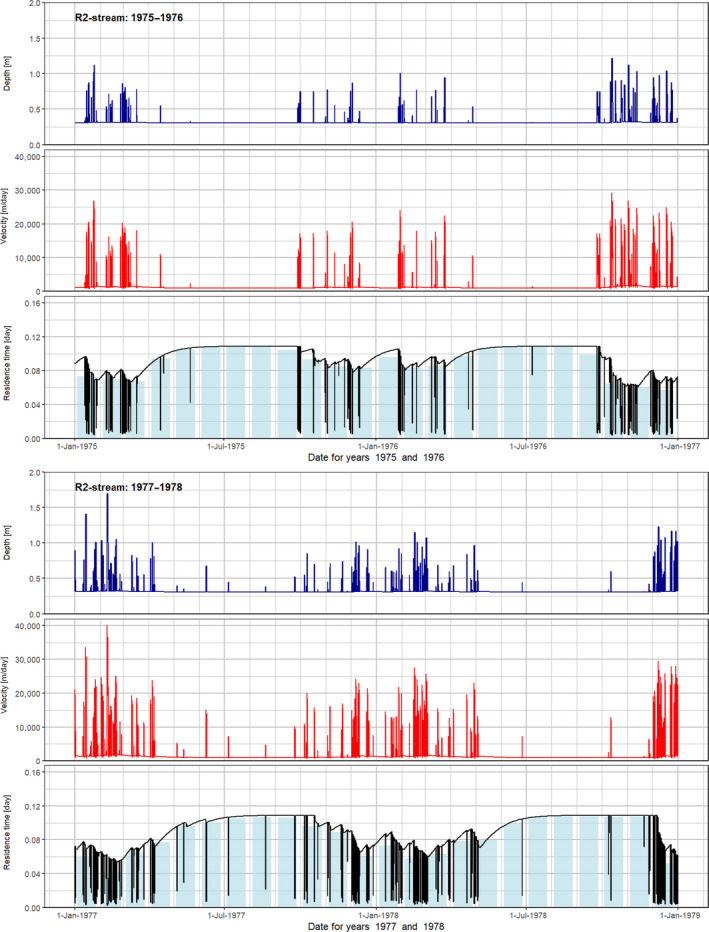
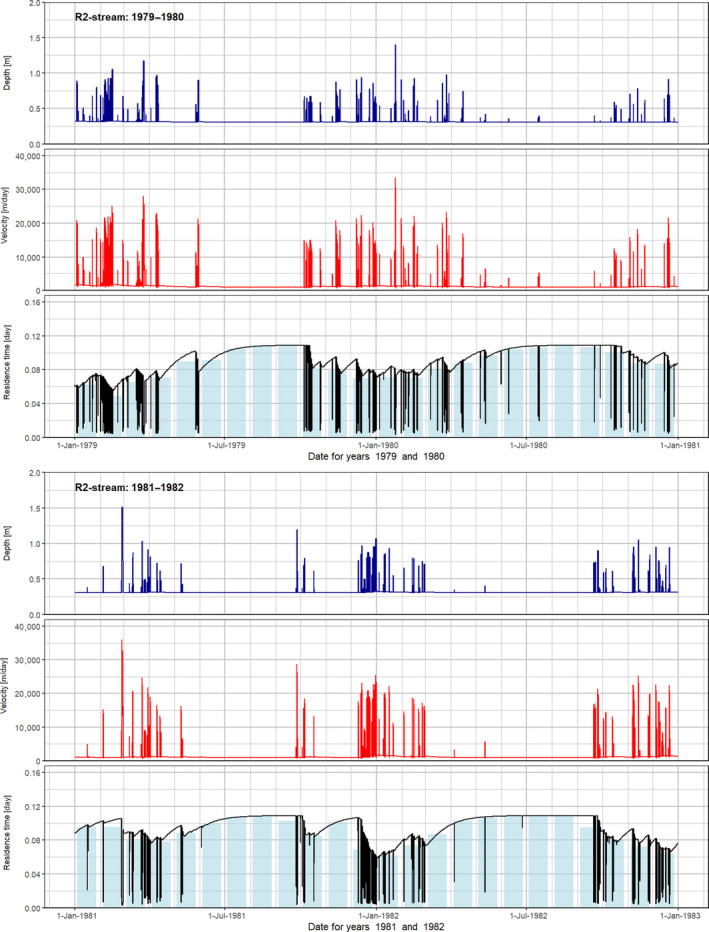
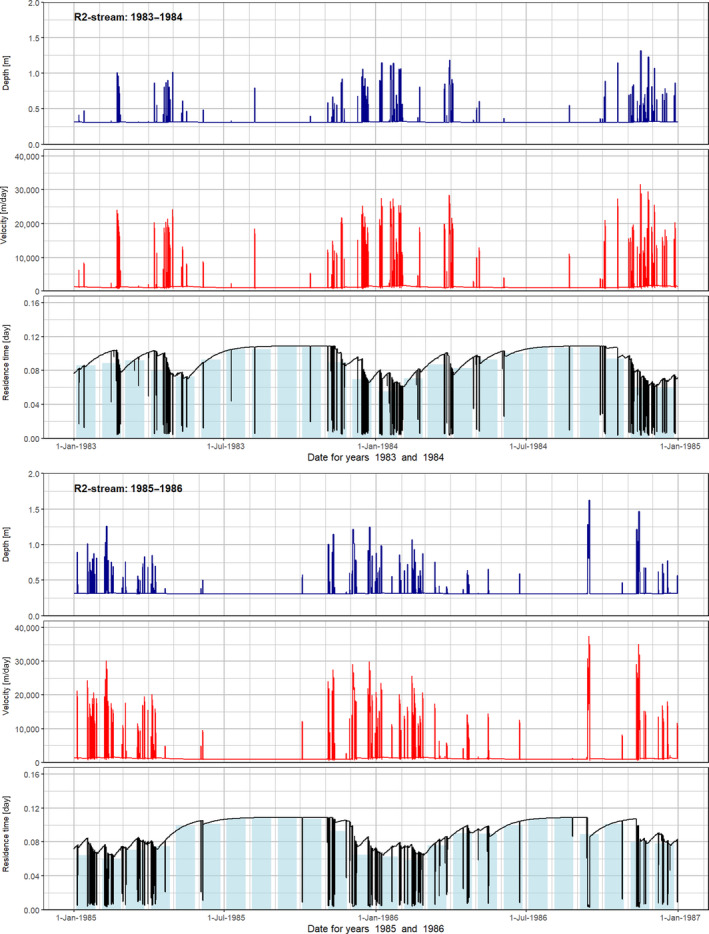
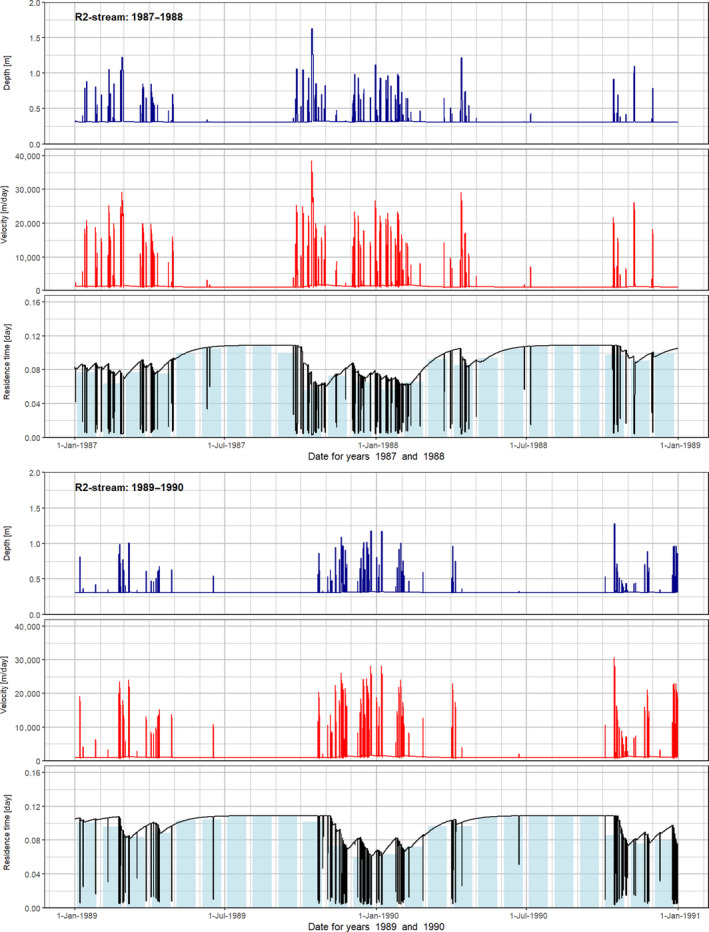
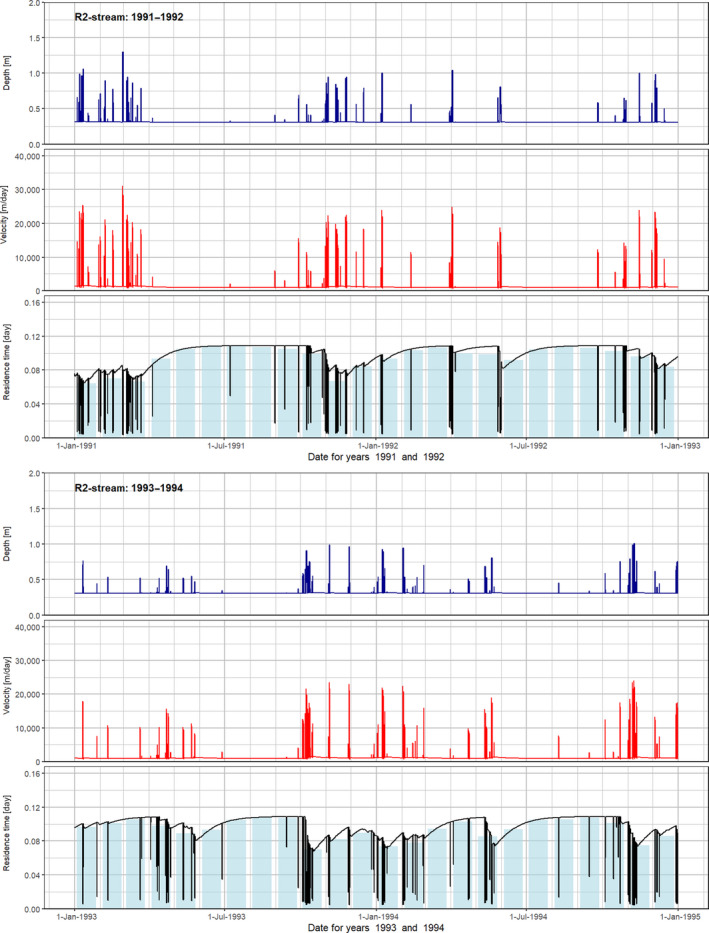
C.3. R3‐Bologna stream: precipitation and run‐off fluxes
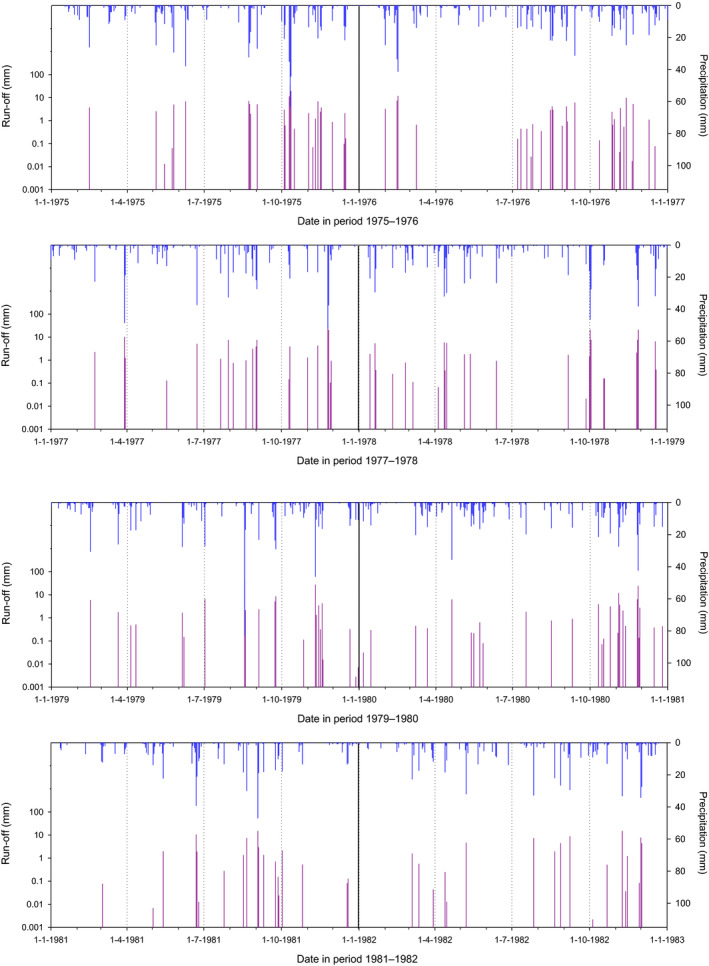
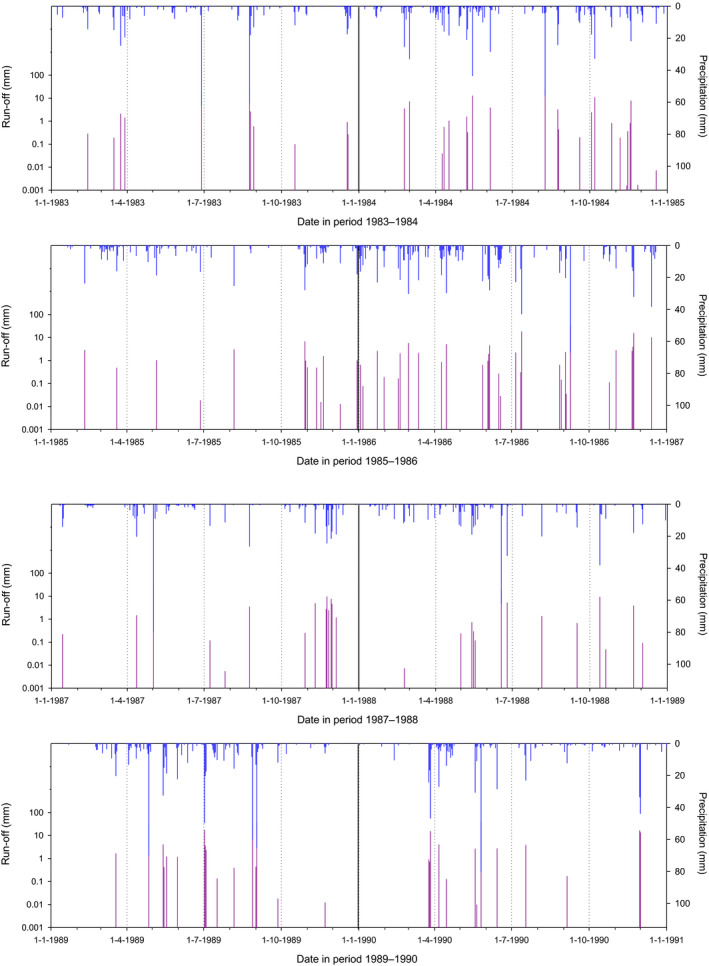
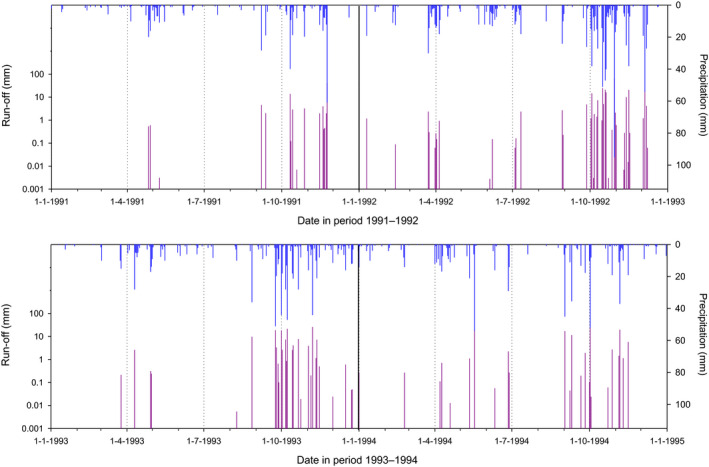
R3‐Bologna stream: water depth, flow velocity and hydraulic residence time
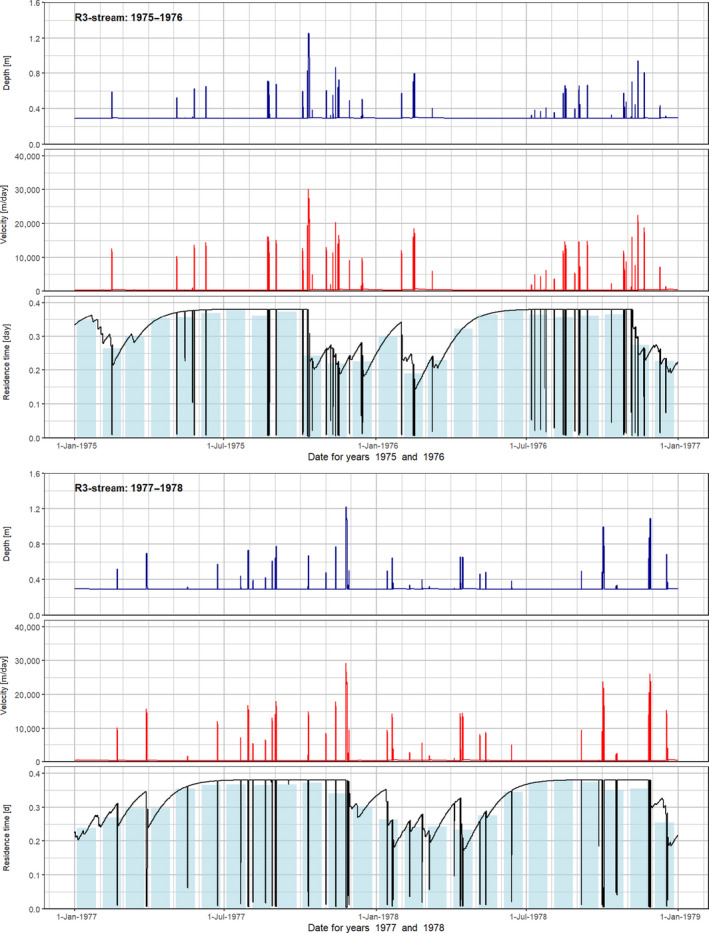
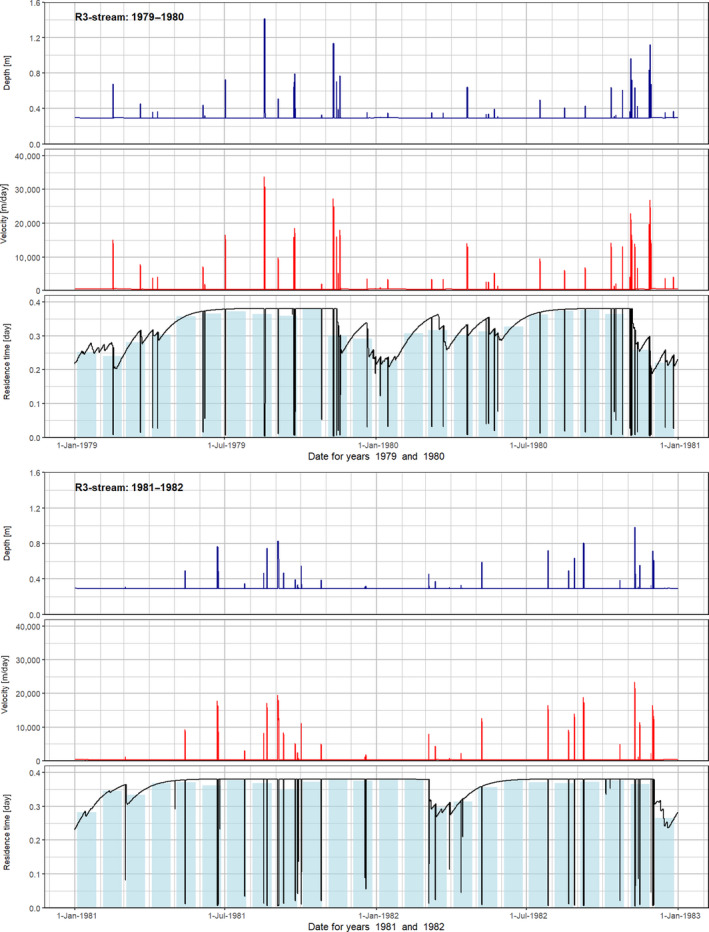
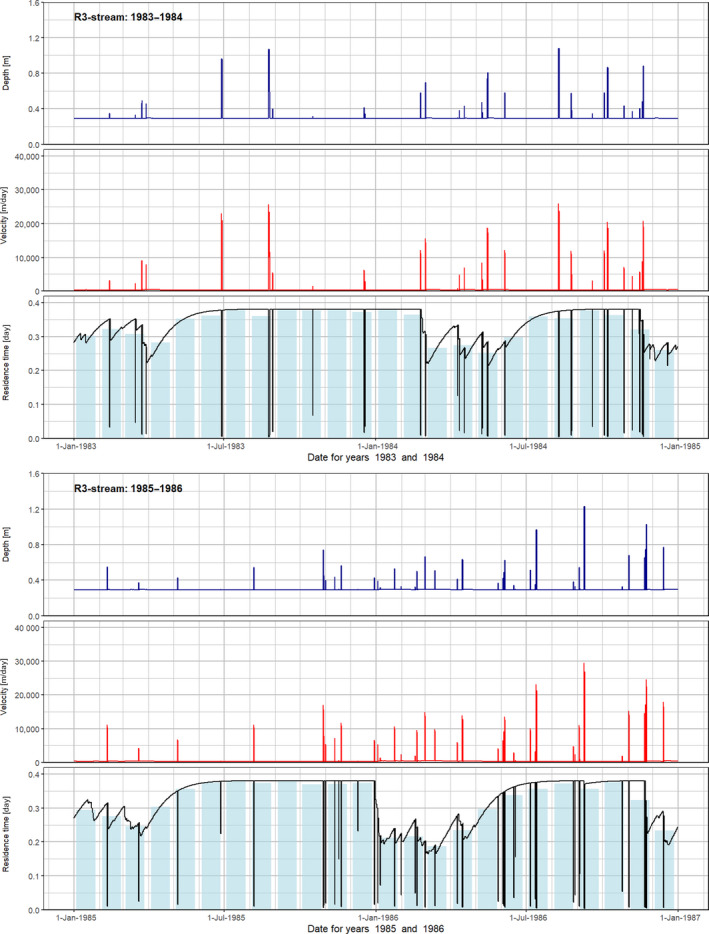
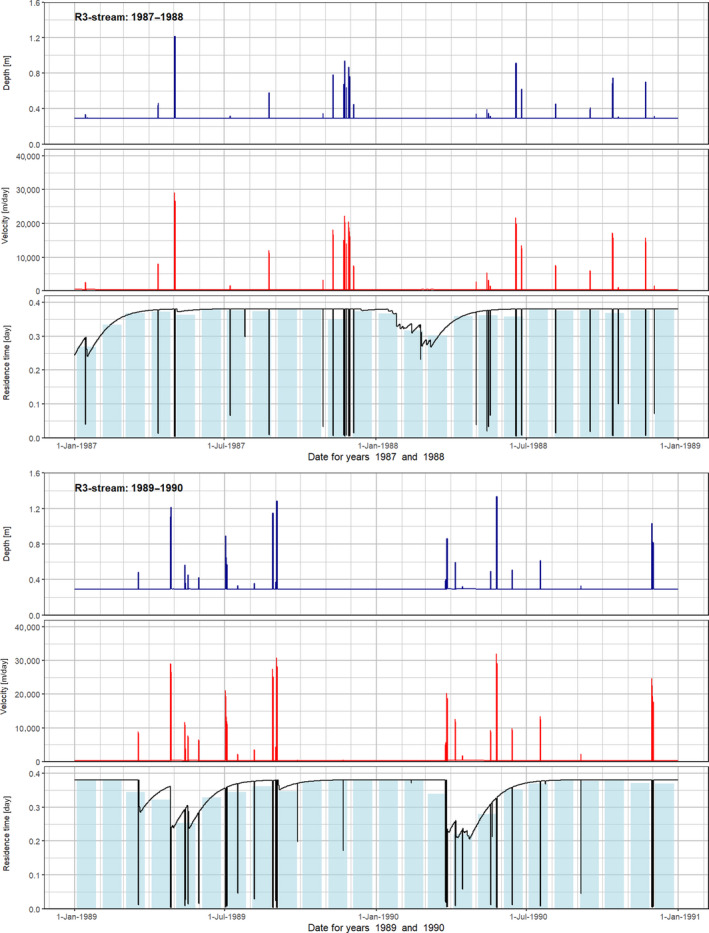
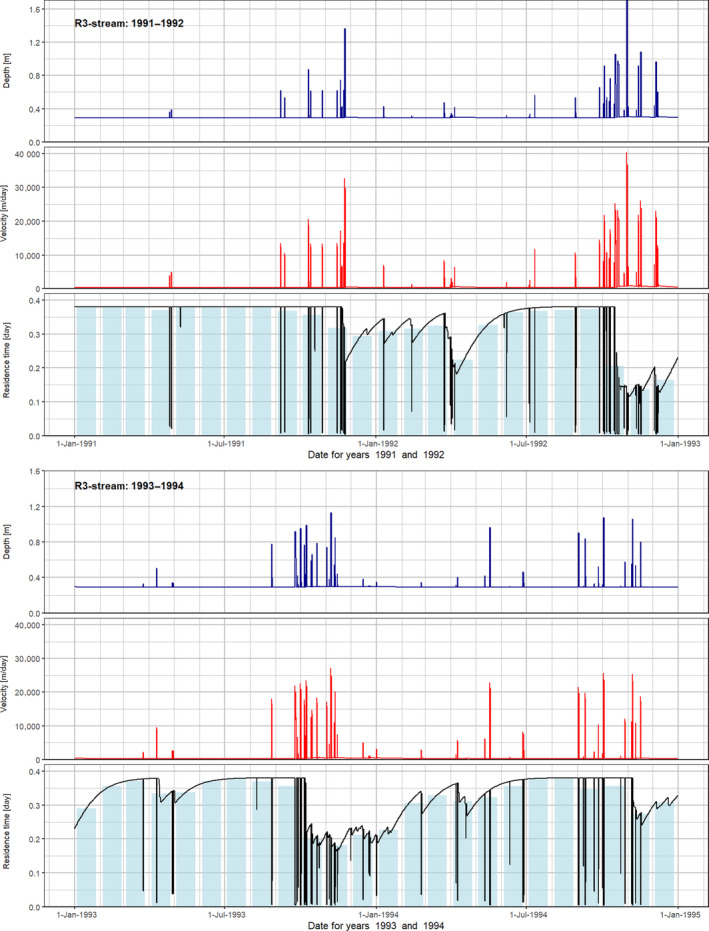
C.4. R4‐Roujan stream: precipitation and run‐off fluxes
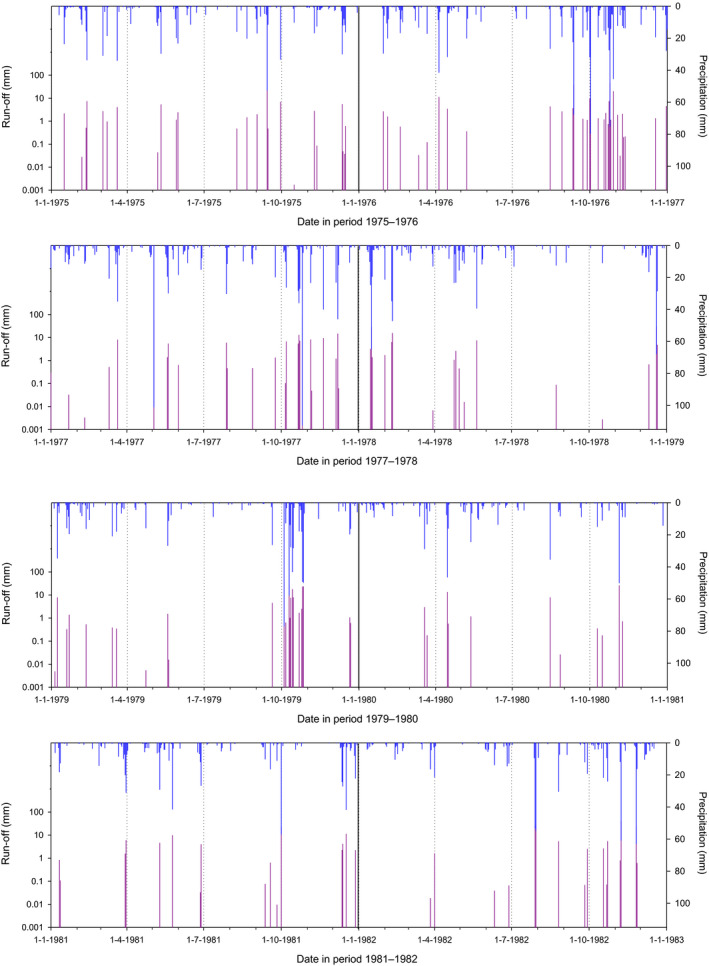
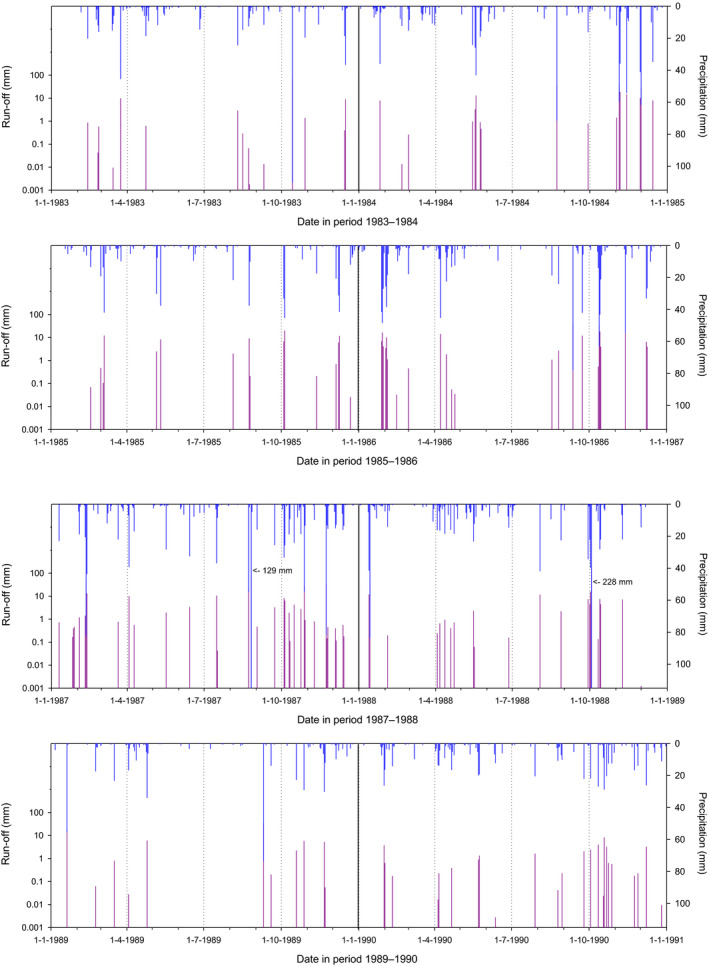
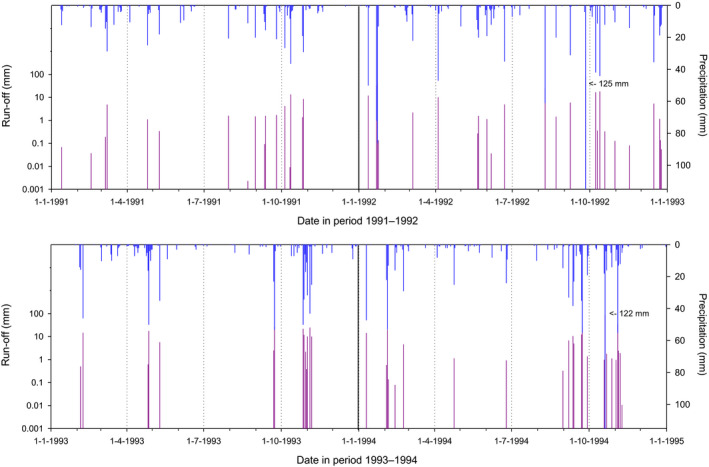
R4‐Roujan stream: water depth, flow velocity and hydraulic residence time
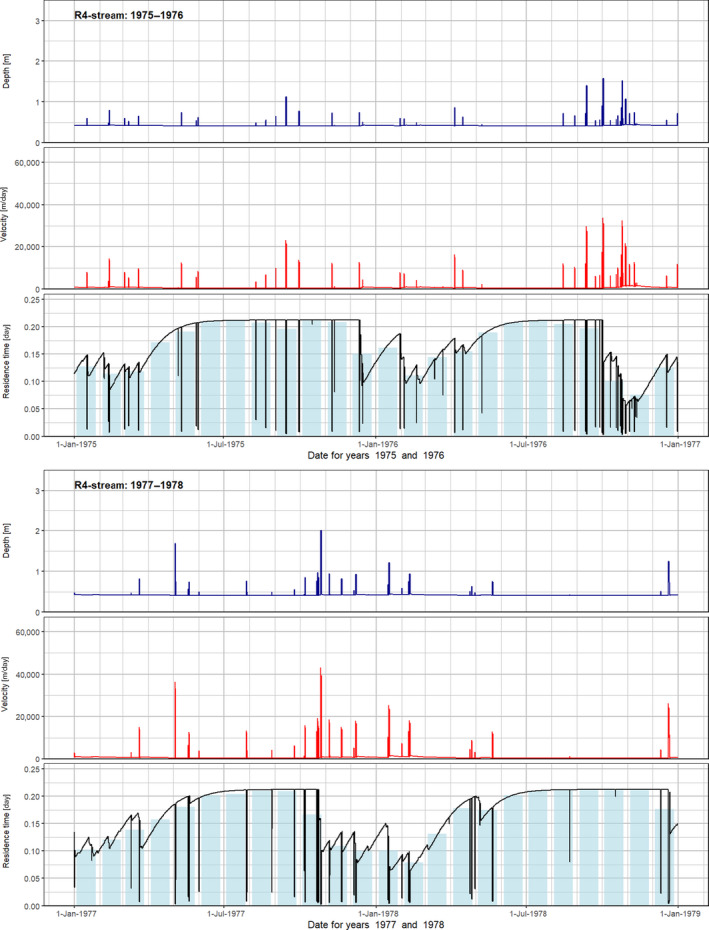
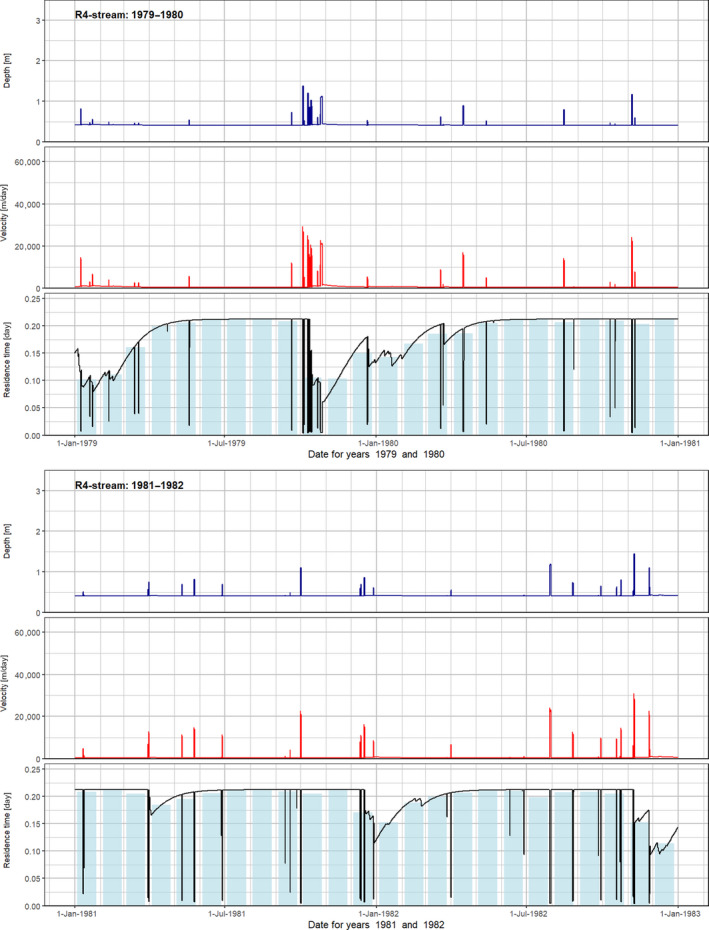
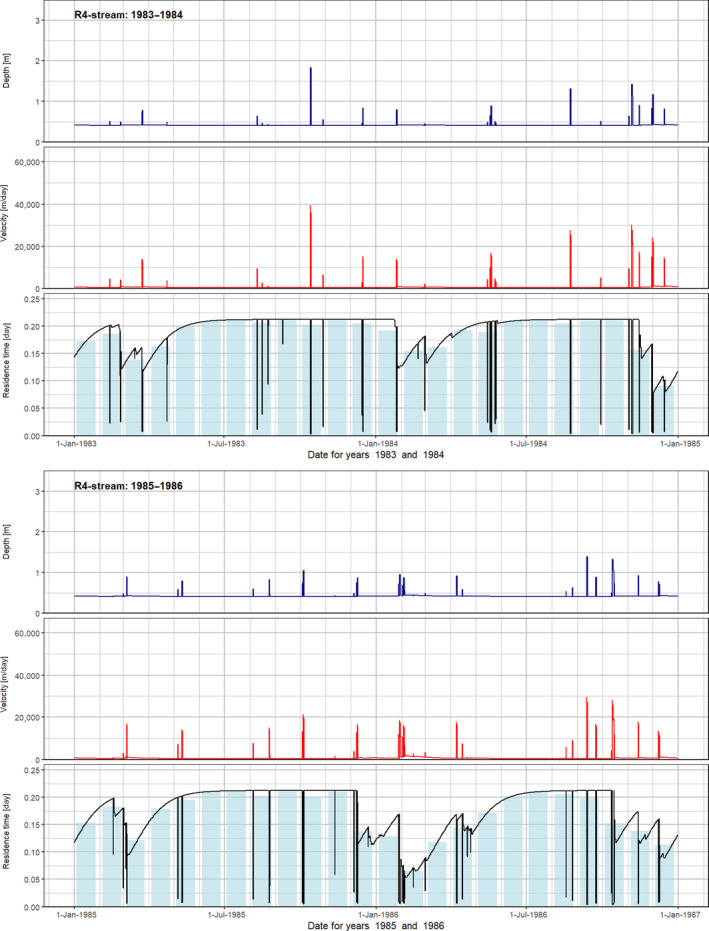
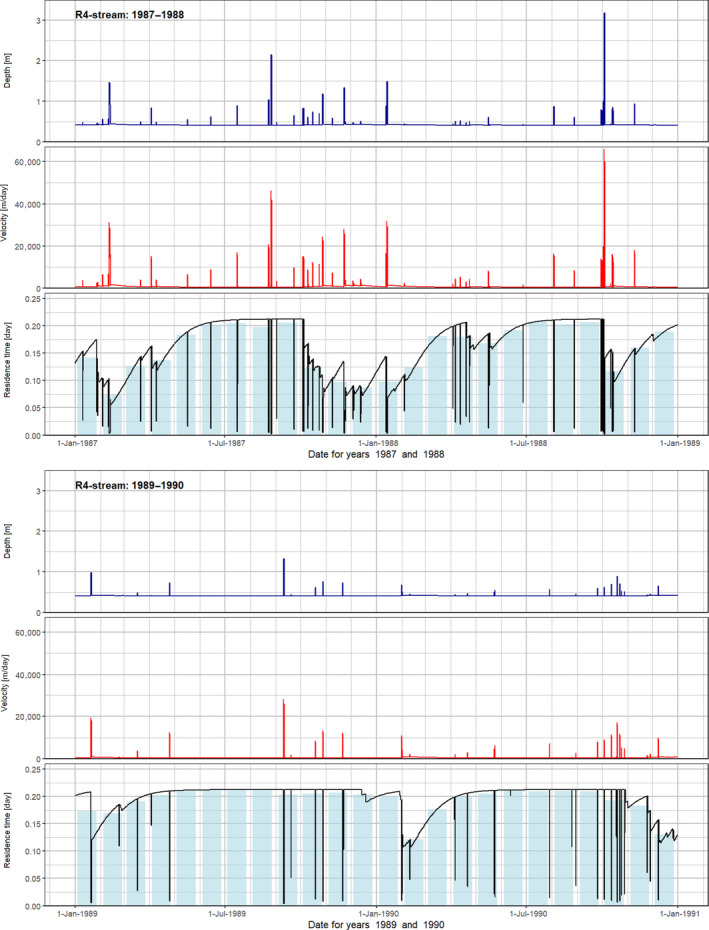
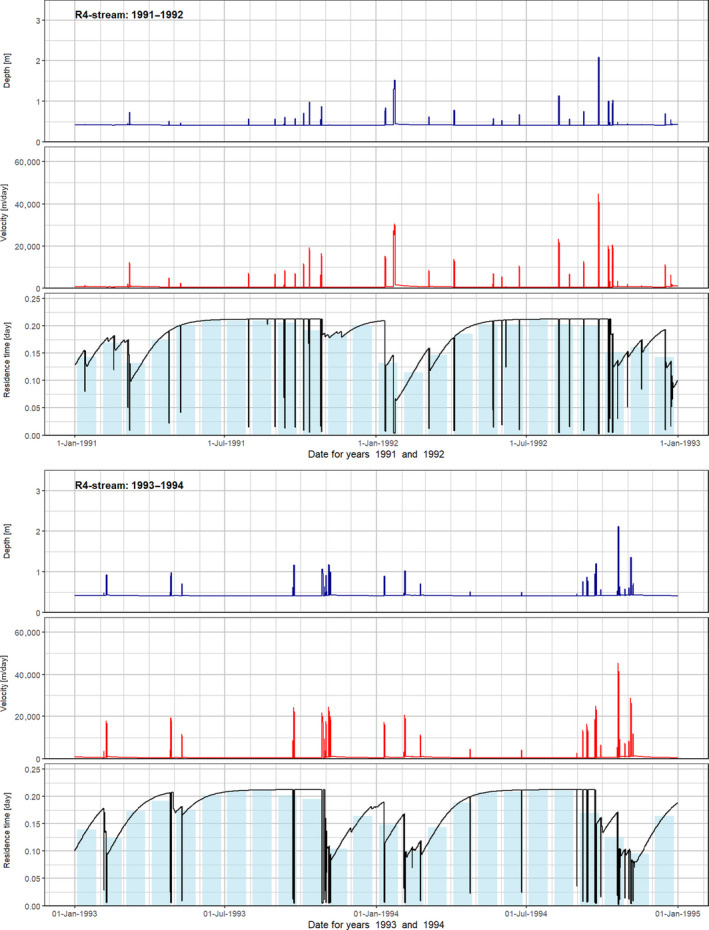
Appendix D– Irrigation
D.1. Introduction
D.1.1. Background: Problem with modelling irrigation in FOCUS sw
In the FOCUS surface water scenarios (FOCUS, 2001) irrigation is simply added to the weather files of PRZM (or MACRO) as rainfall. Irrigation dates have been calculated externally with the model ISAREG (Teixeira and Pereira, 1992). The irrigation volume applied in one irrigation event is always 30 mm.
Reichenberger (2015) found that in all three FOCUS Run‐off scenarios with irrigated crops (R1, R3 and R4), every irrigation event in the 20‐year simulation period causes surface run‐off in PRZM, which is neither realistic nor agronomically efficient.
The developers of the irrigation scenarios in FOCUS sw were aware that excessive surface run‐off should not occur (FOCUS, 2001, p. 74):
‘…the ISAREG model has been developed and validated for southern European conditions. It was therefore considered to be particularly appropriate for the run‐off scenarios where careful irrigation scheduling is important to avoid excessive run‐off. Another factor considered was that ISAREG has been developed by one of the Group members who was thus able to ensure its correct application to each scenario.’
It is not clear, however, whether they were aware of the fact that 30 mm irrigation applied as rainfall will always cause surface run‐off in PRZM due to the curve number approach and its parameterisation in FOCUS sw.
D.1.2. Overview of different irrigation methodologies
To set up a new irrigation approach for the FOCUS sw scenarios, in a first step the various approaches that are already used in regulatory scenarios or are built into regulatory pesticide fate models were analysed and compared:
the approach currently used in FOCUS surface water (FOCUS, 2001);
the approach used in the updated FOCUS gw scenarios (European Commission, 2014) and in the soil exposure assessment (EFSA, 2017);
the internal irrigation routines of the PRZM model (Carsel et al., 2003; Suárez, 2005), which have not been used in regulatory scenarios in Europe so far.
A comparison of the three methodologies is given in Table D.1. It has to be noted that PRZM has been updated for the purposes of this working group. Notably irrigation options 5–7 have been modified. The new version of winprzm.exe has not been released yet. If not indicated otherwise, the descriptions given in the following refer to the new PRZM version. More details on the implementation of the internal irrigation routines in PRZM can be found in Section D.2.
After closely examining the methodologies compared in Table D.1, the FOCUS Surface Water Repair WG concluded that, to avoid inconsistencies with the water balance, irrigation events should not be scheduled with an external model such as ISAREG, but be calculated in PRZM and MACRO considering the model‐specific water balance. Consequently, it was decided to make use of the internal irrigation routines in PRZM and adapt them where needed. Notably, the options ‘sprinkler irrigation below canopy without run‐off’ and ‘sprinkler irrigation above canopy without run‐off’ should be included in the revised FOCUS surface water scenarios.
The next steps proposed by the FOCUS Surface Water Repair WG are:
Test all PRZM irrigation options (except furrow irrigation) to see whether they work correctly.
Fix discovered bugs in the existing PRZM irrigation options or implement new options.
Determine the sensitivity of the parameters PCDEPL, FLEACH and RATEAP.
Check the allowed range of the PRZM parameter FLEACH which allows for surplus irrigation (test if negative values are possible to simulate incomplete filling up of the profile).
Perform a limited calibration to identify parameter sets (PCDEPL, FLEACH, RATEAP) that yield similar cumulative irrigation amounts as in FOCUS (2001) for all three irrigated FOCUS R scenarios (R1, R3 and R4).
Define rules for irrigation in FOCUS surface water for both MACRO and PRZM.
Adapt the PRZM (Mark Cheplick) and MACRO codes (Mats Larsbo) to the rules formulated above (the implementation may differ between MACRO and PRZM due to the different model structures).
Perform iterative testing and debugging of the new ‘FOCUS surface water repair’ irrigation routines in MACRO and PRZM.
Define irrigation periods (emergence until start of senescence) for each combination of irrigated crop and scenario (start of senescence must be defined and fed to the model).
D.2. Internal irrigation options in PRZM
While applying irrigation as rainfall is probably the technically easiest option, the model PRZM also offers in‐built functionalities for applying irrigation, which are presented and discussed in the following paragraphs.
The documentation of the irrigation routines in the PRZM manual (Carsel et al., 2003; Suárez, 2005) is not complete and partly misleading. Moreover, there are large discrepancies between both versions of the manual and the code that need to be clarified to understand how all PRZM irrigation options work.
The source code of the irrigation routines in PRZM (subroutine IRRIG) was provided by Mark Cheplick on 13 March 2018 and is included in Section D.2.6 of this Appendix. Source code modified in the meantime is highlighted as such.
D.2.1. Triggering irrigation events in PRZM
Unlike in MACRO, at this time, it is not possible for the user to schedule irrigation events, i.e. to specify irrigation dates, in PRZM. Irrigation is always scheduled internally. According to the PRZM manual (Carsel et al., 2003):
‘irrigation is triggered when the average root zone soil moisture volume falls below a level fc (parameter PCDEPL; according to comments in source code, the range 0–0.9 is allowed; however, PRZM accepts also PCDEPL = 1) defined by the user as a fraction of the plant‐available water capacity. The moisture deficit D is then given by (Carsel et al., 2003; eq. 6–89).’
| (D1) |
with
D soil moisture deficit (cm)
average root zone soil moisture content at field capacity (cm3 cm−3)
average root zone soil moisture content (cm3 cm−3)
Zr root zone depth (cm).
D is the water depth (volume over field area) that must be added to the soil by irrigation to bring the soil water content of the root zone up to field capacity.
There are several issues with Equation (D1) that need clarification:
The fraction fc does not occur in the equation; D is an absolute deficit, not a relative one.
It is not clear whether and are obtained as a depth‐weighted (i.e. weighted with the layer thickness) mean over the different numerical layers or as an unweighted mean. It should be the former.
It is not clear whether Zr refers to the actual root depth or the maximum root depth of the crop.
The PRZM code makes things clearer:

The code above suggests that the irrigation threshold SMCRIT is calculated as the absolute water volume in the root zone at which the plant‐available water volume in the root zone equals the product of the potential plant‐available water volume and the parameter PCDEPL:
| (D2) |
with
SMCRIT irrigation threshold (cm)
FCi field capacity water content of layer i (cm3 cm−3) (Fortran variable THEFC)
WPi Wilting Point water content of layer i (cm3 cm−3) (Fortran variable WP)
DPi thickness of layer i (cm) (Fortran variable DELX)
m number of layers comprising the root zone (Fortran variable NRZCOMP)
PCDEPL fraction of plant‐available water capacity where irrigation is triggered.
Consequently, for the extreme cases PCDEPL = 0 and PCDEPL = 1, SMCRIT is equivalent to the absolute water volume when each layer in the root zone is at wilting point or field capacity, respectively.
In chapter 5 of the PRZM manual (Carsel et al., 2003), the following description of PCDEPL is given:
‘PCDEPL – Fraction of available water capacity where irrigation is triggered. The moisture level where irrigation is required is defined by the user as a fraction of the available water capacity. This fraction will depend upon the soil‐moisture holding characteristics, the type of crop planted, and regional agricultural practices. In general, PCDEPL should range between 0.0 and 0.6, where a value of 0.0 indicates that irrigation begins when soil moisture drops to wilting point, and 0.6 indicates the more conservative practice of irrigating at 60 percent of the available water capacity. Schwab et al. (1966) recommend values between 0.45 and 0.55.’
Irrigation is triggered if the total absolute soil water volume in the root zone is equal to or smaller than SMCRIT and if it does not rain:

with
Thetn current water content of layer i (cm3 cm−3)
PRECIP daily precipitation (cm).
The irrigation demand is computed as:
| (D3) |
with
SMDEF ‘irrigation demand’ resulting from the soil moisture deficit and FLEACH (cm)
θi current water content of layer i (cm3 cm−3)
FLEACH user‐defined parameter to allow for the practice in saline soils to add water in surplus to leach salts out of the root zone; however, also negative values of FLEACH are allowed.
In chapter 5 of the PRZM manual (Carsel et al., 2003), the following description of FLEACH is given:
‘FLEACH – The leaching factor as a fraction of irrigation water depth. This factor is used to specify the amount of water added by irrigation to leach salts from saline soil and is defined as a fraction of the amount of water required to meet the soil water deficit. For instance, a value of 0.25 indicates that 25 percent extra water is added to meet the soil water deficit.’
Equation (D3) is similar to Equation (D1), except that SMDEF already includes the parameter FLEACH. However, SMDEF is not used for triggering irrigation, only for determining the irrigation volume (cf below). It also becomes clear that FLEACH is actually not a factor, but a summand. For FLEACH = −1, the irrigation demand drops to zero, while for FLEACH = 1, it doubles.
The variable DW (drain water) belongs to a drainage routine that is usually not used. Hence, it is not relevant here.
Note that until recently (incl. winprzm v.4.63 included in the latest official FOCUSsw_PRZM release) NRZCOMP denoted the number of layers comprising the maximum root depth of the crop. However, the code has recently been changed so that now NRZCOMP denotes the number of layers comprising the current root depth.
Irrigation is triggered if the total absolute soil water volume in the root zone is equal to or smaller than SMCRIT and if it does not rain:

It has to be noted that, in PRZM, evapotranspiration is reduced when the plant‐available water content in the current root zone drops below 60% of the potential plant‐available water content (cf eq. 6.37 in Suárez (2005). The corresponding code is the following:
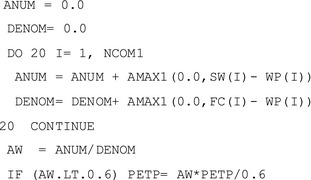
with
NCOM1 current number of compartments of which ET is extracted
SW(I) current water content of layer I (cm)
FC(I) field capacity water content of layer I (cm)
WP(I) wilting point water content of layer I (cm)
PETP running total of available evapotranspiration (cm).
In PRZM, the irrigation trigger is not linked to the threshold of evapotranspiration reduction, in contrast to the ISAREG setup that was used in FOCUS (2001).
D.2.2. Irrigation options in PRZM
The following seven irrigation options are available in the latest published PRZM version winprzm v. 4.63 (parameter IRTYP in PRZM.inp file):
1 = flood irrigation on a dyked field
2 = furrow irrigation
3 = sprinkler irrigation over the crop canopy, with surface run‐off
4 = sprinkler irrigation under the crop canopy, with surface run‐off
5 = sprinkler irrigation over the crop canopy without surface run‐off
6 = sprinkler irrigation over canopy, user‐defined rates, with surface run‐off
7 = sprinkler irrigation over canopy, user‐defined rates, without surface run‐off.
D.2.2.1. Option 1: Flood irrigation
Flood irrigation (Carsel et al., 2003; section 6.3.7.3) refers to the practice of flooding entire fields with irrigation water. Flood‐irrigated fields are dyked around the edges to allow water to form ponds and infiltrate into the soil. Consequently, there is no surface run‐off from the field. In the PRZM irrigation algorithm, it is assumed that this water forms ponds uniformly over the entire field. The amount of water applied to the soil surface is then (Carsel et al., 2003, equation 6–92):
| (D4) |
with
Da depth of water applied to the field (cm)
D actual soil moisture deficit (cm)
LF user‐defined ‘factor’ (parameter FLEACH) to allow for the practice in saline soils to add water in surplus to leach salts out of the root zone
SMDEF soil moisture deficit after factoring in FLEACH; irrigation demand (cm).
The irrigation amount is equal to SMDEF; irrigation is added as infiltration to the first num. layer:

with
APDEP depth of irrigation water applied to soil (cm)
AINF(1) infiltration into uppermost numerical layer (cm) within one time step (day).
The irrigation volume will usually be larger than the available air‐filled pore space of the uppermost layer (field capacity water content – current water content). As with rainfall, in PRZM, any excess irrigation water is simply passed on to the subsequent layers within the same time step (1 day).
Stephan Sittig observed in his sensitivity analysis that irrigation was never triggered for option 1 (cf Section 3.3.3). This suggests that there is a bug in the flood irrigation option, and that it should not be used for now.
D.2.2.2. Option 2: Furrow irrigation
Furrow irrigation is essentially a 2D problem and therefore quite complex. PRZM uses a kinematic‐wave equation for the horizontal flow in furrows coupled with a Green–Ampt infiltration model (Carsel et al., 2003; section 6.4.4). However, these furrow irrigation equations are only used in PRZM to calculate an infiltration rate that is then applied to the surface layer of the soil profile in PRZM.
There is no statement in the PRZM manual about surface run‐off for furrow irrigation. However, the last line of code (infiltration = depth of applied irrigation water) suggests that there is no surface run‐off.
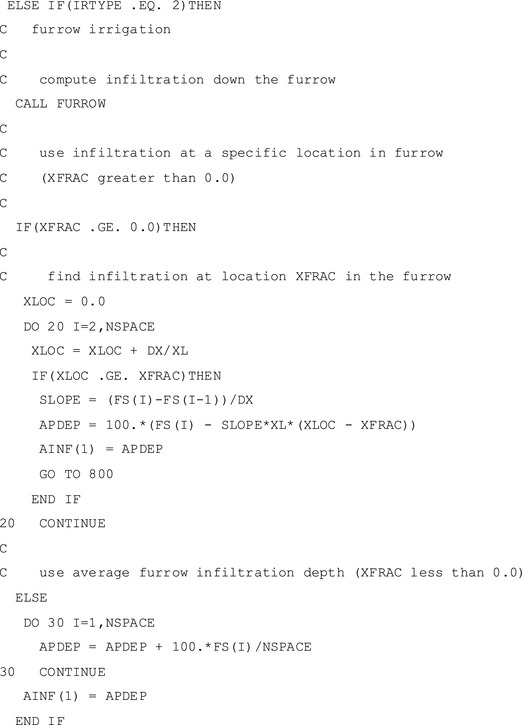
with
XFRAC Location in furrow where infiltration is to be used in PRZM transport calculations (as fraction of total furrow length)
XLOC x coordinate in furrow (as fraction of total furrow length).
D.2.2.3. Options 3–7: Sprinkling irrigation
Options 3–7 all refer to sprinkler irrigation (Carsel et al., 2003; section 6.3.7.2). Although this does not become clear in the PRZM manual, all options 3–7 use the parameter RATEAP (maximum rate at which irrigation is applied; cm h−1) which can be interpreted as the physical capacity of the sprinkling system, i.e. the maximum irrigation rate it can deliver.
Option 4: under canopy, with run‐off
For under‐canopy irrigation, the irrigation water is applied as throughfall according to Equation (D5). Surface run‐off is subsequently calculated with the curve number approach (Carsel et al., 2003; chapter 6).
| (D5) |
with
Da depth of water applied to the field (cm)
LF user‐defined factor (parameter FLEACH) to allow for the practice in saline soils to add water in surplus to leach salts out of the root zone
RATEAP maximum irrigation rate of the sprinkling system (cm h−1).
The corresponding code is:

with
IRRR irrigation depth (cm); IRRR is an output variable for the.zts file and not used for calculations
THRUFL actual irrigation depth applied (cm)
The variable THRUFL is not subject to surface run‐off. However, later in the code the variable PRECIP, which is subject to surface run‐off, is set back to the value of THRUFL:

Over‐canopy sprinkling irrigation is applied as precipitation to the canopy.
For over‐canopy sprinkling irrigation, there is a distinction between options with (3, 6) and without surface run‐off (5, 7) activated. While for options 3 and 5, the parameter RATEAP denotes a maximum irrigation rate Rmax (parameter RATEAP, cm h−1) to reflect hydraulic limitations of the irrigation system, in options 6 and 7 the irrigation rate is fixed to RATEAP.
For options 3 and 5, the applied irrigation depth is given as:
| (D6) |
where
DIN current plant canopy interception potential (cm); DIN = CINTCP × degree of ground cover, with CINTCP being the maximum interception capacity of the crop
CINT current crop interception storage (cm).
Option 3: over canopy, with run‐off


PRECIP actual irrigation depth applied (cm)
Option 5: over canopy, without run‐off

The difference between the variables PRECIP and THRUFL is that PRECIP is subject to surface run‐off, while THRUFL is not.
For options 6 and 7, the applied irrigation depth is independent of irrigation demand, but fixed by RATEAP:
| (D7) |
Option 6: over canopy, with maximum irrigation rate, with run‐off

Option 7: over canopy, with maximum irrigation rate, without run‐off

Option 7 does not consider canopy interception, so it should rather be called ‘under canopy’.
D.2.3. New irrigation options Q5–Q7 (sprinkling without run‐off)
The irrigation options 5–7 were replaced with new ones by Mark Cheplick on 7 May 2018 during the bug‐fixing process.
The new options 5–7 are:
5 = sprinkler irrigation over the crop canopy, without surface run‐off
6 = sprinkler irrigation under the crop canopy, without surface run‐off
7 = sprinkler irrigation under the crop canopy, user‐defined rates, without surface run‐off.
Moreover, there was a bug fixed in the irrigation output variable printed to the.zts file (Mark Cheplick, personal communication, 15 August 2018). This bug can explain the erratic results observed for the old irrigation options 3–7 (cf Section D.3.3.1).
Option 5 (new): sprinkling over canopy, without run‐off

This option is actually identical to the old option 5. However, it was ensured in another part of the code that surface run‐off does indeed not occur (cf Section 3.1.4). Furthermore, code was added in August 2018 to ensure that option 5 is subject to foliar interception of irrigation water and foliar wash‐off of residues, despite the use of the variable THRUFL.
Option 6 (new): sprinkling under canopy, without run‐off

This option is identical to option 4, except that PRECIP is not set back to THRUFL later (cf Section 3.1.4). No surface run‐off is triggered.
Option 7 (new): sprinkling under canopy, user‐defined rates, without run‐off

This option is actually identical to the old option 7. However, it was ensured in another part of the code that surface run‐off does indeed not occur (cf Section 3.1.4). Moreover, option 7 was renamed to ‘under canopy’ to correctly reflect the fact that canopy interception is not included.
D.2.4. Handling of throughfall and precipitation in the PRZM code
The handling of the variables throughfall (THRUFL) and precipitation (PRECIP) is different between irrigation options 1–4 and options 5–7:

The line ‘if(irtype.le.4) then’ was introduced by Mark Cheplick on 7 May 2018 to eliminate surface run‐off for the new irrigation options 5–7, where it should not occur.
Comment Mark Cheplick, 16 July 2018:
‘The code determines that an irrigation event has occurred and that the IRTYPE is 4 or less. What happens for these irrigation types is that PRECIP = irrigation applied. Since it is PRECIP it is subject to run‐off. When IRTYPE = 5, 6, 7, we don't want PRECIP = irrigation applied, but THRUFL = irrigation applied, thus preventing run‐off.’
Note that the operation PRECIP = THRUFL is not triggered for irrigation options 1 and 2 (THRUFL = 0) and 3 (PRECIP > 0). Hence, it mainly serves for option 4 (under‐canopy irrigation with run‐off).
The following piece of code calculates throughfall and updates the canopy interception storage CINT for option 3 (over‐canopy irrigation with run‐off) and rainfall events (all options 1–4):

The ELSEIF condition refers to irtype > 4 (i.e. new options 5–7). Here throughfall is calculated and the canopy interception storage CINT is updated for rainfall events (PRECIP > 0).

D.2.5. Identified limitations of the PRZM irrigation functionalities
The main limitations of the irrigation functionalities in PRZM (even after bug fixing) are:
poor documentation of the irrigation routines in the manual;
code is better documented, but not easy to read;
only internal irrigation scheduling: the user cannot enter irrigation dates;
irrigation depths of single irrigation events can only be adjusted with FLEACH and RATEAP; the user cannot enter irrigation volumes.
Comments by Mark Cheplick from 13 March 2018:
‘The general gist is that PRZM determines the soil moisture deficit in the run‐off zone [the top 10 cm]. Code below is pretty well documented. In the 30 years of using PRZM I've never used FLEACH. The idea behind it was for irrigating in the southwestern part of the US where there is excess salt in the soil and irrigation is used to leach the salt out of the root zone.
I have a really good handle on the PRZM irrigation code so adapting the ISAREG code I would think is doable. The big difference may be how ET is accounted for in each model and how different the results may between models. I think that is why Russell precalculated and then we entered the irrigation into the weather files so that we had the same amount between models. Regardless, I think if we talk it through I could program it in.’
D.2.6. PRZM code
D.2.6.1. PRZM code for irrigation
(Latest version; received on 16 July 2018 from Mark Cheplick.)
Comments in the code are marked with ‘C’ or ‘c’.
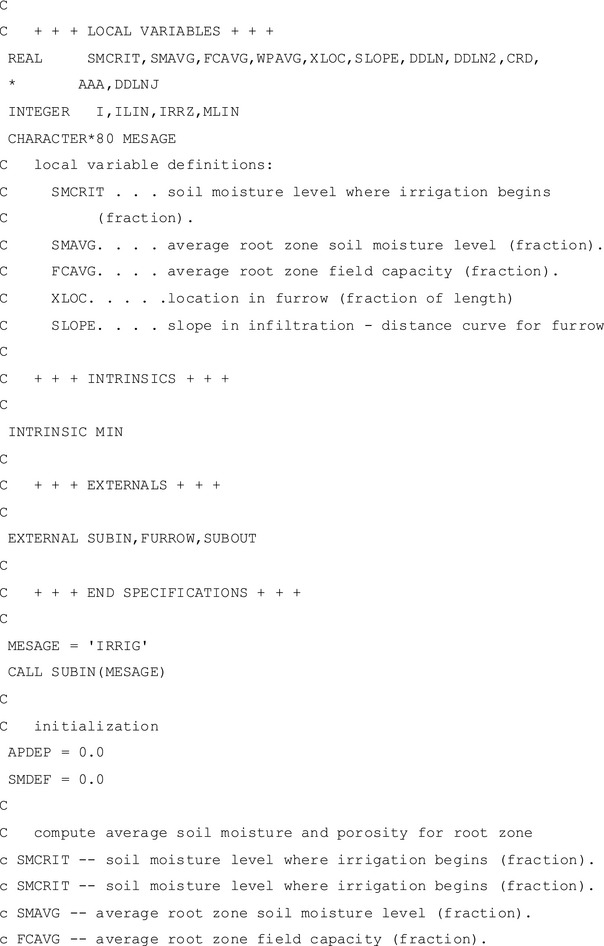
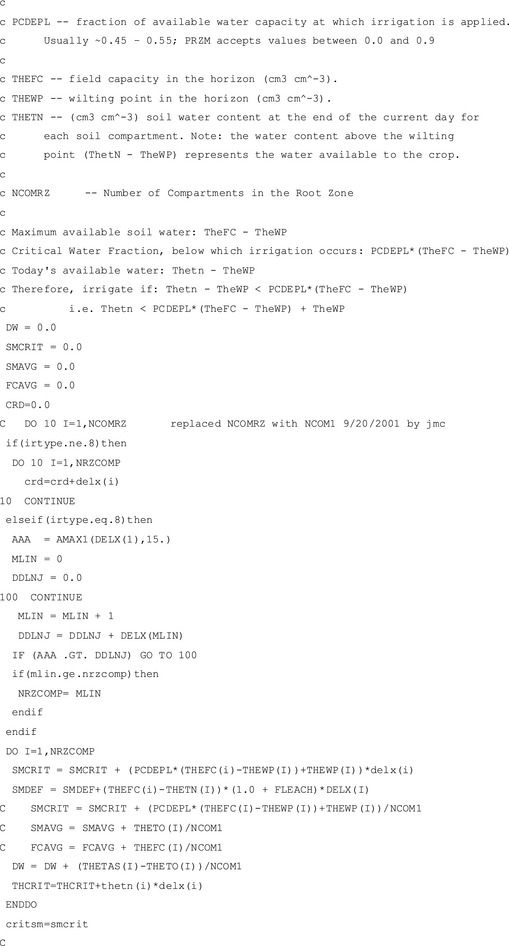
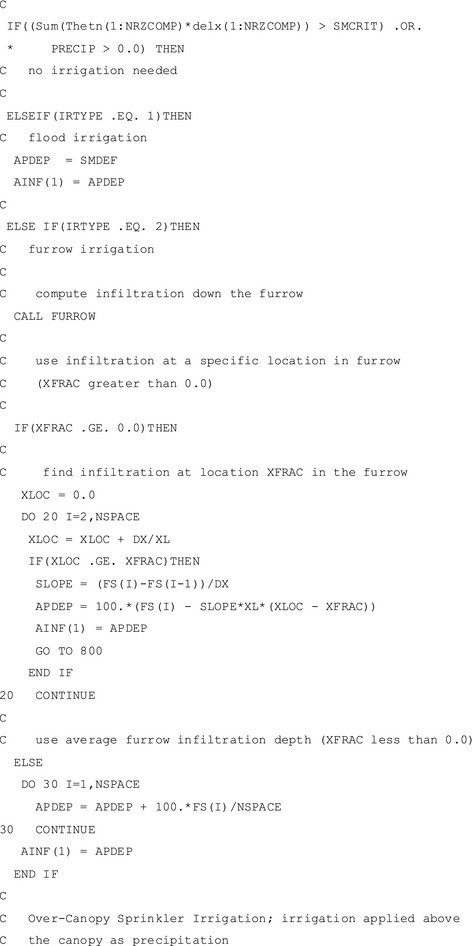
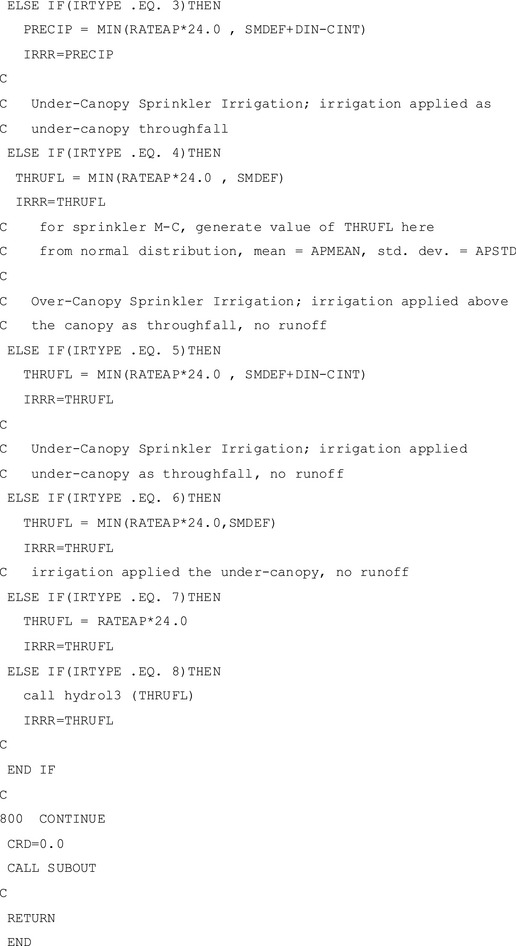
D.2.6.2. PRZM code for calculating the daily curve number and surface run‐off volumes
(Received from Mark Cheplick on 16 July 2018.)

D.3. Sensitivity analysis for irrigation in PRZM
A sensitivity analysis was conducted to evaluate different options for a model internal calculation and to identify potential shortcomings.
D.3.1. Introduction and objectives
The experience with the internal PRZM irrigation options was very limited in the working group. It was therefore necessary to perform a simulation study to check the correct functioning of the various irrigation options and to assess the sensitivity of the irrigation parameters.
The three main aims of this simulation study were to:
Test all PRZM irrigation options (except option 2 = furrow irrigation) in the latest official winprzm version (winprzm.exe v. 4.63) to see whether they work correctly.
Assess the sensitivity of the parameters PCDEPL, FLEACH and RATEAP for the new irrigation options 5–7 in the modified winprzm (winprzm3.exe).
Perform a limited calibration to identify parameter sets (PCDEPL, FLEACH, RATEAP) that yield similar cumulative irrigation amounts as in FOCUS (2001) for all three irrigated FOCUS R scenarios (R1, R3 and R4).
D.3.2. Materials and methods
Repeated PRZM runs were initiated varying the input parameters PCDEPL, FLEACH and RATEAP using the latest official PRZM version (winprzm.exe v.4.63), and a new modified version (provisional name winprzm3.exe) that provides for the three corrected options 5–7.
The investigations were conducted for all scenario/crop combinations for the new option 6 (sprinkling under canopy, without run‐off) and exemplarily for other scenario/crop combinations.
D.3.3. Results and discussion
D.3.3.1. Old irrigation options
Option 1 (flood irrigation)
For irrigation option 1, no irrigation could be observed. This suggests that there is a bug in the flood irrigation option.
Option 3 (over canopy, with run‐off)
A sensitivity test for the parameter RATEAP, FLEACH and PCDEPL yielded erratic behaviour with respect to the response variable total irrigation volumes (not shown).
Option 4 (under canopy, with run‐off)
The results for irrigation options 3 and 4 differ only to a small extent (cf Figure D.1 for cumulative surface run‐off), with the differences in cumulative surface run‐off and irrigation volume being caused by the water interception on the crop canopy in option 3).
The decreasing surface run‐off volume for PCDEPL > 0.9 can be explained by the fact that when PCDEPL approaches 1, irrigation is applied almost every day, but the irrigation demand and (for options 3–5) the irrigation depth for each irrigation event is very small.
Erratic behaviour of cumulative irrigation volumes as a function of PCDEPL (not shown).
Figure D.1.
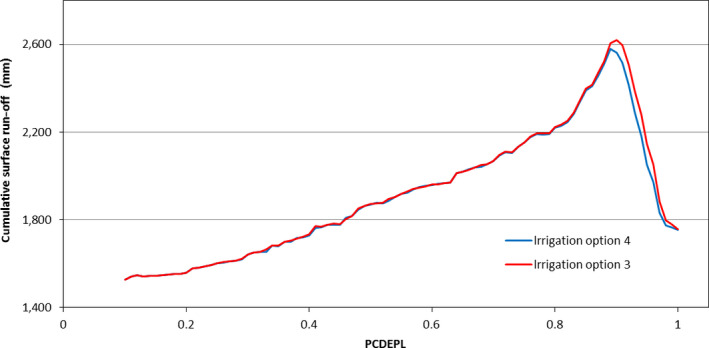
Total surface run‐off volumes in PRZM over 20 years for different values of PCDEPL (R1, potatoes, irrigation options 4 and 3)
- FLEACH = 1; RATEAP = 0.125 cm/h = 30 mm/day.
Option 5
For option 5, it was observed that surface run‐off occurred on irrigation days, while it should not occur according to the manual. → Bug
Cumulative surface run‐off was identical between options 5 and 3 (Figure D.2).
Cumulative irrigation differed between options 5 and 3 only in a few cases (not shown).
Erratic behaviour of cumulative irrigation volumes as a function of PCDEPL (not shown).
Figure D.2.
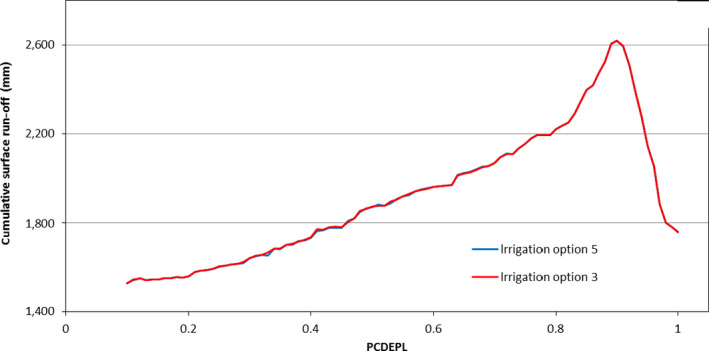
Total surface run‐off volumes in PRZM over 20 years for different values of PCDEPL (R1, potatoes, irrigation options 5 and 3)
- FLEACH = 1; RATEAP = 0.125 cm/h = 30 mm/day.
Options 6 and 7
For both option 6 and 7, the cumulative irrigation volume and cumulative surface run‐off increase steeply when PCDEPL exceeds 0.9 (cf Figure D.3 for cumulative surface run‐off). This can be explained by the fact that for options 6 and 7, the irrigation volume per event is fixed and not dependent on the irrigation demand.
The results for irrigation options 6 and 7 are very similar for cumulative surface run‐off. It is obviously not correct that there is no surface run‐off during irrigation for option 7.
Erratic behaviour of cumulative irrigation volumes as a function of PCDEPL (same as for options 3–5; not shown); for some (realistic) values of PCDEPL nonsensically high total irrigation volumes were computed. For instance, for option 6 and PCDEPL = 0.12 irrigation was applied every day from 7 September 1991 until 4 May 1992. → There must be a bug somewhere.
Figure D.3.
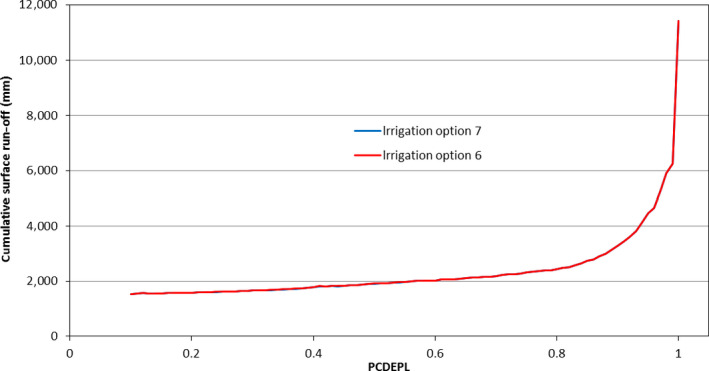
- FLEACH = 1; RATEAP = 0.125 cm/h = 30 mm/day.
Summary for old irrigation options
The erratic behaviour of cumulative irrigation (options 3–7) could be explained by a bug in the irrigation output variable printed to the.zts file.
The bug that caused surface run‐off during irrigation to occur also for old options 5 and 7 was identified and fixed (cf Section D.2.4) for the new options.
D.3.3.2. New irrigation options 5–7
In the new in official version winprzm3.exe, the old irrigation options 5–7 were replaced with three new options (cf Section D.2.3).
Note that in the tests for the new options, the default value of FLEACH was set to zero, not to 1.
New option 5 (sprinkling over canopy, without run‐off)
No more erratic behaviour of cumulative irrigation volumes.
Cumulative surface run‐off increases much more slowly with increasing PCDEPL (because irrigation events do not cause surface run‐off any more). Slightly non‐monotonous behaviour can be explained with different irrigation timing and different soil moisture status at the day of major rainfall events.
Figure D.5.
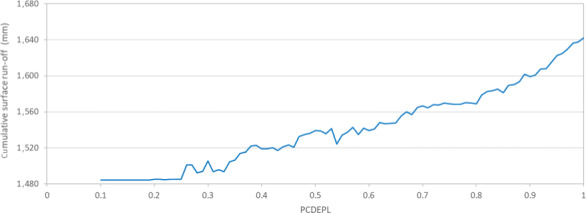
Total surface run‐off volumes in PRZM over 20 years. For different values of PCDEPL (R1, maize, new irrigation option 5)
- FLEACH = 0; RATEAP = 0.125 cm/h = 30 mm/day.
New option 6 (sprinkling under canopy, without run‐off)
Cumulative irrigation and surface run‐off are very similar to option 5.
Figure D.8 shows the development of the values for the variables triggering irrigation and the resulting irrigation applied in the FOCUS year in the R1 scenario for potatoes. Once SMTN (total water content in the root zone) drops below SMCT (aka SMCRIT), irrigation is triggered.
Figure D.8.

FOCUS R1 potatoes scenario (FOCUS year March 1984 until February 1985): water regime and triggered irrigation
- SMTN: Soil moisture current day in plant root zone; SMCT: Soil moisture at which irrigation will be triggered; SMDF: Soil moisture deficit; all in cm.
Table D.2 shows the results of a limited calibration performed with the new PRZM version to obtain similar cumulative irrigation volumes as in FOCUS (2001) for the various irrigated scenario/crop combinations. The only calibration parameter was PCDEPL; FLEACH and RATEAP were fixed. The resulting mean values and standard deviations of PCDEPL for each scenario are given in Table D.3.
Note that the calibration was conducted with the new irrigation option 6 (under canopy, without surface run‐off), which is strictly suitable only for tall crops such as pome/stone fruit. Hence, the calibration may have to be repeated for arable crops with the new irrigation option 5 (over‐canopy, without surface run‐off).
Leafy vegetables are the only crops with two cropping seasons per year in R1, R3 and R4. The calibration was made to match total irrigation amounts for each crop, not for the whole 20‐year period. However, it turned out that: (i) in FOCUS sw irrigation in leafy vegetables also takes place outside the cropping season, i.e. between the first and the second crop (this is most probably a mistake), and (ii) it is not possible to match the irrigation volumes for each cropping season with the same PCDEPL.
For the new irrigation option 5, also simulation sets were performed in which both PCDEPL and FLEACH were varied. This facilitates creating response surface plots with two independent variables (Figures D.9–D.11).
Figure D.9.
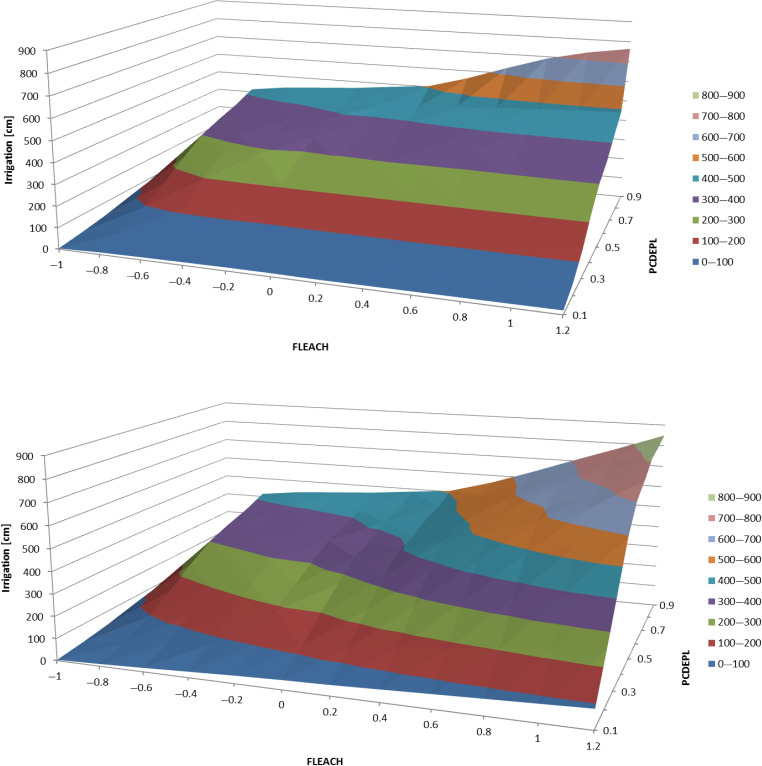
- Irrigation option 5; RATEAP: 0.125 cm h−1 = 30 mm day−1 (top); RATEAP: 1.25 cm h−1 = 300 mm day−1 (bottom).
Figure D.11.
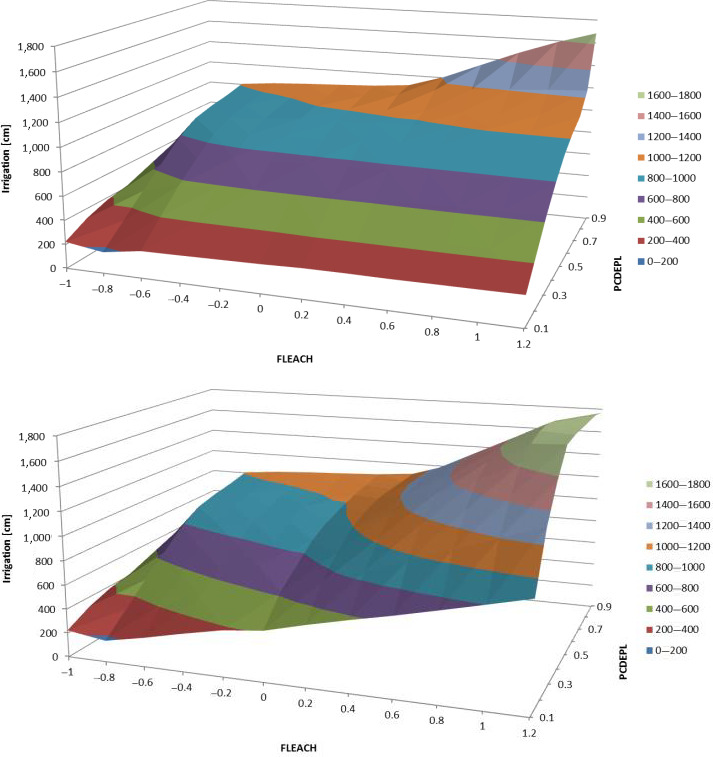
- Irrigation option 5; RATEAP = 0.125 cm h−1 = 30 mm day−1 (top); RATEAP = 1.25 cm h−1 = 300 mm day−1 (bottom).
Before analysing the response surface plots, let us consider how the three parameters act and interact in the model:
PCDEPL directly influences when an irrigation event is triggered, but it does not directly influence the irrigation depth for that event. However, a low value of PCDEPL will mean a high soil moisture deficit when irrigation is triggered.
RATEAP and FLEACH modify the irrigation depth of a given irrigation event, but do not directly affects its scheduling. However, the irrigation volume at a given event will influence the scheduling of the next event.
-
While FLEACH modifies the irrigation demand SMDEF by adding to or subtracting from the soil moisture deficit, RATEAP acts as a cut‐off:
-
–
For the settings used to determine PCDEPL (FLEACH = 0, RATEAP = 30 mm/day), the irrigation depth will be governed in most cases by RATEAP rather than by the actual soil moisture deficit, except for the very beginning of the cropping period.
-
–
However, if RATEAP is increased by a factor of 10–300 mm/day, the irrigation demand will almost always be smaller than RATEAP, and RATEAP will not be sensitive any more.
-
–
The results from the response surface plots for cumulative irrigation can be summarised as follows:
If PCDEPL is very small (i.e. very low plant‐available water storages in the root zone are needed to trigger irrigation), irrigation is triggered only very rarely or never. Cumulative irrigation volumes are very low or zero (cf Figure D.6 for PCDEPL ≤ 0.2).
If PCDEPL is very high (> 0.8), cumulative irrigation amounts increase rapidly despite RATEAP limiting the irrigation depths of individual events (Figure D.6). The reason is that now irrigation events take place very frequently.
FLEACH = −1 eliminates irrigation completely (Figure D.6), as expected from the code. However, in the range between −0.6 and 0.2 the sensitivity of FLEACH with respect to cumulative irrigation seems to be relatively low, even without interference from RATEAP (Figures D.7–D.9).
In the normal range of PCDEPL (0.35–0.7), RATEAP = 30 mm/day clearly lowers cumulative irrigation amounts for FLEACH ≥ −0.2 compared with RATEAP = 300 mm/day and eliminates the sensitivity of FLEACH for FLEACH ≥ 0 (cf Figures D.8 and D.9).
Figure D.6.
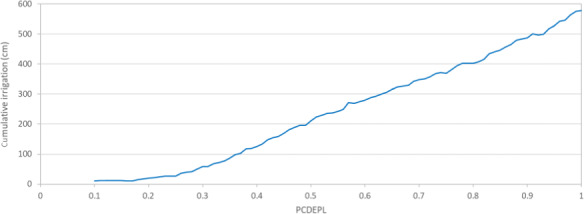
- FLEACH = 0; RATEAP = 0.125 cm/h = 30 mm/day.
Figure D.7.
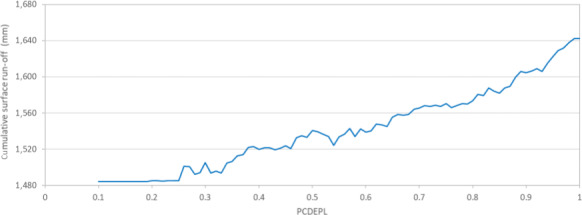
- FLEACH = 0; RATEAP = 0.125 cm/h = 30 mm/day.
New option 7 (sprinkling under canopy, user‐defined rates, without run‐off)
In option 7, the irrigation depth for a given event is fixed by RATEAP and does not depend on the soil moisture deficit. This explains the higher observed irrigation volumes compared with the new options 5 and 6 for high values of PCDEPL (Figure D.10 vs. Figures D.1 and D.3) and the steep rise of the cumulative irrigation volume when PCDEPL approaches 1 (Figure D.9). Cumulative surface run‐off volumes are very similar to those for the new options 5 and 6 except for PCDEPL = 1 (Figure D.11 vs. Figures D.2 and D.4).
Figure D.10.
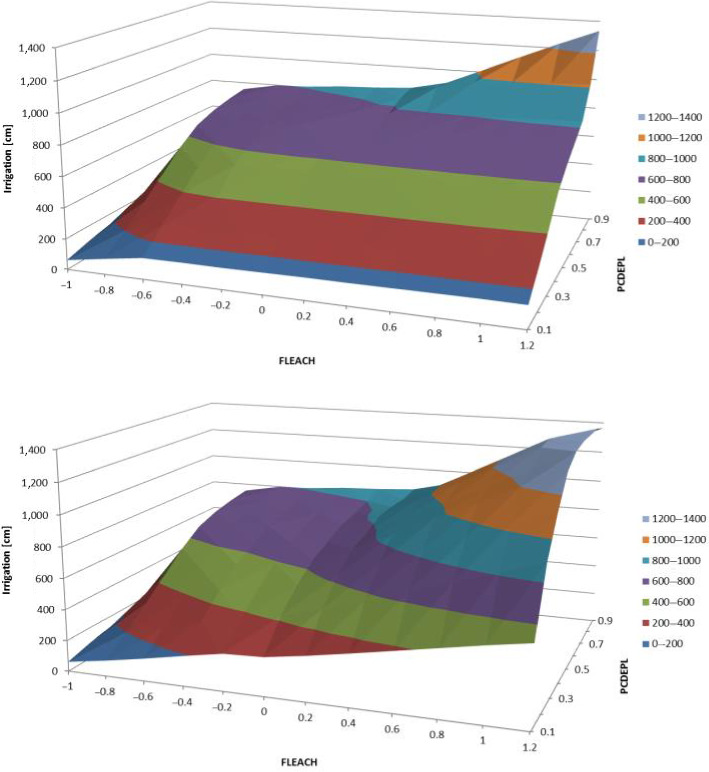
- Irrigation option 5; RATEAP: 0.125 cm h−1= 30 mm day−1 (top); RATEAP = 1.25 cm h−1 = 300 mm day−1 (bottom).
Figure D.4.
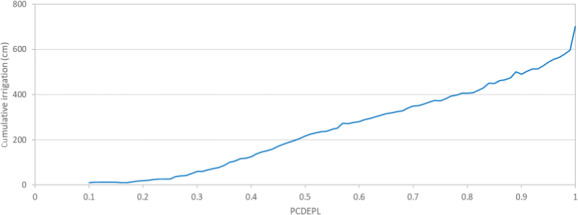
Total irrigation volumes in PRZM over 20 years for different values of PCDEPL (R1, maize, new irrigation option 5)
- FLEACH = 0; RATEAP = 0.125 cm/h = 30 mm/day.
D.3.4. Summary and Conclusions
The results of the sensitivity analysis can be summarised as follows:
All tested old options (1; 3–7) have bugs. Apart from the issue of surface run‐off generation during irrigation, there was a bug in the irrigation output variable printed to the.zts file.
The adjusted irrigation options 5–7 of the new PRZM indeed prevent the generation of surface run‐off during irrigation and seem to be bug free.
The sensitivities and interactions of the parameters PCDEPL, FLEACH and RATEAP turned out as expected in the sensitivity analysis for the new options.
-
The calibration exercise conducted for option 6 to match cumulative irrigation volumes in FOCUS (2001) yielded different values of PCDEPL for different scenario/crop combinations:
-
–
However, a value of PCDEPL around 0.4 seems generally appropriate.
-
–
For crops with two cropping seasons per year, it turned out that: (i) in FOCUS sw irrigation also takes place outside the cropping season, i.e. between the first and the second crop (this is most probably a mistake), and (ii) it is not possible to match the cumulative irrigation volumes for each cropping season (first and second) with the same PCDEPL.
-
–
The calibrated values of PCDEPL suggest that in ISAREG for scenario R4 some crops were treated differently from the usual procedure (very low value of PCDEPL for soybean and very high value for root vegetables).
-
–
D.3.5. Recommendations
The two most appropriate options are the new options 5 and 6 (over and under canopy irrigation, without surface run‐off). However, neither of them is suitable for all crops → option 5 is to be used for arable crops and grass, and option 6 for tall permanent crops.
-
The ISAREG water balance simulations to establish the irrigation regimes in FOCUS (2001) used the same irrigation threshold (p = 0.4) for all crops except grass. However, the crop coefficients for evapotranspiration differed between crops (cf Appendix M in FOCUS (2001)) and were mostly different from the values of the ‘pan evaporation factor’ PFAC which is used to up‐ or downscale potential evapotranspiration in PRZM (Appendix D in FOCUS (2001)):
-
–
Given the inconsistencies between the setups of ISAREG and PRZM in FOCUS (2001), it would probably create a false impression of precision if PCDEPL were calibrated for each scenario/crop combination against the cumulative irrigation volumes calculated by ISAREG.
-
–
Instead, a common value of PCDEPL for all crops would probably be adequate, unless plant physiological or agronomical knowledge suggest otherwise.
-
–
-
The parameter combination (RATEAP = 0.125 cm/day; FLEACH = 0; PCDEPL = 0.4) for the new options 5 and 6 appears to be a candidate for the PRZM irrigation settings in FOCUS sw repair, for the following reasons:
-
–
Irrigation events are limited to 30 mm/day like in FOCUS (2001).
-
–
Cumulative irrigation amounts are similar to FOCUS (2001) for most crop/scenario combinations.
-
–
In cases in which the soil moisture deficit is smaller than 30 mm, the irrigation amount will be equal to the soil moisture deficit.
-
–
Negative values of FLEACH are allowed in PRZM and could be used to simulate incomplete filling up of the water content in the root zone to field capacity. However, for FLEACH = 0, if the deficit exceeds RATEAP (which will be the case most of the cropping period), the irrigation event will not completely fill up the root zone water content to field capacity either. Hence, negative values of FLEACH are not really necessary to simulate incomplete refilling of soil moisture. They also make the mathematical problem unnecessarily complex.
-
–
Not only cumulative irrigation volumes are important, but also irrigation timing: as a next step, the existing PRZM output time series from the sensitivity analysis should be analysed.
It has to be kept in mind that in PRZM, the irrigation trigger is not linked to the threshold of evapotranspiration reduction. In contrast, in the ISAREG setup that was used in FOCUS (2001), the irrigation threshold was set precisely to the point at which the crop starts to reduce transpiration, to not allow any reduction in transpiration (and so possibly yield). However, if PCDEPL is set to 0.6 to match the threshold for reduction of evapotranspiration, cumulative irrigation volumes will get rather high.
D.4. Suggested and adopted irrigation rules for PRZM
Irrigation in PRZM has been implemented in the following way:
New irrigation options 5 (over canopy) or 6 (under canopy), depending on crop;
PCDEPL = 0.4;
FLEACH = 0;
RATEAP = 0.125 cm h−1 = 30 mm d−1;
Future work: Review the values of PFAC used in the R scenarios (e.g. check against the Kc factors recommended by FAO) and adapt them if necessary.
Test runs for all irrigated crop/R scenario combinations were conducted.
D.5. Questions and answers on PRZM code
(Subroutine HYDROL, received from Mark Cheplick on 16 July 2018.)
D.5.1. ‘Depth of run‐off calculation’

Q: Where does the variable INITROD come from, and what is its value (you said, it should be 10 cm)?
A: INITROD is hard‐wired in the code to 10 cm. → The run‐off depth is the maximum of 10 cm and the thickness of the first numerical layer.
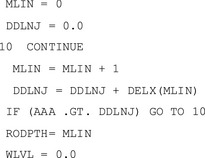
Q: What are MLIN and DDLNJ? MLIN is an integer variable, so maybe number of layers? And DDLNJ cumulative thickness? So RODEPTH is the run‐off depth expressed in number of layers comprising it?
A: Yes to all.
D.5.2. Calculation of SPTAVE
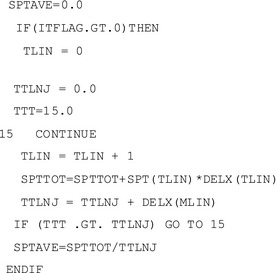
Q: Can you confirm that this routine calculates a depth‐weighted mean temperature for the top 15 cm?
A: Yes.
D.5.3. WLVL
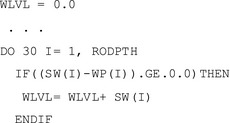
Q: What are SW(I) and WP(I)? Soil water content and wilting point water content (as depths)? In this case, WLVL would be the sum of soil water (as a depth) over the run‐off depth?
A: Yes. Calculation is for an undocumented, experimental drainage routine.
D.5.4. Calculation of CN for the limiting cases
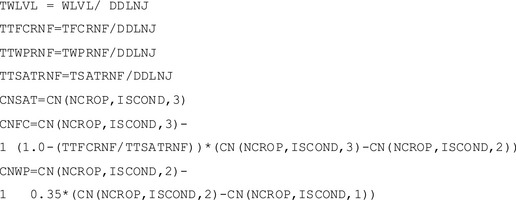
Q: Do I understand correctly that this piece of code calculates the Curve Numbers at FC and WP water content in the ‘run‐off zone’? What is TSATRNF? Water content at complete saturation?
A: That is correct. TSATRNF is the saturated water content in the run‐off zone. Again not used when CNFLAG is in assumed default = 0.
D.5.5. Calculation of daily CN
Q: There is a large chunk of code which calculates the daily curve number.
But what do CNFLAG and its five possible values mean? There is no such flag in the.inp file.
A: The CNFLAG is an undocumented feature I added quite a while ago to test out some ideas I had and that Dirk Young was considering. It has no bearing on normal WINPRZM uses but I am happy to discuss with you the concept behind some of them. If no CNFLAG entered, then CNFLAG is defaulted to 0.
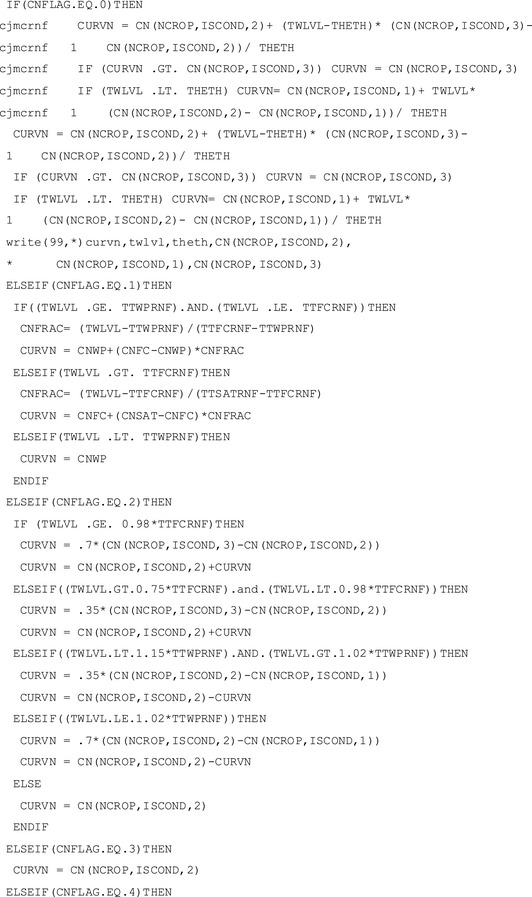
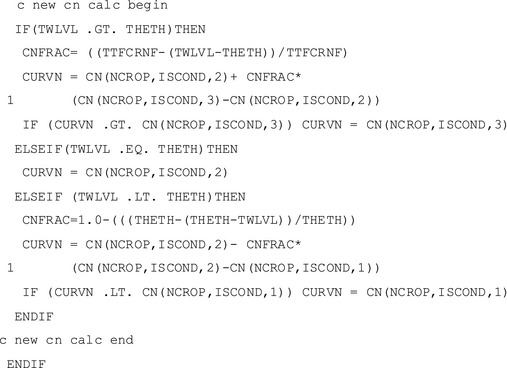
D.5.6. Calculation of surface run‐off dependent on the value of the soil temperature switch ITFLAG
I disregard ITFLAG = 0, because we do not use this setting anyway.
If the average soil temperature in the top 15 cm is > 0, surface run‐off is calculated with the usual CN formula:
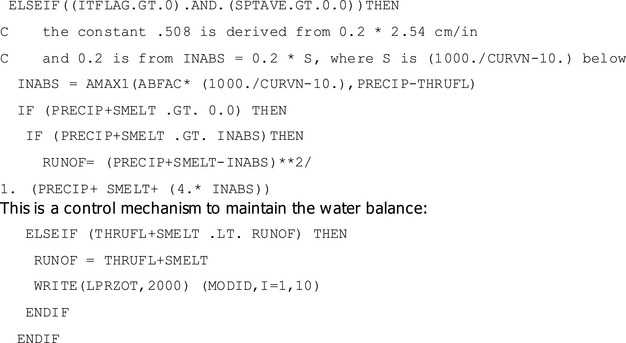
Q: If the soil is frozen in the top 15 cm, everything runs off. However, given that PRZM does not simulate soil temperatures below zero degrees, does the soil temperature ever reach exactly zero degrees? Or is there some rounding involved somewhere?
A: Mark Cheplick did some tests in debug mode and found that SPTAVE can indeed reach 0.0, upon which CN is set to 100.
D.5.7. Calculation of infiltration
Q: AINF (1) is updated with throughfall, snowmelt and surface run‐off. But where does AINF (1) come from? From the irrigation routines, right?
A: AINF is the infiltration into the first soil compartment. It comes from either rainfall or irrigation. Throughfall can be from either rainfall or irrigation.
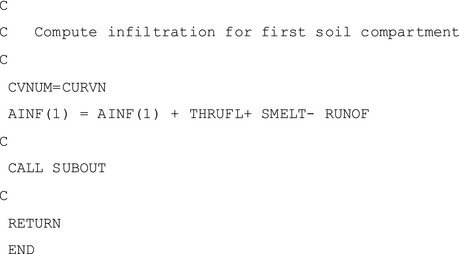
D.6. Description of the automatic irrigation routine implemented in MACRO
The procedure for triggering and applying automatic irrigation in the MACRO drainage scenarios is harmonised as far as possible with the routine implemented in the PRZM run‐off scenarios. However, there are some differences in the approaches adopted, as a consequence of the different methods used in the two models to simulate soil hydrology (PRZM is a capacity model, while MACRO uses Richards’ equation). Irrigation in MACRO is triggered when a critical soil water deficit is exceeded. The following text gives a brief description of the algorithm.
The total storage of water in micropores in the root zone is given by:
where nroots is the number of numerical layers in the root zone, θmic (–) is the volumetric water content in the micropores and Δz (m) is the numerical layer thickness.
The depth of the ‘root zone’ (cm) is defined by:
where a minimum depth of 30 cm was used to avoid unrealistic irrigation during the initial crop growth stages. The critical storage of water in the root zone, below which an automatic irrigation is triggered, is given by:
where θb (–) is the volumetric water content at soil matrix saturation (defined by the pressure head, ψb), θwilt (–) is the volumetric water content (matrix) at wilting point and the new model parameter fcrit (–) is the fraction of plant‐available water remaining at the critical micropore water content, θcrit (–). Note that any water in soil macropores is ignored. If S < Scrit, then an irrigation event is triggered in the model, with a fixed irrigation amount of 30 mm (see Table D.5) at an intensity of 5 mm h−1.
The switches and parameter values required by MACRO are read from a text file created by the shell program, called ‘Automatic_irrigation_parameters.txt’ which should be located in the same folder as the MACRO executable file. This file contains the switches and parameters given in Table D.5.
It can also be noted that:
automatic irrigation can only occur between crop emergence and harvest;
automatic irrigations are free from solutes;
for irrigation under the crop canopy, interception is set to zero. For irrigation above the crop canopy, interception is dependent on the crop canopy development;
Rainfall during irrigation is handled in the usual manner for both types of crops;
automatic irrigation cannot take place on a day when a pesticide application is scheduled. Automatic irrigation is then applied on the day following pesticide application, if the condition for triggering an irrigation is still met.
D.7. Overview of new scenario and crop‐specific irrigation
D.7.1. Annual average irrigation
Annual average irrigation of the irrigated crop–scenario combination is compared in Table D.6 (drainage scenarios) and Table D.7 (run‐off scenarios) against the annual irrigation of the original FOCUS surface water scenarios (FOCUS, 2001).
Table B.2.
Summary of annual precipitation (mm) and drainage (mm) for the D4‐Skousbo, D5‐La Jaillière and D6‐Thiva scenario (all winter cereals, non‐irrigated)
| D4‐Skousbo | D5‐La Jaillière | D6‐Thiva | ||||||
|---|---|---|---|---|---|---|---|---|
| Year | Precipitation | Drainage | Year | Precipitation | Drainage | Year | Precipitation | Drainage |
| 1969 | 637 | 53 | 1969 | 608 | 151 | 1971 | 818 | 401 |
| 1970 | 687 | 149 | 1970 | 685 | 233 | 1972 | 544 | 126 |
| 1971 | 661 | 142 | 1971 | 612 | 183 | 1973 | 803 | 324 |
| 1972 | 659 | 147 | 1972 | 704 | 272 | 1974 | 755 | 331 |
| 1973 | 671 | 129 | 1973 | 684 | 228 | 1975 | 782 | 341 |
| 1974 | 661 | 186 | 1974 | 638 | 208 | 1976 | 648 | 251 |
| 1975 | 529 | 136 | 1975 | 589 | 172 | 1977 | 464 | 148 |
| 1976 | 540 | 105 | 1976 | 471 | 116 | 1978 | 937 | 466 |
| 1977 | 628 | 213 | 1977 | 608 | 174 | 1979 | 1005 | 497 |
| 1978 | 671 | 147 | 1978 | 612 | 184 | 1980 | 868 | 365 |
| 1979 | 661 | 186 | 1979 | 858 | 394 | 1981 | 898 | 445 |
| 1980 | 742 | 262 | 1980 | 722 | 271 | 1982 | 803 | 348 |
| 1981 | 756 | 292 | 1981 | 729 | 258 | 1983 | 934 | 482 |
| 1982 | 661 | 148 | 1982 | 770 | 308 | 1984 | 648 | 232 |
| 1983 | 716 | 232 | 1983 | 720 | 164 | 1985 | 818 | 475 |
| 1984 | 659 | 147 | 1984 | 729 | 243 | 1986 | 824 | 355 |
| 1985 | 748 | 209 | 1985 | 551 | 130 | 1987 | 755 | 327 |
| 1986 | 632 | 105 | 1986 | 685 | 215 | 1988 | 951 | 551 |
| 1987 | 687 | 166 | 1987 | 638 | 204 | 1989 | 329 | 16 |
| 1988 | 630 | 157 | 1988 | 704 | 261 | 1990 | 464 | 124 |
| 1989 | 610 | 88 | 1989 | 589 | 189 | 1991 | 782 | 351 |
| 1990 | 637 | 136 | 1990 | 460 | 136 | 1992 | 154 | 21 |
| 1991 | 689 | 184 | 1991 | 548 | 219 | 1993 | 246 | 0 |
| 1992 | 492 | 87 | 1992 | 476 | 59 | 1994 | 414 | 3 |
| 1993 | 699 | 171 | 1993 | 684 | 233 | 1995 | 475 | 60 |
| 1994 | 801 | 282 | 1994 | 873 | 355 | 1996 | 544 | 148 |
| Mean of 20 years | 659 | 173 | Mean of 20 years | 651 | 214 | Mean of 20 years | 666 | 271 |
Appendix E– Description of wash‐off and canopy pesticide balance in MACRO and PRZM
E.1. MACRO
MACRO calculates foliar wash‐off and dissipation as first‐order processes. The mass of pesticide, M (mg m−2), on the canopy is given by:
| (E1) |
where I is the application rate (mg m−2), t is time (h), Rt is the throughfall rate (mm/h), Fext is the wash‐off coefficient (FEXT in MACRO; 1/mm) and μ is the canopy dissipation rate coefficient (CANDEG in MACRO; 1/h). Solving the canopy mass balance, assuming that the rates of mass loss by wash‐off and dissipation are controlled by the arithmetic average of the pesticide mass stored on the canopy at the current and previous time steps, gives:
| (E2) |
where Cr is the pesticide concentration in precipitation, Ri is the rate of precipitation interception, Δt is the time step (which is a maximum of half an hour in MACRO) and the subscripts n and n − 1 refer to the current and previous time steps, respectively.
E.2. PRZM
There are four pesticide loss processes from the canopy in PRZM (Carsel et al., 2003):
volatilisation (parameter PLVKRT);
unspecified decay (parameter PLDKRT);
foliar wash‐off (parameter FEXTRC);
foliar transformation to a metabolite (parameters PTRAN12, PTRAN13, PTRAN23; only relevant for parent‐metabolite simulations);
where PLVKRT (1/day) is the foliar volatilisation rate constant, PLDKRT (1/day) the foliar decay rate constant and FEXTRC (1/cm) the foliar wash‐off coefficient (equivalent to the MACRO parameter FEXT).
In the older routine PLPEST, foliar transformation and unspecified decay are two separate processes. However, in the newer routine PLPEST2 from 2015, foliar transformation is a part of unspecified decay.
At this time, winprzm.exe uses the older version PLPEST (Mark Cheplick, pers. comm., 13 March 2018):
‘It is currently defaulted to use the original PLPEST routine. This was code that I added as I thought at some point it should be consistent with how the soil kinetics were being done. Just to be clear, I will never change the code without notifying and working through the testing with validation group. However, I do from time to time add undocumented features that I test out for various reasons. I think the plpest2 routine should be looked at as a potential replacement though. The version of winprzm you have does not have it implemented (disabled), but I can post the *.exe and the needed input file change if you would like to test it out.’
In regulatory modelling, PLVKRT and the PTRAN parameters are usually set to zero, and PLDKRT is used as a foliar dissipation rate constant (equivalent to the MACRO parameter CANDEG). Apart from degradation due to, e.g. hydrolysis or photolysis, foliar dissipation could also include penetration into leaves. Both foliar wash‐off and decay are simulated in PRZM as first‐order processes:
| (E3) |
| (E4) |
where M is the areic mass of pesticide on the leaves (internally in g/cm2) and THRUFL the throughfall volume in cm/day. The PRZM code was adapted in June 2018 to use throughfall instead of rainfall. The latest released version winprzm 4.63 still uses rainfall in Equation (E3), which will overestimate foliar wash‐off.
In PRZM, wash‐off and dissipation are calculated sequentially at a given time step, rather than simultaneously.
The calculation of foliar loss processes and the canopy solute balance in PRZM is performed as follows, for a given day n. First, any pesticide intercepted from a foliar pesticide application is added to the residues from the previous day:
| (E5) |
where Mn,temp1 is a temporary areic mass, Mn‐1,final are the pesticide residues from the previous day and Mn,inter is the mass of pesticide intercepted by the canopy on day n.
The temporary areic mass Mn,temp1 is now used to calculate foliar wash‐off. If throughfall (i.e. rainfall – water intercepted by canopy) = 0, there is no wash‐off (obviously). If throughfall > 0, the foliar wash‐off on day n is given as:
| (E6) |
| (E7) |
where Mn,washoff is the foliar wash‐off at time step n (g/cm2), ∆t is the time step (always 1 day in PRZM). The calculations in Equations (E6) and (E7) correspond to the PRZM code snippet above. After foliar wash‐off has been subtracted, foliar dissipation is calculated from the updated pesticide storage on the canopy, again with an exponential (first‐order) equation:
| (E8) |
| (E9) |
where Mn,decay is the amount of pesticide lost by decay/dissipation, and Mn,final is the final areic mass of the pesticide on the canopy on day n (this is also the canopy pesticide storage that will be written to the.zts file). If volatilisation (parameter PLVKRT) (and, in the older version PLPEST, foliar transformation (parameters PTRAN12, etc.)) is also simulated, they are evaluated simultaneously with foliar decay (PLDKRT), as becomes evident in the code.
In summary, there are two sequential first‐order processes, with foliar wash‐off losses being subtracted before foliar dissipation is calculated. Consequently, foliar wash‐off loss will be larger than if both processes were evaluated simultaneously, although overall losses will be the same. At first glance, it does not seem logical to first subtract wash‐off and then calculate degradation in PRZM. However, rainfall events usually last less than 24 h. If wash‐off and degradation were calculated simultaneously (i.e. in the same exponent) during a time step, this would mean that rainfall is assumed to be spread evenly over 24 h. Hence, if one cannot go for a shorter time step than 1 day, it is probably a reasonable conservatism to subtract wash‐off first.
Pesticide lost via foliar wash‐off from the canopy is not added completely to the uppermost numerical layer of the soil, but distributed in a certain way over all layers of the run‐off zone (top 2 cm), as described in lines 24 ff. of subroutine PLPEST.
Appendix F– Comparison of pesticide wash‐off calculated with MACRO and PRZM
1.
This appendix compares the routines for pesticide interception and wash‐off in the PRZM and MACRO models that are used to calculate exposure via surface run‐off and drainage, respectively, in the EU FOCUS surface water scenarios. In addition to the process descriptions given in Appendix E, test simulations were run to assess the extent to which differences in the model routines affect calculated pesticide wash‐off.
F.1. Test simulations
F.1.1. Driving data and parameterisation
Simulations were run with MACRO (v.5.2) and PRZM (winprzm.exe v.4.6.3 from FOCUS_PRZM_SW_4.3.1) for a 1‐year period (1 April 1976 to 31 March 1977) using weather data from the FOCUS surface water scenario D1‐Lanna. Pesticide (at a dose of 10 mg m−2) was applied in both models on 10 different application days during the spring and summer period in 1976 (Julian days 100, 115, 130, 145, 160, 175, 190, 205, 220, 235) with interception set to 100% (i.e. the entire dose was assumed to be intercepted by the canopy). In PRZM, complete interception was achieved by parameterising a pseudopermanent crop and setting the maximum ground cover (COVMAX) to 100%.
Rainfall occurred on two of these application days (4.4 mm on day 190 and 8.9 mm on day 235). As the timing of applications in relation to rainfall can play an important role in determining wash‐off in MACRO, we ran simulations for two different times of application, at midnight (00.00) and at 10 p.m. in the evening (22.00). In both cases, the duration of the pesticide application was set to 1 h (it can be noted that in MACRO‐in‐FOCUS, pesticide applications take place at 9.00). This issue is not important for PRZM, as it runs with a daily time step. The applications at 22.00 occurred after any rainfall on that day had ceased. This is because, when run with daily rainfall totals as here, MACRO assumes that rainfall always starts at 00.00. With the default rainfall intensity used both here and in FOCUS surface water (2 mm h−1), the rainfall would have ceased at 2.12 and 4.27 on days 190 and 235, respectively. Due to differences in the way evapotranspiration is partitioned between the soil and the crop canopy in the two models, the potential evapotranspiration (PET) time series that was fed into PRZM was given by the sum of potential transpiration and potential canopy evaporation calculated internally by MACRO (i.e. total potential evapotranspiration minus potential soil evaporation). Furthermore, individual test simulations with PRZM were carried out with constant daily PET values: 2 mm, 1 mm and 0 mm. The simulations were run with a constant canopy interception capacity of 2 mm in both models.
In both models, wash‐off was simulated for nine parameterisations comprising all combinations of three values of the wash‐off coefficient (0.05, 0.1 and 0.2 mm−1) and three values of the canopy dissipation half‐life (5, 10 and 20 days). Combined with the 10 different application days and two different application timings for MACRO, this gave in total 90 simulations for PRZM and 180 for MACRO.
F.1.2. Results and discussion
Figure F.1 compares the wash‐off simulated by MACRO for applications at midnight and 22.00. It shows that wash‐off following application at 00.00 on dry days is slightly smaller than for application at 22.00, because there is more time for dissipation before the next rainfall event. In contrast, on wet days, the wash‐off loss is obviously larger following application at 00.00, because it is raining during application and also for some hours afterwards.
Figure F.1.
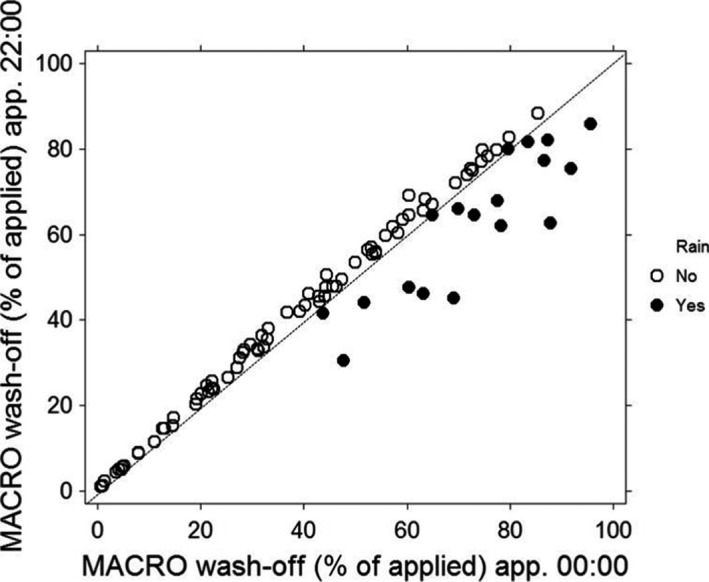
Comparison of total wash‐off simulated by MACRO for two different application timings (00.00 and 22.00) on the same day of application
Comparisons of the PRZM and MACRO model calculations of total pesticide wash‐off expressed as a percentage of the applied (and intercepted) dose are shown in Figures F.2 and F.3. These results show that, although the differences are relatively small, wash‐off is consistently slightly larger with PRZM than with MACRO, except for very small or very large losses by wash‐off (corresponding to very large or very small dissipation losses). This difference between the models is not systematically dependent on either the canopy half‐life or the wash‐off coefficient. The reason for this difference in model predictions lies in the way the pesticide mass balance for the canopy is solved in the models (refer to Appendix E). In PRZM, this is performed as a two‐step procedure at each time step (i.e. 1 day). First, wash‐off is calculated as a first‐order process for the pesticide already stored on the canopy together with any applied on that day. The stored amount is then updated for the loss by wash‐off before calculating the dissipation loss at the same time step. In contrast, MACRO calculates the mass balance simultaneously for wash‐off and dissipation at each time step (maximum half an hour, but usually smaller during rainfall). But probably a more important reason is that although wash‐off in PRZM is triggered by throughfall, it is actually calculated using rainfall. This will overestimate wash‐off.
Figure F.2.
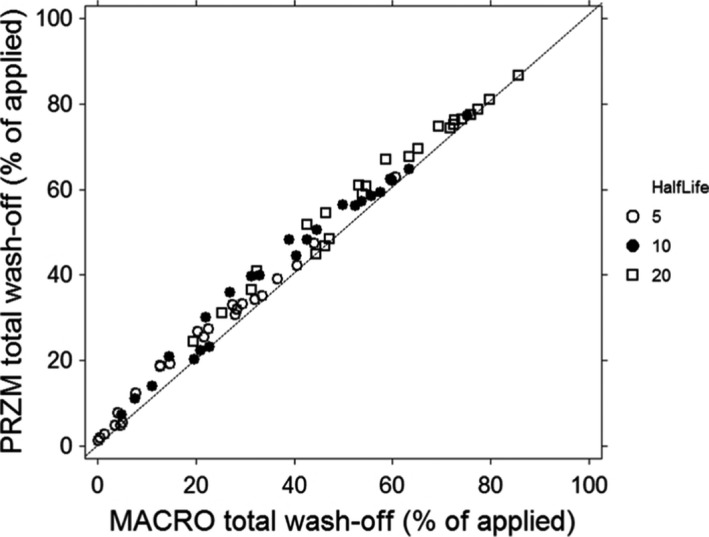
Comparison of wash‐off simulated by PRZM and MACRO (application at midnight) illustrating the effects of canopy dissipation half‐life (5, 10 and 20 days)
- Note that the simulation results for the two rainy application days have been excluded for the sake of clarity.
Figure F.3.
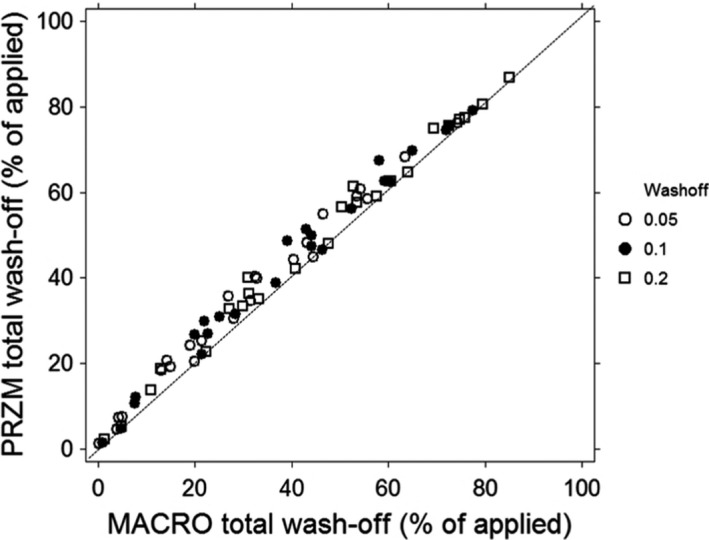
Comparison of wash‐off simulated by PRZM and MACRO (application at midnight) illustrating the effects of the wash‐off coefficient (0.05, 0.1 and 0.2 mm−1)
- Note that the simulation results for the two rainy application days have been excluded for the sake of clarity.
Finally, Figures F.4 and F.5 illustrate the predicted wash‐off and canopy storage simulated by the two models daily for two example scenarios. These figures show that the models predict identical temporal patterns of wash‐off. It can be noted that the slight ‘smearing’ of the wash‐off pattern simulated by MACRO compared with PRZM is due to an artefact related to the outputting of accumulated variables in MACRO.
Figure F.4.
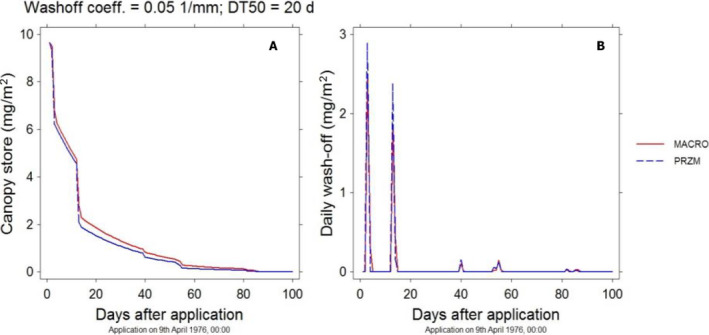
Comparison of canopy storage and wash‐off simulated by PRZM and MACRO (application at midnight) with application on 9 April 1976 with D1‐Lanna weather data, a wash‐off coefficient of 0.05 mm−1 and a canopy dissipation half‐life of 20 days
Figure F.5.
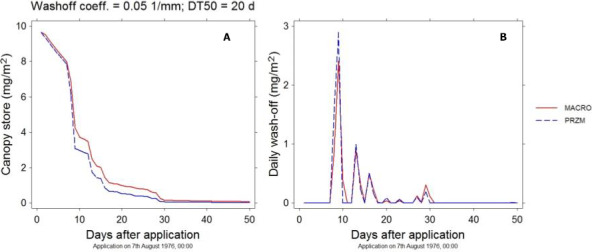
Comparison of canopy storage and wash‐off simulated by PRZM and MACRO (application at midnight) with application on 7 August 1976 with D1‐Lanna weather data, a wash‐off coefficient of 0.05 mm−1 and a canopy dissipation half‐life of 20 days
F.1.3. Conclusions
With the exception of pesticide applications on rainy days, the existing routines in PRZM and MACRO give very similar predictions of total wash‐off of intercepted pesticide stored on crop canopy. There is no need for any further harmonisation of the models except for application days with rainfall.
The small logical inconsistency identified in the wash‐off routine in PRZM (wash‐off is triggered by throughfall but calculated using rainfall, also refer to Appendix E) has been fixed meanwhile: the modified PRZM version also calculates foliar wash‐off with throughfall. Consequently, now the predictions of wash‐off with the two models should be almost identical.
Appendix G – Linking BBCH stages to calendar dates
1.
The software tool AppDate (Klein, 2006, 2018) was developed for the UBA (German Environmental Agency) and combines information from the BBCH monograph (BBCH, 2001) with information given by FOCUS (2001) and European Commission (2014). Based on this information, AppDate suggests a suitable calendar date based on a certain BBCH stage. The user has to select only which compartment (groundwater or surface water), which location (e.g. R1), which crop (e.g. winter cereals) and which BBCH stage (e.g. 25) should be estimated.
AppDate uses a database for which suitable application dates for major development stages (e.g. BBCH 10, 20, 30) are collected. Between these BBCH stages, the dates are always linearly interpolated. The dates for the major development stages are based on various sources and also dependent on whether they refer to groundwater or surface water scenarios. According to the BBCH monograph (BBCH, 2001), not all BBCH stages are defined for most of crops. This was followed in AppDate.
The simple strategy of linear interpolation between defined BBCH stages does not hold for crops with a dormancy period in winter. This process was, to some extent, already considered in previous versions of AppDate, but without a clear methodology. AppDate now uses the following simple algorithm and the spring point (defined by FOCUS groundwater) for the time between crop emergence and the end of the hibernation:
date BBCH stage 20 = 15 days after crop emergence, beginning of hibernation;
date BBCH stage 21 = 9 days before spring point, end of hibernation;
date BBCH stage 30 = spring point.
The term spring point is not mentioned in the FOCUS sw report (2001). Nevertheless, spring points were defined also by FOCUS sw for drainage scenarios (D1 to D6). They can be found in Appendix C of the FOCUS sw report (parameter ‘Intermediate crop development’, ZDATEMIN). No spring points were defined for the R scenarios by FOCUS (2001). Therefore, for R1 and R3, the spring points for winter cereals and winter oil seed rape given for the FOCUS gw scenarios Hamburg Kremsmünster and Piacenza were considered, respectively. For R4, the spring points for winter cereals were determined based on GGD analysis.
In general, the FOCUS date for maximum leaf area index (LAI) or ‘maturation date’ in PRZM is used to define BBCH stage 60 (begin of flowering). However, for those crops that are already harvested at BBCH stage 50 (e.g. sugar beet, root, bulb and leafy vegetables) the maximum LAI is used to define BBCH stage 40 (‘booting’).
Unfortunately, the planting date is not always given by FOCUS (2001). Missing dates are therefore set to 10 days before crop emergence.
The following table shows how the BBCH macro stages (cornerstones for the interpolation) were defined in AppDate.
BBCH stages after 90 (after harvest) were added to consider very late applications especially in tall permanent crops. As no interpolation was possible for these late stages, it was assumed that the daily increase at these late BBCH states was 1.
For lawn, pasture and evergreens (citrus and olives), the FOCUS sw models are using the fully developed crop for the whole period of the simulation. Therefore, no BBCH stages could be linked to these cultivations.
Table G.2 shows an example output of AppDate for winter oilseed rape at D2‐Brimstone. The table presents results for all 100 possible BBCH stages (i.e. requested stage). However, according to the BBCH monograph, not all stages exist for oil seed rape (e.g. BBCH 40–49 is absent). If a stage is requested by the user that actually does not exist, AppDate jumps to the next stage that is defined for the crop (i.e. allocated stage). Columns three and four show the recommended date (calendar date and Julian date). Rows in bold characters are based on information from FOCUS (2001), the other rows are calculated by AppDate using linear interpolation. In the final column, the default crop interception is given (also refer to Section 3.1.4).
Table G.2.
Example output of AppDate for winter oil seed rape at D2‐Brimstone
| Requested BBCH stage | Allocated BBCH stage | Datea | Julian datea | Default crop interception (%) |
|---|---|---|---|---|
| 00 | 00 | 05.09. | 248 | 0 |
| 01 | 01 | 06.09. | 249 | 0 |
| 02 | 03 | 08.09. | 251 | 0 |
| 03 | 03 | 08.09. | 251 | 0 |
| 04 | 05 | 11.09. | 254 | 0 |
| 05 | 05 | 11.09. | 254 | 0 |
| 06 | 07 | 13.09. | 256 | 0 |
| 07 | 07 | 13.09. | 256 | 0 |
| 08 | 08 | 14.09. | 257 | 0 |
| 09 | 09 | 15.09. | 258 | 0 |
| 10 | 10 | 16.09. | 259 | 40 |
| 11 | 11 | 17.09. | 260 | 40 |
| 12 | 12 | 19.09. | 262 | 40 |
| 13 | 13 | 20.09. | 263 | 40 |
| 14 | 14 | 22.09. | 265 | 40 |
| 15 | 15 | 23.09. | 266 | 40 |
| 16 | 16 | 24.09. | 267 | 40 |
| 17 | 17 | 26.09. | 269 | 40 |
| 18 | 18 | 27.09. | 270 | 40 |
| 19 | 19 | 29.09. | 272 | 40 |
| 20 | 20 | 30.09. | 273 | 80 |
| 21 | 21 | 01.03. | 60 | 80 |
| 22 | 22 | 02.03. | 61 | 80 |
| 23 | 23 | 03.03. | 62 | 80 |
| 24 | 24 | 04.03. | 63 | 80 |
| 25 | 25 | 05.03. | 64 | 80 |
| 26 | 26 | 06.03. | 65 | 80 |
| 27 | 27 | 07.03. | 66 | 80 |
| 28 | 28 | 08.03. | 67 | 80 |
| 29 | 29 | 09.03. | 68 | 80 |
| 30 | 30 | 10.03. | 69 | 80 |
| 31 | 31 | 15.03. | 74 | 80 |
| 32 | 32 | 20.03. | 79 | 80 |
| 33 | 33 | 25.03. | 84 | 80 |
| 34 | 34 | 29.03. | 88 | 80 |
| 35 | 35 | 03.04. | 93 | 80 |
| 36 | 36 | 08.04. | 98 | 80 |
| 37 | 37 | 13.04. | 103 | 80 |
| 38 | 38 | 18.04. | 108 | 80 |
| 39 | 39 | 23.04. | 113 | 80 |
| 40 | 50 | 28.04. | 118 | 80 |
| 41 | 50 | 28.04. | 118 | 80 |
| 42 | 50 | 28.04. | 118 | 80 |
| 43 | 50 | 28.04. | 118 | 80 |
| 44 | 50 | 28.04. | 118 | 80 |
| 45 | 50 | 28.04. | 118 | 80 |
| 46 | 50 | 28.04. | 118 | 80 |
| 47 | 50 | 28.04. | 118 | 80 |
| 48 | 50 | 28.04. | 118 | 80 |
| 49 | 50 | 28.04. | 118 | 80 |
| 50 | 50 | 28.04. | 118 | 80 |
| 51 | 51 | 02.05. | 122 | 80 |
| 52 | 52 | 07.05. | 127 | 80 |
| 53 | 53 | 12.05. | 132 | 80 |
| 54 | 55 | 22.05. | 142 | 80 |
| 55 | 55 | 22.05. | 142 | 80 |
| 56 | 57 | 31.05. | 151 | 80 |
| 57 | 57 | 31.05. | 151 | 80 |
| 58 | 59 | 10.06. | 161 | 80 |
| 59 | 59 | 10.06. | 161 | 80 |
| 60 | 60 | 15.06. | 166 | 80 |
| 61 | 61 | 16.06. | 167 | 80 |
| 62 | 62 | 17.06. | 168 | 80 |
| 63 | 63 | 18.06. | 169 | 80 |
| 64 | 64 | 19.06. | 170 | 80 |
| 65 | 65 | 20.06. | 171 | 80 |
| 66 | 67 | 22.06. | 173 | 80 |
| 67 | 67 | 22.06. | 173 | 80 |
| 68 | 69 | 24.06. | 175 | 80 |
| 69 | 69 | 24.06. | 175 | 80 |
| 70 | 71 | 26.06. | 177 | 80 |
| 71 | 71 | 26.06. | 177 | 80 |
| 72 | 72 | 27.06. | 178 | 80 |
| 73 | 73 | 28.06. | 179 | 80 |
| 74 | 74 | 29.06. | 180 | 80 |
| 75 | 75 | 30.06. | 181 | 80 |
| 76 | 76 | 01.07. | 182 | 80 |
| 77 | 77 | 02.07. | 183 | 80 |
| 78 | 78 | 03.07. | 184 | 80 |
| 79 | 79 | 04.07. | 185 | 80 |
| 80 | 80 | 05.07. | 186 | 80 |
| 81 | 81 | 06.07. | 187 | 80 |
| 82 | 82 | 07.07. | 188 | 80 |
| 83 | 83 | 08.07. | 189 | 80 |
| 84 | 84 | 09.07. | 190 | 80 |
| 85 | 85 | 10.07. | 191 | 80 |
| 86 | 86 | 11.07. | 192 | 80 |
| 87 | 87 | 12.07. | 193 | 80 |
| 88 | 88 | 13.07. | 194 | 80 |
| 89 | 89 | 14.07. | 195 | 80 |
| 90 | 90 | 15.07. | 196 | 0 |
| 91 | 97 | 22.07. | 203 | 0 |
| 92 | 97 | 22.07. | 203 | 0 |
| 93 | 97 | 22.07. | 203 | 0 |
| 94 | 97 | 22.07. | 203 | 0 |
| 95 | 97 | 22.07. | 203 | 0 |
| 96 | 97 | 22.07. | 203 | 0 |
| 97 | 97 | 22.07. | 203 | 0 |
| 98 | 99 | 24.07. | 205 | 0 |
| 99 | 99 | 24.07. | 205 | 0 |
No leap years.
To establish the link in SWASH, a database (BBCH.out file) with all possible combinations of crop, location, BBCH stage and corresponding dates has been created.
Appendix H – Reinterpretation and implementation of the pesticide application timing routines in the current and in the new FOCUS surface water setup
H.1. Current FOCUS PAT
Initially, the pre‐set criteria in FOCUS (2001) state that there should be: (i) at least 10 mm of total rainfall in the 10 days following application; and (ii) at the same time, there should be less than 2 mm of rain each day in a 5‐day period, starting 2 days before application, extending to 2 days following the day of application. The PAT then steps through the ‘application window’ to find the first day that satisfies these requirements. For multiple applications, the procedure is carried out for each application, respecting the minimum interval specified between applications. Depending on the rainfall pattern in the application window defined by the user, it is possible that no application day exists that satisfies the criteria defined above. In this case, the criteria are relaxed and the procedure repeated until a solution is found, as follows:
The 5‐day period around the day of application is reduced first to a 3‐day period (1 day either side of the application day), and then if there is still no solution, to just the day of application.
If PAT still fails to find a solution, then the second criterion is relaxed, such that 10 mm of rain is required to fall in a 15‐day period following application, rather than 10 days.
If a solution is still not found (e.g. for dry periods, such that the total rainfall during the entire application window is less than 10 mm), then the minimum rainfall requirement (at least 10 mm) is reduced 1 mm at a time, to zero.
If PAT still fails to find a solution (this will be the case if the application window is very wet, with more than 2 mm of rain every day), then the amount of rain allowed on the day of application (initially less than 2 mm) is increased 1 mm at a time, until a solution is found.
If multiple applications occur within the application window, it is important to ensure realistic representation of the GAP to prevent PAT from unnecessarily relaxing the precipitation rules and unnecessarily constraining application representation.
H.2. Reinterpretation of the current FOCUS PAT
As the rules stated above (particularly the last bullet point) leave some open questions, a reinterpretation of the rules has been made as follows. Applying the PAT rules to a single application sequence is a straightforward process. When multiple applications are involved, the situation gets much more complicated. It is not obvious how the relaxation of the rules is supposed to be performed. To follow the logic of the original date selection process (FOCUS, 2001), the following approach is proposed:
The application window and minimum interval between applications are always followed.
Evaluation is performed separately for every year (concerns multiyear calculations).
All applications of the sequence should be (if needed) treated stepwise with the current relaxed rule. Only if the rule cannot be met for the whole application sequence move to the next level of relaxation.
Setting relaxed rule for a given application implicitly means that this relaxed rule is used for all following applications (e.g. if already the 2nd application of four application sequence fails).
The individual sets of rules in the current FOCUS PAT at each relaxation step are provided in the following list:
maximum 2 mm rainfall in 5 day period around application, minimum 10 mm rainfall in 10 days following application;
maximum 2 mm rainfall in 3 day period around application, minimum 10 mm rainfall in 10 days following application;
maximum 2 mm rainfall on day of application, minimum 10 mm rainfall in 10 days following application;
maximum 2 mm rainfall on day of application, minimum 10 mm rainfall in 15 days following application;
maximum 2 mm rainfall on day of application, minimum 9 mm rainfall in 15 days following application;
maximum 2 mm rainfall on day of application, minimum 8 mm rainfall in 15 days following application;
maximum 2 mm rainfall on day of application, minimum 7 mm rainfall in 15 days following application;
maximum 2 mm rainfall on day of application, minimum 6 mm rainfall in 15 days following application;
maximum 2 mm rainfall on day of application, minimum 5 mm rainfall in 15 days following application;
maximum 2 mm rainfall on day of application, minimum 4 mm rainfall in 15 days following application;
maximum 2 mm rainfall on day of application, minimum 3 mm rainfall in 15 days following application;
maximum 2 mm rainfall on day of application, minimum 2 mm rainfall in 15 days following application;
maximum 2 mm rainfall on day of application, minimum 1 mm rainfall in 15 days following application;
maximum 2 mm rainfall on day of application, 0 mm rainfall in 15 days following application;
maximum 3 mm rainfall on day of application, 0 mm rainfall in 15 days following application;
…and so forth, until a solution found.
H.3. Implementation of the revised PAT
Following the reinterpretation of the original FOCUS rules as stated above, the PAT routines have been implemented in a new set of tools. Firstly, there is a stand‐alone tool ‘PATExe.exe’. This tool uses two dynamic link libraries: PATCommon.dll and PATCalc.dll. These two .dll are used by PRZM and MACRO to embed the new implementation of the PAT in the respective tool. PATCalc.dll implements the actual PAT routines.
The initial setting of the rainfall criteria and the length of the application window (extension period) are provided as comma separated values in a text file called ‘rules.txt’. The following criteria are accounted for:
minimum total rainfall (mm) after application (MinRainAftAppln);
number of days to account for minimum total rainfall after the day of application (CorrPeriod1);
maximum daily rainfall (mm) on days before the day of application (MaxRainBefAppln);
number of days to account for maximum daily rainfall before and after the day of application (CorrPeriod2);
maximum rainfall (mm) at the day of application (MaxRainAtAppln);
maximum daily rainfall (mm) on days after the day of application (MaxRainAftAppln);
number of days before the first intended application date to define the start of the application window (extension period) (ExtBeforeIntFirstAppln);
number of days after the last intended application date to define the end of the application window (extension period) (ExtAfterIntLastAppln).
Table H.1 gives the parameter setting in the rules.txt file for the current FOCUS PAT and the revised PAT with a significantly shorter extension period. Note that in the current FOCUS PAT setup, there is no ‘intended application date’. However, based on the default setting of the application window in the current SWASH tool (± 15 days around emergence), the extension period in the current FOCUS PAT may be interpreted in this way.
Table H.1.
Parameter setting in the rules.txt file for the current FOCUS PAT and the revised new 7‐day PAT
| Rule | Current FOCUS PAT | Revised PAT |
|---|---|---|
| MinRainAftAppln | 10 | 0 |
| CorrPeriod1 | 10 | 0 |
| MaxRainBefAppln | 2 | 2 |
| CorrPeriod2 | 2 | 2 |
| MaxRainAtAppln | 2 | 2 |
| MaxRainAftAppln | 2 | 2 |
| ExtBeforeIntFirstAppln | 15 | 3 |
| ExtAfterIntLastAppln | 15 | 3 |
Two log files are also produced: (i) PATExe.log; and (ii) PATruns.log. PATExe.log contains general information and the PATruns.log contains details for each PAT run specified in the input file (input, relaxation of rules, application dates found).
H.3.1. Handling of leap years
Tool testing during development of the new version revealed some situations in which there were time window anomalies associated with applications in leap years. These anomalies arose as the date windows for PAT operation are defined by SWASH with a generic assumption of a non‐leap year at input. As a consequence of this, small inconsistencies may arise in the translation of the application time windows in SWASH into specific beginning and end dates in PAT. These anomalies are documented below considering two date format options that may be presented by SWASH in future software releases (note; current date formats delivered by SWASH to MACRO and PRZM assume Julian dates):
-
1
Application window straddling end of February in leap years
In the event that SWASH is redesigned to deliver calendar dates instead of Julian dates, there is the possibility of an anomaly in which application dates straddle the end of February in leap years. In cases in which the application window includes the end of February, an application window defined by SWASH will include 1 additional day in a leap year.
-
2
Consistency of calendar dates for application window
Calendar dates defining the start and the end of the application window will differ between leap years and non‐leap years if these are placed after the end of February. In leap years, the calendar dates for the window are set 1 day earlier.
-
3
Application window straddling the end of the year in a leap year
In cases in which the application window includes the end of the year in a leap year, an application window defined by SWASH will include one additional day.
These anomalies are noted as constraints of the current FOCUS sw framework. Adjustment to compensate for these anomalies is not considered necessary. This behaviour has been a characteristic of the FOCUS sw framework since its implementation and it is recognised that it may be much more effectively and efficiently revisited in the current FOCUS sw ‘repair’ efforts aimed at developing support for multiyear simulations.
H.3.2. Operation within weather data constraints
The weather data files provided for each of the revised FOCUS surface water scenarios are constrained to a limited range of specific weather years (i.e. 26 years including the warming‐up period). If the application window starts at 1 January, or closely afterwards, the PAT tool will require access to 2 days of preceding weather data to compare with PAT rules on antecedent rainfall conditions. In the first simulated year, this lies outside the available weather data and, so, for this year alone, the operational application window is adjusted forward by 2 days to ensure processing. It is noted that this only affects the first warming‐up year. For application windows that extend beyond the end of the weather data file, weather data are recycled from the beginning of the weather data file.
Appendix I – In‐depth analysis of the new 20‐year assessment approach in relation to the intended application date including different options for the pesticide application timing
I.1. Introduction
This appendix is intended to summarise an extensive modelling exercise performed based on the new 20‐year assessment approach to address the following issues:
PAT (impact of different PAT options)
day‐to‐day variability in PECs (here PECsw) in relation to the application date
overall robustness of the new 20‐year assessment approach because of different percentiles
consistency of the tiered approach (FOCUS sw STEP 1 to 3)
comparison of the current FOCUS system with the new 20‐year assessment approach.
An advanced modelling exercise was performed based on the new 20‐year assessment approach, calculating day‐to‐day PECs in surface water (PECsw) for all 10 FOCUS sw scenarios for a set of dummy substances (Table G.2). As this appendix is focused on drainage and run‐off events, drift is entirely excluded in all these calculations. Furthermore, calculations are made for a single application only. Results are given for the water phase for streams and ditches. Overall, this setting is considered to represent the worst case to investigate the day‐to‐day variability in PECsw and the overall robustness of the new 20‐year assessment approach with respect to drainage and run‐off.
The entire appendix is based on one concise data set, which was processed further or set into context with other data if needed to address individual issues stated above.
I.2. Methodology
Based on the new 20‐year assessment period, PECsw were calculated for each individual application date in a year, so from 1 January to 31 December. To do so, different approaches have been used for the drainage and run‐off scenarios.
For the drainage scenarios, input files for MACRO and TOXSWA were prepared for each scenario/substance combination through SPIN and SWASH, with the latest versions available in the FOCUS Surface Water Repair WG at that time (i.e. SWASH 6.4, SPIN 2.2, MACRO 5.5.4, TOXSWA 6.6.4). In SWASH, a BBCH 00–09 was selected, so setting crop interception to zero. Using an R‐based tool, the .par file was reproduced 365 times with a single application from 1 January to 31 December in each of the 26 assessment years (including a 6‐year warming‐up period). Next, a batch file was created for all the 365 .par files and these were run on cluster computers using the exeparfile.exe executable along with the external switches, external parameters and irrigation parameter .txt files. Next, respective MACRO output files (.m2t) were created using m2t.exe executable creating a batch file. Using a Python‐based tool, the TOXSWA input file (.txw) was reproduced 365 times for each substance/crop/scenario combination setting drift to zero. The tool also connects each .txw input file to its respective .m2t file. Next, a batch file was created for all the 365 .txw files and these were run on cluster computers using the TOXSWA_3.3.7R.exe executable along with the required weather files. The results from the TOXSWA .sum files were processed using R. Further processing was performed using Microsoft® Excel. For a substance/crop/scenario combination, about 3 working days are needed (including post processing).
For the run‐off scenarios, a single representative set of input files for PRZM was prepared for each substance/crop/scenario combination through SPIN and SWASH, with the versions currently available in the FOCUS sw model suite (i.e. SWASH 5.3, SPIN 3.3, PRZM 4.3.1 (= 4.63, April 2015)). Note that the current FOCUS version of PRZM already accounts for the entire 20‐year assessment period. As dummy substances used in this exercise have short DegT50 of 3 and 30 days only, the absence of the 6‐year warming‐up period, implemented in the final version of the new PRZM version, is considered negligible. Note that only non‐irrigated crops have been taken into account in this modelling exercise, so there was no need for an updated PRZM version with the internal irrigation routine switched on. To exclude crop interception, soil incorporation (CAM 1 – appl. soil linear, depth incorporated = 4.0 cm) was selected in PRZM. In contrast with the drainage scenarios, TOXSWA has been replaced by a TOXSWA stream meta model (see below), which is considered sufficiently in agreement with TOXSWA for PECsw calculated in the water phase of streams. Using Visual Basic for Applications (VBA) in MS Excel, a framework was created making it possible to run the modified PRZM input files and to further process the PRZM output (.zts) file with the TOXSWA stream meta model. This was performed fully automatised for each application date in a year. Drift exposure was excluded for the run‐off evaluations analogous to drainage. In contrast with the approach used for the drainage calculation, which is based on the complete FOCUS model suite, processing times for this modelling setup were considerably faster (less than an hour for each substance/crop/scenario combination).
Applying the methodologies stated above, day‐to‐day PECsw have been calculated for dummy substance A in all FOCUS sw scenarios (always winter cereals with the exception of potatoes in R2). For two of the scenarios (D2‐ditch, R2‐stream), day‐to‐day PECsw have also been calculated for dummy substances B, C, D, E and F (see Table I.1). Application was consistently set to 1 kg/ha (single application only).
Table I.1.
Properties of dummy substances A, B, C, D, E and F used in the example runs. Substance properties were taken from FOCUS (2001)
| Substance property | Dummy substance | |||||
|---|---|---|---|---|---|---|
| A | B | C | D | E | F | |
| Molar mass (g/mol) | 300 | |||||
| Vapour pressure (Pa at 20°C) | 1.0 × 10⁻⁷ | |||||
| Water solubility (mg/L at 20°C) | 1.0 | |||||
| Koc (mL/g) | 10 | 100 | 1,000 | 10 | 100 | 1,000 |
| Kom (mL/g) | 5.8 | 58 | 580 | 5.8 | 58 | 580 |
| Freundlich exponent (1/n) (−) | 1 | |||||
| DegT50 soil (day) | 3 | 3 | 3 | 30 | 30 | 30 |
| DegT50 water (day) | 1 | 1 | 1 | 10 | 10 | 10 |
| DegT50 sediment (day) | 3 | 3 | 3 | 30 | 30 | 30 |
| DegT50 total system (day) | 1 | 1 | 2 | 10 | 12 | 22 |
| DegT50 crop (day) | 10 | |||||
| Wash‐off coefficient (cm−1) | 1 | |||||
| ffect of temperature on transformation in soil (MACRO) | 0.0948 | |||||
| Exponent for the effect of moisture content on transformation rate in soil (−) | 0.49 (MACRO)/0.7 (PRZM) | |||||
| Q10 | 2.58 | |||||
| Plant uptake | 0 | |||||
To address the impact of different PAT options, the new stand‐alone PAT tool has been used (see Appendix H). Applying different rules for rainfall around application, rainfall after application and the extension period (which defines the application window, see Table H.1), different sets of PAT results have been created for each scenario. Each of these data sets consists of a column listing the intended application dates (from 1 January to 31 December) followed by columns listing the actual application dates for each of the 20 assessment year according to the PAT rules. Based on these data sets, day‐to‐day results obtained without PAT (as stated above) have been rearranged to give day‐to‐day results that are obtained if the PAT would already have been implemented in the calculation procedure stated above. Note that this post‐processing procedure is only valid for single applications for substances with a short DegT50 (so, applications in different years are independent from each other).
To stay close to the intended application date, the application window (represented by the so‐called extension period in the new PAT) starts 3, 7 or 15 days before the intended application date and ends 3, 7 or 15 days after the intended application date, which finally gives an application window of 7, 15 or 31 days, respectively.
As discussed more in detail in Section 3.2 (Review of pesticide application timing), the 10‐mm rainfall criterion in the current PAT was excluded for the 7, 15 or 31‐day application window. No changes have been made to the relaxing rules of the initial 2‐mm rainfall criterion at 5 days around the application (see Appendix H).
Note that for the current FOCUS PAT, there is neither an intended application date nor an extension period. However, based on the default setting of the application window in the current FOCUS SWASH software tool (i.e. one single application with the application window starting 15 days before ‘emergence’), the application window of the current FOCUS PAT can be interpreted as an extension period of ± 15 days around the intended application date.
The following PAT rules have been investigated (Table I.2) (for more detailed information on PAT rules also refer to Appendix H).
Table I.2.
Different PAT rules applied in this modelling exercise
| Rule | 7‐day application window | 15‐day application window | 31‐day application window | Current FOCUS PAT |
|---|---|---|---|---|
| Minimum rainfall after application | 0 | 0 | 0 | 10 |
| CorrPeriod1 | 0 | 0 | 0 | 10 |
| Maximum rainfall before application | 2 | 2 | 2 | 2 |
| CorrPeriod2 | 2 | 2 | 2 | 2 |
| Maximum rainfall at application | 2 | 2 | 2 | 2 |
| Maximum rainfall after application | 2 | 2 | 2 | 2 |
| Extension period before first intended application | 3 | 7 | 15 | 15 |
| Extension period after last intended application | 3 | 7 | 15 | 15 |
To set PECs obtained with the new 20‐year assessment period in context with the current FOCUS approach, single‐year data obtained with the current FOCUS PAT were extracted from the data set and compared with different temporal percentile PECsw based on all 20 years. According to FOCUS (2001), results in the current assessment are based on 1982, 1986, 1992, 1985, 1978 and 1986 for the drainage scenarios D1, D2, D3, D4, D5 and D6, respectively. For the run‐off scenarios, results are actually based on three different years depending on the application timing. These are 1984, 1978 and 1978 for R1, 1977, 1989 and 1977 for R2, 1980, 1975 and 1980 for R3 and 1984, 1985 and 1979 for R4, for applications in spring (March–May), summer (June–September) and autumn (October–February), respectively (FOCUS, 2001). Note that the selection of the year in the run‐off scenarios depends on the actual application date selected by the PAT. For this modelling exercise, the selection of the year is based on the intended application date. Overall, this deviation is considered of minor importance. Note that in this modelling exercise, results for the current FOCUS approach have indeed not been obtained based on the original FOCUS model suite, but are based on post processing of 20‐year data as stated above. Results obtained in this way are considered sufficiently in line with results obtained based on the current FOCUS model suite.
To allow a comparison of the results obtained with the current FOCUS sw Step 1 and Step 2 calculations, additional calculations have been made with the FOCUS sw Steps 1 and 2 model framework (Steps 1 and 2 in FOCUS, v.3.2) with crop type set to ‘no drift (incorp or seed trtmt)’ and crop interception set to ‘no interception’.
I.2.1. TOXSWA stream meta model used for the run‐off scenarios (Equation I1 in Adriaanse et al., 2017)
Daily PECsw were calculated based on daily run‐off fluxes (mg/m2 per day) and daily run‐off volumes (mm/day) provided in the *.zts file applying Equation I1 in Adriaanse et al. (2017) as given below:
| (I1) |
with
cstream = approximate mass concentration in the water phase at the end of the FOCUS stream, i.e. at × = 100 m (μg/L);
malltreatedfields = pesticide mass in run‐off from the adjacent field plus the treated fields in the upstream catchment (mg/h);
Qup+adjfield = discharge delivered by the 100‐ha upstream catchment plus the 1‐ha adjacent field (m3/h);
qro,PRZM = aeric volume flux of run‐off water flux as calculated by PRZM (mm/h);
cro,PRZM = mass concentration in the run‐off water, calculated by PRZM (mg/m2/h);
qdown,PRZM = downward monthly averaged aeric volume flux of water at 1 m soil depth as calculated by PRZM (mm/h);
Qbase = 8, 11.7, 3.2 and 8.0 m3/h for R1, R2, R3 and R4, respectively;
Fup,tr = 0.2;
Aup = 100 ha;
Aadjfield = 1 ha.
Additional water flow into the stream by infiltration was ignored in this calculation (assuming qdown,PRZM to be zero) as Fper (size 0.03 up to 0.1) × infiltration flux (mm/day), i.e. the fraction of (uncontaminated) water flux at 1 m depth that is drained directly into the stream times the infiltration flux, generally is an order of magnitude lower than the base flow, except for some winter months.
To calculate hourly run‐off volumes (qro,PRZM) and run‐off fluxes (cro,PRZM) needed for the meta model, daily run‐off volumes and run‐off fluxes provided in the .zts file have been divided by the rainfall duration in analogy to the approach made in FOCUS (2001) to generate hourly data for the PRZM‐to‐TOXSWA file (.p2t). Depending on the rainfall (mm), rainfall duration (mm/h) is defined as follows:
if rainfall ≤ 2 mm, rainfall duration (h) = 1;
if 2 < rainfall ≤ 48 mm, rainfall duration (h) = (rainfall (mm)/2) rounded to integer number;
if rainfall > 48 mm, rainfall duration (h) = 24.
I.3. Pesticide application timing in the framework of the new 20‐year assessment period
Figure I.1 shows the maximum (97.5th) temporal percentile PECsw for a substance that is sensitive to the rainfall pattern (dummy substance A) and a substance that is less sensitive to the rainfall pattern (dummy substance F) in the drainage scenario D2‐ditch (winter cereals, 1 × 1 kg/ha, application to the crop canopy, no drift). Data are given without a PAT (No PAT) and with a 7‐day application window, depending on the intended application date. Without PAT, exaggerated PECsw can be observed for substances that are sensitive to the rainfall pattern (dummy substance A). These exaggerated drainage events may occur if rainfall on the day of application exceeds 18 mm. Note that on these days, application actually occurs during rainfall (in MACRO rainfall starts at 0.00 with a rainfall intensity set to 2 mm/h, whereas application takes place at 9.00). These unrealistic high drainage events can be effectively excluded applying a 7‐day application window. This is true for all drainage scenarios with the exception of a short time period around the 5 December in D4 (Figure I.2). Extending the application window to 15 or 31 days leads to a systematic reduction in the overall level of PECsw at all percentiles (Figure I.3). For less rainfall sensitive substances (dummy substance F), no exaggerated drainage events occur even on days with rainfall above 18 mm. The impact of the length of the application window is generally low for this type of substances (Figure I.4).
Figure I.1.
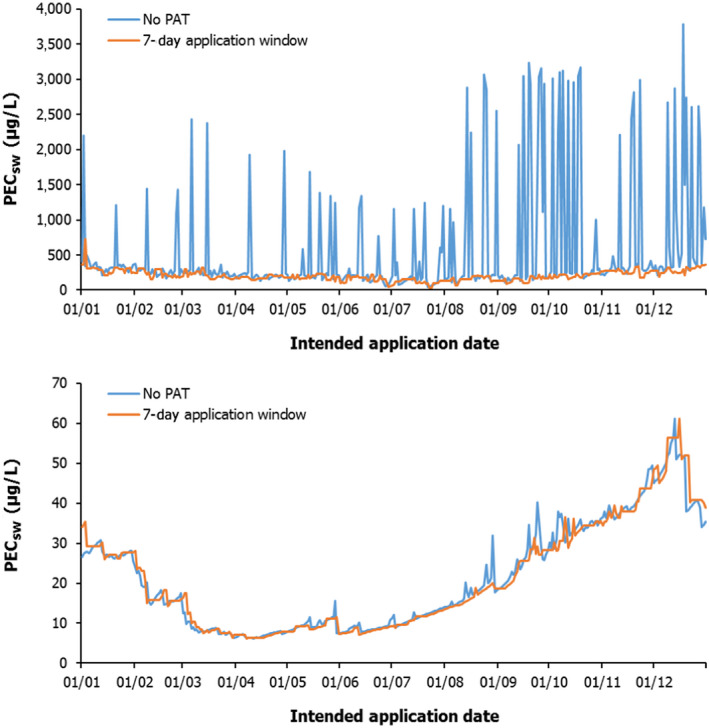
Maximum (97.5th percentile) PEC sw (μg/L) for dummy substance A (top) and dummy substance F (bottom) in the FOCUS surface water scenarios D2 (ditch) (top) without (No PAT) and with a 7‐day application window in relation to the intended application date (1 × 1 kg/ha, winter cereals, application to soil surface, drainage only, no drift)
Figure I.2.
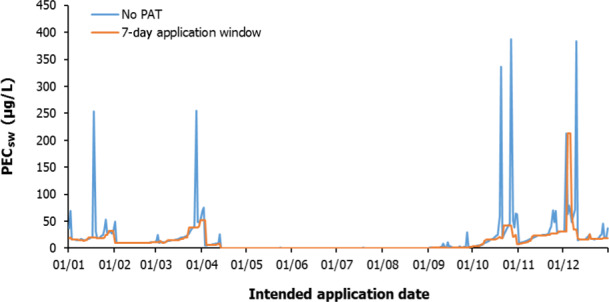
Maximum (97.5th percentile) PEC sw (μg/L) for dummy substance A in the FOCUS surface water scenario D4 (stream) without (No PAT) and with a 7‐day application window in relation to the intended application date (1 × 1 kg/ha, winter cereals, application to soil surface, drainage only, no drift)
Figure I.3.
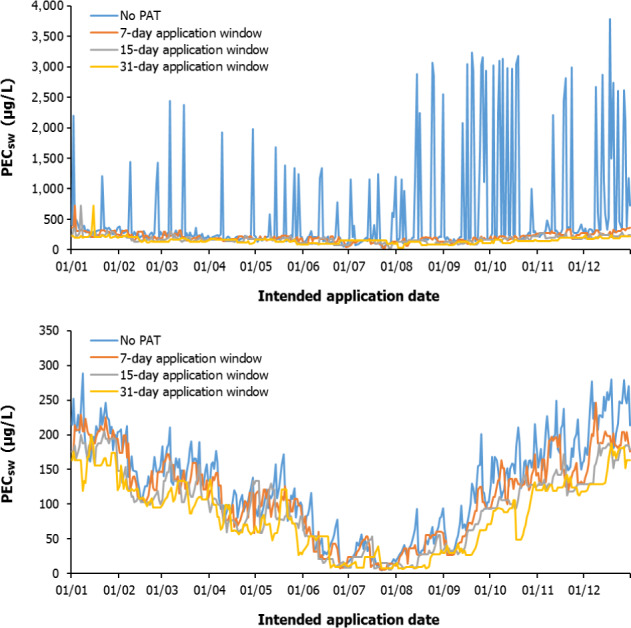
Maximum (97.5th percentile) (top) and 77.5th percentile (bottom) PEC sw (μg/L) for dummy substance A in the FOCUS surface water scenario D2 (ditch) without (No PAT) and with a 7‐day, 15‐day and 31‐day application window in relation to the intended application date (1 × 1 kg/ha, winter cereals, application to soil surface, drainage only, no drift)
Figure I.4.
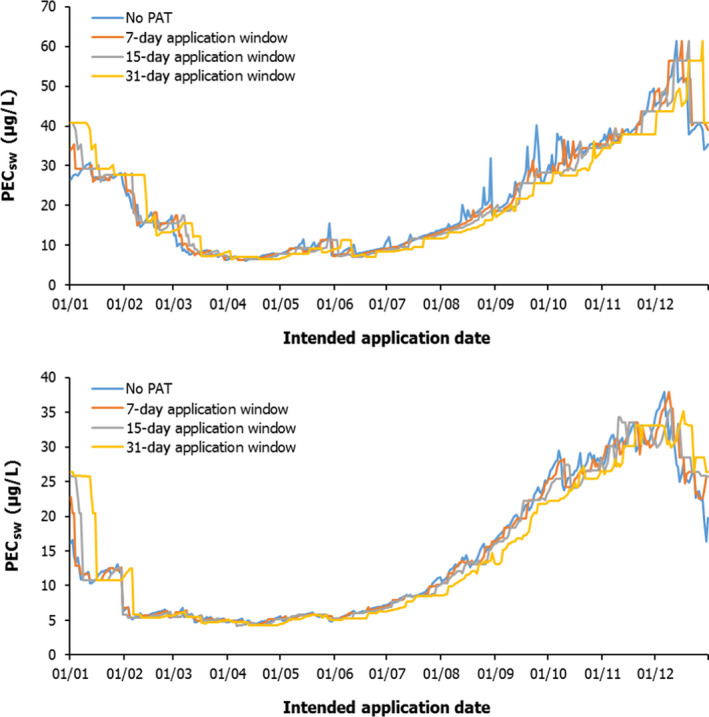
Maximum (97.5th percentile) (top) and 77.5th percentile (bottom) PEC sw (μg/L) for dummy substance F in the FOCUS surface water scenario D2 (ditch) without (No PAT) and with a 7‐day, 15‐day and 31‐day application window in relation to the intended application date (1 × 1 kg/ha, winter cereals, application to soil surface, drainage only, no drift)
Figure I.5 shows the 97.5th (maximum) and 77.5th temporal percentile PECsw for a substance that is sensitive to the rainfall pattern (dummy substance A) in the run‐off scenario R2 (potatoes, 1 × 1 kg/ha, application to the soil surface, no drift), without PAT and with a 7‐, 15‐ or 31‐day application window. Maximum (97.5th percentile) PECsw for run‐off scenarios without PAT are usually characterised by a kind of plateau depending on the RCN for the given development stage (highest run‐off in bare soil). Note that PRZM is based on a daily resolution so there are no exaggerated PECsw that may occur in the drainage scenarios when rainfall on day of application exceeds 18 mm. Applying a 7‐day application window effectively reduces the overall maximum PECsw. There are only a few isolated time periods when the 7‐day application window appears not to effectively exclude worst‐case run‐off events observed without PAT. This behaviour is true for all run‐off scenarios. Similar to the drainage scenarios, extending the application window further systematically decreases the overall level of PECs obtained at all temporal percentiles. In line with observations made for the drainage scenarios, substances that are less sensitive to the rainfall pattern (dummy substance F) are hardly affected by the selection of the application window (Figure I.6).
Figure I.6.
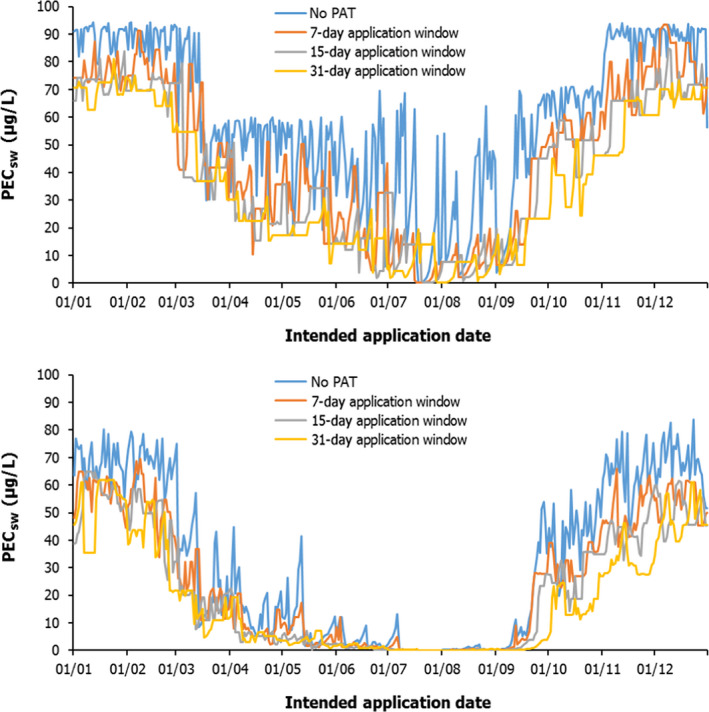
Maximum (97.5th percentile) (top) and 77.5th percentile (bottom) PEC sw (μg/L) for dummy substance A in the FOCUS surface water scenario R2 (stream) without (No PAT) and with a 7‐day, 15‐day and 31‐day application window in relation to the targeted application date (1 × 1 kg/ha, potatoes, application to soil surface, run‐off only, no drift, TOXSWA stream meta model)
Figure I.7.
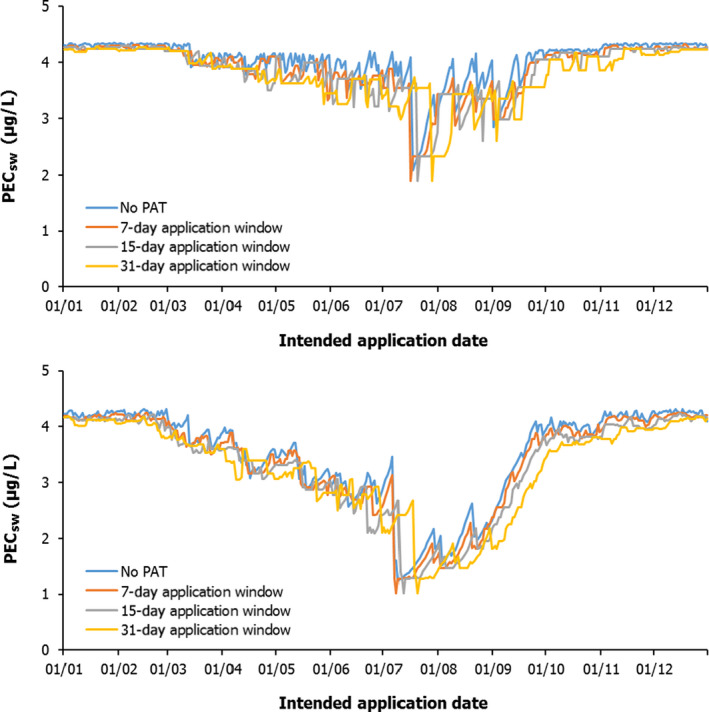
Maximum (97.5th percentile) (top) and 77.5th percentile (bottom) PEC sw (μg/L) for dummy substance F in the FOCUS surface water scenario R2 (stream) without (No PAT) and with a 7‐day, 15‐day and 31‐day application window in relation to the targeted application date (1 × 1 kg/ha, potatoes, application to soil surface, run‐off only, no drift, TOXSWA stream meta model)
Based on monthly average PECsw, e.g. obtained at the 77.5th temporal percentile, an application window of 7 days reduces PECsw, obtained without a PAT, by a factor of approx. 1.5 whereas an application window of 31 days reduces no‐PAT PECsw already by a factor of approx. 2.6 (Table I.3). Note that the impact of the length of the application window strongly depends on the application timing with highest reductions in PECsw usually observed in periods with less rainfall (summer).
Table I.3.
Monthly average PECsw values (μg/L, 77.5th temporal percentile) for dummy substances A and F in the drainage scenario D2 and in the run‐off scenario R2 in relation to the indented application date (D2: winter cereals, R2: potatoes, 1 × 1 kg/ha to the soil surface, drainage or run‐off only, no drift, TOXSWA stream meta model for R2)
| Scenario | Dummy substance | Application window | Jan | Feb | Mar | Apr | May | Jun | Jul | Aug | Sep | Oct | Nov | Dec |
|---|---|---|---|---|---|---|---|---|---|---|---|---|---|---|
| D2‐ditch | A | No PAT | 209 | 152 | 156 | 113 | 109 | 46 | 24 | 48 | 86 | 154 | 184 | 231 |
| 7 days | 201 | 138 | 142 | 99 | 104 | 35 | 23 | 40 | 66 | 131 | 155 | 188 | ||
| 15 days | 184 | 115 | 125 | 86 | 90 | 29 | 21 | 23 | 56 | 112 | 132 | 165 | ||
| 31 days | 161 | 113 | 112 | 77 | 72 | 33 | 16 | 15 | 41 | 87 | 124 | 149 | ||
| F | No PAT | 12 | 5.9 | 5.4 | 4.9 | 5.5 | 6.2 | 8.8 | 14 | 21 | 27 | 31 | 28 | |
| 7 days | 13 | 5.8 | 5.4 | 4.8 | 5.6 | 6.1 | 8.6 | 13 | 20 | 26 | 31 | 29 | ||
| 15 days | 14 | 5.6 | 5.4 | 4.6 | 5.6 | 5.9 | 8.4 | 13 | 20 | 26 | 32 | 30 | ||
| 31 days | 18 | 6.7 | 5.2 | 4.5 | 5.3 | 5.6 | 7.7 | 11 | 18 | 24 | 30 | 31 | ||
| R2‐stream | A | No PAT | 68 | 69 | 29 | 15 | 10 | 3.8 | 1.3 | 0.5 | 15 | 42 | 65 | 67 |
| 7 days | 58 | 54 | 22 | 9.0 | 6.0 | 2.0 | 0.5 | 0.2 | 10 | 32 | 50 | 54 | ||
| 15 days | 56 | 48 | 18 | 6.5 | 3.2 | 1.0 | 0.09 | 0.2 | 6.1 | 28 | 43 | 51 | ||
| 31 days | 52 | 41 | 14 | 7.4 | 3.4 | 1.4 | 0.1 | 0.1 | 0.9 | 17 | 31 | 48 | ||
| F | No PAT | 4.2 | 4.2 | 3.9 | 3.5 | 3.3 | 2.9 | 1.9 | 2.0 | 3.4 | 4.0 | 4.2 | 4.3 | |
| 7 days | 4.2 | 4.2 | 3.8 | 3.4 | 3.2 | 2.8 | 1.7 | 1.9 | 3.2 | 3.9 | 4.1 | 4.2 | ||
| 15 days | 4.1 | 4.1 | 3.7 | 3.4 | 3.1 | 2.6 | 1.7 | 1.8 | 3.0 | 3.8 | 4.0 | 4.2 | ||
| 31 days | 4.1 | 4.0 | 3.7 | 3.3 | 3.1 | 2.8 | 1.9 | 1.7 | 2.6 | 3.7 | 3.9 | 4.1 |
The selection of the application window also affects the day‐to‐day variability in PECsw depending on the intended application date. A low day‐to‐day variability in PECsw increases the robustness of the exposure assessment as results are less dependent on the intended application date. To reflect the day‐to‐day variability, a variability score (VS) is introduced here giving the ratio of the maximum/minimum PECsw observed within a 7‐day period around the intended application date. Table I.4 gives calculated annual median VSs for dummy substances A and F in all 10 FOCUS sw scenarios (results for dummy substance F only for D2 and R2) based on the 77.5th temporal percentile PECsw. An annual median VS of, e.g. 1.4 indicates that shifting the intended application date within a 7‐day period, ratios in maximum/minimum PECsw obtained for these 7‐day periods are at maximum 1.4 for half of all possible 7‐day periods in a year, for the other half of the 7‐day periods in a year ratios in maximum/minimum PECsw are above 1.4. As can be deduced from Table I.4, the day‐to‐day variability in PECsw strongly depends on the substance properties and the application window applied. For short‐living substances, the day‐to‐day variability (expressed in terms of the coefficient of variation (CV)) without a PAT is in the range from 1.5 to 2.9, whereas applying a 31‐day application window the day‐to‐day variability is reduced to 1.3–2.3, depending on the scenario. Overall, a 7‐day application window appears to be approx. half effective as a 31‐day application window, considerably reducing the day‐to‐day variability in PECsw compared to the no‐PAT situation. Note that for substances that are less sensitive to the rainfall pattern (dummy substance F), the day‐to‐day variability is low at all (CV ~ 1.1) with minimal impact of the length of the application window.
Table I.4.
Annual median variability score (–) of dummy substance A and F in the drainage scenarios D1, D2, D3, D4, D5 and D6, and in the run‐off scenarios R1, R2, R3 and R4, based on the 77.5th temporal percentile PECsw (D2: winter cereals, R2: potatoes, 1 × 1 kg/ha to the soil surface, drainage or run‐off only, no drift, TOXSWA stream meta model for R2)
| Scenario | Dummy substance | No PAT | 7‐day application window | 15‐day application window | 31‐day application window |
|---|---|---|---|---|---|
| D1‐ditch | A | 1.43 | 1.30 | 1.28 | 1.25 |
| D2‐ditch | 1.56 | 1.38 | 1.31 | 1.31 | |
| D3‐ditch | 1.43 | 1.34 | 1.34 | 1.28 | |
| D4‐stream | 1.88 | 1.71 | 1.55 | 1.51 | |
| D5‐stream | 2.23 | 2.00 | 1.81 | 1.68 | |
| D6‐ditch | 2.16 | 1.80 | 1.44 | 1.38 | |
| D2‐ditch | F | 1.12 | 1.09 | 1.09 | 1.07 |
| R1‐stream | A | 2.87 | 2.06 | 1.76 | 1.49 |
| R2‐stream | 2.44 | 1.93 | 1.87 | 1.91 | |
| R3‐stream | 2.81 | 2.29 | 2.04 | 2.18 | |
| R4‐stream | 2.48 | 2.26 | 2.34 | 2.27 | |
| R2‐stream | F | 1.07 | 1.05 | 1.05 | 1.04 |
Because of these results, the FOCUS Surface Water Repair WG considers a 7‐day application window for a single application a reasonable compromise: (i) allowing a limited number of applications on less favourable days, (ii) excluding extreme run‐off/drainage events (no application on rainy days), (iii) reducing the day‐to‐day variability in PECs with respect to application timing and (iv) respecting the intended GAP (BBCH stage) as far as possible.
Note that these calculations are based on single applications only, which are considered to represent the worst case in respect to day‐to‐day variably. Multiple applications will, overall, lead to a decrease in the day‐to‐day variability as the likelihood for run‐off or drainage events will increase.
I.4. Overall robustness of the 20‐year assessment because of different temporal percentiles
Figures I.7 and I.8 show PECsw for dummy substance A and F in the drainage scenario D2 and in the run‐off scenario R2 obtained based on the 20‐year assessment period at different temporal percentiles (47.5th to the 97.5th), applying the proposed 7‐day application window. There is still some variability in PECsw related to the application timing, with decreasing variability observed at lower temporal percentiles. However, the situation has been much improved compared with the current system (refer to the next section).
Figure I.7.
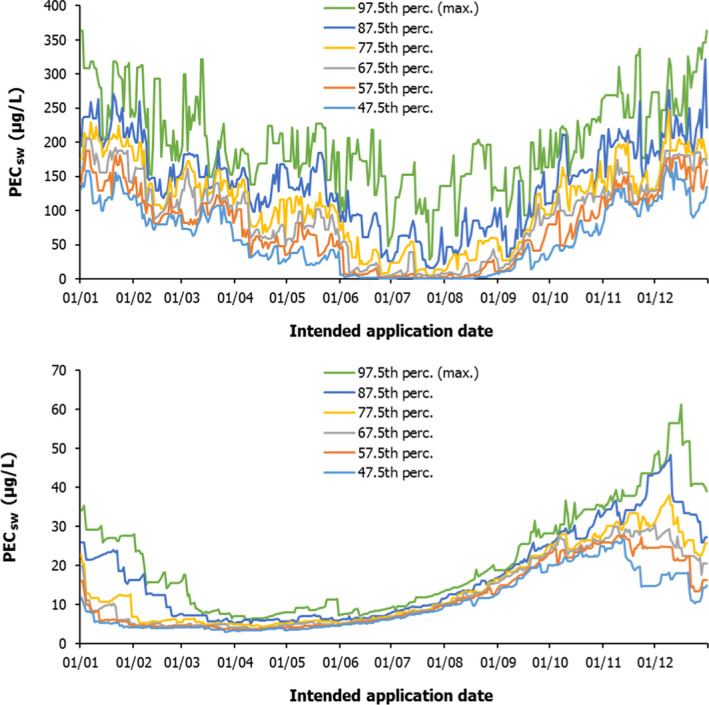
PEC sw (μg/L) for dummy substance A (top) and dummy substance F (bottom) in the drainage scenario D2 (ditch) at different temporal percentiles (47.5th to the 97.5th) in relation to the intended application date (1 × 1 kg/ha, winter cereals, application to soil surface, drainage only, no drift, 7‐day application window)
Figure I.8.
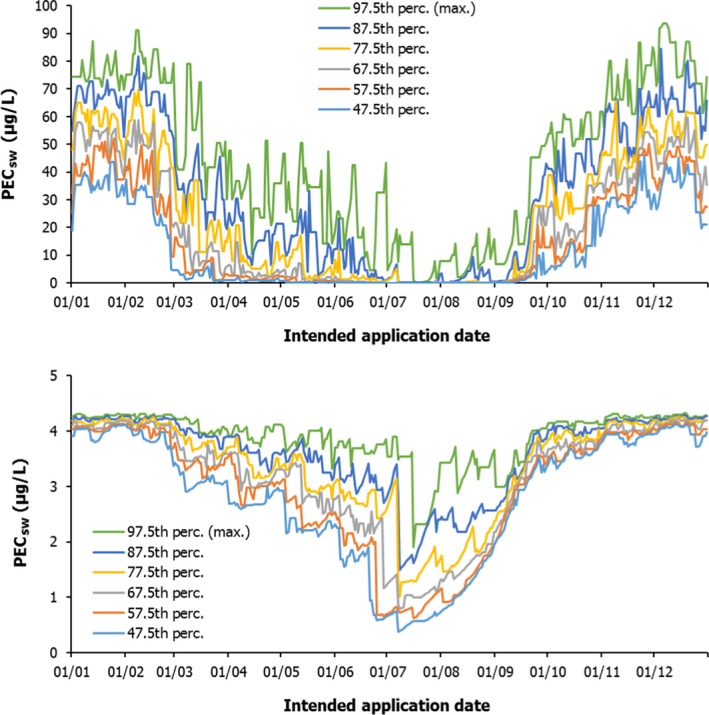
PEC sw (μg/L) for dummy substance A (top) and dummy substance F (bottom) in the run‐off scenario R2 (stream) at different temporal percentiles (47.5th to the 97.5th) in relation to the intended application date (1 × 1 kg/ha, potatoes, application to soil surface, run‐off only, no drift, 7‐day application window, TOXSWA stream meta model)
To allow a better overview of the results obtained for all substance/location combination calculated, monthly average data are discussed further. Tables I.5 and I.6 summarise 47.5th to 97.5th (maximum) temporal percentile PECsw (monthly average values) for the highly rainfall pattern sensitive dummy substance A in all drainage and run‐off scenarios following a single application of 1 kg/ha (to the soil surface, drainage or run‐off only, no drift). It is obvious that there is a distinct seasonality in PECsw in all scenarios with highest PECsw usually obtained following application in autumn, winter and spring. Seasonal differences increase with decreasing percentile. It is also obvious that PECsw for dummy substance A are quite different in the six drainage scenarios, whereas they are similar in the four run‐off scenarios. For the drainage scenarios, PECsw obtained for dummy substance A decrease in the order D1 ≈ D2 > D5 ≈ D6 > D4 > D3. At lower percentiles, average PECsw in D3, D4, D5 and D6 are frequently below 0.001 μg/L if application is from April to August, whereas average PECsw in D1 and D2 do not fall below 1 μg/L at all (at the 47.5th temporal percentile). Note that there is practically no drainage of dummy substance A in D6 from May to August (at all temporal percentiles). For less rainfall pattern sensitive substances (DegT50 = 30 days and above), seasonality in PECsw is much less pronounced, particularly at lower temporal percentiles.
Table I.5.
Monthly average PECsw values (μg/L) for dummy substance A in the drainage scenarios D1, D2, D3, D4, D5 and D6 in relation to the indented application date and the temporal percentile selected (all winter cereals, 1 × 1 kg/ha to the soil surface, 7‐day application window, drainage only, no drift)
| Scenario | Temporal percentile | Jan | Feb | Mar | Apr | May | Jun | Jul | Aug | Sep | Oct | Nov | Dec |
|---|---|---|---|---|---|---|---|---|---|---|---|---|---|
| D1‐ditch | 97.5th (max) | 193 | 203 | 206 | 149 | 121 | 98 | 71 | 67 | 112 | 172 | 225 | 225 |
| 87.5th | 138 | 156 | 152 | 103 | 59 | 48 | 17 | 24 | 75 | 122 | 175 | 182 | |
| 77.5th | 120 | 132 | 123 | 78 | 34 | 33 | 4.6 | 16 | 39 | 99 | 151 | 161 | |
| 67.5th | 108 | 120 | 104 | 61 | 18 | 13 | 1.8 | 6.7 | 28 | 82 | 130 | 144 | |
| 57.5th | 91 | 107 | 88 | 50 | 11 | 4.0 | 1.4 | 3.9 | 22 | 67 | 118 | 133 | |
| 47.5th | 80 | 98 | 80 | 40 | 3.6 | 2.3 | 1.1 | 3.2 | 17 | 57 | 105 | 112 | |
| D2‐ditch | 97.5th (max) | 288 | 231 | 211 | 181 | 185 | 153 | 114 | 156 | 146 | 207 | 259 | 284 |
| 87.5th | 228 | 162 | 160 | 134 | 139 | 75 | 44 | 66 | 90 | 158 | 193 | 220 | |
| 77.5th | 201 | 138 | 142 | 99 | 104 | 35 | 23 | 40 | 66 | 131 | 155 | 188 | |
| 67.5th | 175 | 121 | 121 | 78 | 79 | 18 | 10 | 17 | 54 | 110 | 134 | 172 | |
| 57.5th | 152 | 104 | 99 | 60 | 55 | 9.0 | 3.1 | 9.1 | 38 | 83 | 123 | 156 | |
| 47.5th | 128 | 89 | 85 | 39 | 32 | 2.6 | 0.9 | 2.3 | 25 | 59 | 111 | 129 | |
| D3‐ditch | 97.5th (max) | 2.5 | 0.6 | 0.09 | 8E‐03 | 0.02 | 9E‐03 | 0.01 | 0.09 | 0.3 | 0.9 | 2.5 | 4.5 |
| 87.5th | 1.0 | 0.2 | 0.04 | 3E‐03 | 4E‐03 | 3E‐03 | 6E‐03 | 0.05 | 0.1 | 0.6 | 1.2 | 2.3 | |
| 77.5th | 0.7 | 0.1 | 0.03 | 1E‐03 | 8E‐04 | 1E‐03 | 3E‐03 | 0.02 | 0.08 | 0.4 | 1.0 | 1.7 | |
| 67.5th | 0.6 | 0.07 | 0.02 | 5E‐04 | 6E‐04 | 6E‐04 | 2E‐03 | 0.01 | 0.05 | 0.3 | 0.9 | 1.3 | |
| 57.5th | 0.4 | 0.05 | 0.01 | 3E‐04 | 4E‐04 | 3E‐04 | 1E‐03 | 7E‐03 | 0.04 | 0.3 | 0.8 | 0.8 | |
| 47.5th | 0.2 | 0.04 | 8E‐03 | 2E‐04 | 2E‐04 | 2E‐04 | 7E‐04 | 4E‐03 | 0.03 | 0.2 | 0.7 | 0.6 | |
| D4‐stream | 97.5th (max) | 20 | 9.8 | 22 | 7.6 | 0.09 | 1E‐03 | 0.01 | 0.1 | 1.1 | 19 | 21 | 41 |
| 87.5th | 8.5 | 6.7 | 1.9 | 0.03 | 4E‐04 | 3E‐04 | 2E‐03 | 0.02 | 0.6 | 3.1 | 11 | 15 | |
| 77.5th | 5.4 | 1.3 | 0.3 | 7E‐03 | 2E‐04 | 2E‐04 | 1E‐03 | 0.01 | 0.2 | 1.4 | 5.8 | 7.8 | |
| 67.5th | 3.3 | 0.4 | 0.08 | 1E‐03 | 5E‐05 | 9E‐05 | 5E‐04 | 7E‐03 | 0.1 | 1.0 | 4.4 | 4.8 | |
| 57.5th | 1.2 | 0.1 | 0.05 | 4E‐04 | 3E‐05 | 6E‐05 | 3E‐04 | 4E‐03 | 0.08 | 0.8 | 3.6 | 3.3 | |
| 47.5th | 0.5 | 0.10 | 0.03 | 1E‐04 | 2E‐05 | 4E‐05 | 2E‐04 | 3E‐03 | 0.06 | 0.6 | 2.7 | 2.5 | |
| D5‐stream | 97.5th (max) | 59 | 61 | 34 | 12 | 5.0 | 5.4 | 2E‐03 | 0.3 | 14 | 33 | 44 | 60 |
| 87.5th | 26 | 28 | 6.9 | 0.5 | 0.04 | 4E‐05 | 6E‐05 | 3E‐03 | 0.8 | 11 | 15 | 29 | |
| 77.5th | 16 | 13 | 2.0 | 0.02 | 1E‐06 | 1E‐06 | 8E‐06 | 2E‐03 | 0.4 | 3.9 | 7.7 | 21 | |
| 67.5th | 12 | 7.6 | 0.6 | 2E‐05 | 1E‐06 | 1E‐06 | 4E‐06 | 7E‐04 | 0.2 | 1.7 | 4.5 | 15 | |
| 57.5th | 7.8 | 4.8 | 0.1 | 3E‐06 | 1E‐06 | 1E‐06 | 2E‐06 | 4E‐04 | 0.06 | 0.5 | 3.3 | 10 | |
| 47.5th | 5.1 | 2.2 | 2E‐04 | 1E‐06 | 1E‐06 | 1E‐06 | 1E‐06 | 8E‐05 | 0.02 | 0.3 | 2.3 | 7.0 | |
| D6‐ditch | 97.5th (max) | 70 | 61 | 28 | 0.8 | 1E‐06 | 1E‐06 | 1E‐06 | 3E‐06 | 0.01 | 11 | 50 | 59 |
| 87.5th | 34 | 26 | 10 | 1E‐03 | 1E‐06 | 1E‐06 | 1E‐06 | 1E‐06 | 2E‐03 | 1.3 | 27 | 44 | |
| 77.5th | 22 | 13 | 2.4 | 8E‐04 | 1E‐06 | 1E‐06 | 1E‐06 | 1E‐06 | 9E‐04 | 0.7 | 13 | 29 | |
| 67.5th | 11 | 5.8 | 0.5 | 4E‐04 | 1E‐06 | 1E‐06 | 1E‐06 | 1E‐06 | 4E‐04 | 0.5 | 7.3 | 14 | |
| 57.5th | 6.1 | 2.1 | 0.1 | 6E‐05 | 1E‐06 | 1E‐06 | 1E‐06 | 1E‐06 | 4E‐04 | 0.3 | 4.9 | 7.4 | |
| 47.5th | 3.2 | 0.9 | 0.06 | 1E‐06 | 1E‐06 | 1E‐06 | 1E‐06 | 1E‐06 | 2E‐04 | 0.2 | 2.6 | 4.3 |
Table I.6.
Monthly average PECsw (μg/L) for dummy substance A in the run‐off scenarios R1, R2, R3 and R4 in relation to the intended application date and the temporal percentile selected (all winter cereals with the exception of potatoes in R2, 1 × 1 kg/ha to the soil surface, 7‐day application window, run‐off only, no drift). Data are based on a TOXSWA stream meta model
| Scenario | Temporal percentile | Jan | Feb | Mar | Apr | May | Jun | Jul | Aug | Sep | Oct | Nov | Dec |
|---|---|---|---|---|---|---|---|---|---|---|---|---|---|
| R1‐stream | 97.5th (max) | 84 | 80 | 46 | 42 | 58 | 52 | 43 | 32 | 55 | 83 | 83 | 75 |
| 87.5th | 48 | 46 | 26 | 18 | 22 | 29 | 21 | 18 | 35 | 55 | 54 | 37 | |
| 77.5th | 28 | 26 | 14 | 7.2 | 9.6 | 10 | 9.2 | 6.6 | 23 | 33 | 37 | 25 | |
| 67.5th | 19 | 17 | 7.2 | 2.3 | 2.3 | 4.4 | 3.7 | 1.3 | 10 | 18 | 21 | 15 | |
| 57.5th | 14 | 8.6 | 3.4 | 1.0 | 0.5 | 1.9 | 1.2 | 0.5 | 3.3 | 7.4 | 13 | 5.7 | |
| 47.5th | 8.1 | 3.8 | 1.3 | 0.4 | 0.1 | 0.5 | 0.2 | 0.2 | 1.2 | 5.2 | 8.7 | 2.5 | |
| R2‐stream | 97.5th (max) | 76 | 79 | 51 | 33 | 32 | 22 | 7.2 | 8.7 | 25 | 55 | 71 | 81 |
| 87.5th | 67 | 67 | 33 | 18 | 15 | 6.7 | 0.9 | 2.3 | 14 | 42 | 58 | 66 | |
| 77.5th | 58 | 54 | 22 | 9.0 | 6.0 | 2.0 | 0.5 | 0.2 | 10 | 32 | 50 | 54 | |
| 67.5th | 51 | 45 | 11 | 4.3 | 2.2 | 0.5 | 3E‐03 | 0.03 | 7.0 | 24 | 42 | 47 | |
| 57.5th | 43 | 34 | 6.2 | 1.9 | 0.8 | 0.10 | 5E‐04 | 3E‐03 | 4.3 | 17 | 36 | 40 | |
| 47.5th | 35 | 26 | 2.6 | 1.0 | 0.1 | 1E‐02 | 1E‐04 | 1E‐03 | 2.0 | 11 | 30 | 34 | |
| R3‐stream | 97.5th (max) | 57 | 63 | 52 | 50 | 40 | 19 | 20 | 22 | 40 | 72 | 103 | 72 |
| 87.5th | 29 | 39 | 25 | 28 | 15 | 5.6 | 3.4 | 6.1 | 18 | 45 | 72 | 46 | |
| 77.5th | 7.6 | 14 | 19 | 16 | 5.9 | 1.5 | 0.1 | 3.3 | 11 | 33 | 55 | 23 | |
| 67.5th | 2.3 | 8.7 | 12 | 8.2 | 2.4 | 0.4 | 8E‐04 | 2.0 | 3.3 | 26 | 46 | 13 | |
| 57.5th | 1.2 | 6.6 | 6.2 | 3.1 | 0.9 | 0.07 | 4E‐05 | 0.5 | 0.9 | 19 | 39 | 6.0 | |
| 47.5th | 0.6 | 4.3 | 1.8 | 1.4 | 0.1 | 5E‐03 | 2E‐07 | 0.1 | 0.2 | 13 | 29 | 2.9 | |
| R4‐stream | 97.5th (max) | 51 | 56 | 47 | 48 | 43 | 18 | 5.2 | 24 | 37 | 68 | 60 | 45 |
| 87.5th | 30 | 46 | 32 | 27 | 18 | 2.5 | 0.7 | 9.5 | 22 | 50 | 43 | 28 | |
| 77.5th | 24 | 29 | 19 | 15 | 8.3 | 0.2 | 0.2 | 4.6 | 14 | 36 | 26 | 16 | |
| 67.5th | 13 | 18 | 9.3 | 7.4 | 4.3 | 0.02 | 0.01 | 2.4 | 7.9 | 27 | 15 | 9.5 | |
| 57.5th | 9.0 | 9.6 | 3.6 | 3.9 | 1.9 | 6E‐06 | 4E‐03 | 1.4 | 4.5 | 18 | 7.3 | 4.7 | |
| 47.5th | 4.5 | 4.1 | 1.7 | 2.2 | 0.8 | 2E‐07 | 9E‐04 | 0.9 | 3.2 | 11 | 3.7 | 1.8 |
Differences in different temporal percentiles are highest for rainfall sensitive substances if PECsw are lowest (in periods with less rainfall, so in summer). In periods with rather high PECsw (from October to February), a shift from, e.g. the 77.5th to the 87.5th temporal percentile increases the PECsw by a factor of roughly 1.5–2.0, whereas in spring and summer, when overall PECsw are lowest, differences between different temporal percentiles may be much higher (several orders of magnitude). Note that a result of 1E‐06 μg/L in Table I.5 is the lowest number provided by TOXSWA, so there is no further differentiation in PECsw below this threshold.
Applying the six different dummy substances A, B, C, D, E and F in the drainage scenario D2 (Table I.6) and in the run‐off scenario R2 (Table I.7) reveals that for substances that are less sensitive to the rainfall pattern (DegT50 = 30 days or above) PECsw are much less affected by the selection of the temporal percentile. This situation is particularly true for applications in summer, when overall PECsw are lowest. When compared with more rainfall pattern sensitive dummy substances with a DegT50 of 3 days only, overall PECsw results obtained for dummy substance with a DegT50 of 30 days are much less affected by the application season as well as by the percentile selected.
Table I.7.
Monthly average PECsw values (μg/L) for dummy substances A, B, C, D, E and F in the drainage scenario D2 in relation to the intended application date and the temporal percentile selected (winter cereals, 1 × 1 kg/ha to the soil surface, 7‐day application window, drainage only, no drift)
| Dummy substance (DegT50 (day)/Koc (mL/g)) | Temporal percentile | Jan | Feb | Mar | Apr | May | Jun | Jul | Aug | Sep | Oct | Nov | Dec |
|---|---|---|---|---|---|---|---|---|---|---|---|---|---|
| A (3/10) | 97.5th (max) | 288 | 231 | 211 | 181 | 185 | 153 | 114 | 156 | 146 | 207 | 259 | 284 |
| 87.5th | 228 | 162 | 160 | 134 | 139 | 75 | 44 | 66 | 90 | 158 | 193 | 220 | |
| 77.5th | 201 | 138 | 142 | 99 | 104 | 35 | 23 | 40 | 66 | 131 | 155 | 188 | |
| 67.5th | 175 | 121 | 121 | 78 | 79 | 18 | 10 | 17 | 54 | 110 | 134 | 172 | |
| 57.5th | 152 | 104 | 99 | 60 | 55 | 9.0 | 3.1 | 9.1 | 38 | 83 | 123 | 156 | |
| 47.5th | 128 | 89 | 85 | 39 | 32 | 2.6 | 0.9 | 2.3 | 25 | 59 | 111 | 129 | |
| B (3/100) | 97.5th (max) | 211 | 164 | 144 | 112 | 95 | 58 | 51 | 75 | 89 | 128 | 181 | 230 |
| 87.5th | 169 | 98 | 101 | 51 | 64 | 23 | 13 | 33 | 59 | 92 | 126 | 172 | |
| 77.5th | 143 | 82 | 74 | 32 | 35 | 5.7 | 4.8 | 18 | 44 | 73 | 100 | 146 | |
| 67.5th | 116 | 60 | 52 | 18 | 18 | 1.9 | 2.9 | 7.6 | 35 | 53 | 84 | 123 | |
| 57.5th | 91 | 45 | 40 | 9.6 | 7.9 | 0.3 | 0.9 | 3.3 | 21 | 41 | 72 | 105 | |
| 47.5th | 63 | 34 | 30 | 5.8 | 3.9 | 0.1 | 0.4 | 1.7 | 12 | 31 | 61 | 92 | |
| C (3/1,000) | 97.5th (max) | 2.0 | 0.1 | 0.06 | 0.06 | 0.07 | 1E‐03 | 5E‐04 | 0.02 | 0.2 | 0.8 | 2.9 | 5.0 |
| 87.5th | 0.3 | 0.04 | 0.03 | 4E‐03 | 4E‐04 | 1E‐05 | 2E‐04 | 4E‐03 | 0.06 | 0.4 | 1.6 | 2.2 | |
| 77.5th | 0.1 | 0.03 | 5E‐03 | 9E‐04 | 9E‐06 | 6E‐06 | 1E‐04 | 2E‐03 | 0.03 | 0.3 | 1.0 | 1.1 | |
| 67.5th | 0.06 | 9E‐03 | 1E‐03 | 4E‐05 | 1E‐06 | 4E‐06 | 6E‐05 | 1E‐03 | 0.03 | 0.2 | 0.7 | 0.7 | |
| 57.5th | 0.03 | 4E‐03 | 3E‐04 | 3E‐06 | 1E‐06 | 1E‐06 | 3E‐05 | 8E‐04 | 0.02 | 0.2 | 0.5 | 0.2 | |
| 47.5th | 0.02 | 1E‐03 | 1E‐04 | 1E‐06 | 1E‐06 | 1E‐06 | 7E‐06 | 6E‐04 | 0.01 | 0.1 | 0.4 | 0.1 | |
| D (30/10) | 97.5th (max) | 307 | 249 | 229 | 203 | 215 | 196 | 176 | 201 | 193 | 232 | 286 | 303 |
| 87.5th | 248 | 186 | 185 | 170 | 188 | 138 | 123 | 139 | 157 | 196 | 227 | 236 | |
| 77.5th | 219 | 164 | 171 | 146 | 164 | 109 | 99 | 108 | 136 | 176 | 194 | 212 | |
| 67.5th | 198 | 148 | 155 | 129 | 143 | 75 | 60 | 87 | 122 | 158 | 178 | 198 | |
| 57.5th | 180 | 134 | 141 | 113 | 126 | 48 | 51 | 71 | 109 | 142 | 165 | 185 | |
| 47.5th | 160 | 120 | 129 | 102 | 106 | 36 | 43 | 61 | 96 | 128 | 154 | 164 | |
| E (30/100) | 97.5th (max) | 263 | 221 | 205 | 178 | 176 | 141 | 127 | 164 | 167 | 205 | 239 | 291 |
| 87.5th | 226 | 174 | 166 | 135 | 144 | 103 | 99 | 124 | 149 | 179 | 204 | 232 | |
| 77.5th | 204 | 152 | 145 | 113 | 127 | 87 | 83 | 109 | 136 | 161 | 179 | 210 | |
| 67.5th | 181 | 134 | 131 | 102 | 113 | 73 | 73 | 96 | 125 | 146 | 165 | 193 | |
| 57.5th | 164 | 123 | 120 | 92 | 94 | 50 | 66 | 82 | 114 | 134 | 156 | 179 | |
| 47.5th | 148 | 115 | 112 | 82 | 72 | 39 | 58 | 71 | 101 | 124 | 147 | 163 | |
| F (30/1,000) | 97.5th (max) | 29 | 18 | 9.4 | 6.9 | 9.3 | 8.1 | 11 | 16 | 24 | 32 | 39 | 48 |
| 87.5th | 21 | 12 | 6.5 | 5.9 | 6.4 | 6.7 | 9.4 | 14 | 22 | 29 | 36 | 37 | |
| 77.5th | 13 | 5.8 | 5.4 | 4.8 | 5.6 | 6.1 | 8.6 | 13 | 20 | 26 | 31 | 29 | |
| 67.5th | 9.3 | 4.8 | 4.7 | 4.1 | 5.0 | 5.8 | 8.2 | 13 | 20 | 25 | 29 | 24 | |
| 57.5th | 7.4 | 4.4 | 4.2 | 3.8 | 4.4 | 5.6 | 7.9 | 12 | 18 | 24 | 26 | 20 | |
| 47.5th | 6.0 | 4.1 | 3.8 | 3.6 | 4.0 | 5.4 | 7.6 | 11 | 17 | 22 | 21 | 15 |
Results for the six different dummy substances A, B, C, D, E and F in the drainage scenario D2 and in the run‐off scenario R2 reveal that overall PECsw obtained are also strongly driven by the Koc of the substance (Tables I.7 and I.8).
Table I.8.
Monthly average PECsw values (μg/L) for dummy substances A, B, C, D, E and F in the run‐off scenario R2 in relation to the intended application date and the temporal percentile selected (potatoes, 1 × 1 kg/ha to the soil surface, 7‐day application window, run‐off only, no drift). Data are based on a TOXSWA stream meta model
| Dummy substance (DegT50 (day)/Koc (mL/g)) | Temporal percentile | Jan | Feb | Mar | Apr | May | Jun | Jul | Aug | Sep | Oct | Nov | Dec |
|---|---|---|---|---|---|---|---|---|---|---|---|---|---|
| A (3/10) | 97.5th (max) | 76 | 79 | 51 | 33 | 32 | 22 | 7.2 | 8.7 | 25 | 55 | 71 | 81 |
| 87.5th | 67 | 67 | 33 | 18 | 15 | 6.7 | 0.9 | 2.3 | 14 | 42 | 58 | 66 | |
| 77.5th | 58 | 54 | 22 | 9.0 | 6.0 | 2.0 | 0.5 | 0.2 | 10 | 32 | 50 | 54 | |
| 67.5th | 51 | 45 | 11 | 4.3 | 2.2 | 0.5 | 3E‐03 | 0.03 | 7.0 | 24 | 42 | 47 | |
| 57.5th | 43 | 34 | 6.2 | 1.9 | 0.8 | 0.10 | 5E‐04 | 3E‐03 | 4.3 | 17 | 36 | 40 | |
| 47.5th | 35 | 26 | 2.6 | 1.0 | 0.1 | 1E‐02 | 1E‐04 | 1E‐03 | 2.0 | 11 | 30 | 34 | |
| B (3/100) | 97.5th (max) | 27 | 27 | 22 | 18 | 16 | 11 | 4.3 | 4.4 | 11 | 23 | 25 | 28 |
| 87.5th | 25 | 25 | 18 | 12 | 9.3 | 4.4 | 0.7 | 1.0 | 7.2 | 19 | 23 | 25 | |
| 77.5th | 23 | 22 | 13 | 8.6 | 5.6 | 1.7 | 0.3 | 0.1 | 5.4 | 15 | 21 | 23 | |
| 67.5th | 22 | 20 | 9.3 | 5.8 | 3.6 | 0.5 | 2E‐03 | 0.03 | 4.1 | 12 | 19 | 21 | |
| 57.5th | 20 | 18 | 6.8 | 3.4 | 1.3 | 0.1 | 2E‐04 | 6E‐03 | 2.7 | 9.0 | 16 | 19 | |
| 47.5th | 18 | 16 | 4.3 | 1.8 | 0.5 | 0.02 | 6E‐05 | 2E‐03 | 1.7 | 7.5 | 13 | 17 | |
| C (3/1,000) | 97.5th (max) | 3.7 | 3.7 | 3.3 | 3.1 | 2.6 | 1.7 | 0.7 | 0.7 | 1.6 | 3.3 | 3.5 | 3.8 |
| 87.5th | 3.5 | 3.5 | 2.9 | 2.1 | 1.6 | 0.7 | 0.1 | 0.2 | 1.2 | 2.9 | 3.2 | 3.6 | |
| 77.5th | 3.4 | 3.3 | 2.3 | 1.6 | 1.0 | 0.3 | 0.05 | 0.02 | 0.9 | 2.4 | 3.0 | 3.4 | |
| 67.5th | 3.2 | 3.1 | 1.8 | 1.1 | 0.7 | 0.09 | 2E‐04 | 5E‐03 | 0.7 | 1.9 | 2.7 | 3.1 | |
| 57.5th | 2.9 | 2.7 | 1.4 | 0.7 | 0.3 | 0.02 | 3E‐05 | 1E‐03 | 0.5 | 1.5 | 2.4 | 2.9 | |
| 47.5th | 2.7 | 2.4 | 0.9 | 0.4 | 0.1 | 5E‐03 | 8E‐06 | 4E‐04 | 0.3 | 1.3 | 2.0 | 2.5 | |
| D (30/10) | 97.5th (max) | 88 | 89 | 62 | 40 | 43 | 40 | 29 | 35 | 47 | 69 | 88 | 90 |
| 87.5th | 83 | 77 | 44 | 29 | 26 | 21 | 13 | 21 | 31 | 58 | 79 | 82 | |
| 77.5th | 76 | 66 | 31 | 18 | 13 | 14 | 9.0 | 11 | 25 | 48 | 69 | 70 | |
| 67.5th | 68 | 55 | 18 | 11 | 8.3 | 8.9 | 5.5 | 5.5 | 19 | 40 | 59 | 62 | |
| 57.5th | 60 | 45 | 11 | 6.5 | 6.0 | 5.4 | 3.3 | 3.2 | 15 | 33 | 54 | 56 | |
| 47.5th | 54 | 37 | 6.7 | 4.2 | 3.7 | 2.9 | 1.4 | 1.4 | 11 | 26 | 49 | 51 | |
| E (30/100) | 97.5th (max) | 31 | 31 | 26 | 23 | 22 | 21 | 17 | 19 | 23 | 28 | 31 | 31 |
| 87.5th | 30 | 30 | 24 | 19 | 17 | 17 | 11 | 14 | 19 | 26 | 29 | 30 | |
| 77.5th | 29 | 28 | 20 | 17 | 15 | 13 | 9.1 | 9.2 | 17 | 24 | 28 | 29 | |
| 67.5th | 28 | 26 | 17 | 15 | 13 | 11 | 6.2 | 6.9 | 16 | 22 | 27 | 28 | |
| 57.5th | 27 | 25 | 15 | 13 | 11 | 8.2 | 3.5 | 5.6 | 14 | 21 | 26 | 27 | |
| 47.5th | 26 | 24 | 12 | 11 | 9.0 | 6.4 | 2.3 | 5.1 | 13 | 19 | 25 | 26 | |
| F (30/1,000) | 97.5th (max) | 4.3 | 4.3 | 4.1 | 4.0 | 3.9 | 3.7 | 3.1 | 3.4 | 3.5 | 4.1 | 4.2 | 4.3 |
| 87.5th | 4.2 | 4.2 | 3.9 | 3.6 | 3.5 | 3.1 | 2.2 | 2.4 | 3.3 | 4.0 | 4.2 | 4.2 | |
| 77.5th | 4.2 | 4.2 | 3.8 | 3.4 | 3.2 | 2.8 | 1.7 | 1.9 | 3.2 | 3.9 | 4.1 | 4.2 | |
| 67.5th | 4.1 | 4.1 | 3.6 | 3.2 | 3.0 | 2.3 | 1.1 | 1.6 | 3.1 | 3.8 | 4.0 | 4.1 | |
| 57.5th | 4.1 | 4.0 | 3.4 | 3.0 | 2.5 | 1.8 | 0.8 | 1.3 | 2.9 | 3.6 | 4.0 | 4.1 | |
| 47.5th | 4.0 | 3.9 | 3.1 | 2.7 | 2.3 | 1.4 | 0.6 | 1.3 | 2.8 | 3.5 | 3.9 | 4.0 |
I.5. How does the new 20‐year assessment approach perform in comparison with the current FOCUS single‐year approach?
Figures I.9 and I.10 give PECsw obtained for dummy substances A and F in the FOCUS sw scenarios D2 and R2 based on the new 20‐year assessment approach (7.5–87.5th percentile, 7‐day application window) compared with PECsw obtained based on the current FOCUS sw approach (single evaluation year, current FOCUS PAT).
Figure J.2.
Time‐dependent concentration in surface water (R2 stream) with current single application scheme
As expected, there is only a poor agreement between the new 20‐year assessment approach and the current FOCUS approach for rainfall sensitive substances. Note that the current FOCUS approach is based on a single year, which of course cannot mirror the seasonal pattern observed for the entire 20‐year assessment period. Although the current FOCUS PAT was intended to reduce variability in PECsw, there are still significant erratic shifts in PECsw obtained for this type of substances, depending on the actual rainfall in the single evaluation year. Shifting the application window by only 1 day may therefore lead to drastic changes in PECsw results. Note that this issue was one of the major criticisms of the current assessment approach. As the current FOCUS approach is representing 1 out of the 20 years in the new approach, PECsw obtained based on the old system may indeed cover the full range of different percentile PECsw obtained based on the new 20‐year assessment period. In some periods, the current FOCUS approach gives PECsw far below the 47.5th percentile PECsw in the new approach; in some other periods, the current FOCUS approach may even give PECsw close to the maximum percentile PECsw in the new approach. The alignment between the new 20‐year assessment approach and the current FOCUS approach is much better for less rainfall sensitive substances.
I.6. Consistency of the tiered approach
Tables I.9–I.12 give maximum monthly PECsw for dummy substance A in all of the 10 FOCUS surface scenarios as well as maximum monthly PECsw for dummy substance A, B, C, D, E and F in D2 and R2, compared with PEC sw results obtained at FOCUS sw STEP 1 and 2 with the same application setting (1 × 1 kg/ha to the soil surface, no drift).
Table I.9.
Monthly maximum PECsw (μg/L) for dummy substance A in the FOCUS drainage scenarios D1, D2, D3, D4, D5 and D6 in relation to the (intended) application date and the percentile selected (all winter cereals, 1 × 1 kg/ha to the soil surface, 7‐day application window, no drift), compared to PECsw results obtained at FOCUS sw STEP 1 and 2 (1 × 1 kg/ha, no crop interception, no drift). Cells coloured in dark grey are not covered by FOCUS sw Steps 1 and 2, cells coloured in grey are not covered by FOCUS sw Step 2 (with D1, D2, D3 and D4 considered to belong to the north EU, D5 and D6 to belong to the south EU)
| Step/scenario | Percentile | Jan | Feb | Mar | Apr | May | Jun | Jul | Aug | Sep | Oct | Nov | Dec |
|---|---|---|---|---|---|---|---|---|---|---|---|---|---|
| STEP 1 | na | 329 | 329 | 329 | 329 | 329 | 329 | 329 | 329 | 329 | 329 | 329 | 329 |
| STEP 2, N‐EU | na | 65 | 65 | 26 | 26 | 26 | 26 | 26 | 26 | 26 | 65 | 65 | 65 |
| STEP 2, S‐EU | na | 52 | 52 | 52 | 52 | 52 | 39 | 39 | 39 | 39 | 52 | 52 | 52 |
| D1‐ditch | Max (97.5th) | 239 | 255 | 270 | 227 | 207 | 173 | 157 | 152 | 184 | 257 | 268 | 300 |
| 87.5th | 191 | 176 | 192 | 132 | 110 | 98 | 44 | 66 | 107 | 164 | 223 | 232 | |
| 77.5th | 140 | 157 | 171 | 104 | 80 | 72 | 25 | 43 | 68 | 137 | 179 | 200 | |
| 67.5th | 116 | 137 | 134 | 75 | 49 | 36 | 3.5 | 27 | 59 | 120 | 158 | 181 | |
| 57.5th | 102 | 127 | 108 | 69 | 37 | 9.4 | 2.9 | 9.9 | 42 | 96 | 150 | 167 | |
| 47.5th | 88 | 111 | 94 | 61 | 7.5 | 3.7 | 2.8 | 8.0 | 39 | 92 | 126 | 159 | |
| D2‐ditch | Max (97.5th) | 363 | 313 | 321 | 224 | 227 | 218 | 172 | 204 | 218 | 262 | 337 | 363 |
| 87.5th | 272 | 261 | 189 | 168 | 185 | 129 | 86 | 104 | 157 | 211 | 260 | 321 | |
| 77.5th | 229 | 199 | 172 | 146 | 126 | 83 | 54 | 60 | 125 | 172 | 200 | 246 | |
| 67.5th | 205 | 165 | 161 | 127 | 102 | 54 | 39 | 43 | 110 | 125 | 175 | 187 | |
| 57.5th | 188 | 149 | 123 | 102 | 82 | 47 | 7.4 | 28 | 80 | 119 | 150 | 179 | |
| 47.5th | 157 | 122 | 108 | 57 | 46 | 6.3 | 2.2 | 9.0 | 52 | 85 | 133 | 171 | |
| D3‐ditch | Max (97.5th) | 4.0 | 1.6 | 0.3 | 0.01 | 0.04 | 0.02 | 0.03 | 0.2 | 0.4 | 1.8 | 4.0 | 5.1 |
| 87.5th | 4.0 | 0.5 | 0.1 | 5E‐03 | 8E‐03 | 6E‐03 | 0.01 | 0.07 | 0.2 | 1.4 | 1.7 | 4.0 | |
| 77.5th | 2.4 | 0.2 | 0.09 | 3E‐03 | 1E‐03 | 1E‐03 | 4E‐03 | 0.05 | 0.1 | 0.8 | 1.4 | 2.2 | |
| 67.5th | 1.5 | 0.2 | 0.05 | 1E‐03 | 7E‐04 | 1E‐03 | 3E‐03 | 0.03 | 0.1 | 0.7 | 1.1 | 1.6 | |
| 57.5th | 1.0 | 0.1 | 0.03 | 6E‐04 | 6E‐04 | 5E‐04 | 2E‐03 | 0.01 | 0.08 | 0.6 | 1.0 | 0.9 | |
| 47.5th | 0.6 | 0.10 | 0.03 | 3E‐04 | 3E‐04 | 3E‐04 | 1E‐03 | 7E‐03 | 0.07 | 0.5 | 0.9 | 0.8 | |
| D4‐stream | Max (97.5th) | 32 | 11 | 52 | 52 | 0.2 | 6E‐03 | 0.04 | 0.3 | 3.0 | 43 | 30 | 213 |
| 87.5th | 13 | 7.5 | 7.5 | 0.2 | 1E‐03 | 9E‐04 | 7E‐03 | 0.08 | 1.5 | 7.0 | 25 | 18 | |
| 77.5th | 7.9 | 2.1 | 1.0 | 0.05 | 4E‐04 | 5E‐04 | 5E‐03 | 0.05 | 0.4 | 2.8 | 9.2 | 9.7 | |
| 67.5th | 4.8 | 1.3 | 0.2 | 0.01 | 1E‐04 | 2E‐04 | 1E‐03 | 0.02 | 0.4 | 2.4 | 6.3 | 5.9 | |
| 57.5th | 2.2 | 0.3 | 0.1 | 4E‐03 | 7E‐05 | 1E‐04 | 6E‐04 | 0.01 | 0.2 | 1.9 | 5.5 | 4.8 | |
| 47.5th | 1.6 | 0.2 | 0.09 | 9E‐04 | 4E‐05 | 8E‐05 | 3E‐04 | 8E‐03 | 0.2 | 1.2 | 3.8 | 4.1 | |
| D5‐stream | Max (97.5th) | 127 | 112 | 79 | 70 | 20 | 22 | 0.01 | 1.6 | 49 | 58 | 69 | 123 |
| 87.5th | 40 | 45 | 13 | 2.8 | 0.2 | 2E‐04 | 2E‐04 | 0.01 | 3.4 | 28 | 22 | 45 | |
| 77.5th | 27 | 39 | 3.8 | 0.2 | 2E‐06 | 1E‐06 | 2E‐05 | 7E‐03 | 1.1 | 12 | 15 | 35 | |
| 67.5th | 14 | 17 | 1.6 | 7E‐05 | 1E‐06 | 1E‐06 | 2E‐05 | 3E‐03 | 0.8 | 5.0 | 8.5 | 24 | |
| 57.5th | 11 | 13 | 0.3 | 1E‐05 | 1E‐06 | 1E‐06 | 3E‐06 | 2E‐03 | 0.3 | 0.9 | 7.3 | 15 | |
| 47.5th | 6.8 | 6.7 | 6E‐04 | 1E‐06 | 1E‐06 | 1E‐06 | 1E‐06 | 3E‐04 | 0.06 | 0.5 | 5.2 | 10 | |
| D6‐ditch | Max (97.5th) | 137 | 114 | 91 | 2.7 | 1E‐06 | 1E‐06 | 1E‐06 | 1E‐05 | 0.07 | 41 | 80 | 90 |
| 87.5th | 78 | 51 | 31 | 5E‐03 | 1E‐06 | 1E‐06 | 1E‐06 | 6E‐06 | 8E‐03 | 4.3 | 73 | 78 | |
| 77.5th | 51 | 27 | 11 | 3E‐03 | 1E‐06 | 1E‐06 | 1E‐06 | 2E‐06 | 5E‐03 | 3.7 | 34 | 48 | |
| 67.5th | 29 | 10 | 1.8 | 2E‐03 | 1E‐06 | 1E‐06 | 1E‐06 | 1E‐06 | 3E‐03 | 2.2 | 11 | 27 | |
| 57.5th | 13 | 3.2 | 0.5 | 7E‐04 | 1E‐06 | 1E‐06 | 1E‐06 | 1E‐06 | 2E‐03 | 2.0 | 8.1 | 10 | |
| 47.5th | 6.7 | 2.2 | 0.2 | 4E‐06 | 1E‐06 | 1E‐06 | 1E‐06 | 1E‐06 | 2E‐03 | 1.1 | 5.9 | 8.9 |
Table I.12.
Monthly maximum PECsw (μg/L) for the dummy substances A, B, C, D, E and F in the run‐off scenario R2 in relation to the (intended) application date and the percentile selected (potatoes, 1 × 1 kg/ha to the soil surface, 7‐day application window, no drift), compared to PECsw (μg/L) obtained at FOCUS sw Steps 1 and 2 (1 × 1 kg/ha, no crop interception, no drift). Cells coloured in grey are not covered by FOCUS sw Step 2 (with R2 considered to belong to the south EU). Data are based on a TOXSWA stream meta model
| Dummy substance (DegT50 (day)/Koc (mL/g)) | Step/percentile | Jan | Feb | Mar | Apr | May | Jun | Jul | Aug | Sep | Oct | Nov | Dec |
|---|---|---|---|---|---|---|---|---|---|---|---|---|---|
| A (3/10) | STEP 1 | 329 | 329 | 329 | 329 | 329 | 329 | 329 | 329 | 329 | 329 | 329 | 329 |
| STEP 2 S‐EU | 52 | 52 | 52 | 52 | 52 | 39 | 39 | 39 | 39 | 52 | 52 | 52 | |
| Max (97.5th) | 87 | 91 | 79 | 51 | 50 | 43 | 19 | 20 | 51 | 62 | 87 | 94 | |
| 87.5th | 73 | 82 | 50 | 30 | 33 | 23 | 6.7 | 9.5 | 43 | 52 | 70 | 84 | |
| 77.5th | 65 | 70 | 37 | 21 | 17 | 12 | 5.0 | 0.7 | 28 | 43 | 66 | 62 | |
| 67.5th | 58 | 59 | 22 | 15 | 7.1 | 2.4 | 0.01 | 0.1 | 27 | 36 | 54 | 60 | |
| 57.5th | 52 | 50 | 16 | 2.8 | 2.3 | 0.6 | 3E‐03 | 9E‐03 | 21 | 31 | 50 | 49 | |
| 47.5th | 44 | 37 | 7.3 | 2.0 | 0.8 | 0.04 | 1E‐03 | 7E‐03 | 11 | 28 | 46 | 45 | |
| B (3/100) | STEP 1 | 294 | 294 | 294 | 294 | 294 | 294 | 294 | 294 | 294 | 294 | 294 | 294 |
| STEP 2 S‐EU | 47 | 47 | 47 | 47 | 47 | 35 | 35 | 35 | 35 | 47 | 47 | 47 | |
| Max (97.5th) | 29 | 29 | 26 | 21 | 22 | 18 | 13 | 8.3 | 20 | 25 | 27 | 29 | |
| 87.5th | 27 | 28 | 22 | 17 | 16 | 12 | 5.5 | 3.4 | 18 | 22 | 25 | 27 | |
| 77.5th | 26 | 25 | 21 | 14 | 12 | 5.8 | 3.3 | 0.4 | 14 | 18 | 23 | 26 | |
| 67.5th | 24 | 25 | 14 | 9.6 | 7.8 | 2.5 | 9E‐03 | 0.08 | 12 | 15 | 21 | 23 | |
| 57.5th | 22 | 21 | 11 | 6.5 | 4.7 | 0.6 | 1E‐03 | 0.04 | 11 | 13 | 20 | 23 | |
| 47.5th | 20 | 20 | 7.4 | 3.6 | 2.0 | 0.1 | 3E‐04 | 0.01 | 6.3 | 11 | 18 | 20 | |
| C (3/1,000) | STEP 1 | 143 | 143 | 143 | 143 | 143 | 143 | 143 | 143 | 143 | 143 | 143 | 143 |
| STEP 2 S‐EU | 23 | 23 | 23 | 23 | 23 | 17 | 17 | 17 | 17 | 23 | 23 | 23 | |
| Max (97.5th) | 3.9 | 4.0 | 3.7 | 3.5 | 3.4 | 2.7 | 2.2 | 1.4 | 2.9 | 3.5 | 3.8 | 4.0 | |
| 87.5th | 3.8 | 3.7 | 3.4 | 2.9 | 2.4 | 1.7 | 0.9 | 0.5 | 2.7 | 3.2 | 3.5 | 3.7 | |
| 77.5th | 3.7 | 3.7 | 3.4 | 2.4 | 2.1 | 0.9 | 0.5 | 0.06 | 2.4 | 2.9 | 3.3 | 3.5 | |
| 67.5th | 3.6 | 3.5 | 2.4 | 1.9 | 1.4 | 0.4 | 1E‐03 | 0.01 | 1.9 | 2.3 | 3.2 | 3.5 | |
| 57.5th | 3.4 | 3.1 | 1.8 | 1.5 | 0.8 | 0.1 | 2E‐04 | 8E‐03 | 1.7 | 2.1 | 2.8 | 3.3 | |
| 47.5th | 3.1 | 3.0 | 1.2 | 0.8 | 0.5 | 0.02 | 4E‐05 | 3E‐03 | 1.0 | 1.9 | 2.4 | 3.0 | |
| D (30/10) | STEP 1 | 329 | 329 | 329 | 329 | 329 | 329 | 329 | 329 | 329 | 329 | 329 | 329 |
| STEP 2 S‐EU | 120 | 120 | 120 | 120 | 120 | 90 | 90 | 90 | 90 | 120 | 120 | 120 | |
| Max | 94 | 95 | 91 | 57 | 58 | 56 | 42 | 47 | 67 | 81 | 94 | 97 | |
| 87.5th | 89 | 91 | 64 | 40 | 42 | 36 | 19 | 30 | 55 | 79 | 89 | 92 | |
| 77.5th | 84 | 85 | 50 | 30 | 35 | 24 | 17 | 21 | 51 | 71 | 82 | 86 | |
| 67.5th | 78 | 78 | 34 | 18 | 12 | 13 | 8.5 | 7.3 | 42 | 65 | 69 | 72 | |
| 57.5th | 70 | 58 | 24 | 15 | 8.9 | 9.6 | 4.5 | 5.1 | 41 | 47 | 64 | 64 | |
| 47.5th | 61 | 51 | 16 | 7.5 | 6.3 | 7.1 | 2.6 | 2.0 | 26 | 43 | 61 | 57 | |
| E (30/100) | STEP 1 | 294 | 294 | 294 | 294 | 294 | 294 | 294 | 294 | 294 | 294 | 294 | 294 |
| STEP 2 S‐EU | 107 | 107 | 107 | 107 | 107 | 80 | 80 | 80 | 80 | 107 | 107 | 107 | |
| Max | 32 | 32 | 31 | 25 | 26 | 25 | 22 | 22 | 27 | 29 | 31 | 32 | |
| 87.5th | 31 | 31 | 26 | 23 | 21 | 21 | 20 | 18 | 26 | 29 | 30 | 31 | |
| 77.5th | 30 | 30 | 25 | 22 | 20 | 17 | 16 | 11 | 25 | 27 | 30 | 30 | |
| 67.5th | 29 | 29 | 25 | 17 | 17 | 15 | 7.9 | 9.2 | 23 | 26 | 29 | 29 | |
| 57.5th | 28 | 27 | 23 | 15 | 15 | 13 | 4.7 | 8.5 | 22 | 25 | 27 | 28 | |
| 47.5th | 27 | 26 | 19 | 13 | 12 | 9.8 | 3.4 | 8.3 | 17 | 24 | 27 | 28 | |
| F (30/1,000) | STEP 1 | 143 | 143 | 143 | 143 | 143 | 143 | 143 | 143 | 143 | 143 | 143 | 143 |
| STEP 2 S‐EU | 52 | 52 | 52 | 52 | 52 | 39 | 39 | 39 | 39 | 52 | 52 | 52 | |
| Max | 4.3 | 4.3 | 4.3 | 4.1 | 4.1 | 3.9 | 3.9 | 3.7 | 4.1 | 4.2 | 4.3 | 4.3 | |
| 87.5th | 4.3 | 4.3 | 4.2 | 3.9 | 3.9 | 3.5 | 3.4 | 2.7 | 4.0 | 4.1 | 4.2 | 4.3 | |
| 77.5th | 4.2 | 4.3 | 4.1 | 3.9 | 3.6 | 3.1 | 3.1 | 2.4 | 3.9 | 4.0 | 4.2 | 4.3 | |
| 67.5th | 4.2 | 4.2 | 4.0 | 3.6 | 3.4 | 2.8 | 1.4 | 2.2 | 3.8 | 3.9 | 4.1 | 4.2 | |
| 57.5th | 4.1 | 4.1 | 3.8 | 3.6 | 3.1 | 2.5 | 1.1 | 2.0 | 3.6 | 3.8 | 4.0 | 4.2 | |
| 47.5th | 4.1 | 4.1 | 3.4 | 3.0 | 2.9 | 2.3 | 0.7 | 1.9 | 3.5 | 3.8 | 4.0 | 4.1 |
Based on this comparison, it is obvious that the current FOCUS sw Step 1 calculation sufficiently covers all PECsw results obtained based on the new 20‐year assessment approach, with a few exceptions for the drainage scenarios if PECsw are based on the maximum percentile (application in November–March, only). In contrast, PECsw results based on FOCUS sw Step 2 are too low in many cases. This is particularly the case for rainfall sensitive substances in the drainage scenarios D1 and D2 (all percentiles), but also for the run‐off scenarios in autumn, winter and spring if PECsw results are based on higher percentiles. In all these cases, the tiered approach is not consistent as the lower tier gives lower PECsw values compared to results obtained at higher tier.
Based on day‐to‐day results available for the current FOCUS approach, inconsistencies in the tiered approach, with FOCUS sw STEP 2 results being lower than then STEP 3 results, are already given for the current FOCUS approach, depending on the application date.
The FOCUS Surface Water Repair WG recommends revising the parameterisation at FOCUS sw STEP 1 and 2, particularly with entries into the waterbody by drainage/run‐off. This may also include reconsideration of the period from application to drainage/run‐off (currently 4 days). The revision of FOCUS sw STEP 1 and 2 should also take care of the new proposed drift percentile setting (for multiple applications).
Table I.10.
Monthly maximum PECsw (μg/L) for dummy substance A in the run‐off scenarios R1, R2, R3 and R4 in relation to the (intended) application date and the percentile selected (all winter cereals with the exception of potatoes in R2, 1 × 1 kg/ha to the soil surface, 7‐day application window, no drift), compared to PECsw (μg/L) obtained at FOCUS sw Steps 1 and 2 (1 × 1 kg/ha, no crop interception, no drift). Cells coloured in grey are not covered by FOCUS sw Step 2 (with R1 considered to belong to the north EU, R2, R3 and R4 to belong to the south EU). Data are based on a TOXSWA stream meta model
| Step/scenario | Percentile | Jan | Feb | Mar | Apr | May | Jun | Jul | Aug | Sep | Oct | Nov | Dec |
|---|---|---|---|---|---|---|---|---|---|---|---|---|---|
| STEP 1 | na | 329 | 329 | 329 | 329 | 329 | 329 | 329 | 329 | 329 | 329 | 329 | 329 |
| STEP 2 N‐EU | na | 65 | 65 | 26 | 26 | 26 | 26 | 26 | 26 | 26 | 65 | 65 | 65 |
| STEP 2 S‐EU | na | 52 | 52 | 52 | 52 | 52 | 39 | 39 | 39 | 39 | 52 | 52 | 52 |
| R1‐stream | Max (97.5th) | 92 | 94 | 79 | 70 | 75 | 75 | 66 | 85 | 73 | 103 | 141 | 95 |
| 87.5th | 83 | 85 | 51 | 38 | 47 | 47 | 39 | 59 | 58 | 72 | 117 | 57 | |
| 77.5th | 58 | 47 | 35 | 18 | 19 | 16 | 19 | 18 | 44 | 52 | 80 | 36 | |
| 67.5th | 30 | 33 | 19 | 7.7 | 5.2 | 8.9 | 9.8 | 3.2 | 35 | 35 | 46 | 32 | |
| 57.5th | 19 | 19 | 14 | 2.6 | 3.1 | 6.3 | 4.2 | 1.8 | 11 | 20 | 24 | 11 | |
| 47.5th | 16 | 15 | 5.6 | 1.1 | 1.1 | 2.0 | 0.8 | 1.3 | 3.2 | 13 | 20 | 6.2 | |
| R2‐stream | Max (97.5th) | 87 | 91 | 79 | 51 | 50 | 43 | 19 | 20 | 51 | 62 | 87 | 94 |
| 87.5th | 73 | 82 | 50 | 30 | 33 | 23 | 6.7 | 9.5 | 43 | 52 | 70 | 84 | |
| 77.5th | 65 | 70 | 37 | 21 | 17 | 12 | 5.0 | 0.7 | 28 | 43 | 66 | 62 | |
| 67.5th | 58 | 59 | 22 | 15 | 7.1 | 2.4 | 0.01 | 0.1 | 27 | 36 | 54 | 60 | |
| 57.5th | 52 | 50 | 16 | 2.8 | 2.3 | 0.6 | 3E‐03 | 9E‐03 | 21 | 31 | 50 | 49 | |
| 47.5th | 44 | 37 | 7.3 | 2.0 | 0.8 | 0.04 | 1E‐03 | 7E‐03 | 11 | 28 | 46 | 45 | |
| R3‐stream | Max (97.5th) | 74 | 79 | 76 | 78 | 65 | 43 | 60 | 45 | 61 | 95 | 144 | 83 |
| 87.5th | 66 | 60 | 43 | 46 | 33 | 12 | 16 | 23 | 50 | 74 | 106 | 67 | |
| 77.5th | 16 | 23 | 34 | 38 | 17 | 3.9 | 0.5 | 14 | 33 | 60 | 82 | 37 | |
| 67.5th | 5.7 | 13 | 25 | 23 | 6.3 | 1.8 | 3E‐03 | 9.3 | 11 | 53 | 75 | 20 | |
| 57.5th | 4.6 | 9.4 | 13 | 11 | 3.6 | 0.2 | 2E‐04 | 3.6 | 3.8 | 34 | 65 | 15 | |
| 47.5th | 2.2 | 7.5 | 6.2 | 3.7 | 0.7 | 0.02 | 2E‐06 | 0.6 | 0.9 | 30 | 51 | 9.1 | |
| R4‐stream | Max (97.5th) | 96 | 66 | 68 | 72 | 57 | 43 | 20 | 44 | 60 | 92 | 115 | 60 |
| 87.5th | 49 | 53 | 53 | 48 | 41 | 15 | 6.5 | 26 | 44 | 66 | 101 | 49 | |
| 77.5th | 43 | 47 | 38 | 43 | 23 | 0.8 | 1.4 | 16 | 36 | 56 | 59 | 28 | |
| 67.5th | 23 | 42 | 25 | 18 | 16 | 0.08 | 0.06 | 9.8 | 24 | 47 | 40 | 22 | |
| 57.5th | 16 | 20 | 10 | 12 | 8.8 | 3E‐05 | 0.02 | 6.1 | 14 | 32 | 17 | 11 | |
| 47.5th | 13 | 14 | 4.1 | 5.4 | 4.1 | 1E‐06 | 6E‐03 | 4.2 | 8.4 | 21 | 13 | 4.6 |
Table I.11.
Monthly maximum PECsw (μg/L) for the dummy substances A, B, C, D, E and F in the drainage scenario D2 in relation to the (intended) application date and the percentile selected (winter cereals, 1 × 1 kg/ha to the soil surface, 7‐day application window, no drift), compared with PECsw (μg/L) obtained at FOCUS sw Steps 1 and 2 (1 × 1 kg/ha, no crop interception, no drift). Cells coloured in dark grey are not covered by FOCUS sw Steps 1 and 2, cells coloured in grey are not covered by FOCUS sw Step 2 (with D2 considered to belong to the north EU)
| Dummy substance (DegT50 (day)/Koc (mL/g)) | Step/percentile | Jan | Feb | Mar | Apr | May | Jun | Jul | Aug | Sep | Oct | Nov | Dec |
|---|---|---|---|---|---|---|---|---|---|---|---|---|---|
| A (3/10) | STEP 1 | 329 | 329 | 329 | 329 | 329 | 329 | 329 | 329 | 329 | 329 | 329 | 329 |
| STEP 2 S‐EU | 65 | 65 | 26 | 26 | 26 | 26 | 26 | 262 | 26 | 65 | 65 | 65 | |
| Max (97.5th) | 363 | 313 | 321 | 224 | 227 | 218 | 172 | 204 | 218 | 262 | 337 | 363 | |
| 87.5th | 272 | 261 | 189 | 168 | 185 | 129 | 86 | 104 | 157 | 211 | 260 | 321 | |
| 77.5th | 229 | 199 | 172 | 146 | 126 | 83 | 54 | 60 | 125 | 172 | 200 | 246 | |
| 67.5th | 205 | 165 | 161 | 127 | 102 | 54 | 39 | 43 | 110 | 125 | 175 | 187 | |
| 57.5th | 188 | 149 | 123 | 102 | 82 | 47 | 7.4 | 28 | 80 | 119 | 150 | 179 | |
| 47.5th | 157 | 122 | 108 | 57 | 46 | 6.3 | 2.2 | 9.0 | 52 | 85 | 133 | 171 | |
| B (3/100) | STEP 1 | 294 | 294 | 294 | 294 | 294 | 294 | 294 | 294 | 294 | 294 | 294 | 294 |
| STEP 2 S‐EU | 58 | 58 | 23 | 23 | 23 | 23 | 23 | 23 | 23 | 58 | 58 | 58 | |
| Max (97.5th) | 333 | 228 | 206 | 149 | 129 | 127 | 110 | 110 | 131 | 178 | 272 | 415 | |
| 87.5th | 206 | 159 | 139 | 85 | 105 | 60 | 24 | 65 | 108 | 116 | 200 | 232 | |
| 77.5th | 169 | 113 | 131 | 64 | 56 | 13 | 11 | 27 | 70 | 90 | 120 | 206 | |
| 67.5th | 151 | 88 | 77 | 43 | 33 | 4.8 | 9.2 | 14 | 55 | 69 | 103 | 153 | |
| 57.5th | 127 | 66 | 49 | 19 | 14 | 0.6 | 1.6 | 6.9 | 33 | 58 | 94 | 128 | |
| 47.5th | 108 | 54 | 42 | 15 | 9.0 | 0.2 | 0.6 | 6.1 | 24 | 46 | 69 | 117 | |
| C (3/1,000) | STEP 1 | 143 | 143 | 143 | 143 | 143 | 143 | 143 | 143 | 143 | 143 | 143 | 143 |
| STEP 2 S‐EU | 28 | 28 | 11 | 11 | 11 | 11 | 11 | 11 | 11 | 28 | 28 | 28 | |
| Max (97.5th) | 4.7 | 0.6 | 0.1 | 0.1 | 0.2 | 4E‐03 | 1E‐03 | 0.07 | 0.4 | 1.9 | 5.1 | 6.0 | |
| 87.5th | 0.8 | 0.08 | 0.05 | 5E‐03 | 3E‐03 | 3E‐05 | 7E‐04 | 1E‐02 | 0.1 | 0.8 | 3.0 | 3.7 | |
| 77.5th | 0.8 | 0.04 | 0.02 | 2E‐03 | 2E‐05 | 2E‐05 | 3E‐04 | 5E‐03 | 0.07 | 0.5 | 1.4 | 2.6 | |
| 67.5th | 0.4 | 0.02 | 2E‐03 | 1E‐04 | 2E‐06 | 1E‐05 | 2E‐04 | 4E‐03 | 0.06 | 0.4 | 1.1 | 1.4 | |
| 57.5th | 0.09 | 0.01 | 1E‐03 | 1E‐05 | 1E‐06 | 3E‐06 | 1E‐04 | 2E‐03 | 0.05 | 0.3 | 0.7 | 0.5 | |
| 47.5th | 0.09 | 4E‐03 | 7E‐04 | 1E‐06 | 1E‐06 | 1E‐06 | 3E‐05 | 2E‐03 | 0.04 | 0.3 | 0.5 | 0.2 | |
| D (30/10) | STEP 1 | 329 | 329 | 329 | 329 | 329 | 329 | 329 | 329 | 329 | 329 | 329 | 329 |
| STEP 2 S‐EU | 150 | 150 | 60 | 60 | 60 | 60 | 60 | 60 | 60 | 150 | 150 | 150 | |
| Max | 381 | 330 | 341 | 234 | 247 | 241 | 209 | 235 | 241 | 284 | 353 | 381 | |
| 87.5th | 290 | 271 | 212 | 202 | 215 | 189 | 160 | 168 | 196 | 250 | 279 | 330 | |
| 77.5th | 249 | 216 | 194 | 170 | 180 | 144 | 141 | 138 | 172 | 203 | 232 | 261 | |
| 67.5th | 223 | 191 | 173 | 156 | 163 | 127 | 72 | 120 | 161 | 176 | 213 | 225 | |
| 57.5th | 212 | 171 | 166 | 134 | 140 | 72 | 59 | 91 | 138 | 166 | 191 | 202 | |
| 47.5th | 178 | 157 | 145 | 113 | 122 | 56 | 52 | 83 | 121 | 151 | 173 | 195 | |
| E (30/100) | STEP 1 | 294 | 294 | 294 | 294 | 294 | 294 | 294 | 294 | 294 | 294 | 294 | 294 |
| STEP 2 S‐EU | 134 | 134 | 54 | 54 | 54 | 54 | 54 | 54 | 54 | 134 | 134 | 134 | |
| Max | 341 | 310 | 275 | 219 | 201 | 182 | 168 | 196 | 190 | 249 | 320 | 482 | |
| 87.5th | 288 | 215 | 190 | 167 | 158 | 130 | 118 | 140 | 175 | 219 | 265 | 289 | |
| 77.5th | 223 | 192 | 179 | 130 | 145 | 114 | 102 | 117 | 165 | 191 | 210 | 236 | |
| 67.5th | 200 | 162 | 153 | 129 | 132 | 82 | 92 | 111 | 142 | 177 | 189 | 212 | |
| 57.5th | 184 | 156 | 132 | 112 | 114 | 55 | 82 | 95 | 125 | 167 | 178 | 199 | |
| 47.5th | 180 | 135 | 128 | 93 | 94 | 45 | 71 | 87 | 112 | 146 | 164 | 189 | |
| F (30/1,000) | STEP 1 | 143 | 143 | 143 | 143 | 143 | 143 | 143 | 143 | 143 | 143 | 143 | 143 |
| STEP 2 S‐EU | 65 | 65 | 26 | 26 | 26 | 26 | 26 | 26 | 26 | 65 | 65 | 65 | |
| Max | 35 | 28 | 18 | 7.9 | 11 | 9.2 | 13 | 20 | 31 | 37 | 46 | 61 | |
| 87.5th | 26 | 18 | 7.7 | 6.2 | 7.4 | 7.7 | 12 | 17 | 26 | 34 | 43 | 48 | |
| 77.5th | 23 | 6.8 | 6.5 | 5.1 | 6.0 | 7.0 | 10 | 16 | 25 | 28 | 33 | 38 | |
| 67.5th | 20 | 5.2 | 5.1 | 4.7 | 5.6 | 6.6 | 9.9 | 16 | 23 | 27 | 30 | 31 | |
| 57.5th | 16 | 4.7 | 4.5 | 4.2 | 4.8 | 6.4 | 9.7 | 14 | 23 | 26 | 28 | 25 | |
| 47.5th | 12 | 4.4 | 4.3 | 4.0 | 4.5 | 6.2 | 9.5 | 13 | 21 | 25 | 27 | 18 |
Appendix J – Comparison of single and multiple application simulations based on revised drift percentiles
1.
For a GAP indicating multiple applications in a crop growing season, the FOCUS Surface Water Repair WG proposes to skip an additional simulation for a single application and to apply the 90th percentile drift for the last application for the multiple application simulation. The percentile for the other application would not change (i.e. the 70th percentile for the first five applications of a total number of six applications). This was changed because the assumption of a cumulative drift probability of 90th percentile to determine the PECmax is not justified, as the spray drift deposition events should be considered as separate events as they do not accumulate in the simulated watercourse, because very often the spray drift mass and resulting peak concentration have already flowed out before the next spray drift deposition event (for further information about the reasoning behind see Section 3.1.5). So finally only one simulation (multiple application) is performed.
To get an impression about the impact of this change compared with the current procedure, a number of simulations at FOCUS surface water Step 3 have been performed. For the test, three example pesticides were used which are already part of the installation package of SWASH (FOCUS A, H and 6). However, with regard to the degradation in sediment, a fixed number of 1,000 days (in line with FOCUS (2001) was considered for the simulations.
As the procedure is mainly influencing the entry route spray drift a worst‐case scenario with regard to this entry route was selected (pome/stone fruit, early applications). In all example simulations, the application pattern was six applications with 100 g/ha each and a minimum interval of 5 days between two applications. The start of the application window was set to 2 weeks before (leaf) emergence (default window in SWASH). If run‐off/drainage entries are the dominant entry route, the PECmax is always produced by the simulation with multiple applications. That does not change in the proposed procedure, and therefore, no test simulations were performed for this situation.
The results of the test are summarised in the table below.
Columns 5 and 6 in Table J.1 give the PECmax according to the current procedure for single and multiple application patterns, respectively. In the 7th column, the results of the proposed new procedure are presented. Column 8 shows the ratio between proposed and existing methodologies.
Table J.1.
Calculated PECmax (μg/L) for single (90th percentile drift) and multiple application (all 70th percentile drift) compared to the proposed multiple run (all 90th percentile drift)
| Test substance | Kfoc (mL/g) | DegT50 soil (day) | Scenario | Current procedure | New procedure | Ratio (new procedure vs worst case of current procedure) | |
|---|---|---|---|---|---|---|---|
| Single application (90th percentile) | Multiple application (all 70th percentile) | Last application (90th percentiles) | |||||
| FOCUS 6 | 66 | 28 | D3 (D) | 7.78 | 5.94 | 7.84 | 1.01 |
| FOCUS 6 | 66 | 28 | D4 (P) | 0.49 | 1.42 | 1.55 | 1.10 |
| FOCUS 6 | 66 | 28 | D4 (S) | 7.31 | 5.92 | 7.94 | 1.09 |
| FOCUS 6 | 66 | 28 | D5 (P) | 0.50 | 1.62 | 1.76 | 1.08 |
| FOCUS 6 | 66 | 28 | D5 (S) | 7.72 | 6.39 | 8.49 | 1.10 |
| FOCUS 6 | 66 | 28 | R1 (P) | 0.47 | 1.42 | 1.56 | 1.10 |
| FOCUS 6 | 66 | 28 | R1 (S) | 6.28 | 4.68 | 6.21 | 0.99 |
| FOCUS 6 | 66 | 28 | R2 (S) | 8.32 | 6.20 | 8.32 | 1.00 |
| FOCUS 6 | 66 | 28 | R3 (S) | 8.84 | 7.74 | 8.89 | 1.00 |
| FOCUS 6 | 66 | 28 | R4 (S) | 6.28 | 4.71 | 6.32 | 1.01 |
| FOCUS A | 10 | 3 | D3 (D) | 7.76 | 5.87 | 7.78 | 1.00 |
| FOCUS A | 10 | 3 | D4 (P) | 0.47 | 0.44 | 0.48 | 1.01 |
| FOCUS A | 10 | 3 | D4 (S) | 7.30 | 5.90 | 7.92 | 1.08 |
| FOCUS A | 10 | 3 | D5 (P) | 0.47 | 0.46 | 0.49 | 1.03 |
| FOCUS A | 10 | 3 | D5 (S) | 7.70 | 6.33 | 8.43 | 1.09 |
| FOCUS A | 10 | 3 | R1 (P) | 0.47 | 0.44 | 0.52 | 1.09 |
| FOCUS A | 10 | 3 | R1 (S) | 6.28 | 4.68 | 6.21 | 0.99 |
| FOCUS A | 10 | 3 | R2 (S) | 8.32 | 6.20 | 8.32 | 1.00 |
| FOCUS A | 10 | 3 | R3 (S) | 8.84 | 6.78 | 8.89 | 1.00 |
| FOCUS A | 10 | 3 | R4 (S) | 6.28 | 4.71 | 6.32 | 1.01 |
| FOCUS H | 100 | 300 | D3 (D) | 9.99 | 14.35 | 16.21 | 1.13 |
| FOCUS H | 100 | 300 | D4 (P) | 4.13 | 10.99 | 11.13 | 1.00 |
| FOCUS H | 100 | 300 | D4 (S) | 8.29 | 8.46 | 9.62 | 1.14 |
| FOCUS H | 100 | 300 | D5 (P) | 2.11 | 8.46 | 8.47 | 1.00 |
| FOCUS H | 100 | 300 | D5 (S) | 8.31 | 7.98 | 9.94 | 1.20 |
| FOCUS H | 100 | 300 | R1 (P) | 0.47 | 1.63 | 1.77 | 1.08 |
| FOCUS H | 100 | 300 | R1 (S) | 6.28 | 4.68 | 6.21 | 0.99 |
| FOCUS H | 100 | 300 | R2 (S) | 8.32 | 6.20 | 8.32 | 1.00 |
| FOCUS H | 100 | 300 | R3 (S) | 8.84 | 8.28 | 8.89 | 1.00 |
| FOCUS H | 100 | 300 | R4 (S) | 6.28 | 4.71 | 6.32 | 1.01 |
(D) = ditch, (S) = stream, (P) = pond.
In all R‐stream scenarios, the same results are calculated with the proposed procedure as with the worst case from single/multiple applications. The background is illustrated in the following three figures (example R2‐stream scenario, substance FOCUS H, please compare Figures J.1, J.2 and J.3).
Figure J.3.
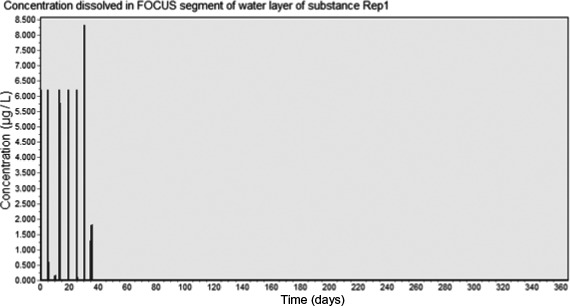
Time‐dependent concentration in surface water (R2 stream) with proposed new application scheme
The reasoning of this outcome is that, in run‐off stream scenarios dominated by spray drift, the background surface water concentrations on the day of application can be neglected. The only relevant entry route is spray drift. As the percentile of the single application is the same as the first application in the proposed procedure, the PECmax are identical.
For pond scenarios, the proposed procedure may lead to slightly higher concentrations (maximum deviation about 10%, no graphs presented) due to accumulation of entries from previous applications. However, these concentrations are always significantly below the respective stream scenarios.
For drainage scenarios, the differences between current and proposed procedure may be bigger, especially for persistent compounds with low sorption constants. The background is that these compounds show lower background concentrations in the current run with single applications compared with the run with multiple applications. In the proposed procedure, the 90th percentile drift entry is always used for the multiple application run (high background concentrations from drainage). That may finally result in higher concentrations in the proposed procedure compared to current single and multiple applications. As you can see from the following figures, that is more a problem of the current system than a problem of the proposed procedure. The comparison of Figures J.4 and J.5 shows that in the current system, the run with single applications (Figure J.5) delivers the maximum concentration and it is considered for the risk assessment. However, that does not make sense as these background concentrations (from drainage inputs based on a single application) are clearly the wrong choice when the substance is in fact applied several times within a season. The proposed procedure could solve this logical problem as well (see Figure J.6).
Figure D.12.
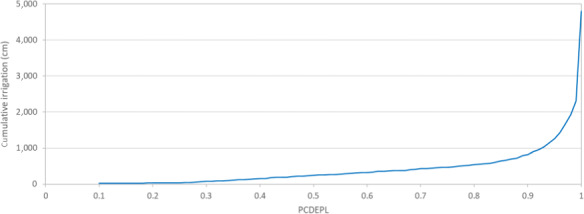
Total irrigation volumes in PRZM over 20 years for different values of PCDEPL (R1, maize, new irrigation option 7)
- FLEACH = 0; RATEAP = 0.125 cm/h = 30 mm/day.
Figure D.13.
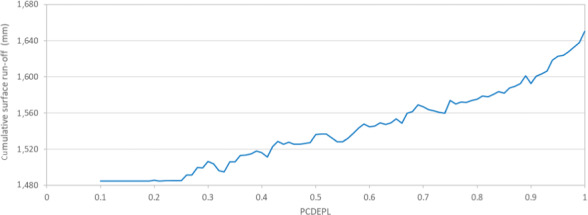
Total surface run‐off volumes in PRZM over 20 years for different values of PCDEPL (R1, maize, new irrigation option 7)
- FLEACH = 0; RATEAP = 0.125 cm/h = 30 mm/day.
Figure J.4.
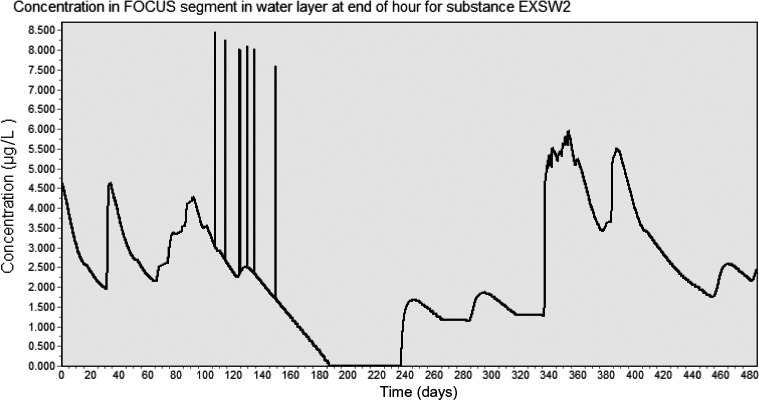
Time‐dependent concentration in surface water (D4 stream) with current multiple application scheme (FOCUS H)
Figure J.5.
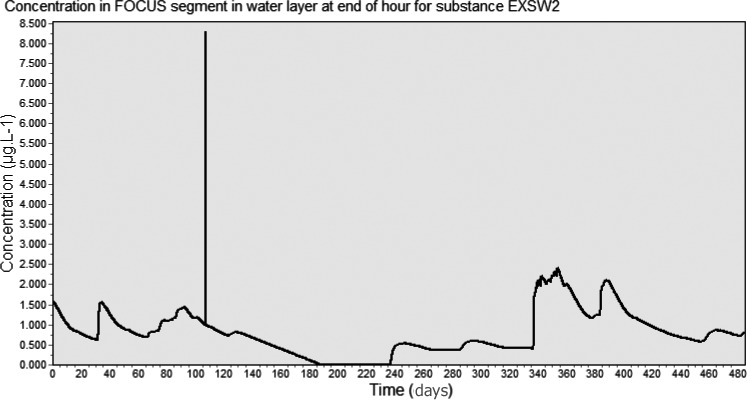
Time‐dependent concentration in surface water (D4 stream) with current single application scheme (FOCUS H)
Figure J.6.
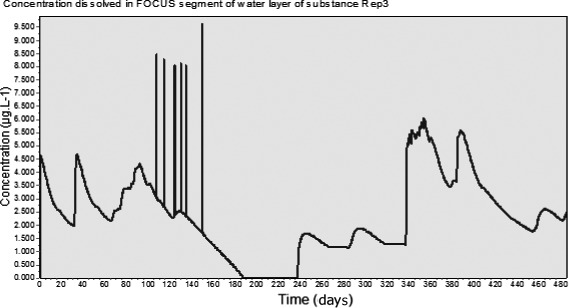
Time‐dependent concentration in surface water (D4 stream) with proposed new application scheme (FOCUS H)
The following conclusions can be drawn from this comparison:
The proposed new procedure gives usually similar results as the current procedure, but it is able to save 50% of the time for performing the simulations.
The same results will be simulated if the PECmax is dominated by drainage or run‐off entries.
If spray drift is the dominant entry route similar results will be simulated, as in the current procedure for R‐stream scenarios (new procedure is at most 1% above current procedure for persistent compounds).
If spray drift is the dominant entry route higher concentrations (up to 10%) could be simulated for pond scenarios, especially for persistent compounds with low sorption constants. However, these concentrations are always significantly below respective stream results.
If spray drift is the dominant entry route higher concentrations (up to 20%) could be simulated for D‐stream scenarios, especially for persistent compounds with low sorption constants.
The proposed procedure is not less conservative as in no situation lower concentrations are simulated than with the current procedure.
Appendix K – Example calculations – current vs. new approach
1.
The following model versions have been used to calculate these examples:
FOCUS SWASH 6.4 (11 December 2019)
FOCUS_PRZM_SW_5.3.2 (12 December 2019)
MACRO‐in‐FOCUS 5.5.4 (29 January 2020)
FOCUS TOXSWA 6.6.4 (11 November 2019), TOXSWA 3.3.7‐R (11 November 2019)
SPIN 3.3 (6 December 2018)
AppDate 3.08 (20 December 2019)
PAT (10 October 2019)
p2t maker (v1.2019.10402.3).
Please be aware that these versions are not necessarily the final ones. In this respect, results presented in these working examples may change on release of the final versions.
The following issues have been addressed in these examples:
impact of application timing
multiple applications
PEC in sediment.
Additionally, results for some standard situations (two pesticides in all FOCUS sw scenarios) are given as well. These additional standard runs should give some further impression on how the new 20‐year assessment approach compares with the current FOCUS approach.
The following (dummy) pesticides have been used in these working examples (Table K.1).
Table K.1.
Properties of pesticides A, C, F and I used in these working examples
| Substance property | Pesticide | |||
|---|---|---|---|---|
| A | C | F | I | |
| Molar mass (g/mol) | 300 | |||
| Vapour pressure (Pa at 20°C) | 1.0 × 10⁻⁷ | |||
| Water solubility (mg/L at 20°C) | 1.0 | |||
| Koc (mL/g) | 10 | 1,000 | 1,000 | 1,000 |
| Kom (mL/g) | 5.8 | 580 | 580 | 580 |
| Freundlich exponent (1/n) (–) | 1 | |||
| DegT50 soil (day) | 3 | 3 | 30 | 300 |
| DegT50 water (day) | 1 | 1 | 10 | 100 |
| DegT50 sediment (day) | 3 | 3 | 30 | 300 |
| DegT50 crop (day) | 10 | |||
| Wash‐off coefficient (cm−1) | 1 | |||
| Plant uptake factor | 0 | |||
| Effect of temperature on transformation in soil (MACRO) | 0.0948 | |||
| Exponent for the effect of moisture content on transformation rate in soil (–) | 0.49 | |||
K.1. Impact of application timing
One of the major flaws of the current FOCUS (2001) approach is that results may strongly depend on the exact timing of the application window if PECs are driven by drainage or run‐off. This is particularly true for substances that are sensitive to the rainfall pattern, i.e. for short‐living substances in soil. These examples are intended to demonstrate this flaw in the current 16‐month assessment approach and to demonstrate how it is handled in the new 20‐year assessment approach.
Let us first assume a single ground spray application of pesticide A or of pesticide F with an application rate of 1 kg/ha in winter cereals in the FOCUS sw drainage scenario D2 (ditch). Let us further assume that the intended application date should be somewhere from the 25 May to 28 May (corresponding to BBCH 47 for winter cereals in D2). This 4‐day period is rather short and a robust exposure assessment should give similar results for each of the four possible intended application dates.
Note that in the current FOCUS approach, there is no ‘intended application date’. In analogy with the default setting of the application window in the current FOCUS approach (representing application ‘at emergence’), the application window for the current approach (31 days) is assumed to start 15 days before and to end 15 days after the indented application date. In the new assessment approach, the application window (7 days for a single application) is by default set ± 3 days around the intended application date.
Tables K.2 and K.3 give obtained PECsw for pesticide A and F for each of the four possible application dates based on the current and the new assessment approach.
Table K.2.
PECsw (μg/L) obtained for pesticide A in the drainage scenario D2 (ditch) based on the current and the new assessment approach following a single ground spray application of 1 kg/ha in winter cereals with an intended application date on 25, 26, 27 or 28 May
| Intended application date | Current approach (FOCUS, 2001) | New approach | |||
|---|---|---|---|---|---|
| Application windowa (number of days) | PECsw (μg/L) | Application window (number of days) | Temporal perc. | PECsw (μg/L) | |
| 25/05 | 10/05 – 09/06 (31) | 312.7 | 22/05 – 28/05 (7) | 47.5th | 221 |
| 57.5th | 383 | ||||
| 67.5th | 464 | ||||
| 77.5th | 759 | ||||
| 87.5th | 827 | ||||
| 26/05 | 11/05 – 10/06 (31) | 352.0 | 23/05 – 29/05 (7) | 47.5th | 242 |
| 57.5th | 394 | ||||
| 67.5th | 563 | ||||
| 77.5th | 805 | ||||
| 87.5th | 827 | ||||
| 27/05 | 12/05 – 11/06 (31) | 27.9 | 24/05 – 30/05 (7) | 47.5th | 255 |
| 57.5th | 394 | ||||
| 67.5th | 563 | ||||
| 77.5th | 616 | ||||
| 87.5th | 876 | ||||
| 28/05 | 13/05 – 12/06 (31) | 27.9 | 25/05 – 31/05 (7) | 47.5th | 242 |
| 57.5th | 383 | ||||
| 67.5th | 533 | ||||
| 77.5th | 616 | ||||
| 87.5th | 827 | ||||
Start of application window (31 days) set to 15 days before the intended application date.
Table K.3.
PECsw (μg/L) obtained for pesticide F in the drainage scenario D2 (ditch) based on the current and the new assessment approach following a single ground spray application of 1 kg/ha in winter cereals with an intended application date on 25, 26, 27 or 28 May
| Intended application date | Current approach (FOCUS, 2001) | New approach | |||
|---|---|---|---|---|---|
| Application windowa (number of days) | PECsw (μg/L) | Application window (number of days) | Temporal perc. | PECsw (μg/L) | |
| 25/05 | 10/05 – 09/06 (31) | 6.89 | 22/05 – 28/05 (7) | 47.5th | 6.80 |
| 57.5th | 6.81 | ||||
| 67.5th | 6.91 | ||||
| 77.5th | 6.93 | ||||
| 87.5th | 7.00 | ||||
| 26/05 | 11/05 – 10/06 (31) | 6.87 | 23/05 – 29/05 (7) | 47.5th | 6.82 |
| 57.5th | 6.84 | ||||
| 67.5th | 6.91 | ||||
| 77.5th | 6.96 | ||||
| 87.5th | 6.97 | ||||
| 27/05 | 12/05 – 11/06 (31) | 6.98 | 24/05 – 30/05 (7) | 47.5th | 6.80 |
| 57.5th | 6.84 | ||||
| 67.5th | 6.91 | ||||
| 77.5th | 7.00 | ||||
| 87.5th | 7.05 | ||||
| 28/05 | 13/05 – 12/06 (31) | 6.97 | 25/05 – 31/05 (7) | 47.5th | 6.79 |
| 57.5th | 6.87 | ||||
| 67.5th | 6.91 | ||||
| 77.5th | 6.92 | ||||
| 87.5th | 7.03 | ||||
Start of application window (31 days) set to 15 days before the intended application date.
The second example is similar to that before. Now we consider a single granular application (1 kg/ha) of substance A in maize in the FOCUS sw run‐off scenario R2 with possible intended application dates from 23 May to 26 May (corresponding to BBCH 16 for maize R2).
Tables K.4 and K.5 give obtained PECsw for pesticide A and F each of the four intended application dates based on the current and the new approach. Note that this example may indeed be considered worst case with respect to the sensitivity of the exposure calculation for application timing, as there is no drift deposition to the waterbody in this case.
Table K.4.
PECsw (μg/L) obtained for pesticide A in the run‐off scenario R2 (stream) based on the current and the new assessment approach following a single granular application of 1 kg/ha in maize with an intended application date on 23, 24, 25 or 26 May
| Intended application date | Current approach (FOCUS, 2001) | New approach | |||
|---|---|---|---|---|---|
| Application windowa (number of days) | PECsw (μg/L) | Application window (number of days) | Temp. perc. | PECsw (μg/L) | |
| 23/05 | 08/05 – 07/06 (31) | 20.4 | 20/05 – 26/05 (7) | 47.5th | 0.517 |
| 57.5th | 1.54 | ||||
| 67.5th | 2.37 | ||||
| 77.5th | 4.30 | ||||
| 87.5th | 5.02 | ||||
| 24/05 | 09/05 – 08/06 (31) | 24.3 | 21/05 – 27/05 (7) | 47.5th | 0.572 |
| 57.5th | 1.63 | ||||
| 67.5th | 2.53 | ||||
| 77.5th | 4.66 | ||||
| 87.5th | 5.07 | ||||
| 25/05 | 10/05 – 09/06 (31) | 0.390 | 22/05 – 28/05 (7) | 47.5th | 0.472 |
| 57.5th | 1.74 | ||||
| 67.5th | 2.70 | ||||
| 77.5th | 5.02 | ||||
| 87.5th | 5.38 | ||||
| 26/05 | 11/05 – 10/06 (31) | 0.390 | 23/05 – 29/05 (7) | 47.5th | 0.472 |
| 57.5th | 1.85 | ||||
| 67.5th | 2.87 | ||||
| 77.5th | 5.38 | ||||
| 87.5th | 7.62 | ||||
Start of application window (31 days) set to 15 days before the intended application date.
Table K.5.
PECsw (μg/L) obtained for pesticide F in the run‐off scenario R2 based on the current and the new assessment approach following a single granular application of 1 kg/ha in maize with an intended application date on 23, 24, 25 or 26 May
| Intended application date | Current approach (FOCUS, 2001) | New approach | |||
|---|---|---|---|---|---|
| Application windowa (number of days) | PECsw (μg/L) | Application window (number of days) | Temp. perc. | PECsw (μg/L) | |
| 23/05 | 08/05 – 07/06 (31) | 3.04 | 20/05 – 26/05 (7) | 47.5th | 2.65 |
| 57.5th | 2.71 | ||||
| 67.5th | 3.14 | ||||
| 77.5th | 3.33 | ||||
| 87.5th | 3.79 | ||||
| 24/05 | 09/05 – 08/06 (31) | 3.08 | 21/05 – 27/05 (7) | 47.5th | 2.67 |
| 57.5th | 2.72 | ||||
| 67.5th | 3.17 | ||||
| 77.5th | 3.35 | ||||
| 87.5th | 3.79 | ||||
| 25/05 | 10/05 – 09/06 (31) | 2.86 | 22/05 – 28/05 (7) | 47.5th | 2.64 |
| 57.5th | 2.73 | ||||
| 67.5th | 2.99 | ||||
| 77.5th | 3.28 | ||||
| 87.5th | 3.46 | ||||
| 26/05 | 11/05 – 10/06 (31) | 2.86 | 23/05 – 29/05 (7) | 47.5th | 2.66 |
| 57.5th | 2.75 | ||||
| 67.5th | 2.99 | ||||
| 77.5th | 3.30 | ||||
| 87.5th | 3.46 | ||||
Start of application window (31 days) set to 15 days before the intended application date.
For the pesticide A, which is sensitive to the rainfall pattern, PECsw obtained based on the current approach strongly depend on the exact timing of the application window in both scenarios (D2 and R2). This implies that for these situations the exposure assessment cannot be considered sufficiently robust. Note that such periods with ‘erratic’ fluctuations in PEC values can be found in all FOCUS sw scenarios all year round depending on the actual rainfall pattern in the 16‐month assessment period.
The new 20‐year assessment approach is indeed much less sensitive to the application timing. Although not demonstrated in this working example, this is the case all year round in all FOCUS sw scenarios (also refer to Appendix I). There are of course still fluctuations in PECs depending on the application timing. However, these fluctuations are less pronounced compared to the current approach. Note that extending the assessment period to even 100 years did not much improve the overall situation (as tested by the FOCUS Surface Water Repair WG; data not shown). Due to the model concepts in PRZM, MACRO and TOXSWA, some fluctuations in PECs depending on the application timing are unavoidable.
For pesticides that are less sensitive to the rainfall pattern (pesticide F in this working example), the sensitivity of the current system for the exact application timing is much less pronounced. Indeed, for this kind of pesticides, the current approach appears to be sufficiently robust (at least in these two working examples).
K.2. Multiple applications
These two examples are intended to demonstrate the impact of the revised drift percentile approach in the new 20‐year assessment approach. It is also demonstrated that the selection of the temporal percentile has a limited impact on results obtained as long as the overall exposure assessment is driven by drift (which is the case in the first of these two working examples).
Let us first assume a multiple air blast application of pesticide C in the FOCUS sw run‐off scenario R1 in pome/stone fruit with eight applications, an individual application rate of 1 kg/ha and application intervals of 7 days each. The intended application should cover the BBCH range from 09 to 69 with the first intended application at emergence (= BBCH 09, which is the 15 April for pome/stone fruit in R1).
In the current FOCUS approach, it is necessary to select either ‘pome/stone fruit, early application’ or ‘pome/stone fruit, late application’. Note that these two settings differ in their drift curves. As the first application should be at emergence, we select ‘pome/stone fruit, early application’ in the current FOCUS approach. By default, the application window for eight applications at 7‐day intervals starts 15 days before emergence (1 April) and ends at 19 June, so covering 80 days.
For multiple applications, it is further requested to perform an additional calculation based on a single application to account for higher drift percentiles for a single application (which may lead to higher PEC results). Unfortunately, the guidance does not give advice on the application timing for this single application run. As can be seen in the second example below, the selection of the application window for the single application is not straightforward and may indeed affect final results obtained. However, in this first example, it can be deduced from the multiple application run, that the exposure assessment is driven by drift. In this case, the application timing for the additional single application is less critical, so we simply keep the default application window for the multiple application, but decrease the number of applications to only one.
In the new 20‐year assessment approach, there is no need to decide on ‘early’ or ‘late application’ (with different drift curves) as this is internally performed by SWASH (based on the BBCH stage). So, we simply select ‘pome/stone fruit’ and set the BBCH period to 09–69 with ‘forward calculation’. SWASH then automatically determines the intended application dates starting from 15 April (first date for BBCH 09) and ending at 3 June. SWASH also tells you, that the date 3 June is related to BBCH 55 for pome/stone fruit in R1. Note that it would also be possible to tell SWASH that the last application should be at BBCH 69 (so‐called backward calculation in SWASH). This second approach is not accounted for in this working example.
In the new 20‐year assessment approach, there is no need to perform an additional single application run, as the higher percentile for a single application is already accounted for in the multiple application run.
Table K.6 gives the obtained PECsw for the current (multiple and single application) and the new assessment approach (multiple application, only). In all cases, PECs in surface water are driven by drift. This implies that results obtained for multiple applications are systematically higher in the new assessment approach, as drift for the last application (out of eight applications) is set to the 90th percentile, whereas in the current approach, all drift events are set to 67th percentile. For the same reason, results obtained for the new assessment approach are basically in line with results obtained for a single application in the current approach. Note that in this example PECsw results obtained are driven by drift. So, the impact of the temporal percentile in the new assessment approach is limited.
Table K.6.
PECsw (μg/L) obtained for pesticide C in the run‐off scenario R1 based on the current and the new assessment approach following multiple air blast applications (8 × 1 kg/ha, 7‐day interval) in pome/stone fruit at BBCH 09–69 with the first intended application at emergence (BBCH 09)
| Current approach (FOCUS, 2001) | New approach | |||||||||
|---|---|---|---|---|---|---|---|---|---|---|
| Crop | Application approach | Application window (number of days) | Waterbody | PECsw (μg/L) | Driven by | Crop | Application window (number of days) | Waterbody | Temp. perc. | PECsw (μg/L) |
| Pome/stone fruit, early appln | Multiple application | 01/04 – 19/06a (80) | Pond | 3.79 | Drift | Pome/ stone fruit | 12/04 – 06/06 (56) | Pond | 47.5th | 4.90 |
| 57.5th | 4.92 | |||||||||
| 67.5th | 4.94 | |||||||||
| 77.5th | 5.03 | |||||||||
| 87.5th | 5.29 | |||||||||
| Stream | 45.6 | Drift | Stream | 47.5th | 63.1 | |||||
| 57.5th | 63.2 | |||||||||
| 67.5th | 63.2 | |||||||||
| 77.5th | 63.2 | |||||||||
| 87.5th | 63.2 | |||||||||
| Single application | 01/04 – 19/06 (80) | Pond | 4.72 | Drift | Not required (covered by multiple application approach) | |||||
| Stream | 62.8 | Drift | ||||||||
Default application window in the current approach for eight applications with an interval of 7 days each.
In the second example, we consider a multiple air blast application of pesticide A in vines. Application rates, number and application timing (BBCH 09–69) is the same as for the first example. Similar to pome/stone fruit, the current FOCUS approach requires differentiating between early and late application for vines with different drift curves. As applications should start at emergence, we select vines, early application. Note that in the new assessment approach, there is only one drift curve left for vines (i.e. drift for late application). So, there is no need to differentiate between early or late application.
Although for multiple application, PECsw results in the current assessment approach are driven by run‐off (see Table 7), it is a priori not clear whether an additional calculation based on a single application with a higher drift percentile may give higher PECs or not. The question is when to set the application window for this additional single application run. The application window could be set, e.g. to the start, mid or end of the entire application window for the multiple application assessment. It is also possible to keep the application window for multiple applications and to decrease the number of applications to one only. Note that there is no guidance on when to set the application window for the required additional single application run. In this working example, the four options stated above have been applied.
Table K.7 gives obtained PECsw for pesticide A for the current (multiple and single application with different options for the single application window) and the new assessment approach (multiple application, only). In contrast with the first example, PECsw are now partly driven by run‐off. This makes it difficult to set an appropriate application window for the requested additional single application run. In this working example, setting the application window for this single application run to the end of the application window gives indeed higher PECsw compared with the multiple application run. The other three options for the single application run give lower results. So, in principle, it would be necessary to always investigate different application windows for the additional single application run, which, in practice, is never performed.
The new assessment approach adequately covers both approaches (multiple runs and singe application run) in the current approach within one run only. However, as results are now driven by run‐off, the impact of the temporal percentile in the new assessment approach is more pronounced.
Table K.7.
PECsw (μg/L) obtained for pesticide A in the run‐off scenario R1 based on the current and the new assessment approach following multiple air blast applications (8 × 1 kg/ha, 7 day interval) in vines at BBCH 09–69 with the first intended application date at emergence (BBCH 09)
| Current approach (FOCUS, 2001) | New approach | |||||||||
|---|---|---|---|---|---|---|---|---|---|---|
| Crop | Application approach | Application window (numbers of days) | Waterbody | PECsw (μg/L) | Driven by | Crop | Application window (numbers of days) | Waterbody | Temp. perc. | PECsw (μg/L) |
| Vines, early appln | Multiple application | 01/04 – 19/06 (80)a | Pond | 0.204 | Run‐off | Vines | 12/04 – 06/06 (56) | Pond | 47.5th | 0.223 |
| 57.5th | 0.368 | |||||||||
| 67.5th | 0.675 | |||||||||
| 77.5th | 0.966 | |||||||||
| 87.5th | 3.03 | |||||||||
| Stream | 17.9 | Run‐off | Stream | 47.5th | 10.7 | |||||
| 57.5th | 16.5 | |||||||||
| 67.5th | 18.1 | |||||||||
| 77.5th | 33.8 | |||||||||
| 87.5th | 42.9 | |||||||||
| Single application, start | 01/04 – 01/05 (31) | Pond | 0.193 | Drift | Not required (covered by multiple application approach) | |||||
| Stream | 4.12 | Drift | ||||||||
| Single application, mid | 26/04 – 26/05 (31) | Pond | 0.193 | Drift | ||||||
| Stream | 4.12 | Drift | ||||||||
| Single application, end | 20/05 – 19/06 (31) | Pond | 0.238 | Run‐off | ||||||
| Stream | 20.6 | Run‐off | ||||||||
| Single application, entire period | 01/04 – 19/06 (80) | Pond | 0.193 | Drift | ||||||
| Stream | 4.12 | Drift | ||||||||
Default application window in the current approach for eight applications with an interval of 7 days each.
K.3. PEC in sediment
This working example gives sediment PEC results for a persistent pesticide (pesticide I) following a single ground spray application of 1 kg/ha in winter cereals at emergence (BBCH 09) in all FOCUS sw scenarios. To account for accumulation in sediment in the current FOCUS assessment approach, option 1 and option 2 as described in Appendix M have been applied (for details please refer to Appendix M). Option 3 (repeating TOXSWA several times setting the initial amount of substance present in the sediment to the amount of substance present in sediment at the end of each run) was not applied in this working example.
Note that for the new assessment approach, there is no need to further process results on sediment PEC obtained. In this working example, sediment PEC values are given based on total sediment dry weight (μg/kg dw). Note that the new assessment approach also gives sediment PEC values expressed based on total OM (μg/kg OM) or based on sediment pore water (μg/L).
Table K.8 gives obtained PECsed results for the current FOCUS approach, applying two corrections (option 1 and 2) to account for accumulation, vs. the new 20‐year assessment approach. It is noted option 2 gives consistently lower PECsed values compared to option 1, which also takes into account temperature in the sediment. Results obtained based on the new approach are, overall, well in line or more conservative than the current approach, corrected with option 2. An exception is the R3 stream, where PECsed results of the new approach are significantly lower than the option 2 values of the current approach. Similar to PECsw, PECsed results in the new approach strongly depend on the temporal percentile if exposure is driven by drainage or run‐off.
Table K.8.
PECsw (μg/L) and PECsed (μg/kg) obtained for pesticide I in all FOCUS sw scenarios based on the current and the new assessment approach following a single ground spray application of 1 kg/ha in winter cereals with an intended application date at emergence (BBCH 09)
| FOCUS scenario | Waterbody | Current approach (FOCUS, 2001) | New approach | |||||||
|---|---|---|---|---|---|---|---|---|---|---|
| Application windowa (number of days) | Single‐year assessment | Accumulation assessment | Application window (number of days) | Temp. perc. | PECsw (μg/L) | PECsed (μg/kg) | ||||
| Option 1 | Option 2 | |||||||||
| PECsw (μg/L) | PECsed (μg/kg) | PECsed (μg/kg) | PECsed (μg/kg) | |||||||
| D1 | Ditch | 11/09 – 11/10 (31) | 50.1 | 243 | 915 | 427 | 22/09 – 28/09 (7) | 47.5th | 42.7 | 1,103 |
| 57.5th | 43.2 | 1,115 | ||||||||
| 67.5th | 45.3 | 1,168 | ||||||||
| 77.5th | 45.6 | 1,229 | ||||||||
| 87.5th | 45.8 | 1,286 | ||||||||
| Stream | 31.9 | 137 | 516 | 240 | 47.5th | 26.8 | 604 | |||
| 57.5th | 28.0 | 614 | ||||||||
| 67.5th | 28.7 | 615 | ||||||||
| 77.5th | 28.9 | 659 | ||||||||
| 87.5th | 29.0 | 687 | ||||||||
| D2 | Ditch | 11/10 – 10/11 (31) | 59.6 | 253 | 841 | 444 | 22/10 – 28/10 (7) | 47.5th | 57.2 | 852 |
| 57.5th | 57.3 | 905 | ||||||||
| 67.5th | 59.5 | 914 | ||||||||
| 77.5th | 61.3 | 978 | ||||||||
| 87.5th | 64.8 | 1,037 | ||||||||
| Stream | 37.4 | 143 | 476 | 251 | 47.5th | 35.7 | 473 | |||
| 57.5th | 35.8 | 482 | ||||||||
| 67.5th | 38.0 | 520 | ||||||||
| 77.5th | 38.3 | 546 | ||||||||
| 87.5th | 40.4 | 566 | ||||||||
| D3 | Ditch | 07/11 – 07/12 (31) | 6.32 | 2.41 | 7.20 | 4.23 | 18/11 – 24/11 (7) | 47.5th | 6.39 | 23.1 |
| 57.5th | 6.48 | 25.6 | ||||||||
| 67.5th | 6.61 | 30.4 | ||||||||
| 77.5th | 6.68 | 33.7 | ||||||||
| 87.5th | 6.82 | 34.7 | ||||||||
| D4 | Pond | 08/09 – 08/10 (31) | 8.28 | 44.9 | 157 | 78.8 | 19/09 – 25/09 (7) | 47.5th | 1.61 | 44.1 |
| 57.5th | 2.01 | 77.5 | ||||||||
| 67.5th | 5.14 | 131 | ||||||||
| 77.5th | 6.64 | 164 | ||||||||
| 87.5th | 7.55 | 172 | ||||||||
| Stream | 10.7 | 16.9 | 59.0 | 29.7 | 47.5th | 5.48 | 21.3 | |||
| 57.5th | 5.48 | 29.9 | ||||||||
| 67.5th | 5.48 | 55.1 | ||||||||
| 77.5th | 9.41 | 74.8 | ||||||||
| 87.5th | 10.2 | 79.1 | ||||||||
| D5 | Pond | 27/10 – 26/11 (31) | 4.95 | 32.4 | 90.4 | 56.9 | 07/11 – 13/11 (7) | 47.5th | 4.32 | 120 |
| 57.5th | 5.47 | 149 | ||||||||
| 67.5th | 5.59 | 171 | ||||||||
| 77.5th | 7.36 | 183 | ||||||||
| 87.5th | 8.56 | 226 | ||||||||
| Stream | 6.83 | 8.63 | 24.1 | 15.1 | 47.5th | 5.91 | 36.9 | |||
| 57.5th | 6.07 | 43.2 | ||||||||
| 67.5th | 6.32 | 53.7 | ||||||||
| 77.5th | 6.87 | 56.0 | ||||||||
| 87.5th | 7.84 | 63.4 | ||||||||
| D6 | Ditch | 16/11 – 16/12 (31) | 34.8 | 26.5 | 52.2 | 46.5 | 27/11 – 03/12 (7) | 47.5th | 19.6 | 147 |
| 57.5th | 26.4 | 161 | ||||||||
| 67.5th | 29.5 | 177 | ||||||||
| 77.5th | 33.4 | 188 | ||||||||
| 87.5th | 38.1 | 199 | ||||||||
| R1 | Pond | 29/11 – 28/11 (31) | 0.989 | 4.59 | 13.7 | 8.06 | 09/12 – 15/12 (7) | 47.5th | 0.884 | 18.6 |
| 57.5th | 1.04 | 23.5 | ||||||||
| 67.5th | 1.05 | 25.6 | ||||||||
| 77.5th | 1.68 | 31.5 | ||||||||
| 87.5th | 1.76 | 33.1 | ||||||||
| Stream | 9.82 | 3.45 | 10.3 | 6.06 | 47.5th | 8.77 | 17.5 | |||
| 57.5th | 8.89 | 19.3 | ||||||||
| 67.5th | 9.23 | 21.2 | ||||||||
| 77.5th | 9.98 | 27.7 | ||||||||
| 87.5th | 10.7 | 31.1 | ||||||||
| R3 | Stream | 17/11 – 17/12 (31) | 12.6 | 120 | 275 | 211 | 28/11 – 04/12 (7) | 47.5th | 10.3 | 22.9 |
| 57.5th | 10.6 | 26.9 | ||||||||
| 67.5th | 10.7 | 34.2 | ||||||||
| 77.5th | 11.3 | 42.0 | ||||||||
| 87.5th | 11.4 | 50.5 | ||||||||
| R4 | Stream | 27/10 – 26/11 (31) | 12.5 | 5.54 | 12.9 | 9.7 | 07/11 – 13/11 (7) | 47.5th | 13.0 | 49.6 |
| 57.5th | 14.0 | 51.7 | ||||||||
| 67.5th | 14.4 | 55.6 | ||||||||
| 77.5th | 15.2 | 77.0 | ||||||||
| 87.5th | 18.3 | 87.0 | ||||||||
Default application window in the current FOCUS approach considered to represent an intended application at emergence (BBCH 09).
K.4. Standard runs, new vs. old assessment approach
The following working examples provide water and sediment PEC results based on the current and the new assessment approach for pesticide A and F in all FOCUS sw scenarios. The following crop/application combinations have been considered:
field beans, 1 × 1 kg/ha, granular application, emergence (BBCH 09);
winter cereals, 1 × 1 kg/ha, ground spray, emergence (BBCH 09);
maize, 4 × 1 kg/ha, 7‐day interval, ground spray, BBCH 09–39 (starting at BBCH 09);
pome/stone fruit (‘early’ in the current approach), 8 × 1 kg/ha, 7‐day interval, air blast, BBCH 09–69 (starting at BBCH 09);
citrus, 8 × 1 kg/ha, 7‐day interval, air blast (starting at 1 March).
In the current FOCUS approach, the default application window is considered to represent application at emergence (BBCH 09). For multiple applications, the application window has been extended according to FOCUS (2001). For citrus, the first day of the application window for the current FOCUS approach was set to 14 February (i.e. 15 days before the first intended application date, which is 1 March).
Note that for multiple applications, no additional single application has been calculated for the current FOCUS approach.
Results obtained (Tables A.7, B.1, B.2, C.1–K.13) are not discussed further.
Table C.1.
Summary of annual precipitation (without snowfall) and run‐off for the R1‐Weiherbach, R2‐Porto, R3‐Bologna and R4‐Roujan scenario (winter cereals for R1, R3 and R4; maize for R2; all crops non‐irrigated)
| R1‐Weiherbach | R2‐Porto | R3‐Bologna | R4‐Roujan | |||||
|---|---|---|---|---|---|---|---|---|
| Year | Precipitation (mm) | Run‐off (mm) | Precipitation (mm) | Run‐off (mm) | Precipitation (mm) | Run‐off (mm) | Precipitation (mm) | Run‐off (mm) |
| 1969 | 680 | 28 | 1,707 | 311 | 705 | 72 | 1,024 | 163 |
| 1970 | 864 | 86 | 1,866 | 470 | 558 | 99 | 583 | 34 |
| 1971 | 603 | 29 | 1,309 | 263 | 723 | 83 | 493 | 40 |
| 1972 | 631 | 43 | 1,054 | 109 | 1118 | 230 | 960 | 308 |
| 1973 | 789 | 35 | 1,906 | 439 | 725 | 115 | 998 | 268 |
| 1974 | 883 | 105 | 1,241 | 173 | 688 | 106 | 1,119 | 288 |
| 1975 | 807 | 70 | 1,127 | 173 | 815 | 125 | 702 | 70 |
| 1976 | 631 | 43 | 1,434 | 330 | 790 | 71 | 1,024 | 218 |
| 1977 | 681 | 24 | 1,906 | 439 | 688 | 106 | 995 | 223 |
| 1978 | 909 | 127 | 1,707 | 427 | 765 | 93 | 720 | 102 |
| 1979 | 659 | 17 | 1,712 | 346 | 725 | 115 | 816 | 167 |
| 1980 | 789 | 35 | 1,241 | 173 | 724 | 71 | 497 | 53 |
| 1981 | 883 | 105 | 1,354 | 305 | 546 | 46 | 623 | 70 |
| 1982 | 864 | 89 | 1,302 | 219 | 633 | 58 | 649 | 135 |
| 1983 | 680 | 31 | 1,377 | 248 | 461 | 54 | 548 | 91 |
| 1984 | 817 | 38 | 1,839 | 470 | 727 | 83 | 812 | 177 |
| 1985 | 603 | 29 | 1,505 | 382 | 406 | 18 | 573 | 79 |
| 1986 | 867 | 82 | 1,587 | 371 | 970 | 119 | 932 | 193 |
| 1987 | 778 | 17 | 1,866 | 470 | 450 | 70 | 1,119 | 287 |
| 1988 | 911 | 32 | 1,257 | 211 | 496 | 40 | 960 | 310 |
| 1989 | 628 | 21 | 1,369 | 306 | 692 | 130 | 444 | 71 |
| 1990 | 616 | 31 | 1,161 | 239 | 558 | 99 | 583 | 34 |
| 1991 | 501 | 39 | 1,309 | 263 | 486 | 77 | 493 | 40 |
| 1992 | 588 | 28 | 807 | 128 | 1118 | 230 | 998 | 267 |
| 1993 | 624 | 21 | 1,053 | 109 | 833 | 138 | 660 | 146 |
| 1994 | 405 | 9 | 1,126 | 162 | 705 | 111 | 859 | 236 |
| Mean of 20 years | 712 | 44 | 1,402 | 288 | 679 | 93 | 750 | 149 |
Table D.1.
Comparison of the irrigation methodologies in different frameworks
| General topic | FOCUS surface water (FOCUS, 2001) | New FOCUS groundwater (European Commission, 2014) and PEC soil (EFSA, 2017) | Internal PRZM irrigation routines (Carsel et al., 2003; Suárez, 2005) | |
|---|---|---|---|---|
| Calculation of soil moisture deficit and irrigation threshold | Measure | Total plant‐available soil water, summed up over the root zone | Soil moisture deficit (= difference field capacity (FC) – current water content, summed up over the root zone) | Total plant‐available soil water, summed up over the root zone |
| Meaning of ‘root zone’ | Calculated to max. root depth or current root depth? | Calculated to current root depth (since FOCUS PELMO v.4.4.3)a | Calculated to maximum root depth in winprzm.exe (v.4.63) included in the latest official FOCUS surface water PRZM release. However, the code was recently changed to use current root depth | |
| Remarks | Water balance calculated with ISAREG model; unclear quantities ‘effective precipitation’ and ‘deep percolation’b | Routines poorly documented in manual code is better documented, but difficult to read for non‐programmers | ||
| Irrigation period and triggering | Checking | Continuous checking | Check every week on a fixed weekday | Continuous checking |
| Trigger | Total plant‐available soil water storage drops to Rmin (point where the plant starts to reduce transpiration) | Soil moisture deficit > 15 mm | Irrigation is triggered if (1 − PCDEPL) of the total plant‐available water volume in the root zone have been depleted and it does not rain on the day of concern | |
| Questions/remarks | Rmin = (1 − p) Rmax; p = 0.4 for all scenario/crop combinations (except for grass in D3 where p = 0.3) | Start of senescence is a model parameter in FOCUS groundwater, but does not exist in FOCUS surface water. If once‐a‐week checking is meant to reflect farmers’ behaviour, how do they determine the soil moisture deficit? 15 mm should result in quite frequent irrigation events | PCDEPL is user‐input (according to comments in source code, the range 0–0.9 is allowed. However, PRZM accepts also PCDEPL = 1) and independent of the internal trigger for evapotranspiration reduction (0.6 × potential plant‐available water in the root zone) | |
| Irrigation modes, volumes and occurrence of surface run‐off | Modes | Sprinkler (but technically added to rainfall file) | Flood and sprinkler | Flood, furrow, various types of sprinkler |
| Irrigation volume | Always 30 mm | Fill up the root zone to field capacity (FC) | Fill up the root zone to field capacity (FC), also surplus can be applied (saline soils, parameter FLEACH); for options 3–6, upper limit of irrigation volume given by RATEAP parameter; for option 7, irrigation volume is fixed by RATEAP parameter | |
| Can irrigation cause surface run‐off? | Yes, every time in irrigated R scenarios (given the application as rainfall and the chosen CN parameterisation) | No | Yes and no (depends on the selected option) | |
| Questions/remarks | ISAREG has many different options, not only the one used in FOCUS (2001) |
Test simulations with winprzm v.4.63 and examination of the code suggested that most PRZM options do not exactly correspond to their descriptions in the manual and also have bugs Mark Cheplick replaced option 5–7 with new, bug‐free options Option 5 (new): sprinkling over canopy, without run‐off Option 6 (new): sprinkling under canopy, without run‐off Option 7 (new): sprinkling under canopy, user‐defined rates, without run‐off |
Current root depth vs. maximum root depth will not make a difference in PRZM/PELMO if maximum root depth is ≤ evaporation depth ANETD. However, most crops root deeper than ANETD.
cf Discussion in Reichenberger (2015).
Table K.9.
PECsw (μg/L) and PECsed (μg/kg) obtained for pesticides A and F in all FOCUS sw scenarios based on the current and the new assessment approach following a single granular application of 1 kg/ha in field beans at emergence (BBCH 09)
| FOCUS scenario | Waterbody | Pesticide A | Pesticide F | ||||||||
|---|---|---|---|---|---|---|---|---|---|---|---|
| Current approach (FOCUS 2001)a | New approach | Current approach (FOCUS 2001)a | New approach | ||||||||
| PECsw (μg/L) | PECsed (μg/kg) | Temp. perc. | PECsw (μg/L) | PECsed (μg/kg) | PECsw (μg/L) | PECsed (μg/kg) | Temp. perc. | PECsw (μg/L) | PECsed (μg/kg) | ||
| D2 | Ditch | 113 | 10.9 | 47.5th | 118 | 44.5 | 26.0 | 37.9 | 47.5th | 26.8 | 132 |
| 57.5th | 136 | 55.9 | 57.5th | 27.1 | 146 | ||||||
| 67.5th | 140 | 69.0 | 67.5th | 27.8 | 147 | ||||||
| 77.5th | 183 | 72.7 | 77.5th | 28.9 | 181 | ||||||
| 87.5th | 209 | 75.5 | 87.5th | 31.8 | 213 | ||||||
| Stream | 72.8 | 6.67 | 47.5th | 90.0 | 26.4 | 16.2 | 20.1 | 47.5th | 16.9 | 60.4 | |
| 57.5th | 93.4 | 32.9 | 57.5th | 17.2 | 72.6 | ||||||
| 67.5th | 104 | 40.7 | 67.5th | 17.5 | 73.9 | ||||||
| 77.5th | 119 | 43.1 | 77.5th | 18.4 | 95.3 | ||||||
| 87.5th | 131 | 46.7 | 87.5th | 20.4 | 112 | ||||||
| D3 | Ditch | 5E‐06 | 2E‐6 | 47.5th | 4E‐04 | 4E‐04 | < 1E‐6 | < 1E‐6 | 47.5th | < 1E‐6 | < 1E‐6 |
| 57.5th | 0.001 | 0.001 | 57.5th | < 1E‐6 | < 1E‐6 | ||||||
| 67.5th | 0.001 | 0.001 | 67.5th | < 1E‐6 | < 1E‐6 | ||||||
| 77.5th | 0.002 | 0.002 | 77.5th | < 1E‐6 | < 1E‐6 | ||||||
| 87.5th | 0.004 | 0.004 | 87.5th | < 1E‐6 | < 1E‐6 | ||||||
| D4 | Pond | 1E‐04 | 4E‐5 | 47.5th | 3E‐05 | 3E‐05 | 0.162 | 0.607 | 47.5th | 0.019 | 0.356 |
| 57.5th | 1E‐04 | 1E‐04 | 57.5th | 0.034 | 0.371 | ||||||
| 67.5th | 2E‐04 | 2E‐04 | 67.5th | 0.068 | 1.02 | ||||||
| 77.5th | 2E‐04 | 2E‐04 | 77.5th | 0.088 | 1.62 | ||||||
| 87.5th | 0.002 | 0.001 | 87.5th | 0.109 | 1.86 | ||||||
| Stream | 9E‐04 | 3E‐4 | 47.5th | 2E‐04 | 2E‐04 | 0.382 | 0.353 | 47.5th | 0.066 | 0.252 | |
| 57.5th | 0.001 | 0.001 | 57.5th | 0.087 | 0.494 | ||||||
| 67.5th | 0.001 | 0.001 | 67.5th | 0.210 | 0.97 | ||||||
| 77.5th | 0.003 | 0.002 | 77.5th | 0.301 | 1.06 | ||||||
| 87.5th | 0.022 | 0.014 | 87.5th | 0.373 | 1.26 | ||||||
| D6 | Ditch 1st | 0.003 | 8E‐4 | 47.5th | 0.002 | 0.002 | 0.114 | 0.091 | 47.5th | 0.082 | 0.343 |
| 57.5th | 0.006 | 0.005 | 57.5th | 0.097 | 0.377 | ||||||
| 67.5th | 0.008 | 0.007 | 67.5th | 0.101 | 0.435 | ||||||
| 77.5th | 0.043 | 0.020 | 77.5th | 0.127 | 0.501 | ||||||
| 87.5th | 0.343 | 0.138 | 87.5th | 0.203 | 0.773 | ||||||
| Ditch 2nd | 0.284 | 0.024 | 47.5th | < 1E‐06 | < 1E‐06 | 0.448 | 0.296 | 47.5th | 0.509 | 2.05 | |
| 57.5th | < 1E‐06 | < 1E‐06 | 57.5th | 0.623 | 2.08 | ||||||
| 67.5th | < 1E‐06 | < 1E‐06 | 67.5th | 0.729 | 3.23 | ||||||
| 77.5th | < 1E‐06 | < 1E‐06 | 77.5th | 0.922 | 3.48 | ||||||
| 87.5th | < 1E‐06 | < 1E‐06 | 87.5th | 1.31 | 5.08 | ||||||
| R1 | Pond | 0.007 | 7E‐4 | 47.5th | 0.001 | 3E‐04 | 0.538 | 1.06 | 47.5th | 0.513 | 5.04 |
| 57.5th | 0.002 | 0.001 | 57.5th | 0.536 | 6.20 | ||||||
| 67.5th | 0.065 | 0.034 | 67.5th | 0.828 | 6.39 | ||||||
| 77.5th | 0.099 | 0.049 | 77.5th | 1.14 | 9.86 | ||||||
| 87.5th | 0.138 | 0.068 | 87.5th | 1.49 | 13.4 | ||||||
| Stream | 2.60 | 0.159 | 47.5th | 0.017 | 0.006 | 6.58 | 2.65 | 47.5th | 6.22 | 14.4 | |
| 57.5th | 0.210 | 0.069 | 57.5th | 7.40 | 16.2 | ||||||
| 67.5th | 2.78 | 1.04 | 67.5th | 8.28 | 18.8 | ||||||
| 77.5th | 10.8 | 3.32 | 77.5th | 8.68 | 19.4 | ||||||
| 87.5th | 16.7 | 3.80 | 87.5th | 8.94 | 33.0 | ||||||
| R2 | Stream | 4.77 | 0.318 | 47.5th | 2.61 | 0.95 | 3.11 | 1.83 | 47.5th | 3.38 | 20.9 |
| 57.5th | 5.04 | 1.60 | 57.5th | 3.44 | 26.6 | ||||||
| 67.5th | 9.39 | 3.64 | 67.5th | 3.63 | 35.9 | ||||||
| 77.5th | 22.6 | 8.45 | 77.5th | 3.75 | 42.4 | ||||||
| 87.5th | 35.2 | 14.8 | 87.5th | 3.82 | 54.3 | ||||||
| R3 | Stream | 0.316 | 0.030 | 47.5th | 0.768 | 0.201 | 7.77 | 5.02 | 47.5th | 8.36 | 22.4 |
| 57.5th | 1.29 | 0.538 | 57.5th | 9.16 | 23.9 | ||||||
| 67.5th | 11.6 | 4.14 | 67.5th | 9.73 | 26.6 | ||||||
| 77.5th | 34.8 | 10.3 | 77.5th | 11.0 | 28.3 | ||||||
| 87.5th | 77.5 | 22.3 | 87.5th | 12.0 | 38.1 | ||||||
| R4 | Stream | 21.8 | 1.89 | 47.5th | 0.043 | 0.012 | 14.8 | 8.00 | 47.5th | 9.49 | 22.5 |
| 57.5th | 0.327 | 0.130 | 57.5th | 10.9 | 26.6 | ||||||
| 67.5th | 0.446 | 0.206 | 67.5th | 11.9 | 27.8 | ||||||
| 77.5th | 9.11 | 2.76 | 77.5th | 12.6 | 30.8 | ||||||
| 87.5th | 18.3 | 9.58 | 87.5th | 14.4 | 58.8 | ||||||
Start of application window (31 days) set to 15 days before emergence.
Table K.10.
PECsw (μg/L) and PECsed (μg/kg) obtained for pesticides A and F in all FOCUS sw scenarios based on the current and the new assessment approach following a single ground spray application of 1 kg/ha in winter cereals at emergence (BBCH 09)
| FOCUS scenario | Waterbody | Pesticide A | Pesticide F | ||||||||
|---|---|---|---|---|---|---|---|---|---|---|---|
| Current approach (FOCUS 2001)a | New approach | Current approach (FOCUS 2001)a | New approach | ||||||||
| PECsw (μg/L) | PECsed (μg/kg) | Temp. perc. | PECsw (μg/L) | PECsed (μg/kg) | PECsw (μg/L) | PECsed (μg/kg) | Temp. perc. | PECsw (μg/L) | PECsed (μg/kg) | ||
| D1 | Ditch | 9.17 | 1.71 | 47.5th | 25.2 | 16.8 | 13.3 | 36.1 | 47.5th | 10.1 | 206 |
| 57.5th | 29.7 | 21.5 | 57.5th | 12.9 | 219 | ||||||
| 67.5th | 42.3 | 30.8 | 67.5th | 14.4 | 222 | ||||||
| 77.5th | 47.4 | 32.6 | 77.5th | 16.6 | 238 | ||||||
| 87.5th | 91.8 | 59.2 | 87.5th | 17.1 | 260 | ||||||
| Stream | 7.00 | 1.44 | 47.5th | 21.3 | 11.1 | 8.61 | 21.6 | 47.5th | 6.68 | 120 | |
| 57.5th | 25.4 | 15.2 | 57.5th | 8.44 | 123 | ||||||
| 67.5th | 27.0 | 20.7 | 67.5th | 10.0 | 131 | ||||||
| 77.5th | 36.5 | 22.8 | 77.5th | 10.5 | 139 | ||||||
| 87.5th | 60.3 | 40.1 | 87.5th | 10.9 | 150 | ||||||
| D2 | Ditch | 90.1 | 7.90 | 47.5th | 63.3 | 37.5 | 26.3 | 38.2 | 47.5th | 21.6 | 132 |
| 57.5th | 100 | 40.0 | 57.5th | 24.3 | 137 | ||||||
| 67.5th | 126 | 51.7 | 67.5th | 26.5 | 166 | ||||||
| 77.5th | 155 | 63.5 | 77.5th | 27.8 | 207 | ||||||
| 87.5th | 160 | 66.2 | 87.5th | 31.4 | 218 | ||||||
| Stream | 59.3 | 4.66 | 47.5th | 49.2 | 22.7 | 16.4 | 20.1 | 47.5th | 13.5 | 66.0 | |
| 57.5th | 65.2 | 27.9 | 57.5th | 15.2 | 70.4 | ||||||
| 67.5th | 82.6 | 32.0 | 67.5th | 16.5 | 90.8 | ||||||
| 77.5th | 105 | 37.4 | 77.5th | 17.6 | 113 | ||||||
| 87.5th | 114 | 39.0 | 87.5th | 19.7 | 119 | ||||||
| D3 | Ditch | 6.88 | 0.590 | 47.5th | 6.85 | 3.05 | 6.32 | 2.38 | 47.5th | 6.35 | 16.9 |
| 57.5th | 7.01 | 3.09 | 57.5th | 6.36 | 18.1 | ||||||
| 67.5th | 7.13 | 3.18 | 67.5th | 6.36 | 20.1 | ||||||
| 77.5th | 7.23 | 3.20 | 77.5th | 6.37 | 22.4 | ||||||
| 87.5th | 7.28 | 3.39 | 87.5th | 6.37 | 22.7 | ||||||
| D4 | Pond | 0.219 | 0.020 | 47.5th | 0.219 | 0.094 | 0.641 | 2.18 | 47.5th | 0.219 | 1.99 |
| 57.5th | 0.219 | 0.095 | 57.5th | 0.219 | 2.08 | ||||||
| 67.5th | 0.219 | 0.099 | 67.5th | 0.219 | 3.29 | ||||||
| 77.5th | 0.219 | 0.101 | 77.5th | 0.267 | 5.47 | ||||||
| 87.5th | 0.219 | 0.103 | 87.5th | 0.412 | 7.36 | ||||||
| Stream | 5.48 | 0.237 | 47.5th | 5.48 | 1.19 | 5.48 | 1.39 | 47.5th | 5.48 | 4.88 | |
| 57.5th | 5.48 | 1.19 | 57.5th | 5.48 | 4.88 | ||||||
| 67.5th | 5.48 | 1.19 | 67.5th | 5.48 | 4.88 | ||||||
| 77.5th | 5.48 | 1.20 | 77.5th | 5.48 | 4.89 | ||||||
| 87.5th | 5.48 | 1.20 | 87.5th | 5.48 | 5.20 | ||||||
| D5 | Pond | 0.766 | 0.200 | 47.5th | 0.314 | 0.282 | 0.382 | 1.06 | 47.5th | 0.219 | 2.28 |
| 57.5th | 0.543 | 0.415 | 57.5th | 0.220 | 2.34 | ||||||
| 67.5th | 0.822 | 0.615 | 67.5th | 0.230 | 2.84 | ||||||
| 77.5th | 1.32 | 0.911 | 77.5th | 0.270 | 3.55 | ||||||
| 87.5th | 2.31 | 1.58 | 87.5th | 0.300 | 6.39 | ||||||
| Stream | 5.91 | 0.297 | 47.5th | 5.92 | 1.49 | 5.91 | 1.32 | 47.5th | 5.91 | 6.55 | |
| 57.5th | 5.92 | 1.61 | 57.5th | 5.91 | 6.57 | ||||||
| 67.5th | 5.92 | 2.15 | 67.5th | 5.91 | 6.58 | ||||||
| 77.5th | 5.92 | 3.04 | 77.5th | 5.91 | 6.59 | ||||||
| 87.5th | 14.12 | 6.69 | 87.5th | 5.91 | 6.59 | ||||||
| D6 | Ditch | 9.84 | 1.07 | 47.5th | 6.40 | 2.84 | 19.9 | 9.64 | 47.5th | 9.53 | 39.8 |
| 57.5th | 6.69 | 3.40 | 57.5th | 11.9 | 44.2 | ||||||
| 67.5th | 8.48 | 4.23 | 67.5th | 15.1 | 51.9 | ||||||
| 77.5th | 24.6 | 11.5 | 77.5th | 17.9 | 60.3 | ||||||
| 87.5th | 65.0 | 27.2 | 87.5th | 26.1 | 75.4 | ||||||
| R1 | Pond | 0.307 | 0.054 | 47.5th | 0.219 | 0.120 | 0.819 | 2.39 | 47.5th | 0.583 | 8.61 |
| 57.5th | 0.268 | 0.163 | 57.5th | 0.839 | 12.9 | ||||||
| 67.5th | 0.302 | 0.173 | 67.5th | 0.883 | 13.0 | ||||||
| 77.5th | 0.372 | 0.217 | 77.5th | 1.16 | 18.9 | ||||||
| 87.5th | 0.728 | 0.418 | 87.5th | 1.55 | 20.8 | ||||||
| Stream | 25.8 | 1.61 | 47.5th | 5.52 | 1.60 | 9.45 | 3.06 | 47.5th | 8.57 | 16.2 | |
| 57.5th | 24.5 | 7.58 | 57.5th | 8.71 | 18.0 | ||||||
| 67.5th | 29.6 | 8.50 | 67.5th | 9.18 | 19.4 | ||||||
| 77.5th | 32.9 | 9.64 | 77.5th | 9.83 | 25.3 | ||||||
| 87.5th | 50.7 | 13.8 | 87.5th | 10.5 | 29.4 | ||||||
| R3 | Stream | 49.8 | 3.75 | 47.5th | 5.91 | 1.48 | 12.1 | 115 | 47.5th | 10.2 | 21.3 |
| 57.5th | 6.67 | 2.33 | 57.5th | 10.3 | 24.7 | ||||||
| 67.5th | 14.5 | 4.74 | 67.5th | 10.5 | 32.0 | ||||||
| 77.5th | 35.5 | 11.3 | 77.5th | 11.0 | 36.9 | ||||||
| 87.5th | 54.1 | 19.4 | 87.5th | 11.3 | 44.1 | ||||||
| R4 | Stream | 4.19 | 0.163 | 47.5th | 6.96 | 2.70 | 9.52 | 4.19 | 47.5th | 12.4 | 41.3 |
| 57.5th | 16.9 | 8.34 | 57.5th | 13.8 | 44.6 | ||||||
| 67.5th | 19.9 | 9.34 | 67.5th | 13.9 | 53.1 | ||||||
| 77.5th | 28.8 | 12.4 | 77.5th | 14.6 | 72.9 | ||||||
| 87.5th | 53.2 | 16.6 | 87.5th | 18.1 | 84.0 | ||||||
Start of application window (31 days) set to 15 days before emergence.
Table K.11.
PECsw (μg/L) and PECsed (μg/kg) obtained for pesticides A and F in all FOCUS sw scenarios based on the current and the new assessment approach following multiple ground spray applications (4 × 1 kg/ha, 7‐day interval) in maize at BBCH 09–39 with the first intended application at emergence (BBCH 09)
| FOCUS scenario | Waterbody | Pesticide A | Pesticide F | ||||||||
|---|---|---|---|---|---|---|---|---|---|---|---|
| Current approach (FOCUS 2001)a | New approach | Current approach (FOCUS 2001)a | New approach | ||||||||
| PECsw (μg/L) | PECsed (μg/kg) | Temp. perc. | PECsw (μg/L) | PECsed (μg/kg) | PECsw (μg/L) | PECsed (μg/kg) | Temp. perc. | PECsw (μg/L) | PECsed (μg/kg) | ||
| D3 | Ditch | 3.53 | 0.242 | 47.5th | 5.25 | 1.68 | 3.53 | 2.37 | 47.5th | 5.25 | 16.2 |
| 57.5th | 5.25 | 1.73 | 57.5th | 5.25 | 16.8 | ||||||
| 67.5th | 5.25 | 1.78 | 67.5th | 5.26 | 18.2 | ||||||
| 77.5th | 5.26 | 1.83 | 77.5th | 5.26 | 18.8 | ||||||
| 87.5th | 5.26 | 1.84 | 87.5th | 5.28 | 22.2 | ||||||
| D4 | Pond | 0.150 | 0.019 | 47.5th | 0.227 | 0.108 | 0.822 | 3.08 | 47.5th | 0.442 | 5.40 |
| 57.5th | 0.227 | 0.111 | 57.5th | 0.453 | 5.44 | ||||||
| 67.5th | 0.229 | 0.116 | 67.5th | 0.457 | 6.64 | ||||||
| 77.5th | 0.233 | 0.119 | 77.5th | 0.460 | 7.45 | ||||||
| 87.5th | 0.236 | 0.132 | 87.5th | 0.473 | 7.61 | ||||||
| Stream | 3.10 | 0.095 | 47.5th | 4.54 | 0.598 | 3.09 | 1.77 | 47.5th | 4.52 | 3.10 | |
| 57.5th | 4.61 | 0.718 | 57.5th | 4.61 | 3.39 | ||||||
| 67.5th | 4.64 | 0.747 | 67.5th | 4.64 | 4.18 | ||||||
| 77.5th | 4.65 | 0.769 | 77.5th | 4.65 | 4.59 | ||||||
| 87.5th | 4.67 | 1.03 | 87.5th | 4.67 | 5.16 | ||||||
| D5 | Pond | 0.141 | 0.016 | 47.5th | 0.218 | 0.087 | 0.330 | 0.938 | 47.5th | 0.418 | 4.55 |
| 57.5th | 0.222 | 0.096 | 57.5th | 0.424 | 4.81 | ||||||
| 67.5th | 0.223 | 0.105 | 67.5th | 0.430 | 4.89 | ||||||
| 77.5th | 0.824 | 0.561 | 77.5th | 0.447 | 5.15 | ||||||
| 87.5th | 5.19 | 3.24 | 87.5th | 0.475 | 6.33 | ||||||
| Stream | 3.32 | 0.102 | 47.5th | 5.01 | 0.851 | 3.32 | 0.486 | 47.5th | 4.93 | 2.63 | |
| 57.5th | 5.11 | 1.153 | 57.5th | 4.94 | 3.28 | ||||||
| 67.5th | 5.13 | 1.199 | 67.5th | 4.98 | 3.51 | ||||||
| 77.5th | 10.6 | 5.51 | 77.5th | 5.08 | 6.19 | ||||||
| 87.5th | 27.7 | 11.1 | 87.5th | 5.13 | 7.18 | ||||||
| D6 | Ditch | 3.55 | 0.238 | 47.5th | 5.30 | 1.83 | 3.53 | 2.59 | 47.5th | 5.51 | 34.9 |
| 57.5th | 5.30 | 1.96 | 57.5th | 5.60 | 38.3 | ||||||
| 67.5th | 5.32 | 2.02 | 67.5th | 5.93 | 40.5 | ||||||
| 77.5th | 5.34 | 2.14 | 77.5th | 6.10 | 50.8 | ||||||
| 87.5th | 14.4 | 5.95 | 87.5th | 6.39 | 54.4 | ||||||
| R1 | Pond | 0.756 | 0.088 | 47.5th | 0.325 | 0.153 | 2.03 | 4.70 | 47.5th | 3.09 | 22.1 |
| 57.5th | 0.679 | 0.377 | 57.5th | 3.42 | 32.6 | ||||||
| 67.5th | 1.38 | 0.621 | 67.5th | 3.62 | 36.0 | ||||||
| 77.5th | 1.58 | 0.779 | 77.5th | 7.14 | 68.8 | ||||||
| 87.5th | 1.96 | 1.08 | 87.5th | 9.33 | 79.1 | ||||||
| Stream | 24.9 | 1.39 | 47.5th | 12.8 | 4.80 | 23.7 | 12.3 | 47.5th | 22.4 | 60.7 | |
| 57.5th | 25.3 | 7.38 | 57.5th | 23.6 | 72.8 | ||||||
| 67.5th | 47.9 | 13.9 | 67.5th | 24.6 | 114 | ||||||
| 77.5th | 62.6 | 20.6 | 77.5th | 26.5 | 137 | ||||||
| 87.5th | 68.6 | 24.1 | 87.5th | 29.0 | 254 | ||||||
| R2 | Stream | 18.1 | 1.47 | 47.5th | 11.7 | 4.99 | 8.07 | 17.8 | 47.5th | 8.96 | 75.8 |
| 57.5th | 19.4 | 6.06 | 57.5th | 9.43 | 93.2 | ||||||
| 67.5th | 27.3 | 9.80 | 67.5th | 10.6 | 112 | ||||||
| 77.5th | 29.9 | 10.8 | 77.5th | 11.0 | 136 | ||||||
| 87.5th | 45.1 | 17.9 | 87.5th | 12.2 | 219 | ||||||
| R3 | Stream | 45.9 | 5.04 | 47.5th | 18.2 | 9.10 | 24.4 | 76.4 | 47.5th | 20.6 | 56.2 |
| 57.5th | 31.1 | 10.7 | 57.5th | 24.1 | 95.9 | ||||||
| 67.5th | 32.5 | 13.1 | 67.5th | 24.9 | 137 | ||||||
| 77.5th | 47.5 | 14.5 | 77.5th | 25.8 | 216 | ||||||
| 87.5th | 55.6 | 24.9 | 87.5th | 26.8 | 306 | ||||||
| R4 | Stream | 60.2 | 5.24 | 47.5th | 25.8 | 8.32 | 35.2 | 24.0 | 47.5th | 36.8 | 80.9 |
| 57.5th | 30.6 | 14.1 | 57.5th | 40.0 | 87.5 | ||||||
| 67.5th | 32.6 | 17.5 | 67.5th | 40.4 | 97.4 | ||||||
| 77.5th | 58.5 | 20.0 | 77.5th | 43.6 | 106 | ||||||
| 87.5th | 85.2 | 30.5 | 87.5th | 44.7 | 125 | ||||||
Start of application window (62 days) set to 15 days before emergence.
Table K.12.
PECsw (μg/L) and PECsed (μg/kg) obtained for pesticides A and F in all FOCUS sw scenarios based on the current and the new assessment approach following multiple air blast applications (8 × 1 kg/ha, 7‐day interval) in pome/stone fruit at BBCH 09–69 with the first intended application at emergence (BBCH 09)
| FOCUS scenario | Waterbody | Pesticide A | Pesticide F | ||||||||
|---|---|---|---|---|---|---|---|---|---|---|---|
| Current approach (FOCUS 2001)a | New approach | Current approach (FOCUS 2001)a | New approach | ||||||||
| PECsw (μg/L) | PECsed (μg/kg) | Temp. perc. | PECsw (μg/L) | PECsed (μg/kg) | PECsw (μg/L) | PECsed (μg/kg) | Temp. perc. | PECsw (μg/L) | PECsed (μg/kg) | ||
| D3 | Ditch | 57.0 | 4.18 | 47.5th | 77.7 | 25.4 | 57.2 | 56.0 | 47.5th | 77.8 | 301 |
| 57.5th | 77.8 | 25.9 | 57.5th | 77.9 | 306 | ||||||
| 67.5th | 77.8 | 26.4 | 67.5th | 78.0 | 336 | ||||||
| 77.5th | 77.9 | 27.0 | 77.5th | 78.0 | 338 | ||||||
| 87.5th | 78.0 | 28.7 | 87.5th | 78.2 | 396 | ||||||
| D4 | Pond | 4.20 | 0.748 | 47.5th | 4.86 | 2.42 | 10.3 | 33.6 | 47.5th | 12.0 | 180 |
| 57.5th | 4.93 | 2.46 | 57.5th | 12.1 | 183 | ||||||
| 67.5th | 5.00 | 2.59 | 67.5th | 12.9 | 191 | ||||||
| 77.5th | 5.07 | 2.69 | 77.5th | 13.1 | 199 | ||||||
| 87.5th | 5.10 | 2.69 | 87.5th | 13.6 | 203 | ||||||
| Stream | 58.9 | 2.29 | 47.5th | 80.1 | 11.8 | 58.9 | 10.9 | 47.5th | 80.0 | 46.9 | |
| 57.5th | 80.5 | 12.4 | 57.5th | 80.4 | 53.4 | ||||||
| 67.5th | 81.5 | 14.3 | 67.5th | 81.5 | 65.8 | ||||||
| 77.5th | 82.0 | 15.4 | 77.5th | 81.9 | 71.6 | ||||||
| 87.5th | 82.2 | 15.8 | 87.5th | 82.2 | 78.3 | ||||||
| D5 | Pond | 3.57 | 0.480 | 47.5th | 4.93 | 2.42 | 10.5 | 34.0 | 47.5th | 12.4 | 188 |
| 57.5th | 4.96 | 2.54 | 57.5th | 12.6 | 190 | ||||||
| 67.5th | 5.03 | 2.57 | 67.5th | 12.9 | 193 | ||||||
| 77.5th | 5.15 | 2.61 | 77.5th | 13.0 | 195 | ||||||
| 87.5th | 5.22 | 2.78 | 87.5th | 13.1 | 199 | ||||||
| Stream | 64.3 | 3.24 | 47.5th | 89.1 | 20.8 | 64.2 | 19.9 | 47.5th | 89.0 | 107 | |
| 57.5th | 89.1 | 21.0 | 57.5th | 89.0 | 116 | ||||||
| 67.5th | 89.2 | 21.3 | 67.5th | 89.1 | 125 | ||||||
| 77.5th | 89.3 | 21.8 | 77.5th | 89.2 | 126 | ||||||
| 87.5th | 89.3 | 22.1 | 87.5th | 89.2 | 132 | ||||||
| R1 | Pond | 3.82 | 0.577 | 47.5th | 4.90 | 2.27 | 9.63 | 32.1 | 47.5th | 12.0 | 163 |
| 57.5th | 4.92 | 2.34 | 57.5th | 12.2 | 175 | ||||||
| 67.5th | 4.95 | 2.46 | 67.5th | 12.4 | 180 | ||||||
| 77.5th | 5.04 | 2.67 | 77.5th | 12.9 | 184 | ||||||
| 87.5th | 6.13 | 2.72 | 87.5th | 13.2 | 191 | ||||||
| Stream | 45.5 | 1.70 | 47.5th | 63.1 | 12.0 | 60.1 | 11.1 | 47.5th | 63.1 | 92.8 | |
| 57.5th | 63.2 | 12.1 | 57.5th | 63.2 | 99.2 | ||||||
| 67.5th | 63.3 | 12.1 | 67.5th | 63.2 | 148 | ||||||
| 77.5th | 63.3 | 15.6 | 77.5th | 63.2 | 155 | ||||||
| 87.5th | 63.3 | 17.2 | 87.5th | 63.2 | 161 | ||||||
| R2 | Stream | 60.9 | 1.65 | 47.5th | 83.9 | 11.2 | 60.9 | 8.56 | 47.5th | 83.8 | 54.4 |
| 57.5th | 84.1 | 11.3 | 57.5th | 84.0 | 80.0 | ||||||
| 67.5th | 84.5 | 11.3 | 67.5th | 84.4 | 90.2 | ||||||
| 77.5th | 84.5 | 11.7 | 77.5th | 84.5 | 94.9 | ||||||
| 87.5th | 84.6 | 14.3 | 87.5th | 84.5 | 103 | ||||||
| R3 | Stream | 64.0 | 4.48 | 47.5th | 89.1 | 20.2 | 64.0 | 29.3 | 47.5th | 89.0 | 137 |
| 57.5th | 89.1 | 20.2 | 57.5th | 89.0 | 155 | ||||||
| 67.5th | 89.1 | 20.3 | 67.5th | 89.1 | 174 | ||||||
| 77.5th | 89.2 | 21.7 | 77.5th | 89.1 | 244 | ||||||
| 87.5th | 89.2 | 23.7 | 87.5th | 89.2 | 280 | ||||||
| R4 | Stream | 45.5 | 2.72 | 47.5th | 63.0 | 12.0 | 45.4 | 21.2 | 47.5th | 62.9 | 106 |
| 57.5th | 63.1 | 12.1 | 57.5th | 63.0 | 135 | ||||||
| 67.5th | 63.1 | 14.3 | 67.5th | 63.1 | 140 | ||||||
| 77.5th | 63.2 | 22.0 | 77.5th | 63.1 | 161 | ||||||
| 87.5th | 64.0 | 29.5 | 87.5th | 63.1 | 192 | ||||||
Start of application window (80 days) set to 15 days before emergence.
Table K.13.
PECsw (μg/L) and PECsed (μg/kg) obtained for pesticides A and F in all FOCUS sw scenarios based on the current and the new assessment approach following multiple air blast applications (8 × 1 kg/ha, 7‐day interval) in citrus with the first intended application on 1 March
| FOCUS scenario | Waterbody | Pesticide A | Pesticide F | ||||||||
|---|---|---|---|---|---|---|---|---|---|---|---|
| Current approach (FOCUS 2001)a | New approach | Current approach (FOCUS 2001) | New approach | ||||||||
| PECsw (μg/L) | PECsed (μg/kg) | Temp. perc. | PECsw (μg/L) | PECsed (μg/kg) | PECsw (μg/L) | PECsed (μg/kg) | Temp. perc. | PECsw (μg/L) | PECsed (μg/kg) | ||
| D6 | Ditch | 21.7 | 2.33 | 47.5th | 37.8 | 16.1 | 30.6 | 70.6 | 47.5th | 46.6 | 445 |
| 57.5th | 37.8 | 16.2 | 57.5th | 46.7 | 452 | ||||||
| 67.5th | 37.9 | 16.3 | 67.5th | 46.8 | 459 | ||||||
| 77.5th | 38.3 | 16.7 | 77.5th | 46.8 | 461 | ||||||
| 87.5th | 40.9 | 18.0 | 87.5th | 47.0 | 469 | ||||||
| R4 | Stream | 26.6 | 1.15 | 47.5th | 183 | 58.7 | 41.9 | 27.3 | 47.5th | 64.7 | 335 |
| 57.5th | 197 | 63.7 | 57.5th | 67.7 | 347 | ||||||
| 67.5th | 203 | 65.2 | 67.5th | 71.4 | 458 | ||||||
| 77.5th | 226 | 67.9 | 77.5th | 73.3 | 467 | ||||||
| 87.5th | 249 | 68.8 | 87.5th | 74.3 | 592 | ||||||
Start of application window (80 days) set to 14 February (15 days before the intended application date).
Appendix L – Suggested smaller, technical improvements for the FOCUS surface water scenario calculations
1.
In this appendix, the FOCUS Surface Water Repair WG provides a list of smaller, technical improvements to the parametrisation of the scenarios. These suggestions should be considered for future updates:
Change reference values for RCN in PRZM into more time steps instead of being constant for each of the four present crop stages (see also Bach et al., 2016, 2017a,b).
Improve transformation of daily run‐off values of PRZM into hourly values for input to TOXSWA (for current method, based upon rainfall intensity of 2 mm/h: see Adriaanse et al., 2017).
Alignment of all relevant PRZM processes to the harmonised pesticide application at 9 a.m. (e.g. wash‐off in PRZM now as in MACRO starting at 9 a.m. whereas foliar decay starts at midnight).
Add crops (now MS are often missing crops).
Add recommendations for selection of surrogate crops.
Add the option that currently irrigated crops may also be not irrigated. Make it possible to change the type of irrigation (now below canopy for tall permanent crops, and above canopy for all other crops).
Review crop development dates, can they be related to the meteorological data? This is especially important now that there are multiyear simulations.
Review the values of PFAC ‘pan evaporation factor’ used in the run‐off scenarios (e.g. by checking against the Kc factors against those recommended by FAO) and adapt them if necessary.
Considering time and ease of running the FOCUS Surface Water Repair WG proposes:
Reduce run‐time, e.g. by running MACRO on several cores at the same time.
Automate operation of the modelling shells, particularly, MARCO and PRZM (less clicking).
Full batch mode functionality of the whole SW software.
Appendix M – Considering accumulation in sediment
M.1. Background
Currently, a sediment toxicity test with the standard test species Chironomus sp. or Lumbriculus variegatus is needed when 10% or more of the applied radioactivity15 can be found in the sediment at or after 14 days in the mandatory water‐sediment test performed according to the OECD Guideline 308, and when the EC10 or NOEC value for Daphnia or another relevant pelagic animal species is lower or equal to 0.1 mg/L (EFSA PPR Panel, 2013a,b). In the majority of tier‐1 sediment effect assessments, the toxicity test was conducted with Chironomus riparius in water‐sediment systems exposed by either spiking the water (OECD Guideline 219) or spiking the sediment (OECD Guideline 218). The sediment used in these OECD tests has a standard OM content of approximately 5% (i.e. approximately 2.5% OC). The effect concentration is expressed either in mg/L (spiked water) or mg/kg dry sediment mass or mg/kg OC in dry sediment (spiked sediment). In the Scientific Opinion on the effect assessment for pesticides on sediment organisms in edge‐of‐field surface water (EFSA PPR Panel, 2015), it is proposed to also request sediment toxicity tests if more than 10% of the total annual dose resides in the sediment as calculated in the FOCUS surface water scenarios at the time of the maximum PECsed. In addition, it is suggested to also request sediment toxicity tests when the chronic EC50 for algae or vascular plants is equal or larger than 0.1 mg/L. EFSA PPR Panel (2015) proposes to always request toxicity values for two benthic standard test species if a sediment ERA is triggered and the equilibrium partitioning approach is not sufficient as a first screening approach (e.g. sediment tests with Chironomus sp. and Hyalella azteca for insecticides; Lumbriculus variegatus and Chironomus sp. for fungicides; Myriophyllum spicatum and Chironomus sp. or L. variegatus for herbicides).
The current FOCUS methodology for surface water does not consider the effect of multiyear applications, which could possibly lead to accumulation of pesticides in sediment. The reason for this deficit is that the original intention of FOCUS was to develop realistic worst‐case scenarios for the water compartment where accumulation was not expected to be important. As no waterbody was considered being static and without outflow, significant accumulation in the water phase would not occur even if multiple applications of compounds that are persistent in sediment were simulated. However, in sediments, the situation can be completely different, especially for strongly adsorbing pesticides where the calculation of an additional PECsed,max,accu may be necessary.
The problem was recently addressed by EFSA (2015):
‘…The current FOCUS methodology does not consider the effect of multiyear applications that can lead to accumulation in sediment. To account for this deficit it is proposed to include an accumulation factor. The PPR Panel did not revise or evaluate the current exposure assessment in detail but advises to critically evaluate and improve the FOCUS surface water exposure assessment in the future and to develop new sediment scenarios for total content and pore water concentrations… .’
M.2. Current methodologies to estimate accumulation in sediment
Three different methodologies were used in the current risk assessment to consider accumulation of pesticides and their metabolites in the sediment layer. They are presented below. Note that these methodologies will get obsolete once the repaired FOCUS surface water scenarios will be implemented.
Option 1
The first option is detailed in EFSA (2015). It uses a simple accumulation factor that has to be multiplied with the maximum sediment concentration. This value is then added to the standard FOCUS concentrations. The procedure follows principally the methodology described in EFSA PPR Panel (2012) for soil concentrations. It can be considered a worst‐case approach as apart from degradation it does not consider any other loss processes (e.g. re‐partitioning into the water phase followed by advection or volatilisation). The calculation of the accumulation factor is described in the following equation:
| (M1a) |
| (M1b) |
| (M1c) |
with
PECsed,accu: predicted sediment concentration including accumulation (μg/kg)
PECsed,FOCUS,: predicted concentration in sediment according to FOCUS (μg/kg)
PECsed,max,FOCUS,: maximum concentration in sediment according to FOCUS (μg/kg)
f: temperature correction factor (–)
DegT50: degradation in water/sediment at reference temperature (day)
Tarr,scen: Arrhenius weighted average concentration of the scenario (°C)
T0: Reference temperature during the degradation study (20°C)
E: Arrhenius activation energy, (kJ mol−1)
R: Gas constant (kJ mol−1 K−1).
Option 2
The second option consisted of calculations based on a previous equation for deriving PEC accumulation in soil were also used (FOCUS, 1997):
| (M2) |
with
PECsed,accum: maximum accumulation concentration in sediment after repeated applications (μg/kg)
PECsed,max: global maximum concentration in sediment (μg/kg)
k: first‐order rate constant given by ln(2)/DT50
i: application interval (365 days)
Option 3
The third option to calculate the accumulation in sediment used the FOCUS sw package (FOCUS, 2000) but forced the system to run for more than 1 year. The procedure was to mimic accumulation by using the PECsed at the end of the previous year for the following year, and repeat it.
A calculation over a 20‐year period was realised by simply repeating the drainage and run‐off entries into the waterbody (m2t.file and p2t.file). The non‐standard 20‐year drainage input files (m2t.files) for the accumulation calculation with TOXSWA were prepared by repeating the output of the FOCUS MACRO calculations from a 1‐year period.
The run‐off output from PRZM being typically already simulated for 20 years, including yearly varying application dates, due to the PAT routine. A 20‐year PRZM output has to be transferred into a run‐off input file (p2t.file) for TOXSWA. All parameters of the scenario were kept the same as in the respective previous FOCUS calculation.
M.3. Calculation of PECsed in repaired FOCUS sw scenarios
At present, the TOXSWA model gives the maximum PEC (in μg/kg dry sediment mass) over the upper 5 cm sediment of the considered simulation period (12 months for run‐off scenarios and 16 months for drainage scenarios). In the FOCUS scenario, the sediment has an OC content of 5% based on dry mass. EFSA PPR Panel (2015) suggests to use a PECsed over the upper 1 cm as the relevant exposure concentration for a risk assessment for benthic invertebrates and a PECsed over the upper 5 cm for a risk assessment for aquatic rooted plants. The suggested ecotoxicological relevant concentration (ERC) is the pore water concentration (μg/L) or the total content of pesticide mass in the selected sediment layer expressed either on an organic carbon basis (μg/kg OC) or on μg/kg dry sediment mass for standardised sediment containing a specific OC content. Therefore, in the repaired FOCUS surface water scenarios, the TOXSWA model has been adapted to enable the output of suggested improvements. So, the TOXSWA model now outputs annual maximum PECsed over the upper 1 or upper 5 cm sediment, expressed as pore water concentration (μg/L) or the total content either expressed on OM basis (μg/kg OM) or on μg/kg dry sediment mass basis (5% OC), averaged over the selected layer. Peak concentrations, as well as averaged concentrations over user‐defined time windows (TWA values) can be given. These PECsed outputs can so be directly compared with the RAC values (Regulatory Acceptable Concentrations), derived from the sediment toxicity tests in the same metrics (see EFSA PPR Panel, 2015, chapter 9). Note that the sediment used in the various testing protocols differs and so deriving the RAC values in the wished metrics requires special attention. For example, in the OECD test protocols for sediment‐dwelling organisms, it is recommended to use an artificial sediment containing 4–5% peat (i.e. OM, equalling 2.3–2.9% OC), while the United States Environmental Protection Agency (US EPA)/ASTM international guidelines recommend the use of field‐collected sediment.
The FOCUS surface water scenarios were originally designed to form ‘realistic worst‐case’ scenarios for exposure in surface water (FOCUS, 2001, 2002). Therefore, one may expect that loadings into and concentrations in these scenarios may reflect realistic worst‐case conditions in surface water and so also for the underlying sediment. However, to maintain the pesticide mass in the water and so the realistic worst‐case conditions in the water as much as possible, penetration of pesticide mass in the sediment was minimised by defining the OC percentage in the sediment at 5%. This is a relatively low value for field sediments in edge‐of‐field surface waters. Adriaanse et al. (2015) measured OM contents corresponding to 5.8–17.4% OC (0–1 cm), 4.9–16.9% OC (1–2 cm), 4.9–14.8% OC (2–3 cm) and 4.4–11.5% OC (3–5 cm) in four edge‐of‐field ditches adjacent to fields with arable farming or horticulture across the Netherlands, carrying at least 20 cm of water all year round. (Note that the related sediments have low bulk densities and high porosities, between 0.09–0.59 g/mL and 0.68–0.90.). As a result, the PECsed of FOCUS would not correspond to a conservative exposure if the OC content would be lower than the one in field sediments, because the PECsed is a linear function of the OC content (for Freundlich coefficients of 1). This is confirmed by Appendix M, which also demonstrates that the concentration in the overlying water, i.e. the PECsw is hardly affected by the OC content of the sediment for compounds with Koc values of up to around 1,000 mL/g.
So, by extending the simulation period to 20 years, the process of mass accumulation does occur in the repaired FOCUS surface water scenarios and so the PECsed may be significantly higher than the PECsed for the original simulation periods of 12 and 16 months. A warming‐up period of 6 years was added upfront of the 20‐year period to reach a maximum plateau value for the PECsed (Appendix A). Accumulation is expected to be important for especially persistent compounds, i.e. having a relatively long DegT50 in soil (e.g. 100 days or more) coupled to a relatively large sorption coefficient Koc (e.g. 500–1,000 mL/g or higher). This type of compounds is not expected to considerably enter the watercourse via drainage, but can enter in significant quantities via spray drift deposition and/or especially eroded soil in the run‐off scenarios. Compounds with large sorption coefficients, especially those known to sorb to inorganic constituents, such as glyphosate and pendimethalin can be transported to drains through macropores adsorbed to mobile clay colloids (e.g. Kjaer et al., 2011). However, this process has not been taken into account in the drainage modelling. Note that the process of removing the upper sediment layer by regularly cleaning of ditches has not been considered in the FOCUS surface water scenarios. In streams neither the process of suspension of eroded soil or suspended solids nor the process of re‐suspension of upper sediment in periods of high flow has been considered, but the pesticide mass sorbed to the eroded soil of the adjacent 1‐ha field has been added to the upper 0–1 cm sediment layer and so has been taken into account. Not accounting for cleaning of ditches, suspension of (uncontaminated) eroded soil or suspended solids on top of contaminated sediment, or re‐suspension of sediment tends to result in conservative estimates of the annual PECmax values in sediment. Appendix N demonstrates that the simulated sediment thickness of 10 cm is sufficient to obtain robust and conservative PECsed values (for the current sediment properties).
In the repaired FOCUS surface water scenarios, 20 annual maximum values for the PECsed will be given as output. These can be ranked and one of the 20 values, representing the wished (temporal) percentile can be selected. In this way, a more robust maximum PECsed value will be selected than is performed in the current single‐year simulations and so the sediment risk assessment will be more robust. Alternatively, e.g. for TK/TD modelling, the entire exposure profile as a function of time can be given as output. Note, however, that due to the relatively low OC content, the PECsed is likely not to represent a ‘realistic worst‐case’ exposure across the EU (Appendix M).
References
Adriaanse PI, Crum SJH, Elbers JA, Massop HThL and Beltman WHJ, 2015. Sediment properties in five Dutch watercourses. Indicative measurements for use in the registration procedure of plant protection products in the Netherlands. Alterra report 2574, Wageningen, the Netherlands, 94 pp.
EFSA (European Food Safety Authority), 2013. Scientific Opinion on tiered risk assessment for plant protection products for aquatic organisms in edge‐of‐field surface waters. EFSA Journal 2013;11(7):3290, 186 pp. https://doi.org/10.2903/j.efsa.2013.3290
EFSA (European Food Safety Authority), 2015. Scientific Opinion on the effect assessment for pesticides on sediment organisms in edge‐of‐field surface water. EFSA Journal 2015;13(7):4176, 145 pp. https://doi.org/10.2903/j.efsa.2015.4176
FOCUS, 1997. Soil persistence models and EU registration. Report of the FOCUS soil persistence working group. EC Sanco Document 29, 19 February 1997.
Kjaer J, Ernstsen V, Jacobsen OH, Hansen N, de Jonge LW and Olsen P, 2011. Transport modes and pathways of the strongly sorbing pesticides glyphosate and pendimethalin through structured drained soils. Chemosphere, 84, 471–479.
Appendix N – Does the PECsed represent a ‘realistic worst‐case’ exposure for sediment in edge‐of‐field waterbodies across the EU?
N.1. Introduction
In the current FOCUS surface water scenarios, the OM content of the sediment was intentionally set at the relatively low value of 5%. This was performed to prevent the situation that considerable pesticide mass would enter the sediment and so leave the water layer. In this way, the original FOCUS Surface Water WG intended to maintain the ‘realistic worst‐case’ character of the PECsw values.
However, the FOCUS surface water scenarios are also applied for the prediction of PECsed values for use in the sediment risk assessment of the registration procedure. Below we attempt to assess whether the PECsed represents a ‘realistic worst‐case’ exposure for sediment in edge‐of‐field waterbodies across the EU for the repaired FOCUS scenarios with their 26‐year simulation period. To do so, we first consider existing measurements of OM content in sediment as a function of depth and next we compare maximum PECsed values obtained in FOCUS water bodies with the current FOCUS sediment to those obtained with a Dutch sediment with a higher, but not extreme, OM content.
N.2. Materials and methods
N.2.1. Sediment measurements
As far as we know very few measurements exist on the sediment properties as a function of depth across the EU. The FOCUS Surface Water Repair WG is only aware of data sets for the Netherlands, where the sediment properties have been measured for the experimental ditches (having a 50‐cm water depth) of the Wageningen University and Research Centre (WUR) 1 year after their construction and 5 years later, as well as for four edge‐of‐field ditches spread over the Netherlands and next to arable crops, carrying at least 20 cm water all year round (Adriaanse et al., 2015). The data on OM content demonstrate that significantly higher values than the 5% OC (equalling 8.6% OM) may occur in natural or semi‐natural ditches (Table N.1).
Table D.2.
Irrigated scenario/crop combinations: New and former mean annual irrigation volumes; values for irrigation parameter PCDEPL to achieve a cumulated irrigation amount similar to FOCUS irrigation; field crops: new option 5 (over canopy, without surface run‐off; tall crops: new option 6 (under canopy, without surface run‐off); FLEACH = 0; RATEAP = 0.125
| Scenario | Crop | Irrigation Option | New mean annual irrigation volume (mm/a) with PCDEPL = 0.4 | Former mean annual irrigation volume (mm/a) (FOCUS, 2001) | PCDEPL resulting in irrigation volumes closest to FOCUS (2001) | Factor new/old irrigation volumes |
|---|---|---|---|---|---|---|
| R1 | Potatoes | 5 | 106 | 87 | 0.36 | 1.22 |
| Maize | 5 | 63 | 47 | 0.36 | 1.34 | |
| Sunflowers | 5 | 57 | 30 | 0.31 | 1.90 | |
| Sugar beets | 5 | 76 | 60 | 0.36 | 1.27 | |
| Vegetables, root | 5 | 133 | 111 | 0.35 | 1.20 | |
| Vegetables, leafy | 5 | 83 (48 + 35) | 131 | 0.54 (1st), 0.45 (2nd) | 0.63 | |
| Vegetables, bulb | 5 | 138 | 104 | 0.32 | 1.33 | |
| Legumes | 5 | 94 | 78 | 0.37 | 1.21 | |
| R3 | Potatoes | 5 | 276 | 276 | 0.40 | 1.00 |
| Sugar beets | 5 | 269 | 284 | 0.42 | 0.95 | |
| Field beans | 5 | 58 | 47 | 0.33 | 1.23 | |
| Vegetables, root | 5 | 42 | 39 | 0.36 | 1.09 | |
| Vegetables, leafy | 5 | 243 (50 + 194) | 305 | 0.38 (1st), 0.51 (2nd) | 0.80 | |
| Vegetables, bulb | 5 | 75 | 54 | 0.33 | 1.39 | |
| Legumes | 5 | 105 | 104a | 0.39 | 1.01 | |
| Vegetables, fruiting | 5 | 201 | 233 | 0.46 | 0.86 | |
| Maize | 5 | 219 | 258 | 0.47 | 0.85 | |
| Sunflower | 5 | 159 | 176 | 0.43 | 0.90 | |
| Soybeans | 5 | 267 | 282 | 0.44 | 0.95 | |
| Tobacco | 5 | 232 | 293 | 0.51 | 0.79 | |
| R4 | Maize | 5 | 382 | 398 | 0.44 | 0.96 |
| Field beans | 5 | 122 | 108 | 0.34 | 1.13 | |
| Root veg | 5 | 101 | 128 | 0.69 | 0.79 | |
| Vegetables, leafy | 5 | 398 (126 + 272) | 492 | 0.36 (1st), 0.65 (2nd) | 0.81 | |
| Bulb veg | 5 | 131 | 125 | 0.39 | 1.05 | |
| Legumes | 5 | 157 | 186 | 0.62 | 0.84 | |
| Fruit veg | 5 | 221 | 222 | 0.40 | 1.00 | |
| Pome/stone fruit | 6 | 318 | 317 | 0.40 | 1.00 | |
| Sunflower | 5 | 323 | 266 | 0.33 | 1.21 | |
| Soybeans | 5 | 484b | 159 | < 0.1 | 3.04 | |
| citrus | 6 | 110 | 113 | 0.41 | 0.97 |
Table 4.1.4‐2 in FOCUS (2001) gives 305 mm/a, but the actual mean annual irrigation volume in the corresponding weather file is 104 mm/a.
The high irrigation demand for soybean calculated in PRZM is most probably due to the combination of a relatively long cropping season with a relatively shallow (too shallow?) maximum root depth.
Table N.1.
Overview of measured organic matter contents (%) in four Dutch ditches and the experimental ditches of the WUR 1 year after their construction and 5 years later
| Depth (cm) | 4 NL ditches | Exp. ditches 1990 | Exp. ditches 1995 |
|---|---|---|---|
| 0–1 | 10–30 | 3.7–5.5 | 26 |
| 1–2 | 9–29 | 1.5–1.8 | 19 |
| 2–3 | 8–26 | 1.5–1.8 | 6 (for 2–4 cm layer) |
N.2.2. Simulations
For the R1 pond and stream scenarios, 26‐year simulations were performed for a winter cereals crop and 10 applications of 1 kg/ha at a 7‐day application interval during the crop development period of BBCH stages 21–90. Used rules for the PAT were 10, 10, 2, 2, 2, 2, 3, 3 (for explanation see Table H.1, first column). Simulations were performed for the R1 waterbodies having either the FOCUS sediment or the ‘Dutch KNO June 2013’ sediment of Adriaanse et al. (2015) (Table N.2). The latter represents a ‘fluffy’ sediment with clearly higher OM contents (and lower bulk density and higher porosity) than that found in one of the FOCUS sediment, but is not an extreme case out of the analysed sediments. Simulations were executed for the compounds G, H and I (DegT50soil = 300 days, DegT50water = 100 days and Koc = 10, 100 and 1,000 mL/g, respectively).
Table D.3.
Mean and standard deviation of calibrated PCDEPL for the three irrigated R scenarios. Field crops: new option 5 (over canopy, without surface run‐off; tall crops: new option 6 (under canopy, without surface run‐off). Parameter settings: PCDEPL = 0.4; FLEACH = 0; RATEAP = 0.125
| Scenario | Mean | SD | Sample sizea |
|---|---|---|---|
| R1‐Weiherbach | 0.38 | 0.07 | 9 |
| R3‐Bologna | 0.42 | 0.06 | 13 |
| R4‐Roujan | 0.46 | 0.13 | 11b |
The two cropping seasons of leafy vegetables were counted separately.
R4/soybean was excluded because no calibration could be achieved within a reasonable range of PCDEPL.
We considered the annual maximum PECsed values in the 0–1 and 0–5 cm target layers and selected the 92.5th percentile value of the 20‐year FOCUS evaluation period to represent the ‘realistic worst‐case’ exposure. Next, the two values from the FOCUS and Dutch sediment were compared. In addition, the two values of the 92.5th percentile PECsw were compared to assess whether the changed sediment OM content affected the PECsw values.
Table N.2.
Sediment properties as function of depth for the selected Dutch ditch sediment (‘KNO June 2013’ of Adriaanse et al., 2014) used in the simulations
| Depth (cm) | Organic matter content (%) | Bulk density (g/mL) | Porosity (–) |
|---|---|---|---|
| 0–1 | 22 | 0.19 | 0.93 |
| 1–2 | 20 | 0.31 | 0.87 |
| 2–3 | 18 | 0.35 | 0.90 |
N.3. Results and discussion
Both for the 0–1 and 0–5 cm top layer, the R1 pond and R1 stream have a PECsed that is significantly lower for the FOCUS sediment than it is for the Dutch ditch sediment (Figure N.1 and Tables N.3 and N.4). As the 0–1 cm sediment layer reacts faster to concentration changes in the overlying water layer, the difference between the two PECsed values of the 0–1 cm top layer is greater than between the two PECsed values of the 0–5 cm top layer.
Table D.4.
Ratio between new and former mean annual irrigation volumes for the three irrigated R scenarios. Field crops: new option 5 (over canopy, without surface run‐off; tall crops: new option 6 (under canopy, without surface run‐off). Parameter settings: PCDEPL = 0.4. FLEACH = 0; RATEAP = 0.125
| Scenario | Mean | SD | Sample sizea |
|---|---|---|---|
| R1‐Weiherbach | 1.26b | 0.34 | 8 |
| R3‐Bologna | 0.98 | 0.18 | 12 |
| R4‐Roujan | 1.16 | 0.64 | 11 |
| R‐4 Roujan without soybean | 0.98 | 0.14 | 10 |
The two cropping seasons of leafy vegetables were counted as one crop, because in FOCUS (2001) irrigation occurs also between the two cropping seasons.
If the soil profile depth of R1 were increased, irrigation volumes for Weiherbach would decrease for the crops rooting deeper than 1 m that are irrigated in R1 (maize and sugar beet).
Table D.5.
New switches and parameters used for automatic irrigations in MACRO
| Parameter | Description |
|---|---|
| 1 | 0 = No automatic irrigations, 1 = automatic irrigations are used |
| 1 | aIrrigation under crop canopy (= 1) or above canopy (= 0) |
| 0 | 0 = User‐defined irrigation amount, 1 = Automatic calculation of irrigation amount (default) |
| f crit | bCritical fraction for triggering automatic irrigation |
| 0.95 | Fraction of plant‐available water replenishment |
| 5 | Irrigation intensity (mm h−1) |
| 30 | Irrigation amount (mm) IF user‐defined irrigation amount) |
Set to 1 for tall crops and zero for short crops.
fcrit = 0.1 for D3 scenarios, 0.42 for D4 and 0.46 for D6 scenarios, calculated from the topsoil water retention data and a critical tension of −300 cm.
These results demonstrate that the OC content of 5% (equal to an OM content of 8.6%) of the FOCUS sediment is likely not to represent a ‘realistic worst‐case’ exposure in sediment in all the edge‐of‐field waterbodies across the EU. It is important to realise that they do not represent a ‘best‐case’ exposure, because the FOCUS surface water scenarios intend to represent ‘realistic worst‐case’ exposure concentrations in surface waters and the concentrations in the overlying water layer form one of the most important driving factors for the PECsed.
That the concentration in the overlying water layer forms one of the most important driving factors for the PECsed is illustrated by comparing results in the R1 stream to those in the R1 pond. The PECsed values for the 0–1 cm top layer of the R1 stream are slightly higher than those of the R1 pond. Although the hydraulic residence time of the R1 pond is much higher (around 10–170 days) than the residence time of the R1 stream (less than 0.5 days), and so there is more time for diffusion into the sediment, the water concentration in the R1 stream is so much higher than the water concentration in the R1 pond (approximately three to four times higher; Tables N.3 and N.4), that this dominates the resulting PECsed values.
Concerning the PECsw, there is virtually no difference for compounds with a Koc of up to 1,000 mL/g (Figure N.2 and Tables N.3 and N.4). The reason is that: (i) relatively few mass diffuses from the water layer into the sediment (generally around a maximum of 10% of the applied mass for compounds with a Koc value of approximately 1,000 mL/g), and (ii) the timings of the maximum PECsw and PECsed differ, i.e. the PECsw is maximal during an entry of pesticide mass into the water layer, while the maximum PECsed is often later, after penetration of mass into the sediment.
Table N.3.
The 92.5th percentile values of the 20 annual maximum values for the PECsw and PECsed of the 0–1 and 0–5 cm top layers of the sediment for the compounds G, H and I for the R1 pond of the repaired FOCUS scenarios
| Compound (Koc in mL/g) | Water PECsw,max (μg/L) | Sediment 0–1 cm PECsed,max (μg/kg DW) | Sediment 0–5 cm PECsed,max (μg/kg DW) | |||
|---|---|---|---|---|---|---|
| FOCUS sed | NL sed | FOCUS sed | NL sed | FOCUS sed | NL sed | |
| G (10) | 23.51 | 23.46 | 21.42 | 112.4 | 10.90 | 36.49 |
| In year | 1992 | 1992 | 1992 | 1992 | 1992 | 1992 |
| H (100) | 29.99 | 29.93 | 99.96 | 357.0 | 36.31 | 97.68 |
| In year | 1992 | 1992 | 1992 | 1992 | 1979 | 1992 |
| I (1000) | 34.54 | 34.08 | 704.5 | 2538.6 | 241.4 | 632.6 |
| In year | 1975 | 1975 | 1975 | 1975 | 1979 | 1979 |
Table N.4.
The 92.5th percentile values of the 20 annual maximum values for the PECsw and PECsed of the 0–1 and 0–5 cm top layers of the sediment for the compounds G, H and I for the R1 stream of the repaired FOCUS scenarios
| Compound (Koc in mL/g) | Water PECsw,max (μg/L) | Sediment 0–1 cm PECsed,max (μg/kg DW) | Sediment 0–5 cm PECsed,max (μg/kg DW) | |||
|---|---|---|---|---|---|---|
| FOCUS sed | NL sed | FOCUS sed | NL sed | FOCUS sed | NL sed | |
| G (10) | 91.08 | 91.05 | 44.18 | 281.3 | 9.150 | 34.72 |
| In year | 1976 | 1976 | 1992 | 1992 | 1992 | 1992 |
| H (100) | 116.4 | 116.4 | 118.4 | 650.2 | 24.33 | 72.89 |
| In year | 1982 | 1982 | 1975 | 1975 | 1975 | 1975 |
| I (1,000) | 81.27 | 81.26 | 608.0 | 2,709.2 | 140.3 | 333.2 |
| In year | 1990 | 1990 | 1975 | 1975 | 1975 | 1975 |
Figure N.1.
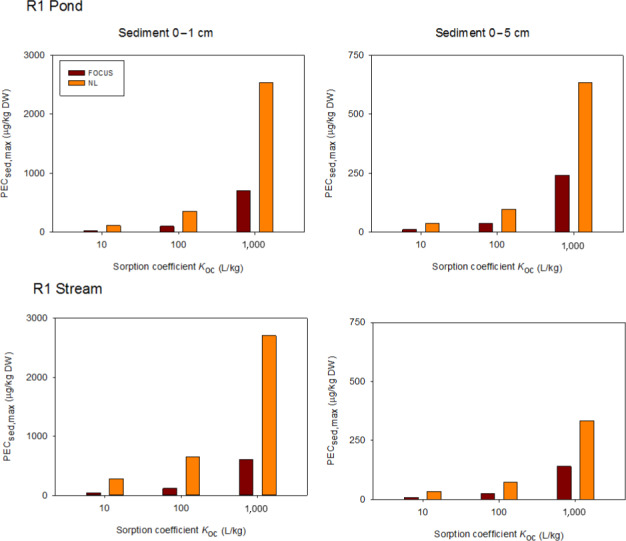
Selected 92.5th percentile values of the 20 annual maximum PEC sed values in the 0–1 and 0–5 cm sediment top layers as a function of the Koc of the simulated compounds for the R1 pond (top) and R1 stream (bottom) having the FOCUS sediment or the selected Dutch sediment (with a higher organic matter content) in the repaired FOCUS scenarios
Figure N.2.
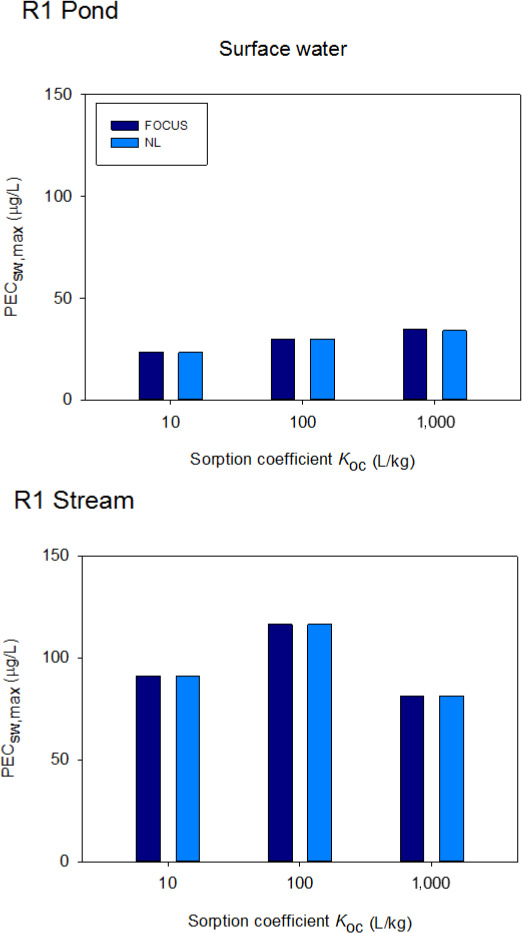
Selected 92.5th percentile values of the 20 annual maximum PEC sw values as a function of the Koc of the simulated compounds for the R1 pond (top) and R1 stream (bottom) having the FOCUS sediment or the selected Dutch sediment (with a higher organic matter content) in the repaired FOCUS scenarios
N.4. Conclusions and recommendations
The FOCUS sediment with its OC content of 5% probably does not represent a ‘realistic worst‐case’ exposure in sediment (PECsed) in all the edge‐of‐field waterbodies across the EU. In contrast, it neither represents a ‘best‐case’ exposure, because the FOCUS surface water scenarios intend to represent ‘realistic worst‐case’ exposure concentrations in surface waters and the concentrations in the overlying water layer form one of the most important driving factors for the PECsed.
For compounds with a Koc of up to 1,000 mL/g, the PECsw is virtually not affected by the size of the OM content in the sediment and so aquatic risk assessments do not depend on the type of sediment in the FOCUS scenarios. For compounds with sorption coefficients that are significantly higher than 1,000 mL/g (e.g. pyrethroids), the PECsw values are expected to be lower, in cases in which the underlying sediment contains substantially more than 5% OC. So, this indicates that the PECsw for the current FOCUS sediment with 5% OC is indeed on the conservative side, as is required in risk assessments. However, this indicates also that it is not possible to predict both the PECsed and the PECsw in a conservative way by one set of scenarios.
So, there is a need for separate scenarios: one set (with a sediment having a relatively low OC value) to predict realistic worst‐case PECsw values and another set of scenarios (with a sediment having a relatively high OC value) to predict realistic worst‐case PECsed values. The EFSA FOCUS Surface Water Repair WG recommends the development of specific scenarios to predict ‘realistic worst‐case’ exposure concentrations in sediment to be able to evaluate the risks for benthic organisms and rooted water plants in a scientifically sound way.
Appendix O – Is a sediment thickness of 10 cm sufficient to simulate robust annual maximum PECsed values for the 20‐year evaluation period in the repaired FOCUS scenarios?
O.1. Introduction
In the current FOCUS surface water scenarios, the sediment system consists of a layer of 10 cm with properties such as bulk density, porosity and OM content varying with depth. During the FOCUS_TOXSWA simulation periods of 12 and 16 months (run‐off and drainage scenarios), substances do not penetrate down to 10 cm depth. However, in the repaired FOCUS surface water scenarios with the 26‐year simulation period, mobile substances are expected to reach the end of the 10‐cm‐thick sediment. As in the FOCUS scenarios, vertical transport in sediment has been limited to diffusion‐driven transport only (with no diffusion across the lower boundary to deeper sediment), substance cannot leave the simulated sediment system. Upward and downward seepage of water and pesticide mass are not considered in the FOCUS scenarios.
Therefore, it was tested whether the scenario restriction of 10‐cm sediment thickness affects the sediment exposure concentrations in the target layers of 1 and 5 cm, calculated by TOXSWA. The total thickness of the sediment as well as the (current, rather crude) discretisation of the deeper horizons of the sediment may affect the exposure concentrations of the 26‐year simulation period. So, both the total sediment thickness and its discretisation were tested.
O.2. Setup of the calculations
Simulations were performed for sediment thicknesses of 10 and 50 cm, each with the default and a finer discretisation below 1 cm depth (segments of 0.5 cm). The rules used in the PAT were 10, 10, 2, 2, 2, 2, 3, 3 (for explanation, see the first column of Table H.1). The sediment consists of a number of horizons, each with its own properties such as porosity and OM content. Every horizon is divided into segments of equal size for the numerical solution of the convection–diffusion equation for the sediment (Table O.1).
Table D.6.
Comparison of the annual irrigation of the original FOCUS surface water drainage scenarios (FOCUS, 2001) against the annual average irrigation based on the proposed new automatic irrigation approach
| Annual irrigation of the current single‐year approach (mm) | Annual average irrigation of the 20‐year approach (mm) | |||||
|---|---|---|---|---|---|---|
| Scenario | D3 | D4 | D6 | D3 | D4 | D6 |
| Annual average precipitation (mm) | 693 | 692 | 733 | 747 | 659 | 666 |
| Winter cereals | 93 | 0 | 0 | 50 | 0 | 0 |
| Spring cereals | 110 | 0 | 48 | 0 | ||
| Winter oilseed rape | 0 | 0 | 0 | 0 | ||
| Spring oilseed rape | 0 | 0 | 0 | 0 | ||
| Sugar beets | 138 | 165 | 75 | 41 | ||
| Potatoes | 157 | 155 | 620 | 5 | 12 | 237 |
| Field beans | 95 | 0 | 477 | 30 | 0 | 279 |
| Root vegetables | 138 | 125 | 3 | 0 | ||
| Leafy vegetables | 160 | 160 | 257 | 2 | 14 | 40 |
| Bulb vegetables | 130 | 175 | 160 | 6 | 39 | 162 |
| Legumes | 121 | 150 | 232 | 23 | 30 | 108 |
| Fruiting vegetables | 462 | 202 | ||||
| Maize | 144 | 0 | 565 | 50 | 0 | 366 |
| Vines | 0 | 0 | ||||
| Pome/stone fruit | 123 | 0 | 44 | 0 | ||
| Grass/alfalfa | 268 | 0 | 207 | 0 | ||
| Sunflower | ||||||
| Hops | ||||||
| Soybeans | ||||||
| Citrus | 495 | 748 | ||||
| Olive | 0 | 0 | ||||
| Tobacco | ||||||
| Cotton | 572 | 366 | ||||
0 (zero) values indicate the crop is present but not irrigated.
Shaded boxes indicate that the crop is not present in the scenario.
None of the crops in the D1, D2 and D5 scenario are irrigated.
Table O.1.
Overview of sediment thickness and discretisations tested
| Sediment acronym | Description | Total thickness (cm) | Thickness of deepest segment (cm) | Number of segments × thickness of segment (cm) for all horizons, from top to deepest horizon | Depth of centre of deepest segment (cm) |
|---|---|---|---|---|---|
| Curr_DefDiscr | Current 10 cm, default discretisation | 10 | 3 | 4 × 0.1, 3 × 0.2, 2 × 0.5, 3 × 1, 1 × 2, 1 × 3 | 8.5 |
| Curr_FinDiscr | Current 10 cm, 0.5 cm segments below 1 cm | 10 | 0.5 | 4 × 0.1, 3 × 0.2, 18 × 0.5 | 9.75 |
| Thi_DefDiscr | Thickness 50 cm | 50 | 1 | 4 × 0.1, 3 × 0.2, 2 × 0.5, 3 × 1, 1 × 2, 14 × 3, 1 × 1a | 49.5 |
| Thi_FinDiscr | Thickness 50 cm, 0.5 cm segments below 1 cm | 50 | 0.5 | 4 × 0.1, 3 × 0.2, 98 × 0.5 | 49.75 |
A last horizon of one segment of 1 cm was defined to reach 50 cm.
Substance G was selected for the simulations. As it is mobile and persistent (Koc of 10 mL/g, DegT50soil of 300 days, DegT50water of 100 days, DegT50sed of 300 days), it is expected to penetrate deeply into the sediment. It was applied 10 times in winter cereals with intervals of 3 days and a high dose of 1 kg/ha was used. The input BBCH stages for timing the application were 18–20, corresponding to a first application date of 4 October and last application at 31 October.
Penetration is expected to be maximal for a FOCUS pond (and not a FOCUS ditch or stream). Due to long residence times in the pond, the substance can maximally diffuse from water into the sediment: high concentrations are maintained in the water layer and the substance can enter the sediment over long periods. The D4 pond scenario was selected.
A drainage scenario was selected because, for run‐off scenarios, entries are relatively short, e.g. the hydraulic residence time in the R1 pond is smaller than in the D4 pond, so there is less time for diffusion into the sediment. Erosion entries of the run‐off scenarios with their pesticide mass sorbed to eroded soil and deposited in the upper 1 cm sediment may result in high contributions to sediment for substances with high sorption coefficients; however, such substances diffuse slowly to deeper layers.
So, penetration of substance G in the four types of sediment specified in Table O.1 in the D4 pond was simulated for 10 applications on winter cereals.
O.3. Results and discussion
Contents averaged over the target layers of 0–1 cm and 0–5 cm as well as the content in the deepest segment of the sediment are shown in Figures F.4, F.5, I.1–O.4 for the entire simulation period, hence including the warming‐up period of 6 years.
For the current FOCUS sediment and discretisation, the annual maximum contents in both target layers increase during the warming‐up period; thereafter, they fluctuate from year to year without showing an increasing or decreasing trend over the years (Figure O.1). Contents in the 0–1 cm target layer fluctuate more than those in the 0–5 cm target layer, the reason is that the former layer reacts faster to changes in the overlying water layer than the latter layer. The content in the deepest segment (at 8.5 cm) is in the same range as the contents in the target layers. This indicates that the substance has penetrated downwards till the end of the entire sediment of 10 cm deep.
For the current sediment thickness of 10 cm, but thinner segments below 2 cm, the annual maximum contents in both target layers show the same patterns as the ones for the current FOCUS sediment discretisation. Their values in Figures O.1 and O.2 hardly differ (0.33% or less), as is demonstrated by Table O.2 for the 0–1 cm target layer (columns 2, 3 and 6) and Table O.3 for the 0–5 cm target layer (columns 2, 3 and 6). So, there is hardly any effect of using thinner segments below 2 cm on the annual maximum contents in both target layers for the 10‐cm thick sediment.
Table D.7.
Comparison of the annual irrigation of the original FOCUS surface water run‐off scenarios (FOCUS, 2001) against the annual average irrigation based on the proposed new automatic irrigation approach
| Annual irrigation of the current single‐year approach (mm) | Annual average irrigation of the 20‐year approach (mm) | |||||||
|---|---|---|---|---|---|---|---|---|
| Scenario | R1 | R2 | R3 | R4 | R1 | R2 | R3 | R4 |
| Annual average precipitation (mm) (a) | 744 | 1402 | 682 | 756 | 744 | 1402 | 682 | 756 |
| Winter cereals | 0 | 0 | 0 | 0 | 0 | 0 | ||
| Spring cereals | 0 | 0 | ||||||
| Winter oilseed rape | 0 | 0 | 0 | 0 | ||||
| Spring oilseed rape | 0 | 0 | ||||||
| Sugar beets | 60 | 284 | 76 | 269 | ||||
| Potatoes | 87 | 0 | 276 | 106 | 0 | 276 | ||
| Field beans | 0 | 0 | 47 | 108 | 0 | 0 | 58 | 122 |
| Root vegetables | 111 | 0 | 39 | 128 | 133 | 0 | 42 | 101 |
| Leafy vegetables | 131 | 0 | 305 | 492 | 83 | 0 | 243 | 398 |
| Bulb vegetables | 104 | 0 | 54 | 125 | 138 | 0 | 75 | 131 |
| Legumes | 78 | 0 | 305 | 186 | 94 | 0 | 105 | 157 |
| Fruiting vegetables | 0 | 233 | 222 | 0 | 201 | 221 | ||
| Maize | 47 | 0 | 258 | 398 | 63 | 0 | 219 | 382 |
| Vines | 0 | 0 | 0 | 0 | 0 | 0 | 0 | 0 |
| Pome/stone fruit | 0 | 0 | 0 | 317 | 0 | 0 | 0 | 318 |
| Grass/alfalfa | 0 | 0 | 0 | 0 | ||||
| Sunflower | 30 | 176 | 266 | 57 | 159 | 323 | ||
| Hops | 0 | 0 | ||||||
| Soybeans | 282 | 159 | 267 | 484 | ||||
| Citrus | 113 | 110 | ||||||
| Olive | 0 | 0 | ||||||
| Tobacco | 293 | 232 | ||||||
| Cotton | ||||||||
0 (zero) values indicate the crop is present but not irrigated.
Shaded boxes indicate that the crop is not present in the scenario.
Table G.1.
Crop development stages in AppDate adopted from FOCUS (2001)
| Stage according to FOCUS (2001) | BBCH stage in AppDate | Remarks |
|---|---|---|
| Planting date | BBCH 00 | Set to 10 days before emergence. If not applicable (e.g. some permanent crop), it was not used |
| Emergence date | BBCH 09 | Always given by FOCUS |
| 1 day after emergence | BBCH 10 | All crops |
| 15 days after emergence | BBCH 20 | Only winter crops (begin of hibernation)a |
| 9 days before the next macro stage (i.e. BBCH 30) | BBCH 21c | Only winter crops (end of hibernation)a |
| Spring pointb | BBCH 30 | Only winter crops (to consider hibernation)a |
| Maximum LAI | BBCH 40 | Biennial plants that are harvested in the first year (e.g. leafy vegetables) |
| Harvest | BBCH 50 | Biennial plants that are harvested in the first year (e.g. leafy vegetables) |
| Maximum LAI | BBCH 60 | All annual crops |
| Maximum LAI | BBCH 70 | Hop, vine, pome/stone fruits |
| Harvest | BBCH 90 | All crops except biennial plants that are harvested in the first year |
Winter crops are winter cereals and winter oil seed rape in D1 to D5, R1 and R3, and field beans in D2.
No spring points were defined for the R scenarios by FOCUS (2001). Therefore, for R1 and R3, the spring points for winter cereals and winter oil seed rape given for the FOCUS gw scenarios Kremsmünster and Piacenza were considered, respectively. For R4, the spring points for winter cereals were determined based on GGD analysis.
BBCH 21 is set outside the standard interpolation routine.
Similar to Figure O.1, the content in the deepest segment (at 9.75 cm) in Figure O.2 is in the same range as the contents in the target layers. This indicates that also for the finer discretisation the substance has penetrated downwards till the end of the entire sediment of 10 cm deep.
For the sediment thickness of 50 cm and FOCUS discretisation up to 10 cm deep, again the annual maximum contents in both target layers increase during the warming period, and thereafter, they fluctuate from year to year without presenting an increasing or decreasing trend over the years (Figure O.3). As expected contents in the 0–1 cm target layer fluctuate more than those in the 0–5 cm target layer. However, the content in the deepest segment (at 49.5 cm) is not in the same range as the contents in the target layers, but clearly much smaller. This indicates that for the 50‐cm sediment only few mass has reached the end of the entire sediment.
For the sediment thickness of 50 cm with thinner segments below 2 cm, the annual maximum contents in both target layers show the same patterns as the ones for the 50‐cm sediment with FOCUS discretisation up to 10 cm deep. Similar to the comparison between Figures O.1 and O.2, their values in Figures O.3 and O.4 hardly differ (0.26% or less), as is demonstrated by Table O.2 for the 0–1 cm target layer (columns 4, 5 and 7) and Table O.3 for the 0–5 cm target layer (columns 4, 5 and 7). So, here also there is hardly any effect of using thinner segments below 2 cm on the annual maximum contents in both target layers for the 50‐cm thick sediment.
Table O.3.
Annual maximum PEC sed in target layer 0–5 cm for the four types of sediment of Table O.1 for the 20 FOCUS evaluation years. Difference A vs. B corresponds to 100 × (B − A)/A
| Year | Curr_DefDiscr (μg/kg DW) | Curr_FinDiscr (μg/kg DW) | Thi_DefDiscr (μg/kg DW) | Thi_FinDiscr (μg/kg DW) | Difference Curr_DefDiscr vs Curr_FinDiscr (%) | Difference Thi_DefDiscr vs Thi_FinDiscr (%) | Difference Curr_DefDiscr vs Thi_DefDiscr (%) |
|---|---|---|---|---|---|---|---|
| 1975 | 1,025.1 | 1,022.9 | 974.3 | 972.5 | −0.21 | −0.18 | −4.96 |
| 1976 | 627.4 | 627.3 | 570.3 | 569.7 | −0.02 | −0.11 | −9.10 |
| 1977 | 1,211.4 | 1,207.4 | 1,174.7 | 1,171.6 | −0.33 | −0.26 | −3.03 |
| 1978 | 1,044.6 | 1,043.6 | 977.6 | 976.2 | −0.10 | −0.14 | −6.41 |
| 1979 | 939.6 | 938.2 | 884.6 | 883.1 | −0.15 | −0.17 | −5.85 |
| 1980 | 1,017.9 | 1,017.8 | 963.3 | 962.6 | −0.01 | −0.07 | −5.36 |
| 1981 | 1,266.5 | 1,263.6 | 1,207.7 | 1,205.7 | −0.23 | −0.17 | −4.64 |
| 1982 | 1,070.1 | 1,069.3 | 992.7 | 991.6 | −0.07 | −0.11 | −7.23 |
| 1983 | 1,033.0 | 1,031.2 | 977.3 | 975.9 | −0.17 | −0.14 | −5.39 |
| 1984 | 800.8 | 800.5 | 741.3 | 740.5 | −0.04 | −0.11 | −7.43 |
| 1985 | 811.2 | 809.7 | 768.8 | 767.6 | −0.18 | −0.16 | −5.23 |
| 1986 | 948.2 | 946.4 | 902.5 | 900.7 | −0.19 | −0.20 | −4.82 |
| 1987 | 666.7 | 666.6 | 623.5 | 623.4 | −0.01 | −0.02 | −6.48 |
| 1988 | 1,201.4 | 1,198.3 | 1,155.3 | 1,152.9 | −0.26 | −0.21 | −3.84 |
| 1989 | 477.8 | 478.7 | 418.6 | 418.8 | 0.19 | 0.05 | −12.39 |
| 1990 | 774.3 | 772.1 | 746.8 | 745.3 | −0.28 | −0.20 | −3.55 |
| 1991 | 775.8 | 774.5 | 735.4 | 734.1 | −0.17 | −0.18 | −5.21 |
| 1992 | 819.0 | 818.1 | 768.2 | 767.2 | −0.11 | −0.13 | −6.20 |
| 1993 | 742.2 | 741.9 | 699.7 | 699.1 | −0.04 | −0.09 | −5.73 |
| 1994 | 1,221.0 | 1,218.2 | 1,172.3 | 1,170.2 | −0.23 | −0.18 | −3.99 |
Similar to Figure O.3, the content in the deepest segment (at 49.75 cm) in Figure O.4 is not in the same range as the contents in the target layers, but clearly much smaller. So, also for the finer discretisation, only few mass has reached the end of the 50‐cm deep sediment.
In summary:
A finer discretisation of the sediment below 2 cm has hardly any effect on the contents in the 0–1 and 0–5 target layers (Figures O.1 vs. O.2 and Figures O.3 vs. O.4 and Tables O.2 and O.3) both in the 10‐cm and the 50‐cm sediments.
For the current 10‐cm sediment, the substance penetrates down to the total depth of 10 cm (Figures O.1 and O.2), while for the 50‐cm sediment, only very few mass reaches the end of the sediment (Figures O.3 and O.4).
Figure O.1.
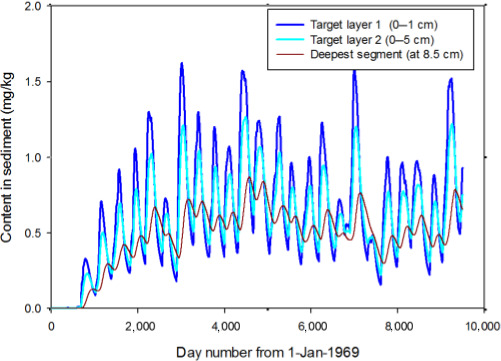
Contents in 0–1 cm and 0–5 cm sediment target layers and in deepest segment (at 8.5 cm) of the current 10‐cm FOCUS sediment for 26 years (so, including 6 warming‐up years)
Figure O.2.
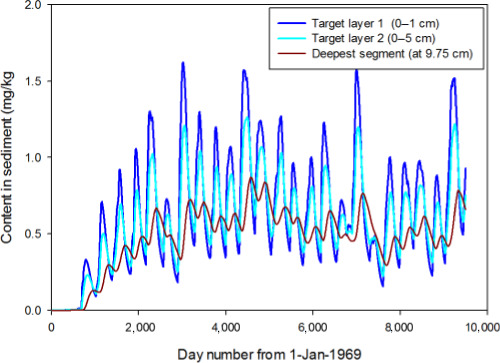
Contents in 0–1 cm and 0–5 cm sediment target layers and in deepest segment (at 9.75 cm) of the current 10‐cm FOCUS sediment but a finer segmentation below 2 cm for 26 years (so, including 6 warming‐up years)
Figure O.3.
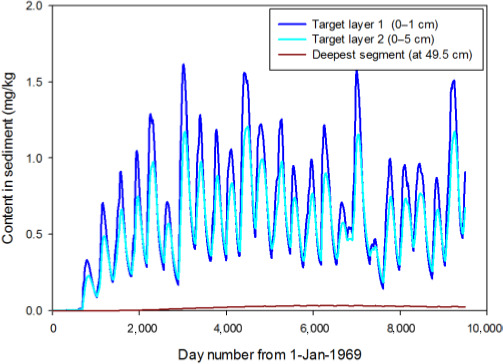
Contents in 0–1 cm and 0–5 cm sediment target layers and in deepest segment (at 49.5 cm) of the 50‐cm sediment (FOCUS segmentation for upper 10 cm) for 26 years (so, including 6 warming‐up years)
Figure O.4.
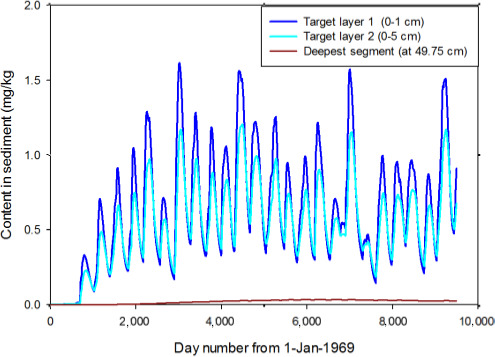
Contents in 0–1 cm and 0–5 cm sediment target layers and in deepest segment (at 49.75 cm) of the 50‐cm sediment with a finer segmentation below 2 cm for 26 years (so, including 6 warming‐up years)
The second conclusion is confirmed by Figure O.5, in which the content is shown as a function of depth for the 10‐cm as well as the 50‐cm sediment at two times. At both times, substantial mass has reached the end of the 10‐cm sediment, while very few mass has penetrated down to 50 cm. The two graphs also demonstrate that the content at 10 cm depth is higher in the 10‐cm sediment than in the 50‐cm sediment, so illustrating that in the 10‐cm system, the mass is unable to leave the sediment system, but is retained within the system. So, the 10‐cm system results in conservative PECsed values compared with the 50‐cm system.
This is further detailed in column 8 of Tables O.2 and O.3. For all 20 years, PECsed values for the 0–1 cm target layer and the 0–5 cm target layer of the 10‐cm and 50‐cm sediments are compared. For the 0–1 cm sediment, the 50‐cm sediment results in up to 2.18% (1976) lower values (column 8 of Table O.2) compared with those of the 10‐cm sediment. For the 0–5 cm sediment, the 50‐cm sediment results in up to 12.39% (1989) lower values (column 8 of Table O.3) compared with those of the 10‐cm sediment. So, indeed the 10‐cm system results in conservative PECsed values compared with the 50‐cm system.
Table O.4 was composed to see whether the discretisation or simulated sediment thickness influences the PECsw, the concentration in the overlying water layer, Compared with the current 10‐cm sediment, a finer discretisation has virtually no influence on the PECsw (column 6). The 50‐cm sediment results in up to 0.6% lower PECsw values for the overlying water (column 7), so, also for the PECsw, the current 10‐cm sediment results in conservative values compared with the 50‐cm system.
O.4. Final conclusions
For a worst‐case combination of substance, application scheme and waterbody with long hydraulic residence times, it was demonstrated that for the 26 simulation years of the repaired FOCUS scenarios pesticide mass diffuses down to the end of the 10‐cm thick sediment system. In a 50‐cm thick sediment, only very few mass reached the lower boundary of the system (Figure O.5).
Both in the 10‐cm and the 50‐cm sediment, a finer discretisation below 2 cm had hardly any effect on the annual maximum contents in the 0–1 and 0–5 target layers (Figures O.1 vs. O.2 and Figures O.3 vs. O.4 and columns 6 and 7 of Tables O.2 and O.3).
The current 10‐cm FOCUS sediment results in conservative PECsed values in the 0–1 cm and 0–5 cm target layers (column 8 of Tables O.2 and O.3) as well as PECsw (Table O.4) compared with a 50‐cm sediment. This is because there is no downward seepage through the sediment in the FOCUS scenarios and there is no diffusion across the lower boundary of the 10‐cm sediment. So, all mass is retained in the sediment system. For the studied worst‐case combination of substance, application scheme and waterbody, the 10‐cm sediment does not result in too conservative estimates: for the 20 evaluation years, PECsw values were maximally 0.6% lower for the 50‐cm sediment with its more realistic content with depth profiles, while the PECsed values were 2.2% (0–1 cm target layer; Table O.2) and 12.4% (0–5 cm target layer; Table O.3) lower. The annual maximum values used in the aquatic risk assessment may be less conservative for these maximum values, as these are from the percentile year, which is not necessarily the year with the most conservative exposure contents.
The tested combination consisted of a mobile persistent substance with an intensive application scheme of 10 applications with a 3‐day interval and high rate of 1 kg/ha on winter cereals and the D4 pond with long hydraulic residence times and continuous entries by drainage. In more exceptional cases (e.g. pome, stone fruit with approximately 10 times higher spray drift entries, 4.7% instead of the 0.2% for winter cereals; or a ditch with prolonged periods with hardly any flow and important spray drift entries) with significantly higher concentrations in the water, the PECsed values might become more conservative and increasing the sediment system to a thickness of 50 cm may be an option for a more realistic, higher tier sediment risk assessment, e.g. for herbicides having effects on water plants.
Figure O.5.
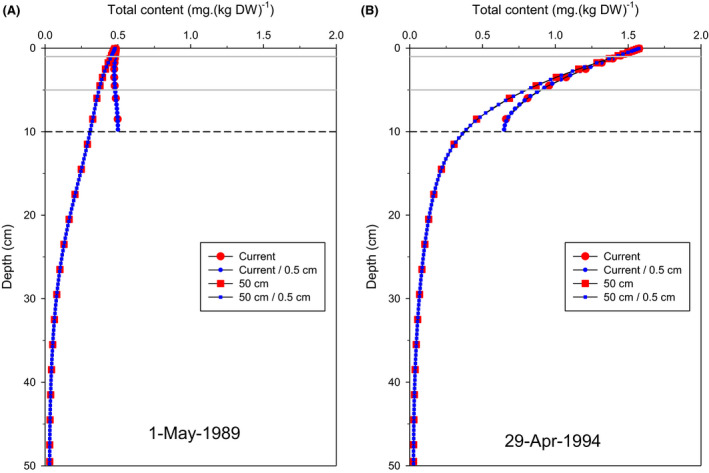
Contents in sediment as function of depth for the four tested sediment types at two dates: (A) on 1 May 1989, when the difference of calculated annual maximum exposure content in the 0–5 cm target layer between the 10‐cm and 50‐cm sediment is largest for the 20 years evaluation period, and (B) on 29 April 1994 at the time of the annual maximum exposure in the final year of simulation, considered more representative for other years
Table O.2.
Annual maximum PEC sed in target layer 0–1 cm for the four types of sediment in Table O.1 for the 20 FOCUS evaluation years. Difference A vs. B corresponds to 100 × (B − A)/A
| Year | Curr_DefDiscr (μg/kg DW) | Curr_FinDiscr (μg/kg DW) | Thi_DefDiscr (μg/kg DW) | Thi_FinDiscr (μg/kg DW) | Difference Curr_DefDiscr vs. Curr_FinDiscr (%) | Difference Thi_DefDiscr vs. Thi_FinDiscr (%) | Difference Curr_DefDiscr vs. Thi_DefDiscr (%) |
|---|---|---|---|---|---|---|---|
| 1975 | 1,301.9 | 1,301.3 | 1,289.9 | 1,289.2 | −0.05 | −0.05 | −0.92 |
| 1976 | 728.4 | 728.4 | 712.5 | 712.3 | 0.00 | −0.03 | −2.18 |
| 1977 | 1,626.3 | 1,625.1 | 1,617.5 | 1,616.4 | −0.07 | −0.07 | −0.54 |
| 1978 | 1,299.9 | 1,299.4 | 1,283.1 | 1,282.5 | −0.04 | −0.05 | −1.29 |
| 1979 | 1,200.2 | 1,199.6 | 1,185.5 | 1,184.9 | −0.05 | −0.05 | −1.22 |
| 1980 | 1,442.0 | 1,441.3 | 1,428.9 | 1,428.1 | −0.05 | −0.06 | −0.91 |
| 1981 | 1,574.8 | 1,574.0 | 1,562.1 | 1,561.2 | −0.05 | −0.06 | −0.81 |
| 1982 | 1,241.5 | 1,241.3 | 1,222.8 | 1,222.4 | −0.02 | −0.03 | −1.51 |
| 1983 | 1,269.9 | 1,269.2 | 1,256.3 | 1,255.8 | −0.06 | −0.04 | −1.07 |
| 1984 | 965.2 | 965.1 | 949.9 | 949.6 | −0.01 | −0.03 | −1.59 |
| 1985 | 1,016.6 | 1,015.7 | 1,004.9 | 1,003.9 | −0.09 | −0.10 | −1.15 |
| 1986 | 1,230.4 | 1,229.8 | 1,219.0 | 1,218.3 | −0.05 | −0.06 | −0.93 |
| 1987 | 857.5 | 857.2 | 846.6 | 846.2 | −0.03 | −0.05 | −1.27 |
| 1988 | 1,583.8 | 1,582.8 | 1,573.4 | 1,572.5 | −0.06 | −0.06 | −0.66 |
| 1989 | 597.5 | 597.2 | 588.5 | 588.2 | −0.05 | −0.05 | −1.51 |
| 1990 | 1,002.9 | 1,002.2 | 995.7 | 995.1 | −0.07 | −0.06 | −0.72 |
| 1991 | 966.4 | 966.1 | 956.3 | 955.9 | −0.03 | −0.04 | −1.05 |
| 1992 | 977.8 | 977.5 | 965.4 | 965.0 | −0.03 | −0.04 | −1.27 |
| 1993 | 1,008.0 | 1,007.4 | 997.3 | 996.7 | −0.06 | −0.06 | −1.06 |
| 1994 | 1,523.8 | 1,522.8 | 1,512.8 | 1,512.0 | −0.07 | −0.05 | −0.72 |
Table O.4.
Annual maximum PEC sw for the four types of sediment of Table O.1 for the 20 FOCUS evaluation years. Difference A vs. B corresponds to 100 × (B − A)/A
| Year | Curr_DefDiscr (μg/L) | Curr_FinDiscr (μg/L) | Thi_DefDiscr (μg/L) | Thi_FinDiscr (μg/L) | Difference Curr_DefDiscr vs Curr_FinDiscr (%) | Difference Curr_DefDiscr vs Thi_DefDiscr (%) |
|---|---|---|---|---|---|---|
| 1975 | 1,114.5 | 1,114.4 | 1,112.4 | 1,112.3 | −0.01 | −0.19 |
| 1976 | 603.5 | 603.6 | 599.9 | 600.0 | 0.02 | −0.60 |
| 1977 | 1,393.3 | 1,393.2 | 1,391.6 | 1,391.5 | −0.01 | −0.12 |
| 1978 | 1,095.3 | 1,095.3 | 1,092.3 | 1,092.2 | 0.00 | −0.27 |
| 1979 | 1,023.5 | 1,023.5 | 1,020.5 | 1,020.4 | 0.00 | −0.29 |
| 1980 | 1,248.7 | 1,248.7 | 1,246.7 | 1,246.7 | 0.00 | −0.16 |
| 1981 | 1,340.0 | 1,339.9 | 1,338.1 | 1,338.0 | −0.01 | −0.14 |
| 1982 | 1,024.6 | 1,024.6 | 1,021.6 | 1,021.6 | 0.00 | −0.29 |
| 1983 | 1,,058.8 | 1,058.7 | 1,056.4 | 1,056.3 | −0.01 | −0.23 |
| 1984 | 810.0 | 810.0 | 807.0 | 807.0 | 0.00 | −0.37 |
| 1985 | 918.3 | 918.3 | 916.3 | 916.2 | 0.00 | −0.22 |
| 1986 | 1,052.3 | 1,052.3 | 1,050.3 | 1,050.3 | 0.00 | −0.19 |
| 1987 | 733.5 | 733.5 | 731.2 | 731.2 | 0.00 | −0.31 |
| 1988 | 1,356.8 | 1,356.7 | 1,355.1 | 1,355.0 | −0.01 | −0.13 |
| 1989 | 538.6 | 538.6 | 536.2 | 536.2 | 0.00 | −0.45 |
| 1990 | 849.8 | 849.8 | 848.0 | 848.0 | 0.00 | −0.21 |
| 1991 | 807.7 | 807.6 | 805.7 | 805.6 | −0.01 | −0.25 |
| 1992 | 809.5 | 809.5 | 807.1 | 807.0 | 0.00 | −0.30 |
| 1993 | 873.6 | 873.5 | 871.5 | 871.4 | −0.01 | −0.24 |
| 1994 | 1,269.4 | 1,269.3 | 1,267.7 | 1,267.6 | −0.01 | −0.13 |
Appendix P – Replacing monthly average water temperatures (current FOCUS sw scenarios) by daily estimates (repaired FOCUS sw scenarios)
1.
The temperature of the water layer affects the transformation rate of pesticides in surface water. In the FOCUS sw scenarios, transformation is modelled as a lumped process, assuming one transformation rate for the total pesticide mass in the water layer. However, at least three separate transformation processes can be considered for transformation in water: hydrolysis, photolysis and biotic transformation. Of these three processes, photolysis is not affected by temperature, while hydrolysis and biotic transformation rates do depend on the water temperature, according to the Arrhenius equation (e.g. Adriaanse et al., 2012).
In the current FOCUS sw scenarios, a monthly average water temperature is applied in the scenario calculations, equal to the monthly average air temperature of the location of the meteorological station belonging to each of the 10 scenarios. In the repaired FOCUS sw scenarios, this approach was improved by using a 3‐day moving average air temperature (of the day itself and the 2 previous days) to represent the daily water (and sediment) temperature in the scenario calculations. To avoid frozen water in the simulations, daily air temperatures below 4°C have been corrected to 4°C, this being the temperature with the maximum density for non‐frozen water, similar to that performed in the current FOCUS surface water scenarios (p. 100, FOCUS, 2001). Note that the water temperature will influence not only the transformation rates in water and sediment but also the volatilisation rate and diffusion rate in the sediment (Beltman et al., 2017).
The approach of using a 3‐day moving average air temperature represents a commonly applied simple deterministic approach, establishing a relationship between the air and the water temperature. For example, the SWAT model (Neitsch et al., 2002) uses average daily water temperatures that are calculated by a linear regression equation developed for a well‐mixed stream linking the average air temperature of the day to the water temperature of the day. However, the water temperature is also influenced by factors such as solar radiation, evaporation and precipitation, inflow of groundwater, water depth and inflow and outflow (Caissie, 2006). In the FOCUS scenarios, the lateral inflow of the run‐off and drainage water also contributes considerably to the surface water temperature and run‐off and drainage through macropores are fast routes, so their water temperature will be close to the air temperature. Crisp and Howson (1982) modelled 5‐day or 7‐day mean water temperatures with linear relationships on 5‐day and 7‐day mean daily air temperatures using data from eight UK small streams (0.04–1.5 m3 s−1), explaining 86–96% of the water temperature variability. Hadzima‐Nyarko et al. (2014) carried out a cross‐correlation between daily mean air temperature and daily water temperature for a tributary of the Danube river, at 323 km from the source. They found that the daily river temperature depended mostly on the mean air temperature of 2 days before. They modelled the water temperature with artificial network models, showing that next to the current mean air temperature the daily mean air temperatures of the 2 previous days and the day of the year have a significant impact on the value of the daily water temperature.
The Workgroup wanted to improve the approach of using scenario‐specific monthly average air temperature for the daily water temperature, while maintaining a simple approach. It was therefore decided to establish a simple relationship between daily air and water temperatures for two available data sets for the Netherlands with depths relevant for the FOCUS surface water scenarios: one for a stagnant, experimental ditch of 50 cm deep with side slopes of 3:2 (horizontal:vertical) in Renkum (data described in Deneer et al., 2010), and one for a saline water pond of 32 cm deep with an estimated flow velocity of a few cm per second in Zeeland (Jacobs et al., 2009). The experimental ditch (ditch 18) is characterised by a bare sandy bottom and contained no macrophytes. The temperature of water was measured halfway the depth and recorded as 15 min averages. From these averages, daily average water temperatures were calculated. Daily average air temperatures were measured at 1.5 m height at the meteorological station of Wageningen (approximately 8 km west of the ditch). Air temperatures for the month February and for 30 March 1991 were not available. The pond in Zeeland was an open waterbody of 10 × 100 m used for aquaculture. Temperature measurements for water and for air, observed directly at the waterbody, were recorded each 30 min at a depth of 20 cm below the water surface during the period 24 June 2008 to 11 March 2009. From these values, daily averages were calculated.
Inspired by the studies of Crisp and Howson (1982) and Hadzima‐Nyarko et al. (2014), moving average air temperatures over a few days were used to estimate the daily water temperature. Below the results are shown for moving average air temperatures for: (i) the day itself (1‐day average), (ii) the day itself up to 2 days before (3‐day average) and (iii) the day itself up to 4 days before (5‐day average).
Figure P.1 for the experimental ditch shows that the pattern of the averaged air temperatures is similar to that of the water temperature. However, in spring (approximately days 100–180), the averaged air temperatures generally are some degrees lower. In periods that the 1‐day, 3‐day and 5‐day average daily air temperature dropped below 4°C and was set to 4°C, the water temperature is clearly lower than the averaged air temperatures. Figure P.1, but more clearly Figure P.2, shows that the 3‐day and 5‐day average air temperatures follow best the pattern of the water temperature, whereas the 1‐day average is more ‘peaky’ compared with the water temperature. Figure P.3 shows the relationship between the water temperature and the average water temperature, corresponding best between approximately 5 and 20–25°C.
Figure P.4 for the Zeeland pond shows that the pattern of the averaged air temperatures is similar to that of the water temperature. However, in June/July (up to day 65), the averaged air temperatures are generally some degrees lower. In periods when the daily air temperature dropped below 4°C and was set to 4°C, the water temperature is clearly lower than the averaged air temperatures. From December 2008 onwards, the underwater thermometer regularly indicated that some ice was formed in the pond and, as shown, the water temperature regularly was below 4°C. Figure P.4, but more clearly Figure P.5, shows that all three (1‐day, 3‐day and 5‐day averaged) air temperatures follow the pattern of the water temperature quite well, but the 1‐day air temperature is slightly more ‘peaky’ than the water temperature. Figure P.6 shows the relationship between the water temperature and the averaged air temperatures, the 1:1 line indicates the perfect match. The results demonstrate that, except for water temperatures below approximately 5°C, the averaged air temperatures are in general a few degrees lower than the water temperature, corresponding seemly best between approximately 5°C and 20°C.
Figure I.9.
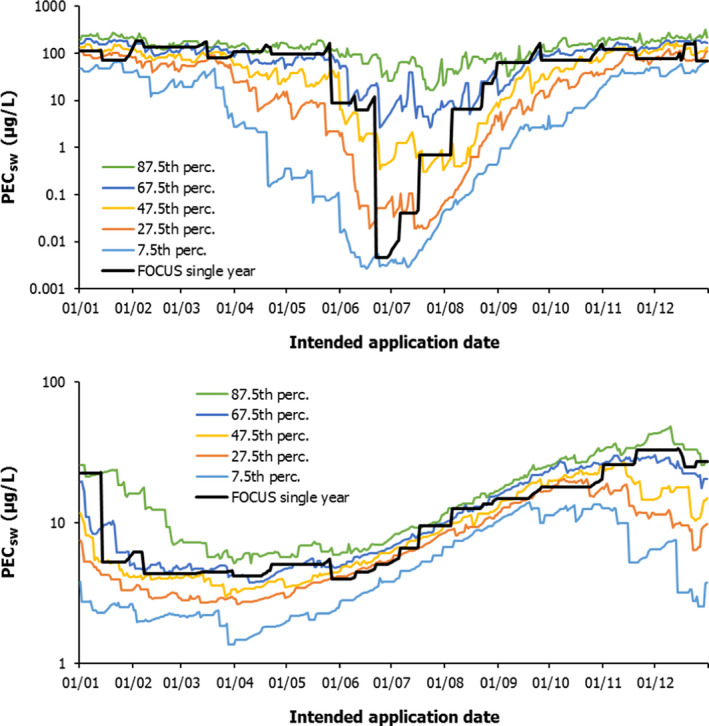
PEC sw (μg/L) for dummy substance A (top) and dummy substance F (bottom) in the drainage scenario D2 based on the new 20‐year assessment approach (7.5th to the 87.5th percentile, 7‐day application window) and the current FOCUS single‐year assessment approach, in relation to the intended application date (winter cereals, 1 × 1 kg/ha to the soil surface, drainage only, no drift)
The root mean squared error (RMSE) was used to quantify the correspondence between the Twater and Tx‐d,moving averaged air for the three averaging periods. RMSE was determined after excluding data pairs with daily average water temperature below 4°C. (Note that the averaged air temperatures below 4°C had already been replaced by 4°C.) For the experimental ditch data, the 3‐day averaged air temperatures gave the lowest RMSE. For the Zeeland pond, the 1‐day and 3‐day average air temperatures are quite close, the 3‐day averaged air temperatures had a slightly higher RMSE value than the 1‐day averaged air temperatures.
Table P.1.
RMSE values for the relationship between the measured average daily water temperature and 1‐day, 3‐day and 5‐day averaged air temperatures for the experimental ditch and the Zeeland pond for the indicated periods (water temperatures below 4°C were excluded for the calculation of the RMSE)
| Period of averaged air temperatures | Experimental ditch 1991 | Zeeland pond 24 June 2008 to 11 March 2009 |
|---|---|---|
| 1‐day averaged | 2.961 | 2.123 |
| 3‐day averaged | 2.735 | 2.134 |
| 5‐day averaged | 2.856 | 2.384 |
Figure P.1.
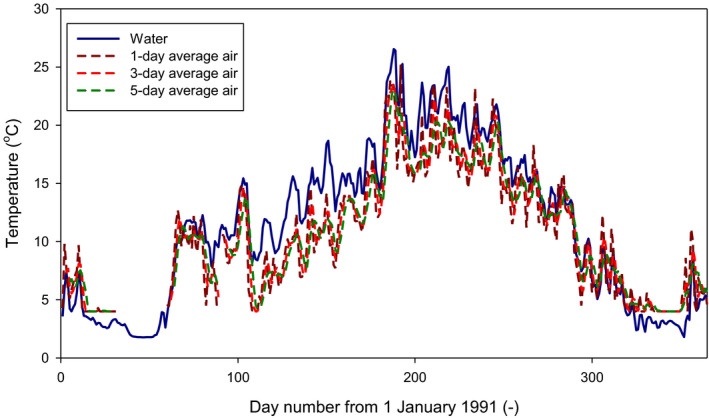
Measured average daily water temperatures and 1‐day, 3‐day and 5‐day averaged air temperatures measured as a function of time for the experimental ditch in 1991
- Air temperatures for February were not available.
Figure P.2.
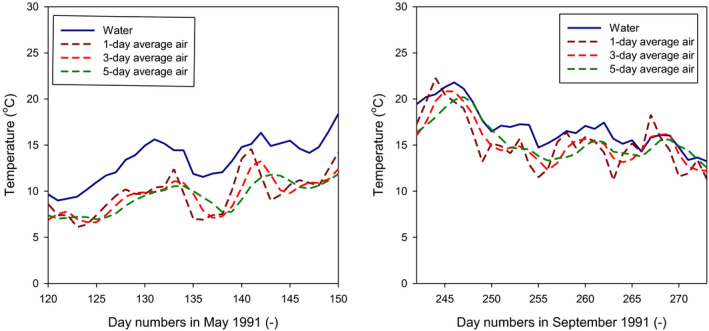
Measured average daily water temperatures and 1‐day, 3‐day and 5‐day averaged air temperatures as a function of time for the experimental ditch in May 1991 (left) and September 1991 (right)
Figure P.3.
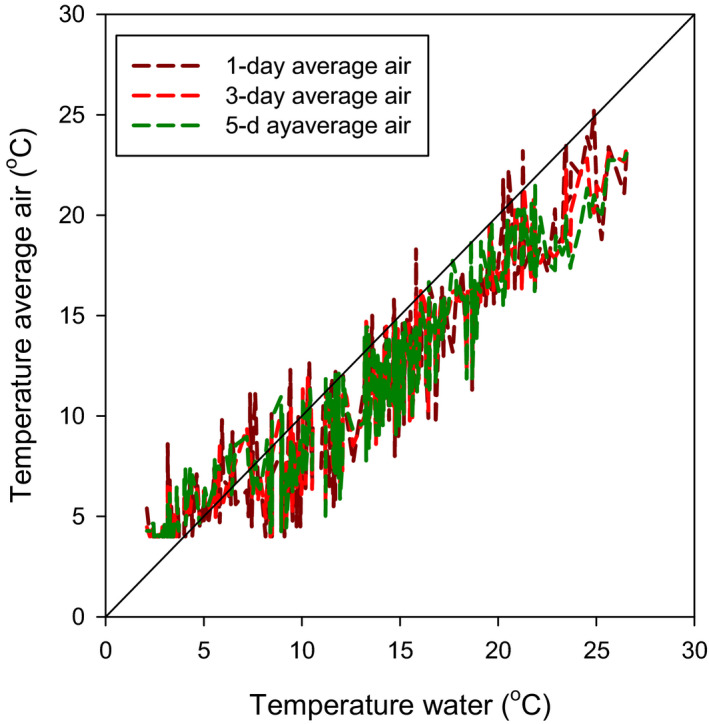
Relation between measured daily water temperature and 1‐day, 3‐day and 5‐day averaged air temperatures for the experimental ditch for 1991
- The 1:1 line indicates where the water temperature equals the averaged air temperatures.
Figure P.4.
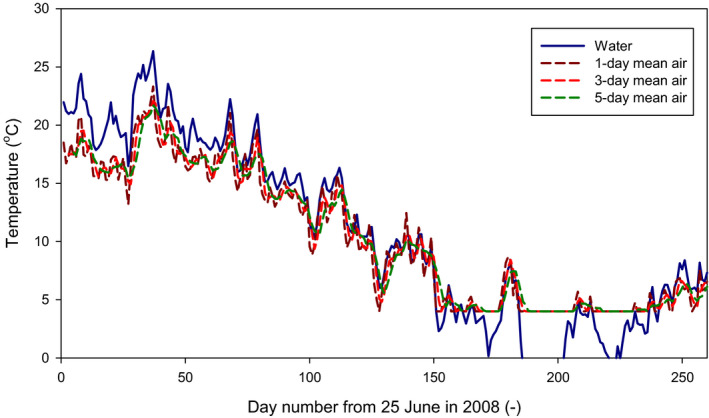
Measured average daily water temperatures and 1‐day, 3‐day and 5‐day averaged air temperatures for the Zeeland pond from 25 June 2008 to 11 March 2009
Figure P.5.
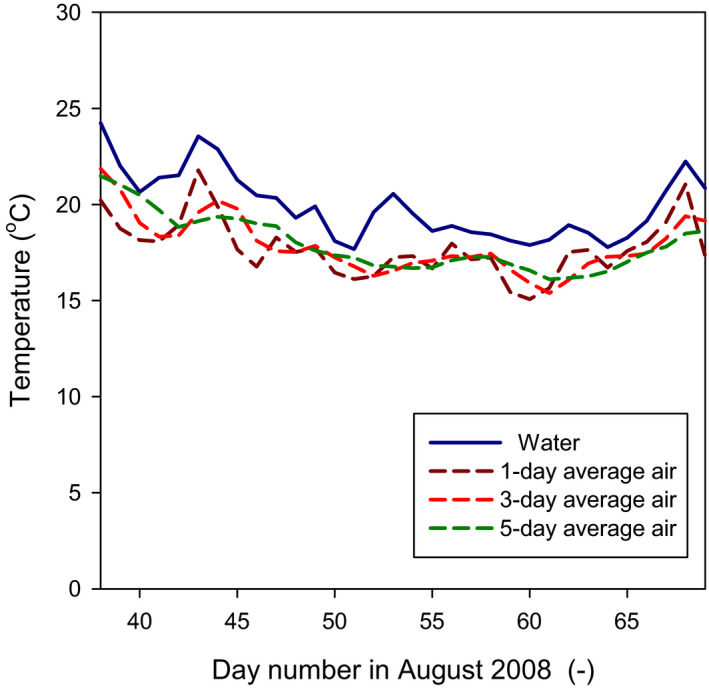
Measured average daily water temperatures and 1‐day, 3‐day and 5‐day averaged air temperatures for the Zeeland pond in August 2008
Figure P.6.
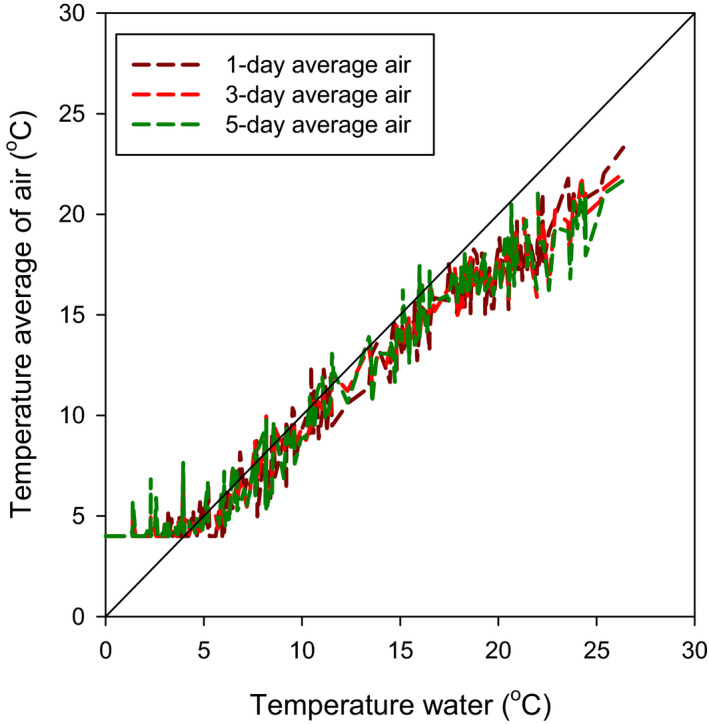
Relation between measured water temperature and 1‐day, 3‐day and 5‐day averaged air temperatures for the Zeeland pond for the period of 24 June 2008 to 11 March 2009
- The 1:1 line indicates where the water temperature equals the averaged air temperatures.
Based on the statistical results and the visual inspections of the graphs, the Working Group selected the 3‐day averaged air temperatures to represent the daily water temperature in the repaired FOCUS scenarios. The daily air temperatures of the meteo input files of MACRO and PRZM are used to calculate the 3‐day averaged air temperatures. The daily average temperatures of the meteo input files of MACRO and PRZM are the arithmetic mean of the measured daily minimum and daily maximum temperature at the scenario locations. The temperature of the sediment is assumed to be equal to the estimated temperature for the water. Note that the temperature will influence not only the transformation rates in water and sediment but also the volatilisation rate and diffusion rate in the sediment (Beltman et al., 2017).
References
Beltman WHJ, Adriaanse PI, Jacobs CMJ and Mulder HM, 2017. Temperature in water and sediment in the pesticide model TOXSWA: implementation report. Wageningen Environmental Research report 2794, Wageningen, the Netherlands.
Caissie D, 2006. The thermal regime of rivers: a review. Freshwater Biology, 51, 1389–1406.
Crisp DT and Howson G, 1982. Effect of air temperature upon mean water temperature in streams in the north Pennines and English Lake District. Freshwater Biology, 12, 359–367.
Deneer JW, Beltman WHJ and Adriaanse PI, 2010. Transformation reactions in TOXSWA. Transformation reactions of plant protection products in surface water. Alterra report 2074, Wageningen, the Netherlands.
Hadzima‐Nyarko M, Rabi A and Šperac M, 2014. Implementation of artificial neural networks in modeling the water‐air temperature relationship of the River Drava. Water Resources Management, 28, 1379–1394.
Jacobs CMJ, ter Maat HW, Elbers JA and Stuyt LCPM, 2009. Conditionering van de watertemperatuur in buitenvijvers voor de aquacultuur. Vertrouwelijk. Alterra, Wageningen, 2009. Available online: http://edepot.wur.nl/176548
Appendix Q – Curve number parameterisation of tall permanent crops (vines, pome/stone fruit, olives, citrus, hops) in FOCUS sw – analysis and recommendations
Q.1. Rationale
The parameterisation of the run‐off curve numbers for tall permanent crops (vines, pome/stone fruit, citrus, olives and hops) in the FOCUS R scenarios assumes a fairly good vegetation cover.
The task was to check the realism of these assumptions (and consequently, the corresponding curve numbers) against the survey results collected by Beulke et al. (2015) in the context of soil exposure scenarios for permanent crops. If the current curve number parameterisation of tall permanent crops was found to be unrealistic, an adapted CN parameterisation was to be proposed.
Q.2. Current parameterisation in FOCUS sw
The current curve number parameterisation of permanent crops in FOCUS sw is given in Table Q.1. Note that in PRZM there is a difference between the curve numbers for antecedent moisture condition II (which are input parameters) and the current curve number, which is a state variable and updated daily based on antecedent soil moisture.
The difference between R2 and the other R scenarios is due to the fact that R1, R3 and R4 belong to soil hydrologic group C, while Porto belongs to soil hydrologic group B–C.
Table Q.1.
Curve number parameterisation of permanent crops in FOCUS (2001)
| Curve number for antecedent moisture condition IIa | ||||
|---|---|---|---|---|
| R1 | R2 | R3 | R4 | |
| Grass/alfalfa | − | 63 | 70 | − |
| Citrus | − | − | − | 70 |
| Hops | 70 | − | − | − |
| Olives | − | − | − | 70 |
| Pome/stone fruit | 70 | 63 | 70 | 70 |
| Vines | 70 | 63 | 70 | 70 |
Curve numbers for permanent crops are set constant over the year.
The selected curve number values are based on tables 5–10 in the PRZM manual (Carsel et al., 2003) where curve numbers are listed for so‐called hydrologic soil‐cover complexes (Figure Q.1). Apparently the selected curve numbers 70 and 63 for all permanent crops (including grass/alfalfa) come from the curve number set for ‘woods, good condition’ in tables 5–10, with values for Porto having been linearly interpolated between soil hydrologic groups B (CN = 55) and C (CN = 70). These values are even slightly better than for ‘meadow, good condition’. Hence, it is likely that in FOCUS (2001) a fairly complete ground cover (within and between rows) is assumed for all tall permanent crops.
Figure I.10.
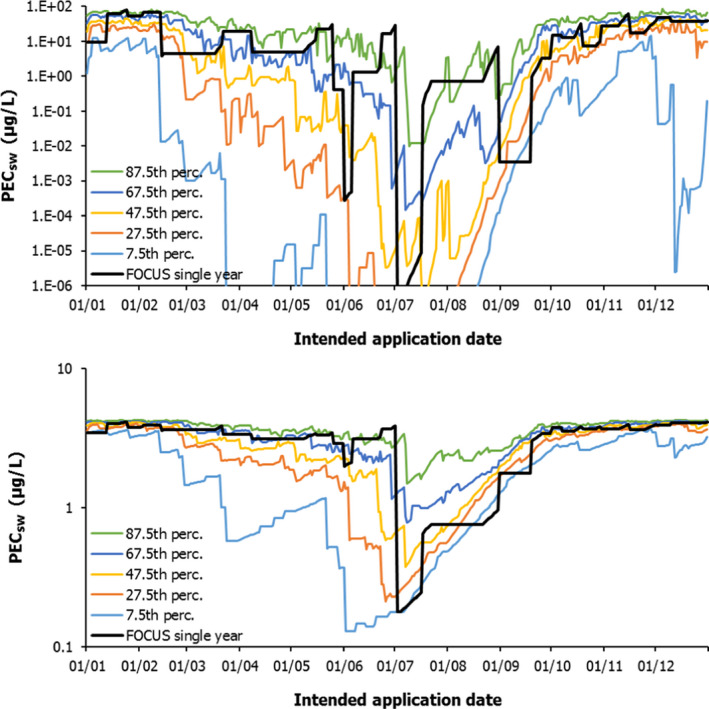
PEC sw (μg/L) for dummy substance A (top) and dummy substance F (bottom) in the run‐off scenario R2 based on the new 20‐year assessment approach (7.5th to the 87.5th percentile, 7‐day application window) and the current FOCUS single‐year assessment approach, in relation to the intended application date (potatoes, 1 × 1 kg/ha to the soil surface, no drift). Data are based on a TOXSWA stream meta model
Figure Q.1.
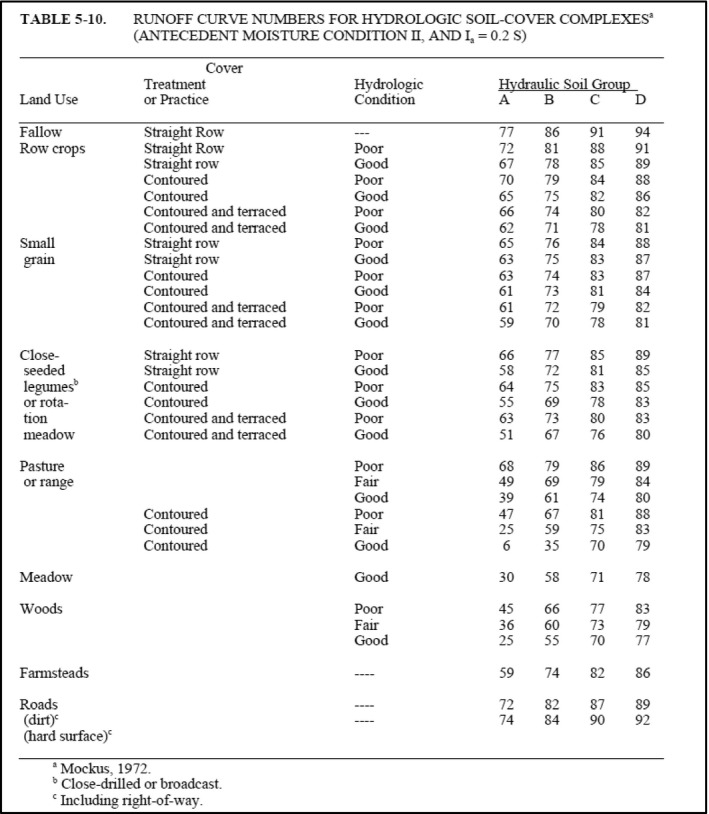
Tables 5–10 in the PRZM manual (Carsel et al., 2003)
Q.3. Analysis of FERA report (Beulke et al., 2015)
In the context of EFSA PECsoil, Beulke et al. (2015) performed a literature search and a survey on cultivation practices in permanent crops. They described their results in detail in their Appendix H and summarise them in table 26 of their report (Figure Q.2).
Figure J.1.
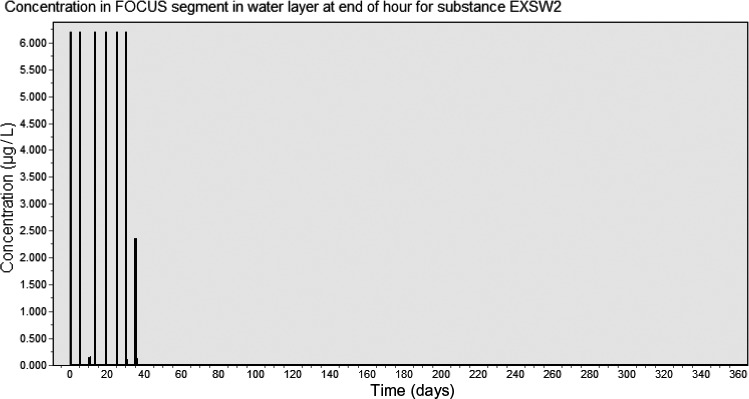
Time‐dependent concentration in surface water (R2 stream) with current multiple application scheme
Figure Q.2.
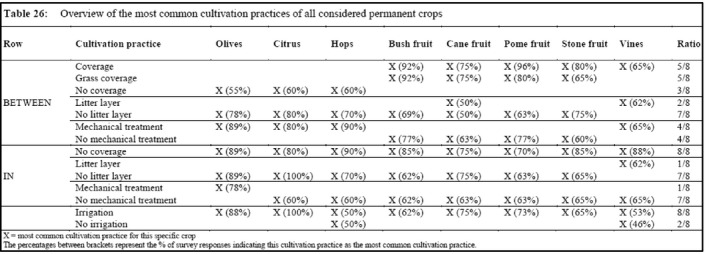
Table 26 from Beulke et al. (2015)
Table Q.2 gives a summary of the survey results in Appendix H of Beulke et al. (2015) with regard to ground cover. The information given in the tables in Appendix H is sometimes conflicting, presumably due to inconsistent filling of questionnaires.
Table Q.2.
Summary of results of Beulke et al. (2015) with respect to ground cover
| Between rows | In rows | |||||
|---|---|---|---|---|---|---|
| Crop | Any cover | Live vegetation | Litter layer | Any cover | Live vegetation | Litter layer |
| Citrus | 2/5 | 2/5 | 1/5 | 1/5 | 1/5 | 0/5 |
| Hops | 4/10 | 4/10 | 3/10 | 1/10 | 0/10 | 1/10a |
| Olives | 4/9 | 4/9 | 2/9 | 1/9 | 1/9 | 1/9 |
| Pome fruit | ? | 29/30 | 11/30 | 13/30 | 9/30 | 13/30 |
| Stone fruit | ? | 16/20 | 5/20 | 7/20 | 3/20 | 7/20 |
| Vines | ? | 17/26 | 12/16b | ? | 3/26 | 15/16b |
Conflicting information in Table H2.4.2.
Litter layer between and in vine rows mostly < 1 cm thick.
It has to be noted that sample sizes were quite small for citrus, hops and olives. Hence, survey results need to be treated with caution for these three crops. However, the survey results allow some general observations.
With regard to the presence of a live vegetation cover (grass, weeds, etc.):
In the majority of cases, pome/stone fruit and vines had a live vegetation cover between rows, while citrus, hops and olives had no live vegetation cover between rows.
For all crops listed in Table Q.2, in the majority of cases there was no live vegetation cover within rows.
With regard to the presence of a litter layer:
For all crops except vines, a litter layer between rows was present in less than 50% of cases.
For all crops except vines, a litter layer within rows was present in less than 50% of cases.
While in vines a litter layer between or within rows was present in most cases, most survey respondents stated that the layer was only 0–1 cm thick.
Provided that the limited sample sizes for citrus, hops and olives can be considered sufficient, the following recommendations for run‐off modelling can be made:
the possible presence of litter layers can be disregarded;
for citrus, olives and hops: no cover between or within rows;
for pome/stone fruit: live vegetation cover (e.g. grass) between rows, no cover within rows.
Q.4. GERDA
The issue of ground cover in tall permanent crops was also discussed in the GERDA report (Bach et al., 2016, 2017, p. 98) in the context of pesticide interception (Figure Q.3).
Figure Q.3.
In the GERDA database, two additional crops were defined to account for partial or missing vegetation cover in vineyards. These crops have lower values of ground cover (PRZM parameter COVMAX) and higher curve numbers than the standard FOCUS sw crops assuming full vegetation cover.
However, these crops are not accessible via the GERDA interface, which lists only FOCUS sw crops. The curve numbers of the new crops were defined as follows (cf Figure Q.1):
‘vineyards and orchards without grass cover’: CN for ‘fallow’;
‘vineyards with partial grass cover’: CN for ‘woods, fair condition’.
Q.5. Conclusions and recommendations
Based on the survey by Beulke et al. (2015), it does not seem justified to simulate surface run‐off for tall permanent crops assuming a complete ground cover, as has been performed until now in FOCUS sw.
The FOCUS Surface Water Repair WG, therefore, recommends to change the CN parameterisation of the five tall permanent crops in FOCUS sw as below in Table Q.3, in analogy to the parameterisation of the two additional crops in GERDA.
Table Q.3.
Recommended new curve number parameterisation of tall permanent crops for FOCUS sw
| Crop | Corresponding set of CN in PRZM manual | Curve number for antecedent moisture condition IIa | |
|---|---|---|---|
| Hydrologic soil group B–C (R2) | Hydrologic soil group C (R1/R3/R4) | ||
| Citrus | Fallow | 89 | 91 |
| Hops | |||
| Olives | |||
| Pome/stone fruit | Woods, fair condition | 67 | 73 |
| Vines | |||
Curve numbers for permanent crops are set constant over the year.
It has to be noted that this change will substantially increase the frequency and magnitude of surface run‐off events in citrus, hops and olives. However, this will be partly compensated by the fact that due to the change in the irrigation modelling approach, irrigation will not cause surface run‐off any more.
In summary, both changes will lead to a more realistic representation of surface run‐off in tall permanent crops.
References
Bach M, Guerniche D, Thomas K, Trapp M, Kubiak R, Hommen U, Klein M, Reichenberger S, Pires J and Preuß T, 2017. Bewertung des Eintrags von Pflanzenschutzmitteln in Oberflächengewässer – Run‐off, Erosion und Drainage GERDA – GEobased Run‐off, erosion and Drainage risk Assessment for Germany. Final Report. Umweltbundesamt, Dessau‐Roßlau, Germany. Forschungskennzahl 3711 63 427. ISSN 1862‐4359; 553 pp.
Beulke S, de Wilde T, Balderacchi M, Garreyn F, van Beinum W and Trevisan M, 2015. Scenario selection and scenario parameterisation for permanent crops and row crops on ridges in support of predicting environmental concentrations of plant protection products and their transformation products in soil. EFSA supporting publication 2015:EN‐813, 170 pp.
Carsel RF, Imhoff JC, Hummel PR, Cheplick JM and Donigian Jr AS, 2003. PRZM‐3, A model for predicting pesticide and nitrogen fate in the crop root and unsaturated soil zones: Users Manual for Release 3.12. Center for Exposure Assessment Modeling (CEAM), US Environmental Protection Agency (US EPA), Athens, GA, USA.
FOCUS, 2001. FOCUS surface water scenarios in the EU evaluation process under 91/414/EEC. Report of the FOCUS Working Group on Surface Water Scenarios, EC Document Reference SANCO/4802/2001 rev. 2, 245 pp.
Appendix R – Proposal for introduction of an ‘end of irrigation period’ parameter in MACRO and PRZM
1.
In the current FOCUS sw scenarios (FOCUS, 2001), irrigation was simply added to the weather files of PRZM and MACRO as rainfall. Irrigation schedules were calculated externally with the water balance model ISAREG (Teixeira and Pereira, 1992). The FOCUS Surface Water Repair WG concluded that to avoid inconsistencies with the water balances, irrigation events should not be scheduled with an external model such as ISAREG, but should be calculated internally in PRZM and MACRO based on the specific water balances simulated by the models. Consequently, the irrigation approach has been changed in this repair action from external (in the rainfall file) to internal (irrigation is calculated directly in MACRO and PRZM as a function of soil moisture deficit).
With respect to irrigation, the FOCUS Surface Water Repair WG also noted that irrigation should not take place after the start of senescence. Hence, this date must be included as a parameter in MACRO and PRZM to mark the end of the irrigation period. At the moment, irrigation is performed in both models from emergence until harvest.
Unlike in FOCUS sw (FOCUS, 2001), in FOCUS gw (European Commission, 2014), there are four different crop coefficients defined (in PEARL, PRZM and PELMO), for four different cropping stages:
Harvest to emergence (no crop);
emergence to maximum LAI;
maximum LAI to senescence;
senescence to harvest.
However, the FOCUS gw settings of PRZM are technically not compatible with the FOCUS sw settings, because they require time‐variable crop coefficients (Kc) for evapotranspiration, which are not defined in FOCUS sw.
The following simple technical solution is therefore proposed for a future update: An additional parameter is added to MACRO and PRZM which denotes the end of the irrigation period. The parameter will not affect the crop development curve, it is suggested to set the end of the irrigation period equal to the start of senescence, when the water demand of the crop starts to decline.
The following rules are proposed to determine the ‘end of irrigation period’ date:
-
‘Normal’ arable crops such as maize:
-
–
BBCH 81 (maturation) as given by AppDate;
-
–
if BBCH 81 is not available in AppDate, the next higher available BBCH stage is used.
-
–
Sugar beets, root, leafy and bulb vegetables grow until harvest: no stop of irrigation.
Grass/alfalfa and citrus are evergreen permanent: no stop of irrigation.
Pome/stone fruits: BBCH 81 (fruit maturation) cannot really be related to PRZM or MACRO, since these models do not simulate fruits and the crop dates in MACRO and PRZM refer to the foliage of the tree. However, the date estimated by AppDate for BBCH 81 (probably relating to apples) may be a good first guess for start of leaf senescence. It is therefore suggested to use BBCH 81 also for pome/stone fruit until more reliable data become available.
Table R.1 summarises the proposed ‘end of irrigation period’ dates for the irrigated crop/scenario combinations.
The FOCUS Surface Water Repair WG recommends implementing this ‘end of irrigation period’ parameter in MACRO and PRZM in a future update of the models.
Table R.1.
Proposed dates for the parameter ‘end of irrigation period’ in MACRO and PRZM
| Crop | Scenario | |||||
|---|---|---|---|---|---|---|
| D3 | D4 | D6 | R1 | R3 | R4 | |
| Winter cereals | 10 August 2001 | 0 | 0 | 0 | 0 | |
| Spring cereals | 2 August 2001 | 0 | ||||
| Winter oilseed rape | 0 | 0 | 0 | 0 | ||
| Spring oilseed rape | 0 | 0 | ||||
| Sugar beet | X | X | X | X | ||
| Potatoes | 29 August 2001 | 13 September 2001 |
1st: 1 July 2001 2nd: 8 November 2001 |
17 August 2001 | 4 August 2001 | |
| Field beans | 24 August 2001 |
1st: 2 June 2001 2nd: 14 September 2001 |
0 | 2 June 2001 | 2 June 2001 | |
| Root vegetables | X | X | X | X | X | |
| Leafy vegetables | X | X | X | X | X | X |
| Bulb vegetables | X | X | X | X | X | X |
| Legumes | 24 July 2001 | 26 July 2001 | 14 June 2001 | 27 July 2001 | 14 June 2001 | 14 June 2001 |
| Fruiting vegetables | 19 July 2001 | 8 August 2001 | 5 July 2001 | |||
| Maize | 10 September 2001 | 25 August 2001 | 14 September 2001 | 15 September 2001 | 13 August 2001 | |
| Vines | 0 | 0 | 0 | 0 | ||
| Pome/stone fruit | 06 September 2001 | 0 | 0 | 0 | 14 August 2001 | |
| Grass/alfalfa | X | 0 | 0 | |||
| Sunflower | 14 August 2001 | 25 August 2001 | 2 August 2001 | |||
| Hops | 0 | |||||
| Soybeans | 15 September 2001 | 1 September 2001 | ||||
| Citrus | X | X | ||||
| Olive | 0 | 0 | ||||
| Tobacco | 12 September 2001 | |||||
| Cotton | 17 August 2001 | |||||
Blank cell: crop does not occur in scenario.
0: crop not irrigated in scenario.
X: ‘Start of senescence’ date not applicable (irrigation period continues until harvest).
Date: Value obtained from AppDate (v. 3.0.7, 31 October 2019) as BBCH 81 (if BBCH 81 does not occur, the next higher available BBCH stage is used, e.g. 83); 01 is a generic year which is not a leap year.
Suggested citation: EFSA (European Food Safety Authority) , Adriaanse P, Boivin A, Klein M, Jarvis N, Stemmer M, Fait G and Egsmose M, 2020. Scientific report of EFSA on the ‘repair action’ of the FOCUS surface water scenarios. EFSA Journal 2020;18(6):6119, 301 pp. 10.2903/j.efsa.2020.6119
Requestor: European Commission (DG SANTE)
Question number: EFSA‐Q‐2017–00070
Acknowledgements: EFSA wishes to thank the following hearing experts for the support provided to this scientific output: Fredrik Stenemo, Stefan Reichenberger and Gerald Reinken.
Approved: 21 April 2020
This publication is linked to the following EFSA Supporting Publications article: http://onlinelibrary.wiley.com/doi/10.2903/sp.efsa.2020.EN-1850/full
Notes
Directorate General for Health and Foods Safety – European Commission.
FOrum for Co‐ordination of pesticide fate models and their USe.
Surface WAter Scenarios Help.
TOXic substances in Surface WAters.
A physically based one‐dimensional numerical model of water flow and reactive solute transport in field soils.
Pesticide Root Zone Model.
European Commission, 2009. Regulation (EC) No 1107/2009 of the European Parliament and of the Council of 21 October 2009 concerning the placing of plant protection products on the market and repealing Council Directives 79/117/EEC and 91/414/EEC. OJ L 309/1, 24 November 2009, pp. 1–50.
Council Directive 91/414/EEC concerning the placing of plant protection products on the market. OJ L 309/1, 24 November 2009, pp. 1–50.
European Commission, 2009. Regulation (EC) No 1107/2009 of the European Parliament and of the Council of 21 October 2009 concerning the placing of plant protection products on the market and repealing Council Directives 79/117/EEC and 91/414/EEC. OJ L 309/1, 24.11.2009, pp. 1–50.
Regulation (EU) No 546/2009 of the European Parliament and of the Council as regards uniform principles for evaluation and authorisation of plant protection products.
Spray drift deposition can only be modified in so‐called non‐FOCUS Step 3 projects that can be obtained by copying a FOCUS project in the TOXSWA shell.
In this context, the calculation of a certain percentile for an empirical distribution (in this case 20 PECs values) is based on the Hazen plotting position with pi = (i – 0.5)/n, where pi = probability of non‐exceedance (percentile), i = ith value in the ordered sample (1st to the 20th year) and n = total sample number (20 years). So, the lowest PEC value out of 20 PEC values represents the 2.5th percentile (i.e. (1 – 0.5)/20 = 0.025), whereas the highest PEC value represents the 97.5th percentile (i.e. (20 – 0.5)/20 = 0.975). Note that there are many different formulae for pi suggested in literature. The Hazen plotting position represents the midpoint of the step in the cumulative relative frequency.
The exact equations implemented in the p2t maker are: (i) GW_storage(n = 0) = 0, (ii) GW_discharge(n) = KGw × GW_storage(n‐1) and (iii) GW_storage(n) = GW_storage(n – 1) + daily downward PRZM water flux at 1 m(n) – discharge(n), with n being the day number; all storage, discharge and daily water fluxes in mm and KGW as explained in the text above.
Version 5.5.3 was used as the option was needed on relaxing the positivity conditions to run TOXSWA. This was needed for all R3‐Bologna and R4‐Roujan runs, where the positivity conditions were relaxed with respect to the terms of the tridiagonal matrix used in the numerical solution of the mass balance equation for the water layer, while maintaining positivity for the concentrations.
For the exact requirements, see EU Regulation 283/2013, Section 7.2.2.3.
References
- Adriaanse PI, 1997. Exposure assessment of pesticides in field ditches: the TOXSWA model. Pesticide Science, 49, 210–212. [Google Scholar]
- Adriaanse PI, Boesten JJTI, ter Horst MMS and van Leerdam RC, 2007. Run‐off events in the FOCUS Surface Water Run‐off Scenarios for maize. Alterra‐rapport (unpubl.)Alterra, Wageningen, the Netherlands. 9 pp. [Google Scholar]
- Adriaanse PI, Boesten JJTI and Crum SJH, 2013. Estimating degradation rates in outdoor stagnant water based on inverse modelling with TOXSWA: a case study with prosulfocarb. Pest Management Science, 69, 755–767. [DOI] [PubMed] [Google Scholar]
- Adriaanse PI, Beltman WHJ and Van den Berg F, 2014. Metabolite formation in water and in sediment in the TOXSWA model. Theory and procedure for the upstream catchment of FOCUS streams. Alterra Report 2587. Wageningen, the Netherlands. 49 pp. [Google Scholar]
- Adriaanse PI, Van Leerdam RC and Boesten JJTI, 2017. The effect of the run‐off size on the pesticide concentration in run‐off water and in FOCUS streams simulated by PRZM and TOXSWA. Science of the Total Environment, 584–585, 268–281. [DOI] [PubMed] [Google Scholar]
- Bach M, Diesner M, Grossmann D, Guerniche D, Hommen U, Klein M, Kubiak R, Mueller A, Priegnitz J, Reichenberger S, Thomas K and Trapp M, 2016. Pesticide exposure assessment for surface waters in the EU. Part 1: Some comments on the current procedure. Pest Management Science, 72, 1279–1284. [DOI] [PubMed] [Google Scholar]
- Bach M, Diesner M, Grossmann D, Guerniche D, Hommen U, Klein M, Kubiak R, Mueller A, Preuss TG, Priegnitz J, Reichenberger S, Thomas K and Trapp M, 2017a. Pesticide exposure assessment for surface waters in the EU. Part 2: determination of statistically based run‐off and drainage scenarios for Germany. Pest Management Science, 73, 852–861. [DOI] [PMC free article] [PubMed] [Google Scholar]
- Bach M, Guerniche D, Thomas K, Trapp M, Kubiak R, Hommen U, Klein M, Reichenberger S, Pires J and Preuß T, 2017b. Bewertung des Eintrags von Pflanzenschutzmitteln in Oberflächengewässer – Run‐off, Erosion und Drainage GERDA – GEobased run‐off, erosion and drainage risk assessment for Germany. Final Report. Umweltbundesamt, Dessau‐Roßlau, Germany. Forschungskennzahl 3711 63 427. ISSN 1862‐4359; 553 pp.
- BBCH , 2001. Growth stages of mono‐ and dicotyledonous plants, 2nd Edition BBCH‐Monograph, Biologische Bundesanstalt für Land und Forstwirtschaft, Braunschweig. [Google Scholar]
- Beltman WHJ, Adriaanse PI, Jacobs CMJ and Mulder HM, 2017. Temperature in water and sediment in the pesticide model TOXSWA. Implementation report. Report 2794. Wageningen Environmental Research (WENR), Wageningen University and Research (WUR), Wageningen, the Netherlands, 67 pp. [Google Scholar]
- Beltman WHJ, ter Horst MMS, Adriaanse PI and de Jong A, 2018. Manual of FOCUS_TOXSWA v5.5.3 and for expert use of TOXSWA kernel v3.3. User's Guide version 5. WOt technical report 126. Wageningen University and Research, the Netherlands, 148 pp. [Google Scholar]
- Beltman WHJ, Adriaanse PI, de Jong A and te Roller JA, in preparation. Manual for FOCUS_TOXSWA v6.6.3 and for expert use of TOXSWA kernel 4.4. User's Guide version 6. Wageningen University and Research, Wageningen, the Netherlands.
- Beulke S, De Wilde T, Balderacchi M, Garreyn F, van Beinum W and Trevisan M, 2015. Scenario selection and scenario parameterisation for permanent crops and row crops on ridges in support of predicting environmental concentrations of plant protection products and their transformation products in soil. EFSA supporting publication 2015;EN‐813, 170 pp. [Google Scholar]
- Boesten JJTI, 2018. Conceptual considerations on exposure assessment goals for aquatic pesticide risks at EU level. Pest Management Science, 74, 264–274. [DOI] [PubMed] [Google Scholar]
- BVL , 2006. Fünfte Bekanntmachung über die Abdriftwerte, die bei der Prüfung und Zulassung von Pflanzenschutzmitteln herangezogen werden. Bundesanzeiger 58 (2006), Nr. 85, 3527, Biologische Bundesamt für Verbraucherschutz und Lebensmittelsicherheit (BVL), Braunschweig, Germany, 27. März 2006.
- Carsel RF, Imhoff JC, Hummel PR, Cheplick JM and Donigian Jr AS , 2003. PRZM‐3, A model for predicting pesticide and nitrogen fate in the crop root and unsaturated soil zones: Users Manual for Release 3.12. Center for Exposure Assessment Modeling (CEAM), US Environmental Protection Agency (USEPA)., Athens, GA, USA. [Google Scholar]
- EC‐JRC (European Commission – Joint Research Centre), 2010. Map of soil pH in Europe. Land Resources Management Unit, Institute for Environment and Sustainability: Available online: https://esdac.jrc.ec.europa.eu/content/soil-ph-europe [Google Scholar]
- EFSA (European Food Safety Authority), 2010. Selection of scenarios for exposure of soil organisms to plant protection products. EFSA Journal 2010;8(6):1642, 82 pp. 10.2903/j.efsa.2010.1642 [DOI] [Google Scholar]
- EFSA (European Food Safety Authority), 2013c. EFSA Guidance Document on the risk assessment of plant protection products on bees (Apis mellifera, Bombus spp. and solitary bees. EFSA Journal 2013;11(7):3295, 268 pp. 10.2903/j.efsa.2013.3295 [DOI] [PMC free article] [PubMed] [Google Scholar]
- EFSA (European Food Safety Authority), 2014. Guidance for evaluating laboratory and field dissipation studies to obtain DegT50 values of plant protection products in soil. EFSA Journal2010;8(12):1936, 67 pp. 10.2903/j.efsa.2010.1936 [DOI] [Google Scholar]
- EFSA (European Food Safety Authority), 2017. Guidance Document for predicting environmental concentrations of active substances of plant protection products and transformation products of these active substances in soil. EFSA Journal 2017;15(10):4982, 115 pp. 10.2903/j.efsa.2017.4982 [DOI] [PMC free article] [PubMed] [Google Scholar]
- EFSA PPR Panel (EFSA Panel on Plant Protection Products and their Residues), 2012. Scientific Opinion on the science behind the guidance for scenario selection and scenario parameterisation for predicting environmental concentrations of plant protection products in soil. EFSA Journal 2012;10(2):2562, 76 pp. 10.2903/j.efsa.2012.2562 [DOI] [Google Scholar]
- EFSA PPR Panel (EFSA Panel on Plant Protection Products and their Residues), 2013a. Scientific Opinion on the report of the FOCUS groundwater working group (FOCUS, 2009): assessment of lower tiers. EFSA Journal 2013;11(2):3114, 29 pp. 10.2903/j.efsa.2013.3114 [DOI] [Google Scholar]
- EFSA PPR Panel (EFSA Panel on Plant Protection Products and their Residues), 2013b. Guidance on tiered risk assessment for plant protection products for aquatic organisms in edge‐of‐field surface waters. EFSA Journal 2013;11(7):3290, 268 pp. 10.2903/j.efsa.2013.3290 [DOI] [Google Scholar]
- EFSA PPR Panel (EFSA Panel on Plant Protection Products and their Residues), 2015. Scientific Opinion on the effect assessment for pesticides on sediment organisms in edge‐of‐field surface water. EFSA Journal 2015;13(7):4176, 145 pp. 10.2903/j.efsa.2015.4176 [DOI] [Google Scholar]
- European Commission , 2014. Assessing potential for movement of active substances and their metabolites to ground water in the EU’ report of the FOCUS Ground Water Work Group, EC Document Reference Sanco/13144/2010 version 3. 613 pp.
- FOCUS , 2001. FOCUS Surface Water Scenarios in the EU Evaluation Process under 91/414/EEC Report of the FOCUS Working Group on Surface Water Scenarios. EC Document Reference, SANCO/4802/2001‐rev.2, 245 pp.
- FOCUS , 2002. ‘Generic guidance for FOCUS groundwater scenarios’ version 1.1 of EC Document. Reference Sanco/321/2000, rev.2, 61 pp.
- Ganzelmeier H, Rautmann D, Spangenberg R, Streloke M, Herrmann M, Wenzelburger H‐J and Walter H‐F, 1995. Untersuchungen zur Abtrift von Pflanzenschutzmitteln. Mitteilungen aus der Biologischen Bundesanstalt für Land‐ und Forstwirtschaft Berlin‐Dahlem, 304.
- Hiederer R, 2012. EFSA Spatial Data Version 1.1. Data Properties and Processing. Joint Research Centre Technical Reports, 64 pp. [Google Scholar]
- Holterman HJ, van De Zande JC, Huijsmans JFM and Wenneker M, 2016. Development of a spray drift model for pesticide applications in fruit orchards. Aspects of Applied Biology, 132, International Advances in Pesticide Application, 1–8. [Google Scholar]
- Klein M, 2006. Estimation of reasonable application dates dependent on BBCH crop development stages for PELMO. Report Umweltbundesamt, FKZ: 360 06 034. Fraunhofer IME, Schmallenberg. [Google Scholar]
- Klein M, 2007. Long‐term surface water simulations with STEPS 1–2–3–4 In: Re AAM, Capri E, Fragoulis G. and Trevisan M. (eds). Environmental Fate and Ecological Effects of Pesticides, Proc. XIII Symp. Pesticide Chemistry Piacenza, Italy, pp. 950–957. [Google Scholar]
- Klein M, 2018. AppDate 3.0. Estimation of consistent application dates dependent on BBCH crop development stages for FOCUS models. Fraunhofer IME, Schmallenberg. [Google Scholar]
- Larsbo M, Roulier S, Stenemo F, Kasteel R and Jarvis NJ, 2005. An improved dual‐permeability model of water flow and solute transport in the vadose zone. Vadose Zone Journal, 4, 398–406. [Google Scholar]
- Olesen MH and Jensen PK, 2013. Collection and evaluation of relevant information on crop interception. Report by the Aarhus University, Denmark, 67 pp. Available online: www.efsa.europa.eu/en/supporting/pub/438e.htm
- Rautmann D, 2000. New basic drift values in the authorisation procedure for plant protection products. Paper for the FOCUS‐Surface Water Group, 2000, 9 pp.
- Rautmann D, Streloke M and Winkler R, 2001. New basic drift values in the authorisation procedure for plant protection products In: Forster R. and Streloke M. (eds). Workshop on Risk Assessment and Risk Mitigation Measures in the Context of the Authorization of Plant Protection Products (WORMM). Mzritt. Biol. Bundesanst. Land‐Forstwirtsch. Berlin‐Dahlem, Heft 381, pp. 133–142. [Google Scholar]
- Reichenberger S, 2015. Analysis of the irrigation methodology used in the FOCUS surface water scenarios and its consequences on predicted surface run‐off. Technical report. Knoell Germany GmbH, 12 pp. (unpublished). [Google Scholar]
- Schwab GO, Frevent RK, Edminster TW and Barnes KK, 1966. Soil and Water Conservation Engineering. J. Wiley and Sons, New York. [Google Scholar]
- Suárez LA, 2005. PRZM‐3, a model for predicting pesticide and nitrogen fate in the crop root and unsaturated soil zones: Users Manual for Release 3.12.2. Center for Exposure Assessment Modeling (CEAM), US Environmental Protection Agency (US EPA). Athens, GA, USA. 413 pp. [Google Scholar]
- Teixeira JL and Pereira LS, 1992. ISAREG, an irrigation scheduling simulation model. ICID Bulletin, 41, 29–48. [Google Scholar]
- Tóth G, Jones A and Montanarella L, 2013. LUCAS Topsoil Survey methodology, data and results. Reference Report by the Joint Research Centre of the European Commission. Report EUR 26102, EN, 141 pp.
- Vossen P and Meyer‐Roux J, 1995. Crop monitoring and yield forecasting activities of the MARS project In: King D, Jones RJA. and Thomasson AJ. (eds). European Land Information Systems for Agro‐environmental Monitoring. EUR 16232 EN. Office for Official Publications of the European Communities, Luxembourg: pp. 11–29. [Google Scholar]
- van de Zande JC, Holterman HJ and Huysmans JFM, 2012. Spray drift for the assessment of exposure of aquatic organisms to plant protection products in the Netherlands. Part 1: Field crops and downward spraying. PRI Report, 419, 83. [Google Scholar]
- van de Zande JC, Holterman HJ, Huysmans JFM and Wenneker M, 2019. Spray drift for the assessment of exposure of aquatic organisms to plant protection products in the Netherlands. Part 2: sideways and upward sprayed fruit and tree crops. WPR Report, 564, 86. [Google Scholar]


