

Abstract
The intermixing of phospholipids from opposing bilayers, or membrane fusion, is a naturally occurring process that can be leveraged to produce hybrid vesicle systems. Optimizing the production of these hybrid vesicles requires accurate, sensitive, and quantitative methods of the lipid mixing that occurs during fusion. A fluorescence-based assay that uses octadecyl-rhodamine B chloride to measure lipid mixing, or R18 assay, was developed by Hoekstra to investigate viral entry almost four decades ago. However, the R18 assay has so far only been used to measure heterotypic fusion events. Consequently, the fusion efficiencies that are calculated from the R18 assay underestimate the total number of fusion events and the true efficiency of vesicle fusions. In this article, we outline the experimental format and data analysis that is necessary to perform the R18 fusion assay and to accurately and reliably measure the true total fusion efficiency of outer membrane vesicles isolated from the Nissle 1917 strain of E. coli.
Keywords: Fusion efficiency, Lipid mixing, Membrane fusion, Octadecyl-rhodamine B chloride assay, Outer membrane vesicles
1. Introduction
Membrane fusion, or the mixing of phospholipids from opposing bilayers, is an important process used by cells to either interact with their surroundings through exocytosis or internally transport biomolecules between organelles [1]. It is also a crucial step in the pathogenesis of enveloped viruses [2]. As such, to elucidate its mechanism and the role played by various environmental factors, ample efforts have been spent developing techniques that allow accurate, sensitive, and kinetic monitoring of lipid mixing - techniques known as lipid-mixing assays. Three of these lipid mixing assays are commonly used: the octadecyl-rhodamine B chloride (or R18) assay [3], the pyrene excimer assay [4], and the Forster resonance energy transfer (FRET) assay [5]. Of these three, the R18 and FRET assays remain the methods of choice for membrane fusion studies while their alternative, the pyrene excimer assay which reduces fluorescence due to lipid transfer only [6], has found a niche in biomolecule signaling [7].
In a lipid mixing assay, two sets of membranes are mixed – one membrane that is fluorescently-labelled and one membrane that is not fluorescently-labelled - under controlled experimental conditions. The fluorescent probes that are used are either self-quenching (R18) or are a pair of fluorescent acceptor and donor probes that undergo a process known as FRET whereby the acceptor probe quenches the fluorescence of the donor probe when they are in close proximity (< 10 nm) [8]. The fluorescence of self-quenching probes like R18 is greatly reduced when single molecules are close enough to interact [9]. Labelled membranes contain a high surface density of these probes, which allows quenching to occur.
Regardless of the probes or dyes used, lipid mixing or fusion between labelled and unlabeled membranes causes dilution of the probes, reducing their surface density. This reduction in surface density increases the distance between self-quenching probes or FRET pairs, which leads to an increase in fluorescence signal, a process termed “dequenching”. Kinetic experiments monitor de-quenching with time. Additionally, to compare the fusogenic effect of various experimental conditions, a quantity known as the fusion efficiency is calculated from the raw fluorescence data by relative proportionality to the fluorescence signal when all probes are diluted (infinite dilution) by membrane disruption through the addition of a detergent. The detergent of choice is usually Triton X-100. Both the R18 lipid mixing assay and the FRET assay are based on these principles and have allowed many insights into the roles played by various proteins involved in viral entry (e.g.: influenza HA domain) [10] and the transport of neurotransmitters (e.g.: SNAREs) [11].
However, lipid mixing assays are not without their shortcomings. First, comparison between different experimental conditions is rather difficult since the assays are not standardized. For example, different detergents are used to achieve infinite dilution. Second, the fusion efficiency extracted from lipid mixing assays glaringly omits the homotypic fusion events between unlabeled or labelled membranes (i.e., unlabeled/unlabeled membrane fusion and labeled/labeled membrane fusion). This omission is acceptable when these assays are used to monitor fusion between heterotypic membranes (e.g.: viral vs eukaryotic membranes); however, the omission is problematic in view of the rising interest in using membrane fusion to create hybrid drug delivery vesicles which may originate from the same membrane [12]. Consequently, optimization of membrane fusion requires standardization of the lipid mixing assay to allow appropriate comparisons between fusogenic studies. Additionally, a derivation of the mathematics that are necessary to calculate a fusion efficiency that also incorporates homotypic fusion events is needed.
In this article, we use the octadecyl-rhodamine B chloride (R18) assay and the fusion of outer membrane vesicles (OMVs) isolated from E. coli Nissle 1917 to report a standardized experimental format for OMV fusion and derive for the first time the mathematics that are needed to accurately calculate fusion efficiency. We chose to focus on the R18 assay since, unlike the FRET assay, it can be used to monitor the fusion of naturally occurring membranes such as those found in cells, organelles, viruses, OMVs, and exosomes. FRET pairs need to be incorporated during the formation of the membranes they label. Hence, they are often limited to synthetic membranes such as liposomal membranes. Nonetheless, a discussion on the standardization of the FRET assay was done by Pincet et al. and can be found here [13].
2. Preparation and characterization of outer membrane vesicles (OMVs)
Outer membrane vesicles or OMVs are spherical bilayers, 30–300 nm in size, which naturally bud from the outer membrane of bacteria [14]. They can also be engineered to display a variety of antigenic molecules on their surface, making them potent vaccine adjuvants, vaccine delivery platforms or vaccines themselves [15,16]. In our previous work we describe how to engineer OMVs to surface-display a range of antigens through the genetic engineering of E. coli [17-20]
In brief, for this work, recombinant outer membrane vesicles (OMVs) were engineered from the E. coli Nissle 1917 ΔnlpI (EcN 1917) transformed with a pBAD plasmid containing transmembrane protein cytolysin A (ClyA) followed by a green fluorescent protein (GFP). Deletion of the nlpI gene causes this strain to hypervesiculate while conjugation to ClyA allows GFP to be presented on its outer membrane and thus incorporated into OMVs during vesiculation. Furthermore, GFP, whose stability is linked to its fluorescence, was expressed as a test protein in place of potential proteins of interest that may later be presented on the OMV surface. These OMVs are isolated as described below.
2.1. Materials and equipment
Commonly found equipment in a molecular biology laboratory such as those needed for routine bacterial transformation and culture are omitted from the methodology herein. However, isolation of OMVs requires access to an ultracentrifuge. In these preparations we used the Beckman Coulter Optima LE-80K with a swinging bucket rotor (SW28.1) and Beckman Coulter ultra-clear centrifuge tubes. Additionally, we used a Malvern Zetasizer Nano ZS series with Thermo Fisher Scientific DTS1070 folded capillary cells to determine the size, polydispersity and zeta potential of isolated OMVs. Lastly, to obtain the particle count needed to determine appropriate ratios for the downstream R18 assay analysis we used a Malvern NanoSight NS300.
2.2. Procedure for the isolation of OMVs
E. coli Nissle 1917 bacteria cells were transformed with the pBAD plasmid expressing ClyA-GFP, inoculated in 50 mL Difco Miller’s LB broth with appropriate antibiotics (chloramphenicol and kanamycin) then grown overnight in a standard shaker at room temperature. The OD600 of the overnight culture was measured and 4 sub-cultures (60 mL each) were started, each with an initial OD600 = 0.08. When these cultures reached mid-log phase growth (OD600 ~ 0.4–0.6), ClyA-GFP production was induced by the addition of L-arabinose to a final concentration of 0.2%. Post-induction or 18 h later, the cultures were combined and centrifuged at a speed of 5000 rcf for 10 min at 4 °C to separate bacteria cells and the OMVs that are suspended in the supernatant. The supernatant was passed through a sterile 0.2 μm filter to further eliminate remaining bacterial cells. The filtrate was then ultracentrifuged at a speed of 26,000 rpm for 3 h and at 4 °C. The supernatant was then decanted and the remaining OMV pellet was suspended in sterile 10 mM Tris-HCl buffer pH = 8.0. This OMV suspension was aliquoted into separate vials and stored at − 20 °C until use. The choice of a buffer with low ionic strength and slight basicity increases the stability of the OMVs and prevents their spontaneous aggregation.
2.3. Procedure for the characterization of OMVs
To ascertain of the colloidal stability of isolated OMVs, it is imperative to determine their hydrodynamic size, zeta potential, and polydispersity index (PDI). These measurements are obtained through dynamic light scattering (DLS) measurements using a Malvern Zetasizer Nano ZS. For the size measurements, suspensions of OMVs in 10 mM Tris-HCl buffer pH = 8.0 are slowly dispensed into a folded capillary cell using a 1 mL syringe, making sure there are no bubbles in the cell, and that the electrodes are fully immersed.
It is imperative to not only conduct both experimental and technical triplicates for accurate size determination of the OMVs, but to also pay attention to the instrument warnings as well as the count rate during each run. Doing so allows determination of whether the particle concentration is either too high or too low for appropriate measurements, or if sample impurities are present. If the particle concentration is too low (low count rate), OMVs samples can be concentrated via centrifugation, and if the concentration is too high (high count rate) the samples are diluted using the appropriate buffer. Impurities and/or aggregates in the sample show up as irregular spikes in the count rate. If impurities or aggregates are observed, the sample is syringe-filtered (0.2 μm) and the sample cell thoroughly cleaned before conducting another measurement. The software for this instrument also gives quality control feedback, which allows the user to identify potential measurement anomalies and determine an appropriate course of action.
Furthermore, for membrane fusion experiments and their quantitative analysis, it is critical to obtain an accurate measure of particle concentration for each OMVs sample. Typically, OMV concentrations are reported as total protein content, like that obtained with a BCA assay. While total protein content may be preferred in vaccine studies, for the analysis of vesicle fusion presented in this paper, total protein content is irrelevant. Particle concentration can be obtained through nanoparticle tracking analysis (NTA) using a Malvern NS300 NanoSight. To measure the particle concentration, at least 1 mL of each OMVs sample is flowed through the liquid cell while taking care to avoid bubbles. The NTA software allows magnified images and videos to be taken of OMVs under Brownian motion. Appropriate focus and resolution should be chosen for each sample such that non-particle artifacts are excluded from both size determination and particle count. In our hands with OMVs preparations produced as described above, the OMV samples are generally diluted 1:100 to accurately obtain the sample particle count.
3. The R18 lipid mixing assay: experimental design
The premise of the R18 assay is that the fluorescence of the system increases due to dilution of the self-quenching dye octadecyl-rhodamine B chloride (R18) upon fusion between R18-labelled and unlabeled membranes. The extent to which fusion or lipid mixing occurs between these two sets of membranes is determined by relative comparison to the fluorescence signal at infinite dilution (see Eq. (1)).
| (1) |
Therefore, to standardize this assay for the purpose of comparing experimental fusogenic conditions, both the labeling method and method to achieve infinite dilution must be defined. The amount of dye used, the temperature at which the OMVs are labelled as well as the amount and type of detergent used to achieve infinite dilution are all factors that may affect the experimental output.
3.1. Materials and equipment
Octadecyl-rhodamine B chloride (R18) is purchased from Thermo Fisher Scientific and dissolved in ethanol to a final concentration of 2 mg/mL (O246). Triton X-100 is purchased from Sigma Aldrich (X100). Hydrochloric acid is purchased from Fischer Scientific (7647-01-0). Outer membrane vesicles (OMVs) presenting GFP on their surface are isolated as described in the previous section. Illustra MicroSpin g-50 columns are purchased from GE Healthcare Life Sciences (27533001). A sonicator (VWR, B2500A-DTH, 210 W Power rating) and a fluorometer (Photon Technology International, Inc.) are equipped with a thermal control bath and a quartz cuvette.
3.2. Labelling OMVs with R18
In principle, appropriate labelling of the OMV membrane should result in maximum quenching of the R18 fluorescent signal. Full R18 quenching is achieved when its surface density is at saturation. Therefore, the amount of R18 that is needed in any given system to reach maximum quenching of the fluorescence signal must be experimentally determined.
Methodologically, varying amounts of R18 from a 2 mg/mL stock solution are added to Eppendorf tubes containing the OMVs samples (300 μL at 108 vesicles/mL). The samples are subsequently vortexed, sonicated for 30 min at low power (70% of the maximum rating), and dispensed into Illustra MicroSpin g-50 columns. Next, the samples are centrifuged for 4 min at 3000 rpm to remove unincorporated R18 molecules. Following centrifugation, the fluorescence signal for each sample is measured (λex 560 nm, λem 586 nm). The amount of R18 added was divided by the total surface area of OMVs (which is calculated from the average size and particle count) for each sample to obtain the maximum surface density of R18. These experiments are conducted in triplicate to ensure accuracy. From Fig. 1, the amount of R18 needed to label a 300 μL sample of OMVs (108 vesicles/mL) is a minimum of 2.12 × 10⁻¹⁸ mol of R18/nm2 of membrane area or, in this case, 1.2 μL of the 2.0 mg/mL of R18 stock solution.
Fig. 1.

R18 Labeling of OMVs. Varying amounts of R18 were added to a 300 μL sample of OMVs with a density of 108 vesicles/mL. The surface area of these vesicles was calculated from their average hydrodynamic diameter (128.2 ± 5.6 nm) measured using dynamic light scattering see Section 2.2. Each point is the average of three independent experiments. Error bars are the standard deviations of the triplicate experiments.
3.3. Achieving infinite dilution with Triton X-100
As shown in Eq. (1), the fluorescence of the system at infinite dilution is needed to determine the efficiency of the R18 lipid mixing assay. The standard practice to achieve infinite dilution in the R18 assay is to add Triton X-100. Triton X-100 is a detergent with a critical micelle concentration (CMC) approximately between 0.2 and 0.9 mM. Above its CMC, Triton X-100 spontaneously forms micelles that physically separate the R18 molecules, effectively diluting them, and dequenching their fluorescence signal. By adding varying amounts of Triton X-100 to R18-labeled OMVs, then measuring the ensuing increase in fluorescence signal, and comparing it to the fluorescence signal of diluted R18 of the same starting concentration, a de-quenching ratio is calculated using Eq. (2).
| (2) |
Methodologically in practice, varied amounts of Triton X-100 are added to a 1 mL sample of R18-labeled OMVs with a density of 5.0 × 10⁶ vesicles/mL under stirring at a controlled temperature. The samples are statically incubated for 5 min to give the Triton X-100 sufficient time to solubilize the R18 and for the fluorescence signal to stabilize prior to fluorescence measurement. OMVs are labeled as described in Section 2.1. The fluorescence is also read before the addition of Triton X-100 so that the de-quenching ratio can be calculated using Eq. (2). The maximum fluorescence of R18, in the denominator of Eq. (2), is taken as the fluorescence signal of the concentration of free R18 equal to that of incorporated R18, which is obtained by matching the fluorescence of a lipid-extracted R18 to a linear R18 fluorescence standard curve.
As shown in Fig. 2, temperature does not affect the de-quenching of R18. The Triton X-100 concentration needed to achieve infinite dilution in this system is 32.4 mM.
Fig. 2.

De-quenching of R18 Labeled OMVs using Triton X-100. Varying amounts of Triton X-100 were added to a 1 mL sample of R18-labeled OMVs at a density of 0.5 × 10⁸ vesicles/mL. The de-quenching ratio was calculated using Eq. (2). From the curves, infinite dilution is attained at 32.4 mM. Each point is the average of three independent experiments. Error bars are the standard deviations of the triplicate experiments.
3.4. Running an R18 lipid mixing assay
After determining the labelling procedure and the way to achieve infinite dilution, the R18 lipid mixing assay can be conducted in earnest. For illustrative purposes, the R18 assay is described herein to determine whether the pH of an OMV suspension influenced vesicle fusion.
A sample of OMVs (300 μL, 108 vesicles/mL suspension) is labelled with R18 as described in Section 2.2. Following labelling, a 50 μL aliquot of this labelled population is added to a quartz cuvette to which is added an aliquot of an unlabeled OMVs (50 μL, 1010 vesicles/mL), for a ratio of 1:100 of labelled to unlabeled OMVs. The cuvette is placed in the sample holder of the fluorimeter. The mixture is brought to 1 mL by the addition of 10 mM Tris buffer pH = 8.0 under constant stirring.
The fluorescence of the mixture is recorded after a 30 min incubation period. The stable and constant fluorescence signal is taken as the initial fluorescence in Eq. (1). Subsequently, a known volume of HCl or NaOH, determined via titration to give the desired pH, is added under stirring, via a small opening in the fluorometer sample holder. The fluorescence is continuously recorded until it reaches a plateau. Afterwards, the required volume of Triton X-100 to achieve a 15 mM concentration is added to the cuvette, via the same opening in the sample holder, to induce infinite dilution. A record of the fluorescence curve following these steps is shown in Fig. 3.
Fig. 3.
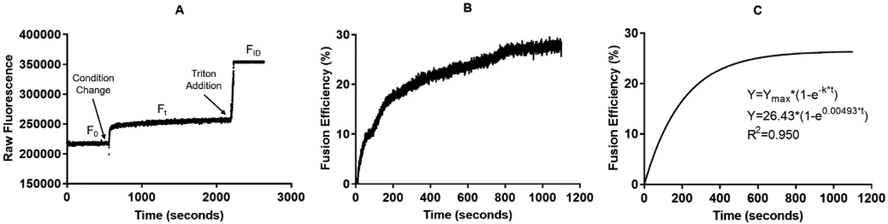
Analysis of the R18 Assay. A) shows time evolution of the R18 assay following mixing of the R18-labeled and unlabeled OMVs with r = 0.01 at T = 30 °C Steps at which a fusogenic condition is initiated and Triton X-100 is added are shown. F0 is the initial fluorescence, Ft is the fluorescence at time t, and FID is the fluorescence at infinite dilution. B) shows the converted raw fluorescence to fusion efficiency using Eq. (1) with the time adjusted such t = 0 is the time at which the fusogenic condition is initiated. C) shows the fitting results using GraphPad and Equation (3).
4. Analysis of the R18 lipid mixing assay
The raw fluorescence data obtained following the steps outlined in Section 3.4 need to be converted into fusion efficiency such that comparisons can be made between vesicle fusogenic studies. The following sections describe how to calculate kinetic parameters of vesicle fusion from the de-quenching curves, and to convert the heterotypic fusion efficiency from the R18 assay into the total fusion efficiency for the vesicle system.
4.1. Extracting kinetic parameters from raw fluorescence data
To compare the results from different fusion experiments using the R18 assay, the extent of lipid mixing, or fusion efficiency is first calculated using Eq. (1) at every time point. Subsequently, kinetic parameters, mainly the fusion rate and the maximum fusion efficiency, which are paramount to comparisons between different fusogenic conditions, are extracted. To obtain these parameters, the fusion efficiency with time curve is fit as a first order process (Eq. (3)).
| (3) |
where
Y is the fusion efficiency at time t
Ymax is the maximum fusion efficiency
k is the fusion rate constant
t is the time
Fitting can be done using standard statistical software. The fi shown in Fig. 3 was conducted using GraphPad Prism.
4.2. True fusion efficiency
The maximum fusion efficiency obtained as described in Section 3. pertains only to heterotypic fusion, or the fusion between dissimilar membranes (in this case, R18-labelled and unlabeled membranes). However, for the true fusion efficiency to be calculated, the totality of the fusion events that occur in the system over the course of investigation needs to be considered. This total fusion efficiency include self-fusion events between unlabeled as well as labelled OMVs. Below we derive the mathematics that allow calculation of the total fusion efficiency using data from the heterotypic fusion efficiency that is measured using the R18 assay.
Applying collision theory to vesicles in solution where diffusion determines the collision frequency, much like the Smoluchowski approach described here [21], the total collision rate of an unlabeled OMV with a R18-labelled OMVs is:
| (4) |
where
ϑUL is the total collision rate of an unlabeled OMV with labelled OMVs
RL is the radius of the labelled OMV
RU is the radius of the unlabeled OMV
KB is the Boltzmann constant
T is the absolute temperature in Kelvin
ρL is the number density of labelled OMVs
η is the viscosity of the suspension (approximated as that of water)
This approach assumes that diffusion of labeled OMVs to an unlabeled OMV leads to a collision. This collision rate describes the collisions involved only in heterotypic fusion. Using the same approach the total collision rate regardless of labelled or unlabeled OMVs collisions is:
| (5) |
where
ϑT is the total collision rate of any OMV with any other OMV
ρU is the number density of unlabeled OMVs
Furthermore,
| (6) |
where
| (7) |
Kinetic theory of chemical reactions states that the efficiency εT of the fusion is given by:
| (8) |
where
kT is the rate constant of the fusion which is also the total number of collisions that lead to fusion per time
Conversely,
| (9) |
where
kUL is the rate constant of the fusion between labelled and unlabeled OMVs. This is also the total number of collisions between labeled and unlabeled OMVs leading to fusion per unit time
It follows that by dividing Eqs. (8) and (9), the efficiency becomes:
| (10) |
Substituting (6) into (10) the efficiency is now:
| (11) |
From collision theory, and using the assumption that the energy requirements for fusion is the same for both labeled and unlabeled OMVs, the fusion rate for the total fusion reaction is given by:
| (12) |
Thus, by substituting (12) into (11), the final relation for the total fusion efficiency, as a function of the heterotypic fusion efficiency, is:
| (13) |
To experimentally validate the expression in Equation (13), the lipid mixing assay was conducted at varying labeled OMV/unlabeled OMV ratios, r, under the same fusogenic conditions as shown in Fig. 4. The curve fit, performed using GraphPad Prism, was in excellent agreement with the data, as shown by R2. The total fusion efficiency, determined from the experimental curve fit, showed that for high r values, the R18 fusion efficiency severely underestimated the total fusion efficiency. However, for very low values of r, there is no difference between the efficiency recorded by the R18 assay and the overall fusion efficiency. Therefore, to equate the fusion efficiency from the R18 assay to the total fusion efficiency, r should be small or conversely, a large excess of unlabeled vesicles should be used. From Eq. (13), it is easy to find that for values of r less than 0.05, there would be less than 5% difference between the R18 fusion efficiency and the overall efficiency.
Fig. 4.

R18 fusion efficiency as a function of the ratio of labeled to unlabeled rOMVs. The dotted lines are the fitted lines to the curve εT/(1+r) found by rearranging Equation (13). Fitting was done in GraphPad Prism. The total fusion efficiency was determined for each temperature condition. Each point is the average of three independent experiments. Error bars are the standard deviations of triplicate experiments.
5. Conclusion
The R18 lipid mixing assay was standardized for the purpose of studying the fusion kinetics of OMVs isolated from E. coli Nissle 1917. First, we developed a method to determine the amount of R18 needed to label OMVs, allowing saturation of the membrane with R18 and maximum quenching of the R18 fluorescence signal. Second, we described how to find the amount of Triton X-100 that is needed to establish the fluorescence at infinite dilution. Using these parameters, we developed the experimental design, method and data analysis for an R18 lipid mixing assay under OMV fusogenic conditions. Lastly, we derived a mathematical relationship that shows the fusion efficiency reported by the R18 assay needs to be either scaled by a factor of (r + 1), or conducted when r is less than 0.05, where r is the ratio of labelled to unlabeled vesicles, to obtain the true representation of total fusion efficiency.
Acknowledgements
This research is supported by the National Institutes of Health under Award Numbers R01AI139664 and R21AI137858 to DP. Y.M.D.G. is supported by the Sam Fleming Scholarship and previously by a Kavli Graduate Fellowship.
Footnotes
Appendix A. Supplementary data
Supplementary data to this article can be found online at https://doi.org/10.1016/j.ymeth.2019.11.009.
References
- [1].Jahn R, Lang T, Sü Dhof TC, Membrane fusion, Cell 112 (2003) 519–533. [DOI] [PubMed] [Google Scholar]
- [2].Harrison SC, Viral membrane fusion, Virology 479–480 (2015) 498–507, 10.1016/j.virol.2015.03.043. [DOI] [PMC free article] [PubMed] [Google Scholar]
- [3].Hoekstra D, de Boer T, Klappe K, Wilschut J, Fluorescence method for measuring the kinetics of fusion, Biochemistry 23 (1984) 5675–5681. [DOI] [PubMed] [Google Scholar]
- [4].Pal R, Barenholz Y, Wagner RR, Pyrene phospholipid as a biological fluorescent probe for studying fusion of virus membrane with liposomes, Biochemistry 27 (1988) 30–36, 10.1021/bi00401a006. [DOI] [PubMed] [Google Scholar]
- [5].Struck DK, Hoekstra D, Pagano RE, Use of resonance energy transfer to monitor membrane fusion, Biochemistry 20 (1981) 4093–4099, 10.1021/bi00517a023. [DOI] [PubMed] [Google Scholar]
- [6].Stegmann T, Wey J, Bartoldus I, Schoen P, Bron R, Ortiz A, Nieva JL, Wilschut J, Evaluation of viral membrane fusion assays. Comparison of the octadecylrhodamine dequenching assay with the pyrene excimer assay, Biochemistry 32 (1993) 11330–11337, 10.1021/bi00093a009. [DOI] [PubMed] [Google Scholar]
- [7].Molotkovsky JG, Fluorescent lipid probes: properties and application, Russ. J. Bioorg. Chem 25 (1999) 759–771. [Google Scholar]
- [8].Shrestha D, Jenei A, Nagy P, Vereb G, Szollosi J, Understanding FRET as a research tool for cellular studies, Int. J. Mol. Sci 16 (2015) 6718–6756, 10.3390/ijms16046718. [DOI] [PMC free article] [PubMed] [Google Scholar]
- [9].MacDonald RI, Characteristics of self-quenching of the fluorescence of lipid-conjugated rhodamine in membranes, J. Biol. Chem 265 (1990) 13533–13539. [PubMed] [Google Scholar]
- [10].Hamilton BS, Whittaker GR, Daniel S, Influenza virus-mediated membrane fusion: determinants of hemagglutinin fusogenic activity and experimental approaches for assessing virus fusion, Viruses 4 (2012) 1144–1168, 10.3390/v4071144. [DOI] [PMC free article] [PubMed] [Google Scholar]
- [11].Rizo J, Südhof TC, Snares and muncl8 in synaptic vesicle fusion, Nat. Rev. Neurosci 3 (2002) 641–653, 10.1038/nrn898. [DOI] [PubMed] [Google Scholar]
- [12].Sato YT, Umezaki K, Sawada S, Mukai S, Sasaki Y, Harada N, Shiku H, Akiyoshi K, Engineering hybrid exosomes by membrane fusion with liposomes, Sci. Rep 6 (2016) 21933, 10.1038/srep21933. [DOI] [PMC free article] [PubMed] [Google Scholar]
- [13].François-Martin C, Pincet F, Actual fusion efficiency in the lipid mixing assay-comparison between nanodiscs and liposomes, Sci. Rep 7 (2017) 1–8, 10.1038/srep43860. [DOI] [PMC free article] [PubMed] [Google Scholar]
- [14].Kulp A, Kuehn MJ, Biological functions and biogenesis of secreted bacterial outer membrane vesicles, Annu. Rev. Microbiol 64 (2010) 163–184, 10.1146/annurev.micro.091208.073413. [DOI] [PMC free article] [PubMed] [Google Scholar]
- [15].Baker JL, Chen L, Rosenthal JA, Putnam D, DeLisa MP, Microbial biosynthesis of designer outer membrane vesicles, Curr. Opin. Biotechnol 29 (2014) 76–84, 10.1016/j.copbio.2014.02.018. [DOI] [PMC free article] [PubMed] [Google Scholar]
- [16].Gnopo YMD, Watkins HC, Stevenson TC, DeLisa MP, Putnam D, Designer outer membrane vesicles as immunomodulatory systems – reprogramming bacteria for vaccine delivery, Adv. Drug Deliv. Rev 114 (2017) 132–142, 10.1016/j.addr.2017.05.003. [DOI] [PubMed] [Google Scholar]
- [17].Rappazzo CG, Watkins HC, Guarino CM, Chau A, Lopez JL, DeLisa MP, Leifer CA, Whittaker GR, Putnam D, Recombinant M2e outer membrane vesicle vaccines protect against lethal influenza A challenge in BALB/c mice, Vaccine 34 (2016) 1252–1258, 10.1016/j.vaccine.2016.01.028. [DOI] [PubMed] [Google Scholar]
- [18].Watkins HC, Rappazzo CG, Higgins JS, Sun X, Brock N, Chau A, Misra A, Cannizzo JPB, King MR, Maines TR, Leifer CA, Whittaker GR, DeLisa MP, Putnam D, Safe recombinant outer membrane vesicles that display M2e elicit heterologous influenza protection, Mol. Ther 25 (2017) 989–1002, 10.1016/j.ymthe.2017.01.010. [DOI] [PMC free article] [PubMed] [Google Scholar]
- [19].Chen L, Valentine JL, Huang C-J, Endicott CE, Moeller TD, Rasmussen JA, Fletcher JR, Boll JM, Rosenthal JA, Dobruchowska J, Wang Z, Heiss C, Azadi P, Putnam D, Trent MS, Jones BD, DeLisa MP, Outer membrane vesicles displaying engineered glycotopes elicit protective antibodies, Proc. Natl. Acad. Sci (2016) 201518311, 10.1073/pnas.1518311113. [DOI] [PMC free article] [PubMed] [Google Scholar]
- [20].Rosenthal JA, Huang C, Doody AM, Leung T, Mineta K, Feng DD, Wayne EC, Nishimura N, Leifer C, DeLisa MP, Mendez S, Putnam D, Mechanistic insight into the Th1-biased immune response to recombinant subunit vaccines delivered by probiotic bacteria-derived outer membrane vesicles, PLoS One 9 (2014) 1–24, 10.1371/journal.pone.0112802. [DOI] [PMC free article] [PubMed] [Google Scholar]
- [21].Beck JS, Hardy CD, Coagulation in cell suspensions: extensions of the von Smoluchowski model, J. Theor. Biol 120 (1986) 181–189. [DOI] [PubMed] [Google Scholar]