

Summary:
The olfactory bulb receives rich glutamatergic projections from the piriform cortex. However, the dynamics and importance of these feedback signals remain unknown. Here, we use multiphoton calcium imaging to monitor cortical feedback in the olfactory bulb of awake mice and further probe its impact on the bulb output. Responses of feedback boutons were sparse, odor specific and often outlasted stimuli by several seconds. Odor presentation either enhanced or suppressed the activity of boutons. However, any given bouton responded with stereotypic polarity across multiple odors, preferring either enhancement or suppression. Feedback representations were locally diverse and differed in dynamics across bulb layers. Inactivation of piriform cortex increased odor responsiveness and pairwise similarity of mitral cells, but had little impact on tufted cells. We propose that cortical feedback differentially impacts these two output channels of the bulb by specifically decorrelating mitral cell responses to enable odor separation.
Introduction
Early sensory areas receive massive top-down projections from the cortex, suggesting that this feedback plays a crucial function (Otazu and Leibold, 2011; Rao and Ballard, 1999). Visual, auditory, and somatosensory experiments have proposed several roles for cortical feedback, including sharpening of sensory representations, or relaying information pertaining to expectation, reward, attention, learning and action (Gilbert and Li, 2013; Glickfeld et al., 2013; Harris and Mrsic-Flogel, 2013; Petreanu et al., 2012). The olfactory bulb (OB), like other early sensory areas, receives abundant feedback projections from cortical areas involved in odor identification, localization and olfactory memory (Boyd et al., 2012; Markopoulos et al., 2012; Oswald and Urban, 2012; Shepherd, 1972). Although cortical feedback axons outnumber olfactory sensory inputs, their function in shaping the OB output remains unclear to date.
The OB receives glutamatergic feedback mainly from anterior olfactory nucleus (AON), piriform and entorhinal cortex (Oswald and Urban, 2012; Rothermel and Wachowiak, 2014; Shepherd, 1972; Shipley and Adamek, 1984). The bulb also integrates GABAergic (Nunez-Parra et al., 2013), neuromodulatory (Devore and Linster, 2012; Petzold et al., 2009; Ranade and Mainen, 2009; Wachowiak et al., 2009; Wilson et al., 2004) and hormonal (Tobin et al., 2010) inputs which have been proposed to contextually regulate OB activity during learning and odor discrimination. In this study, we focus on understanding the dynamics and roles of feedback signals from the primary olfactory cortex (piriform) to the bulb.
Previous work has suggested that in complex sensory environments, the piriform cortex reconstructs olfactory objects from degraded noisy stimuli, or segments relevant targets from irrelevant, variable backgrounds (Gottfried, 2010; Vickers, 2000; Wilson and Sullivan, 2011). Within this framework, the piriform cortex may act as a pattern-recognition device (Babadi and Sompolinsky, 2014; Barak et al., 2013; Caron et al., 2013; Haberly, 2001; Haberly and Bower, 1989; Linster and Hasselmo, 2001) that compares incoming sensory inputs with representations of previously experienced odors, integrates contextual information, and sends predictive signals to the sensory periphery through massive bulbar feedback projections. Indeed, anatomical tracing studies show that individual anterior piriform cortex (APC) feedback axons follow long, tortuous trajectories across the OB, and form clusters of synapses which can lie far apart from each other (Matsutani, 2010).
The output neurons of the OB, the mitral/tufted (MT) cells project most abundantly in a distributed manner to the piriform cortex, and to several other areas including the anterior olfactory nucleus (AON), olfactory tubercle, entorhinal cortex, and amygdala (Ghosh et al., 2011; Miyamichi et al., 2011; Nagayama et al., 2010; Shepherd, 1972; Sosulski et al., 2011). In turn, the primary recipients of these feedback projections are the granule cells (GCs) (Balu et al., 2007; Boyd et al., 2012; Margrie et al., 2001; Urban and Sakmann, 2002; Wilson and Mainen, 2006). Piriform cortex feedback axons also establish sparser synapses with deep short axon cells, which inhibit the GCs, and with interneurons in the glomerular layer (periglomerular and superficial short axon cells) (Boyd et al., 2012; Matsutani, 2010). Thus, cortical feedback axons act indirectly on MT cells via OB inhibitory interneurons.
Studies in anesthetized rodents have proposed that cortical feedback provides non-specific, global inhibitory gain control to prevent runaway saturation of MT cell firing. Electrical (Nakashima et al., 1978) or optogenetic activation (Boyd et al., 2012) of the feedback projections has been shown to suppress odor-evoked MT cell responses. These results cannot easily be extrapolated to awake animals, since cortical feedback could be modulated by context and expectation, and may follow substantially different dynamics (Gilbert and Li, 2013; Harris and Mrsic-Flogel, 2013). In addition, piriform cortex inactivation in awake rabbits has been shown to synchronize MT cells, while decreasing their firing rate, which contradicts the findings from anesthetized mice (Gray and Skinner, 1988).
To date, it remains unknown whether the impact of piriform cortex feedback varies across the two main output populations of the bulb, the mitral and tufted cells, which reside in different anatomical layers. Recent work indicates that mitral and tufted cells differ in response properties (Burton and Urban, 2014; Fukunaga et al., 2012; Igarashi et al., 2012; Manabe and Mori, 2013; Nagayama et al., 2004) and project differentially to downstream brain areas, with stronger tufted cell innervation of the AON compared to the piriform cortex (Igarashi et al., 2012).
Here, we characterized the response properties of cortical bulbar boutons in awake head-fixed mice across bulb layers as a function of odor identity and concentration via multiphoton imaging of GCaMP5 signals (Figure 1A, B). Furthermore, we employed pharmacological suppression of neuronal activity in the APC in conjunction with optical monitoring of both mitral and tufted cells activity to determine the contribution of top-down cortical inputs in shaping sensory processing in the bulb.
Figure 1. Monitoring corticalbulbar boutons in awake head-fixed mice via multiphoton imaging of GCaMP5 signals.
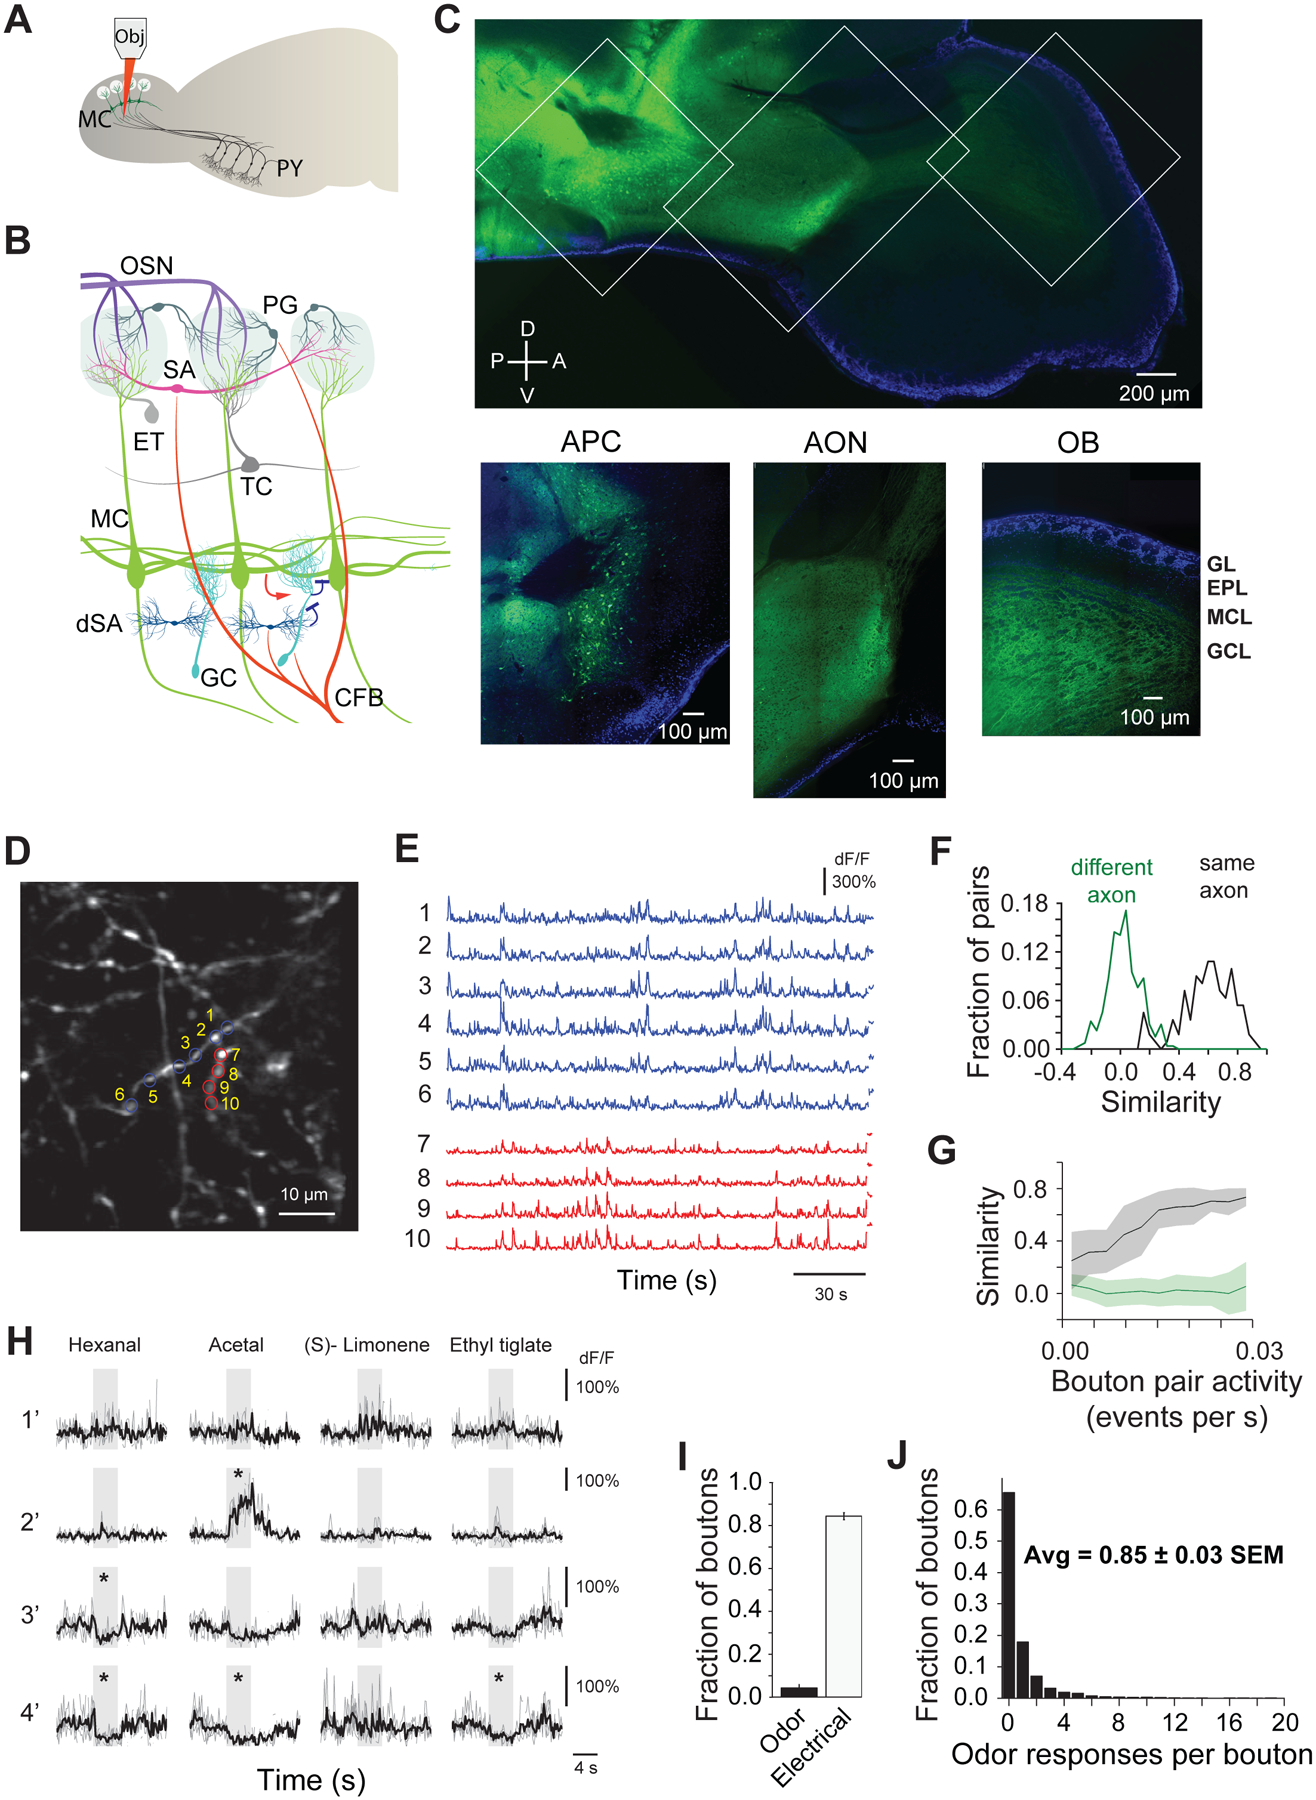
A. Schematics of experimental setup: optical monitoring of cortical-bulbar feedback bouton responses via multiphoton imaging of GCaMP5 signals; Obj, 2p microscope objective; MC, mitral cells, Py, pyramidal neurons in the anterior piriform cortex (APC); B. Olfactory bulb (OB) circuit and neuronal types; OSN, olfactory sensory neurons; PG, periglomerular cells; SA, superficial short axon cells; ET, external tufted cells; TC, tufted cells; MC, mitral cells; dSA, deep short axon cells; GC, granule cells; CFB, cortical feedback fibers;;
C. (Top) Composite GCaMP5 (green) and DAPI nuclear (blue) signals in a confocal reconstruction tiling a fixed sagittal brain slice from a mouse injected in the APC with AAV2.9 GCaMP5 expressing viruses. (Bottom) Insets for APC (Left), anterior olfactory nucleus (AON) (Center) and OB (Right); GL, glomerular layer, EPL, external plexiform layer, MCL, mitral cell layer, GCL, granule cell layer; A, anterior, P, posterior, D, dorsal, V, ventral;
D. Example field of view ~300 μm deep from surface of GCaMP5 labeled cortical feedback axons and boutons in an awake head-fixed mouse;
E. Spontaneous activity traces (dF/F0) from feedback boutons marked in D. Top six traces and respectively bottom four traces are from boutons of two different axonal branches;
F. Histogram of pairwise correlations of baseline activity (dF/F) in a three minute interval preceding odor presentation; green and black traces corresponds to bouton pairs from different and respectively same axonal branches;
G. Pairwise correlations of baseline activity (dF/F) in a three minute interval preceding odor presentation as a function of spontaneous events frequency; shaded area corresponds to standard deviation;
H. Odor responses of four example boutons in GCL across four different stimuli (hexanal, acetal, (S)-limonene, ethyl tiglate, 0.4 % saturated vapor pressure). Individual repeats (gray), and average traces (black) are shown; odors trigger both positive (enhanced responses) and negative (suppressed responses) deflections from baseline; * mark significant odor responses; stimulus duration, 4s;
I. Average fraction of cortical feedback boutons imaged responsive to odor (Odor) and APC electrical stimulation (Electrical) (40 pulses, 100μs, at 100Hz, 30μA); error bars indicate s.e.m calculated over odors and fields of view (left) and fields of view respectively (right).
J. Histogram of the number of odors in the panel (Odor Set A, Table S1) that individual feedback boutons in the GCL responded to.
Results
We expressed the genetically encoded calcium indicator GCaMP5 (Tian et al., 2009) in the APC under the control of the EF1α promoter using adeno-associated viruses (AAV2.9). To ensure homogeneous labeling of the APC, we performed multiple bilateral injections (see Methods). Confocal imaging of DAPI signals and GCAMP5 fluorescence in sagittal slices showed robust labeling of cell bodies in the APC and abundant neuropil in the OB and AON (Figure 1C, Figure S1A). No fluorescent cell bodies could be detected in the OB. In the bulb, the density of GCaMP5 labeled boutons was highest in the GCL, but axonal projections were also present in the glomerular and external plexiform layers (Figure 1B, C, Figure S1C, D). Consistent with previous reports of lack of GABAergic feedback from the piriform cortex (Boyd et al., 2012), we did not find expression of GCaMP5 in feedback axons upon injection of EF1α -FLEX-GCaMP5 AAV2.9 in the APC of GAD65-Cre mice (Figure S1B, Taniguchi et al., 2011).
Corticalbulbar feedback projections are spontaneously active and show sparse and odor specific responses
To date, little is known about corticobulbar feedback activity in awake or anesthetized animals. One recent study investigated the dynamics of AON-to-bulb feedback boutons in the glomerular layer (Rothermel and Wachowiak, 2014). As a first step towards understanding the functional roles of corticalbulbar feedback projections, we characterized their spontaneous dynamics and responses to a diverse panel of 20 odors (Odor Set A, Table S1), using multiphoton imaging of GCaMP5 signals in awake head-fixed mice (Figure 1A, D, Figure S1E–G, see Methods). We started by monitoring feedback axons innervating the deep OB layers (200–350 μm from surface), since these represent the highest number of corticalbulbar projections (Figure S1C, D).
Approximately 23% of the imaged boutons (5,221 boutons, 18 fields of view, 4 mice) showed locally diverse and brief (<1s) spontaneous activity bouts (Figure 1D, E, Figures S1H, S2A, B, Supplementary movie 1, see Methods). Boutons anatomically assigned to the same axonal branch (see Methods) showed significantly higher correlations than boutons belonging to different branches in a given field of view (FOV) (Avg. = 0.60 ± 0.02 vs. Avg. = 0.03 ± 0.01, values indicate Mean ± SEM unless specified otherwise, 52 axonal segments, 337 pairs of boutons from the same axon, 648 pairs of boutons from different axons, p<0.001, Wilcoxon rank sum test, Figure 1F,G, Figure S1H). As expected, correlations in spontaneous activity of boutons on the same axon (Petreanu et al., 2012) were higher for bouton pairs that had high levels of spontaneous activity (Figure 1G).
To determine whether an odor response was significant, we compared the average fluorescence change during odor presentation with a bootstrap distribution of average fluorescence calculated over baseline periods of equal length preceding odor presentation (threshold = 99.9th percentile of bootstrap fluorescence distribution, Figure S2C–F, see Methods). Odor presentation triggered significant responses in ~35% of all imaged boutons (responsive to at least one odor, Figure 1H, Figure S2C–F, see Methods). A given odor in the panel (Odor Set A, Table S1), on average, triggered responses in only 4.3 ± 0.4 % (N=20 odors) of cortical feedback boutons imaged in the GCL (5,221 boutons, 18 FOVs, 4 mice), and on average a bouton responded to 0.85 ± 0.03 odors (Figure 1I, J). Within the subset of responsive boutons, individual boutons responded sparsely (2.5 ± 0.07, odor responses/bouton, N=1,827 responsive boutons) through enhancement (~45%) and more often suppression (~55%) of baseline activity (4,412 odor-bouton pairs, 4 mice, Supplementary movies 2 and 3). The distribution of number of odor responses per bouton did not follow a single binomial distribution, suggesting the presence of distinct populations of highly selective, as well as more promiscuous feedback boutons (Figure S2G, H).
A direct comparison of activity patterns from the same boutons across anesthetized and awake conditions showed significant reduction in spontaneous events during anesthesia (ketamine/xylazine, see Methods, 4.6 ± 0.4 spontaneous events per 3 min interval vs. 10.2 ± 0.5, N=283 boutons, 2 mice, p<0.001, Wilcoxon signed rank test, Figure S3A, B). Suppressed odor responses were weaker under anesthesia (Stettler and Axel, 2009) (~84% bouton-odor pairs, N =112, p<0.001, Wilcoxon signed rank test, Figure S3C). Enhanced responses showed both increases and decreases in response amplitude and number of responsive boutons under anesthesia (N = 326 bouton-odor pairs, 2 mice, Figure S3C, D), and on average were stronger (Figure S3C) and more robust across trials (SD / Mean response =1.2±0.09 awake vs. 0.72±0.09 anesthetized, p<0.001, Wilcoxon signed rank test). In anesthetized mice, a given odor triggered responses in an average of 7.42 ± 0.22 % of imaged feedback boutons in the GCL (N = 326 responsive bouton-odor pairs, 2 mice), similar in range to reports monitoring responses in cell bodies from the piriform cortex (Stettler and Axel, 2009). Corticalbulbar feedback activity depends heavily on the brain state. Thus, for the rest of this study, we restricted experiments to awake, head-fixed mice.
To determine whether the sparse nature of observed feedback odor responses can be accounted for by poor cell health (from viral GCaMP5 expression) or limited sensor sensitivity, we electrically stimulated the APC (8 × 100 μs pulses, 100Hz, 30μA, see Methods) while monitoring feedback responses. Electrical stimulation evoked strong and long-lasting calcium transients in the majority of boutons (85%, Figure 1I, Figure S4A,C), likely due to dense recurrent connections in the APC (Franks et al., 2011).
To assess the relationship between neuronal spike rate and fluorescence measurements, we similarly monitored the change in GCaMP5 signals in corticalbulbar feedback boutons in response to electrical stimulation in the APC (100μs, 50μA, see Methods) of awake mice. To eliminate the contribution of intra-cortical recurrent activity to the GCaMP5 responses, we performed these experiments in conjunction with local injection of the GABAA receptor agonist muscimol in the APC (0.5 mg/ml, 1 μl over 5 min, see Methods). Using fluorescent muscimol (1.0 mg/ml, 2 μl over 10 min, see Methods), in a subset of experiments (N=3 mice), we confirmed that muscimol spread was restricted to the APC and did not diffuse to nearby cortical areas such as the AON (see Methods, Figure S5B–C). Muscimol injection significantly decreased the frequency of spontaneous events (Figure S5D,E) in cortical feedback boutons and completely abolished odor-evoked bouton responses (Figure S5F).
In the presence of muscimol, single pulses (100μs, 50μA, see Methods) failed to evoke calcium transients, suggesting that GCaMP5 activity may not report single action potentials (Akerboom et al., 2012). However, pairs of pulses, as well as stronger stimulation protocols did evoke detectable fluorescence transients (Figure S5G,H) with response kinetics matching reports from cultured neurons (~120 ms onset, ~250ms offset, Figure S5G,J,K). The amplitude of evoked calcium transients (dF/F) increased monotonically with the number of pulses per stimulation event (2–16 pulses at 50Hz or 100Hz), and spanned the range of dF/F values observed for bouton odor responses (Figure S5H).
Pyramidal neurons in the piriform cortex have been reported to fire spontaneous bursts of 2–5 spikes at high frequency (≥100 Hz) (McCollum et al., 1991). Spontaneous calcium transients in our data (Figures 1E, S1H) match the increase in fluorescence amplitude triggered by electrical stimulation bursts (2–16 pulses at 50 or 100 Hz, Figure S5H). These observations suggest that calcium transients observed in the corticalbulbar boutons, at rest, represent short bursts of several action potentials and may indeed reflect the ongoing spontaneous activity of pyramidal APC neurons.
To estimate the relationship between decreases in fluorescence during odor evoked- suppression and changes in neuronal firing rate, we obtained an estimate of the expected baseline bouton fluorescence given various rates of spontaneous activity. To this end, we convolved the average dF/F bouton response to APC electrical stimulation in the presence of muscimol (2 pulses, 100μs, 50μA, 100Hz) with Poisson pulse trains of different frequencies (Figure S5I). We found that the amplitude of odor-suppressed responses was consistent with the fluorescence change calculated from a simulated average spike rate of a few Hz (Figure S5I), suggesting that the suppression in bouton fluorescence may reflect the silencing of spontaneous firing bouts in the APC (Zhan and Luo, 2010).
Two distinct corticalbulbar feedback channels: enhanced versus suppressed boutons
Strikingly, boutons showed high selectivity in their mode of response (enhancement vs. suppression). Approximately 40% of the responsive boutons reacted to odors exclusively by enhancement and 55% by suppression of their baseline activity (Figure 2A–D). This dichotomy in response was present throughout the population, and became even more apparent when the analysis was restricted to boutons that were responsive to more than half of odors in the panel (0 out of 52 boutons showed mixed responses). The sparse nature and segregation of enhanced and suppressed responses remained apparent even when sampling a larger odor panel (33 odors, Odor Set B, Table S1, ~6.7% of responsive boutons showed both enhanced and suppressed responses, N=856 boutons, 2 mice, Figure 2C, Figure S4D) and could not be easily explained by odor sampling biases. On average, suppressed boutons were as narrowly tuned to odors as enhanced boutons (Avg. lifetime sparseness suppressed boutons = 0.60 ± 0.30 SD, N=849 boutons vs. 0.60 ± 0.23 SD, N=849 enhanced boutons, p = 0.95, Wilcoxon rank sum test). Furthermore, boutons belonging to the same axon consistently showed either enhanced or suppressed odor responses (only 1 out of 52 analyzed axons had mixed responses), suggesting that the polarity of response segregates along different axons.
Figure 2. Dichotomy in corticalbulbar feedback odor responses: enhanced versus suppressed boutons.
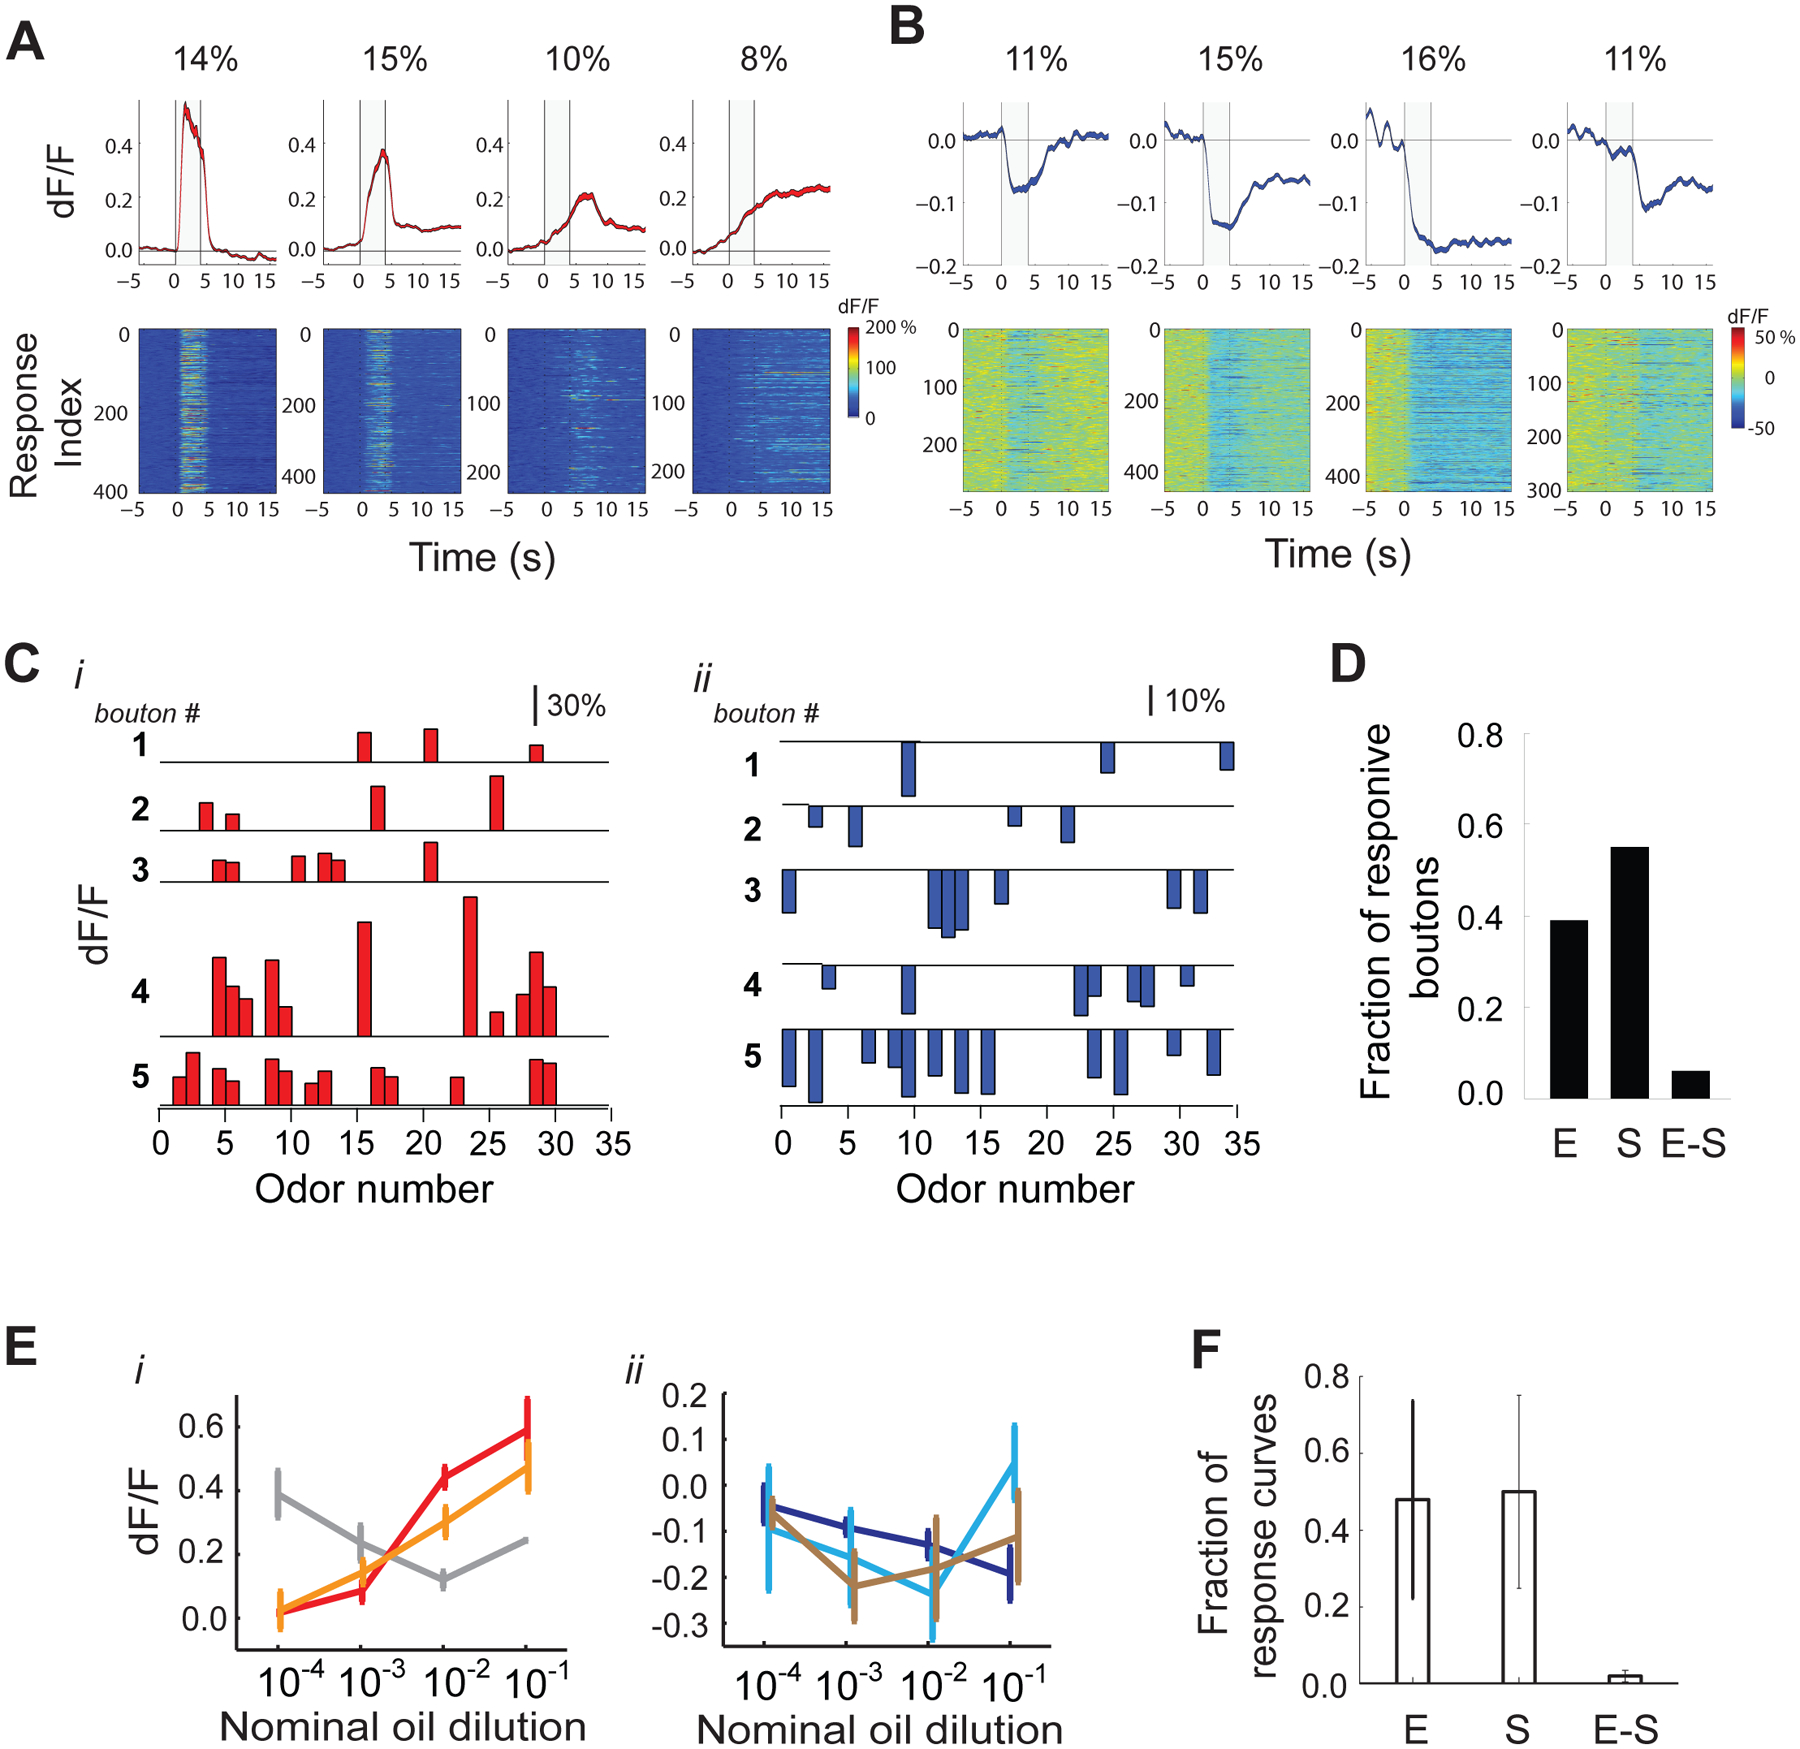
A, B. Odor response types obtained via k-means clustering and their relative distribution in the population of feedback boutons targeting the GCL; Average response shapes (Top) and all corresponding odor responses (GCaMP5) assigned to each cluster (Bottom) A. Enhanced response clusters; B. Suppressed response clusters;
C. Example average odor response spectra (ORS) of enhanced (red) and suppressed (blue) boutons; sparsely responding boutons, as well as broadly tuned boutons are shown for illustration;
D. Fraction of boutons responsive to odors in the panel (Odor Set A, Table S1) via only enhancement (E), only suppression (S) and both enhancement and suppression (E-S);
E. Enhanced (i) and suppressed (ii) concentration–response (GCaMP5) curves for two odors (ethyl valerate, i, and heptanal, ii) in three example cortical feedback boutons; error bars indicate SEM across repeats;
F. Fraction of concentration response curves that were purely enhanced (E), only suppressed (S), or showed both enhancement and suppression compared to baseline within the sampled concentration range (E-S); error bars indicate standard deviation across fields of view.
Suppressed boutons were more active in the baseline period (0.017±0.001 events/s vs. 0.010±0.001 events/s, p<0.001, t-test), and displayed higher resting fluorescence (F0) compared to enhanced boutons (Figure S4E–G). The lack of excitatory odor responses in these boutons may simply result from baseline saturation of the GCaMP5 sensor. Conversely, the absence of negative deflections in the ‘enhanced’ boutons could be explained by an intrinsic bias in calcium imaging methods towards detecting increases in fluorescence, given low resting activity. However, several pieces of evidence render these possibilities unlikely (Supplementary Note 1, Methods, Figure S4E–H). In addition, we directly tested whether boutons suppressed by odors can in principle show an increase in their baseline fluorescence levels via APC electrical stimulation (see Methods). Brief electrical stimulation (100 μs at 30 μA) during periods of odor-triggered-suppression reliably resulted in increased fluorescence, switching the response polarity of individual boutons from suppression to enhancement (Figure S4A–C). This robust fluorescence increase upon electrical stimulation (Figure 1I) confirms that the observed dichotomy of suppressed and enhanced bouton odor responses is not an artifact of sensor saturation and may instead represent different selective populations of pyramidal cells in the APC that respond to odors mostly via enhancement or via suppression.
Corticalbulbar feedback responses often outlast stimulus presentation
Clustering of odor responses (see Methods) revealed diverse temporal dynamics of both enhanced and suppressed bouton responses, including ‘transient’, ‘ramping’, ‘persistent’ and ‘lingering’ features (Figure 2A, B, 18 FOV, 4 mice, 2,913 odor-bouton pairs). On average, enhanced responses tracked stimulus dynamics and changes in concentration more closely. Many boutons showed long-lasting activity patterns that outlasted the odor stimulus (4s) by several seconds (>12s) (76% of suppressed boutons, 35% of enhanced boutons). Further, ~20% of both suppressed and enhanced responses were triggered by the termination of odor stimulation (OFF responses). Given the GCaMP5 faster response kinetics (Figure S5G,J,K), these observations indicate that brief odor inputs can initiate long lasting bouts of activity in cortical feedback fibers which may further impact bulbar dynamics during fluctuating odor plumes, or across multiple encounters of the same stimulus.
Separation of enhanced and suppressed bouton responses is maintained across odor concentrations
We investigated whether the dichotomy of bouton response types is particular to the odor concentrations used, or present across a wider range of stimulus intensities. Computational (Kaplan and Lansner, 2014; Wilson and Sullivan, 2011) and experimental (Franks et al., 2011; Stettler and Axel, 2009) studies in anesthetized mice have suggested that the piriform cortex shows invariance to changes in odor concentration. We sampled odor concentration (Figure 2E, Figure S6A, B, see Methods) across ~3 orders of magnitude (Figure S6A). Only 10% of bouton responses were concentration invariant (changed average response amplitude across concentrations within the range of inter-trial variability, see Methods, Figure S6C, 309/4940 boutons, 6,582 bouton-concentration responses, 12 FOVs, 3 mice). Varying stimulus strength modulated both the amplitude and number of bouton responses (Figure 2E, Figure S6). Across concentrations, some boutons showed monotonic increase/decrease in response amplitude, while others (~50%) followed complex non-monotonic response curves (see Methods, Figure S6D, E, F). Importantly, within the sampled concentration range, we rarely (< 5%) observed a change in the response of the feedback boutons targeting the GCL from enhanced to suppressed and vice-versa (Figure 2F).
Differential cortical feedback dynamics across bulb layers
In addition to targeting the GCL, corticalbulbar feedback fibers synapse sparsely on inhibitory interneurons in the glomerular layer (GL) as well (Figures 1C, 3A, Figure S1C, D). We tested whether the activity patterns and spatial organization of cortical feedback vary across bulb layers. Feedback boutons in the GL appeared to have more spontaneous activity compared to the ones in GCL (Avg. = 14.9 ± 0.2 events per 3 min, N=3,355 boutons, 10 FOVs, 6 mice vs. 1.62 ± 0.1, N=5,067, 14 FOVs, 4 mice, Figure 3B, Figure S7A). A possible explanation for this discrepancy is the increased optical access to the superficial glomerular layer compared to the deeper granule cell layer. This apparent increase in baseline fluorescence can in principle facilitate the detection of suppressed odor responses. However, the GL feedback boutons were sparser in their responses (Figure 3C,D) compared to the deeper layers (Avg. lifetime sparseness = 0.72 ± 0.23 SD, N=558 responsive boutons in GL vs. 0.61 ± 0.27 SD, N=1,527 boutons in GCL, within same animals, p<0.001, Wilcoxon Rank Sum Test). Specifically, purely suppressed boutons were significantly narrower in their tuning compared to their counterparts in the GCL (Avg. lifetime sparseness = 0.81 ± 0.21 SD, N=296 boutons in GL vs. 0.60 ± 0.21 SD, N=849 boutons in GCL, p <0.001, Wilcoxon rank sum test), while the enhanced boutons were matched in broadness of tuning across layers (Avg. lifetime sparseness = 0.61 ± 0.21 SD, N=228 GL boutons vs. 0.60 ± 0.23 SD, N=632 GCL boutons, p=0.86, Wilcoxon Rank Sum Test, Figure 3C,D). Mixed boutons were a minority in the GL as well, but appeared more frequently compared to the GCL (14% E-S, Figure S7B). Clustering revealed several types of odor responses across the population, similar to those observed in the GCL with a significant fraction of responses outlasting stimulus offset (~48% of suppressed, ~34% of enhanced responses, Figure S7C, D). Thus, across bulb layers, cortical bulbar feedback fibers differ in the frequency of suppressed responses, but are similar in the presence of enhanced-suppressed bouton dichotomy and long lasting responses.
Figure 3. Differential cortical feedback bouton odor responses across bulb layers.
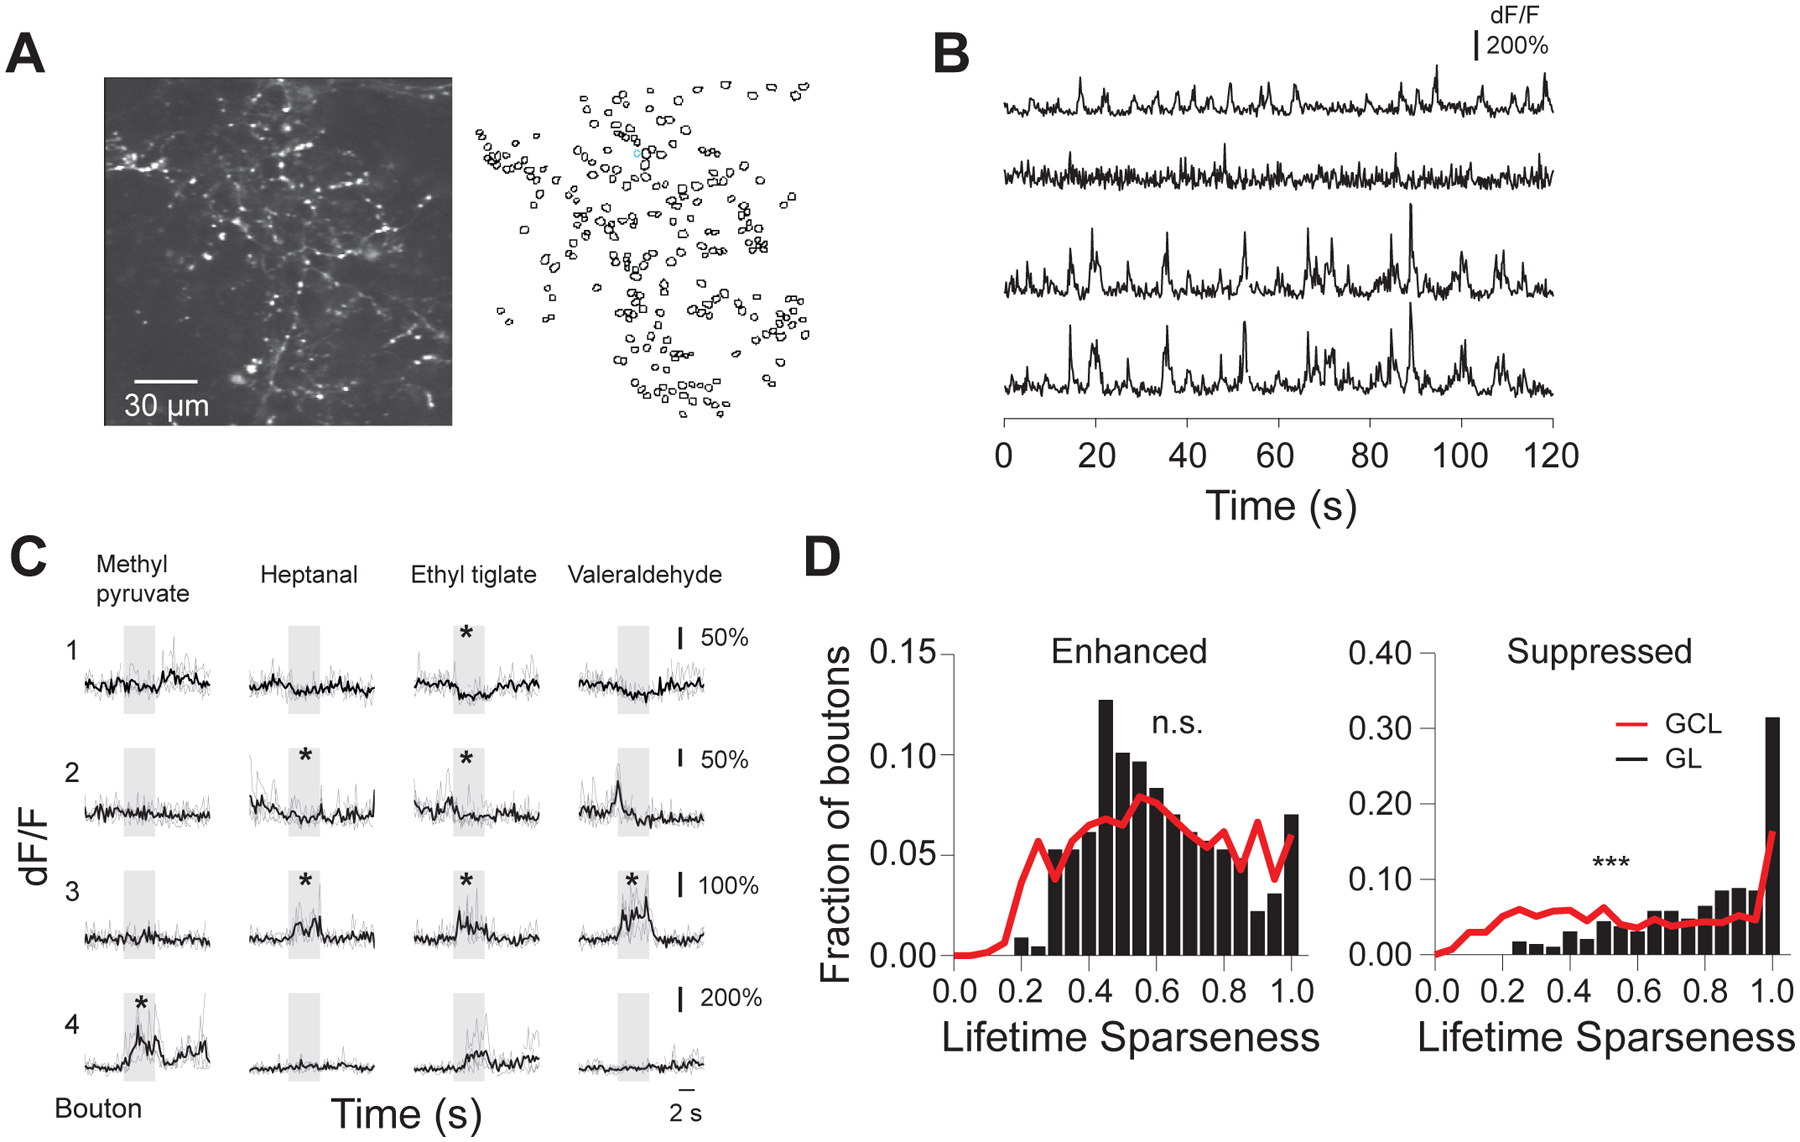
A. (Left) Example field of view ~80 μm deep from surface of GCaMP5 labeled cortical feedback axons and boutons in an awake head-fixed mouse; (Right) Outlines of the regions of interest (ROIs) corresponding to putative cortical feedback boutons;
B. Spontaneous activity traces from the feedback boutons selected in the field of view showed in A. Bottom two traces correspond to boutons assigned to the same axonal branch by reconstruction of single axons;
C. Odor responses of four example boutons in GL across four different stimuli (ethyl pyruvate, heptanal, ethyl tiglate, valeraldehyde, 0.4% saturated vapor pressure). Individual repeats (gray) and average traces (black) are shown; odors trigger both positive (enhanced responses) and negative (suppressed responses) deflections from baseline; * mark significant odor responses; stimulus duration, 4s;
D. Lifetime sparseness of boutons responsive to odors in the panel (Odor Set A, Table S1) only via enhancement (Left) or suppression (Right); distributions in the GCL (black bars) and GL (gray trace) are shown.
Local diversity in cortical feedback representations across odors
To determine whether cortical feedback is locally tuned or spatially distributed, we computed the degree of overlap in the odor responses of pairs of nearby and distant boutons monitored simultaneously. We first investigated the relationship between similarity of odor response spectra (correlation coefficient) and physical separation in the GCL boutons (Soucy et al., 2009). Pairwise analysis of simultaneously imaged boutons revealed low spontaneous correlations (Avg. similarity = 0.06 ± 0.0003, N=80,104 bouton pairs, Figure S7E), as well as rich local diversity in response across odors (Avg. similarity = 0.11 ± 0.001, N=117,352 pairs, Figure 4A, C). We observed a small excess of similarly responding boutons within 20 μm separation (Figure 4C, see Methods), which can be explained by local enrichment in boutons belonging to the same axon (Avg. distance between boutons anatomically identified on the same axon = 19.5 ± 1.6 μm). Beyond this small excess, no spatial order was apparent in bouton responses within the imaged field of view, implying that nearby boutons were as diverse in their responses as far apart ones (<150 μm, Figure 4C).
Figure 4. Cortical feedback representations are locally diverse.
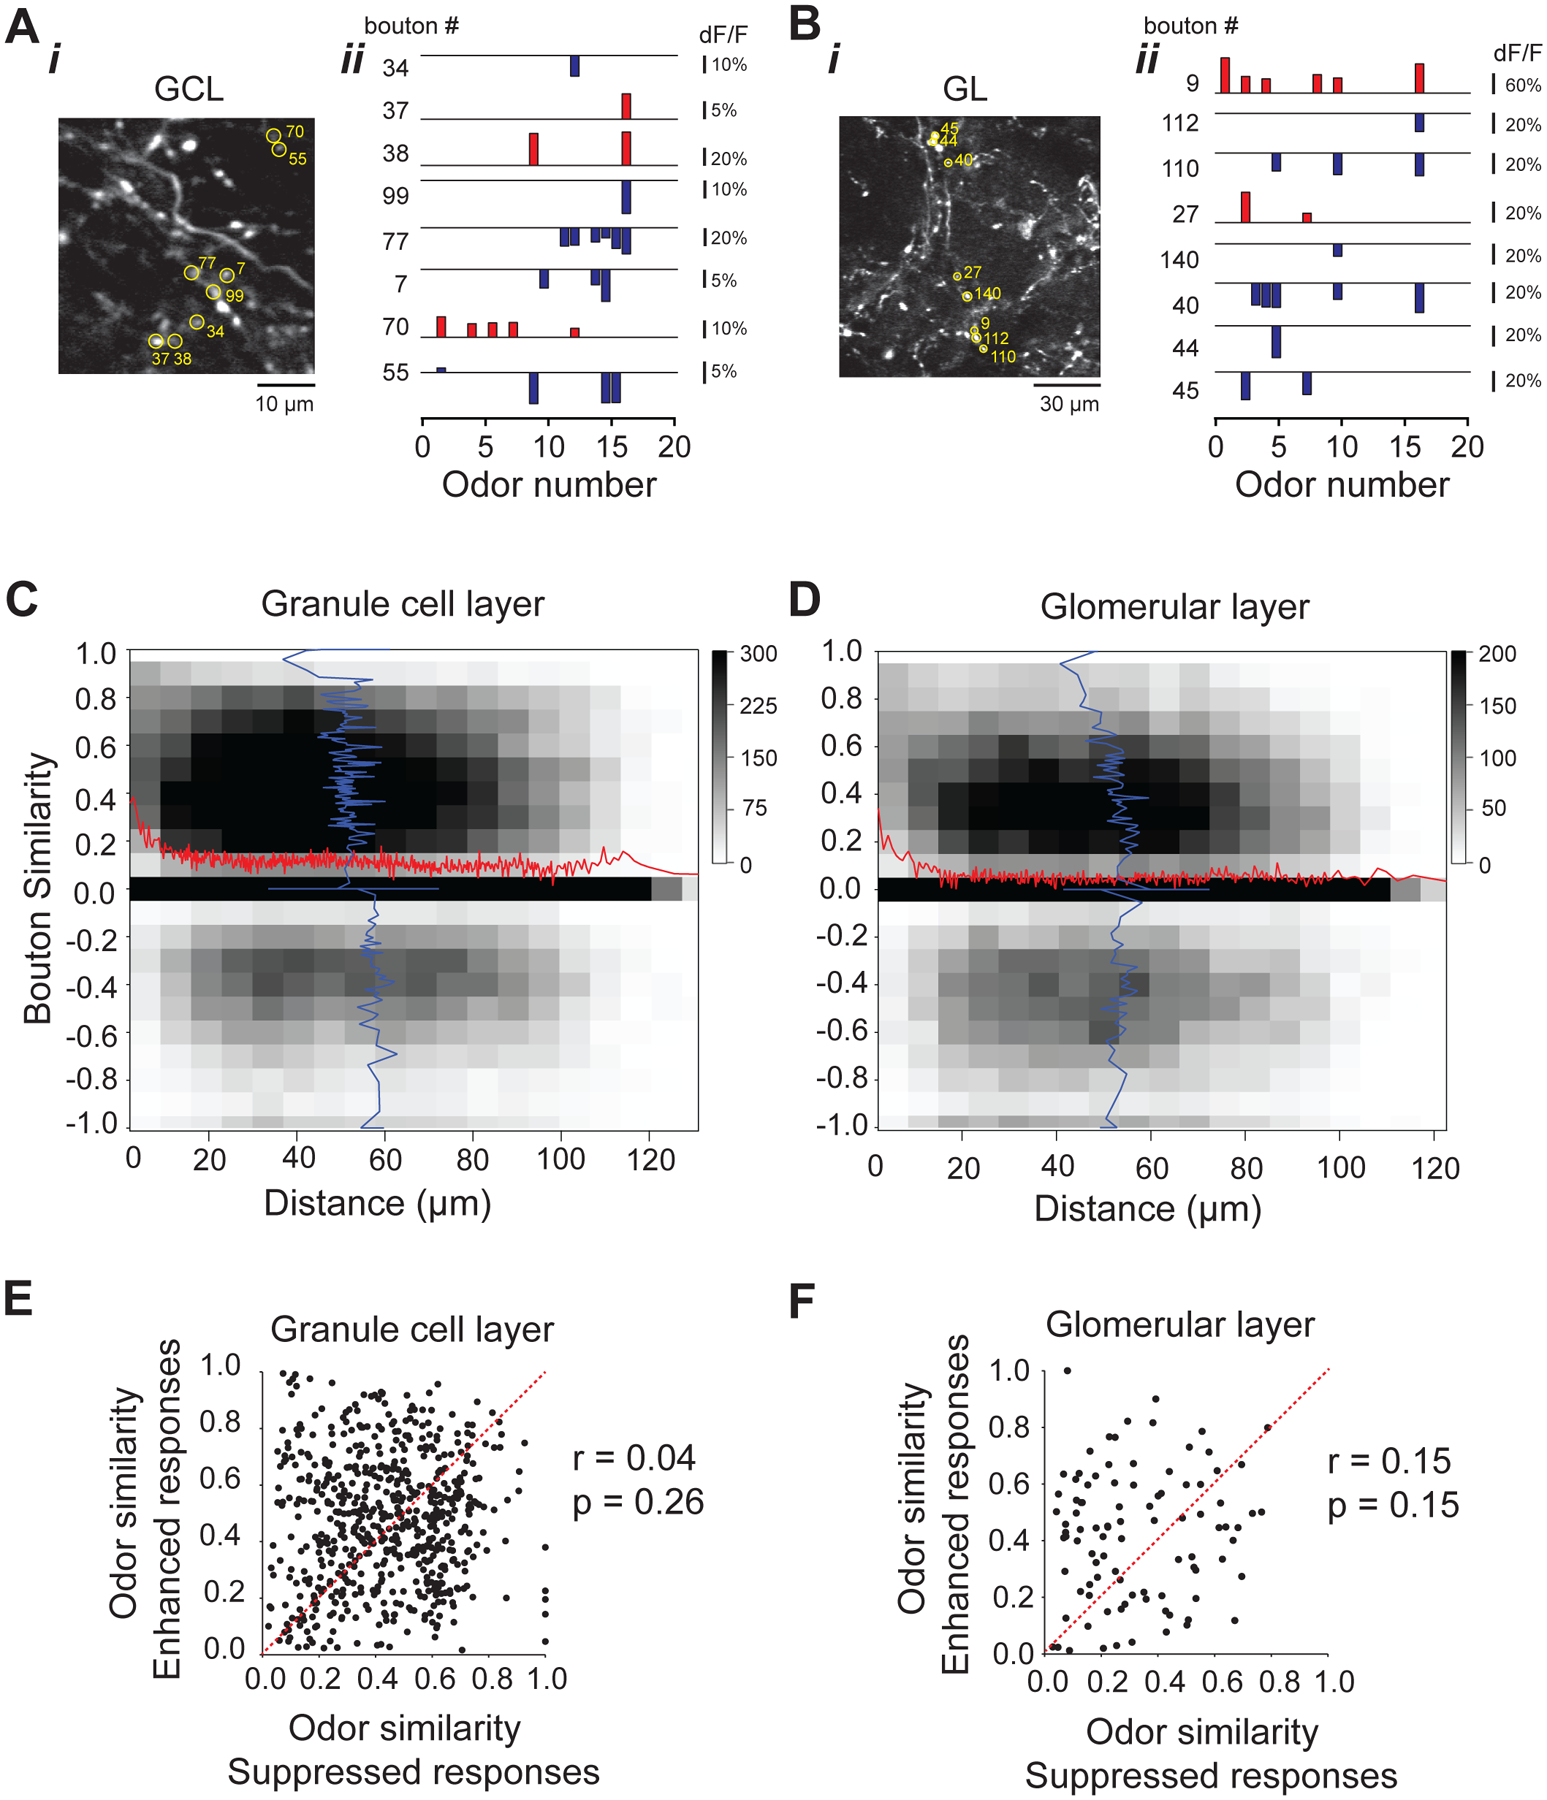
A, B. Left) Example fields of view ~250 μm (A) and ~80 μm (B) from OB surface of GCaMP5 labeled cortical feedback axons and boutons in an awake head-fixed mouse; (Center) Odor response spectra (ORS) of eight example boutons marked in the fluorescence image;
C, D. Two-dimensional histogram of pairwise correlations between ORS (Odor Set A, Table S1) of individual boutons in the granule cell layer (C) and glomerular layer (D) versus their physical separation. Red, average similarity (pairwise correlation) across different inter-bouton distances; Blue, average inter-bouton distance across all similarity values of bouton pairs; Gray scale, number of pairs per bin.
E, F. Odor similarity in terms of only enhanced versus only suppressed bouton responses in the granule cell (E) (r=0.04) and glomerular layers (F) (r=0.15); numbers indicate the Pearson’s linear correlation coefficient (r) and the associated p-values, calculated using a paired t-test.
Are corticalbulbar feedback responses in the superficial layer organized according to the modular architecture of glomeruli? Within an example field of view, we found that nearby boutons may have very different odor response tuning. Indeed, pairwise comparisons of spontaneous activity (~63,500 pairs, N=10 FOVs, 6 mice) and odor response spectra (~27,500 pairs, N=6 fields of view, 4 mice) of bouton pairs showed low correlation across boutons in close proximity of each other, as well as across different fields of view (<150 μm separation, Avg. Spontaneous Similarity = 0.04 ± 0.0003, Avg. Odor Similarity = 0.06 ± 0.001, Figure 4B, D, Figure S7F). Similar to the GCL, beyond a small excess of similar boutons within 20 μm separation, no obvious spatial organization was observed. Our results suggest that cortical feedback is distributed, locally heterogeneous, and matches the functional diversity observed for example in the responses of some of its potential GC targets (H.G. Chae and D.F. Albeanu unpublished data). These findings contrast previous spatial functionally tuned models of the OB (Johnson and Leon, 2007; Sallaz and Jourdan, 1993; Uchida et al., 2000; Willhite et al., 2006) and are consistent with recent reports of local diversity of glomerular inputs (Ma et al., 2012; Soucy et al., 2009).
We identified two distinct feedback bouton types, strikingly different in the polarity of their odor responses. We set to investigate whether they represent independent channels conveying information from the cortex to the sensory periphery, or are redundant in the nature of their odor representations. Within each field of view, for each odor, we assembled a response vector containing the response amplitudes (average dF/F) of all anatomically selected boutons (see Methods). We computed the pairwise odor similarity for stimuli within our panel in terms of overlap in their response vectors considering either enhanced responses, or suppressed responses only, respectively. If the average similarity value for an odor pair obtained using the enhanced responses only is predictive of the corresponding value calculated using suppressed responses, then plotting them against each other should result in a cloud of points distributed along a line, with the amplitude and diversity of residuals indicating deviations from this scenario. In both GCL and GL, we did not observe significant correlations between the two representations (for GCL, r=0.04 p=0.27, N=615 odor pairs; for GL, r=0.15, p=0.15, N=99 odor pairs, t-test, Figure 4E, F). We computed the mutual information between the similarity in odor representations given by enhanced and suppressed boutons (see Methods). We found no significant interdependence between the enhanced and suppressed odor representations in the GL (0.68 bits vs. 0.76±0.1 SD bits, shuffled control, p=0.9), and only small (but statistically significant compared to shuffled control) dependence in GCL (0.21 bits vs. 0.16±0.01 SD bits, p<0.01). Thus, the enhanced and suppressed boutons may represent two distinct piriform cortex output channels, which are relayed back to the sensory periphery.
Cortical feedback sparsens odor representations and decorrelates mitral, but not tufted cell responses
How does corticalbulbar feedback influence OB output? Our experiments indicate that odors enhance and suppress cortical feedback to the bulb. Hence, in principle, cortical feedback can either inhibit or disinhibit MT cells, via differential regulation of interneuron activity. Therefore, to directly determine the contribution of cortical feedback in shaping MT cell odor responses, we turned to loss-of-function manipulations via pharmacological suppression of activity in the APC. Cortical activity was suppressed by injection of the GABAA receptor agonist muscimol (fluorescent or non-fluorescent, see Methods) through chronically implanted cannulae into the APC (for fluorescent muscimol,~1mm A-P and ~0.5mm M-L, size bolus, N=3 mice, Figure S5A–C) resulting in complete silencing of bouton odor responses (Figure S5D–F).
We analyzed the effects of cortical silencing on the activity of mitral (MC) and tufted cells (TC) using multiphoton imaging of GCaMP3.0 signals. We used genetically engineered TBET-Cre mice crossed to a GCaMP3.0 reporter line (AI38, Allen Brain Institute, Zariwala et al., 2012) to ensure spatially homogeneous expression of the calcium sensor in MT cells (Haddad et al., 2013). Mitral cells were differentially identified from tufted cells by their denser packing, larger soma size and depth from surface (Figure 5A vs. 6A). We observed an increase in the amplitude of response, as well as in the number of odor-responding mitral cells (Figure 5A–E, Figure S8A, B, Supplementary movie 4), accompanied by a significant loss of odor selectivity upon muscimol injection (Avg. number of odor responses per cell = 8.37 ± 0.35 pre-muscimol vs. 13.92 ± 0.49 post-muscimol, N = 465 MCs, 6 hemibulbs, Wilcoxon sign rank test, p<0.001, Figure 5F). We verified that saline injections did not change mitral cell responses (Avg. number of odor responses per cell = 7.32 ± 0.41 pre-saline vs. 6.99 ± 0.35, post-saline N = 333 cells, 4 hemi-bulbs, Wilcoxon signed rank test, p = 0.12, Figure 5D, Figure S8D). A similar trend was observed in average lifetime sparseness quantifications (Figure 5G, Figure S8F).
Figure 5. Suppression of APC activity increases mitral cell responsiveness.
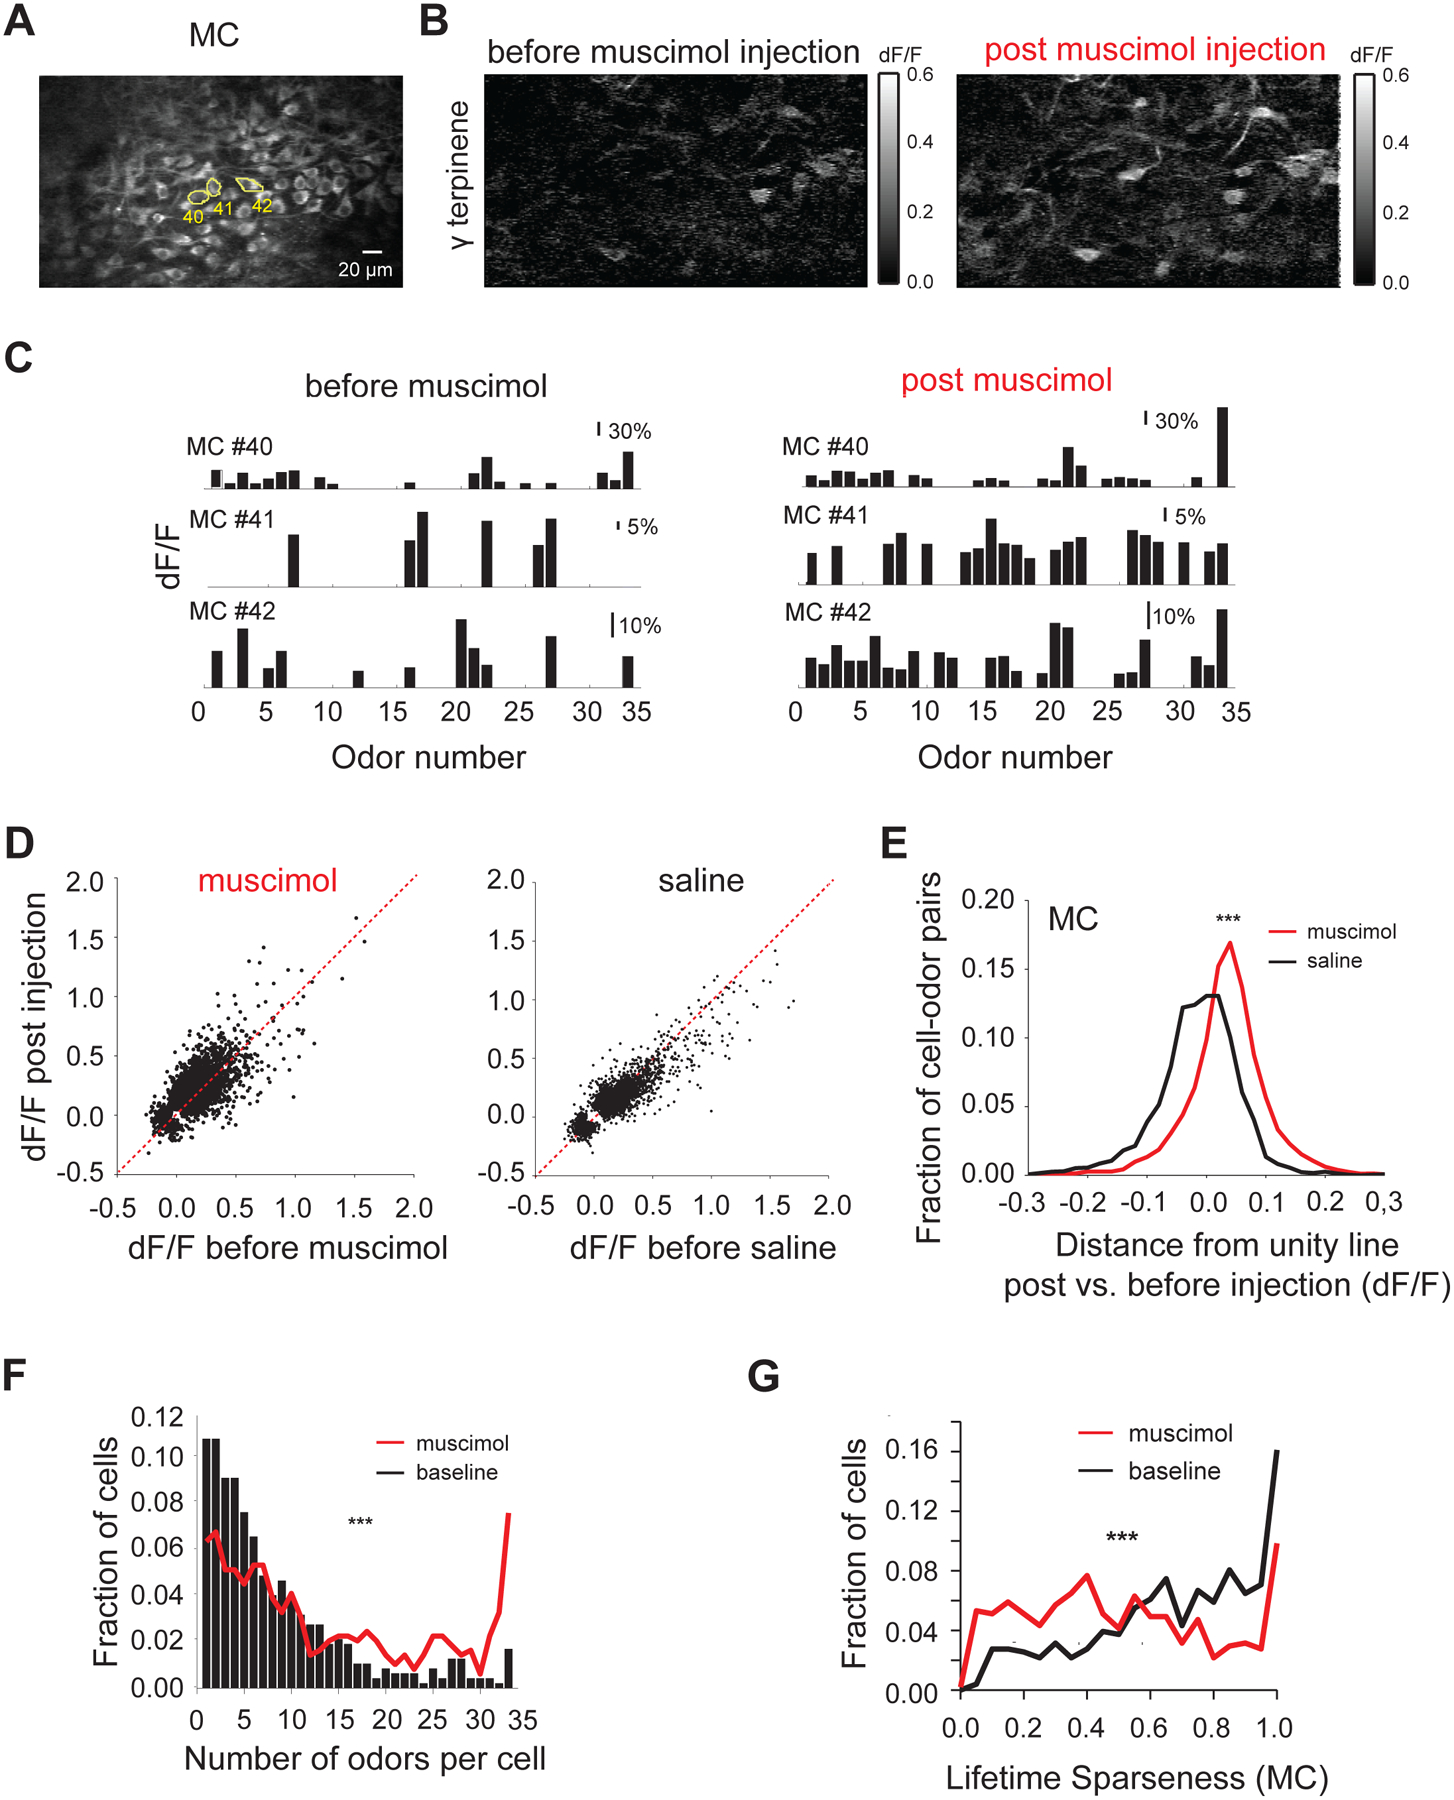
A. Average resting fluorescence of an example field of view in the mitral cell layer (~220 μm from surface);
B. Ratio image (dF/F) showing average fluorescence change in response to γ terpinene in the field of view shown in A. before (Left) and after (Right) muscimol injection;
C. Example ORS (Odor Set B, Table S1) of three mitral cell bodies outlined in A. before (Left) and after (Right) muscimol injection; each bar indicates the average response amplitude (dF/F) to a given odor in the panel;
D. Scatter plots showing the odor induced change in mitral cell body fluorescence (dF/F) before and after muscimol (Left) and respectively saline injection (Right); each dot indicates the response of a cell to a given odor (cell-odor pair) before versus after injection; only cell-odor pairs that were detected as significant in at least one of the two conditions are shown; gray line marks slope of 1;
E. Summary histogram showing change in odor evoked mitral cells responses upon muscimol (black) and saline (gray) injections compared to pre-injection baseline; the change for each mitral cell odor response (each dot in D) is quantified as the Euclidian distance from the diagonal unity line (gray line indicating slope of 1);
F. Histogram of the number of odors individual mitral cells responded to before (gray trace) and after (black trace) muscimol injection;
G. Histogram of lifetime sparseness values for individual mitral cells before (gray trace) and after (black trace) muscimol injection (Avg. lifetime sparseness = 0.68 ± 0.01 pre-muscimol vs. 0.50 ± 0.01 post-muscimol, N = 509 MCs, 6 hemibulbs, Wilcoxon sign rank test, p< 0.001); *** indicate significance level (p<0.001, Wilcoxon signed rank test);
Figure 6. Suppression of APC activity only mildly alters tufted cells responses.
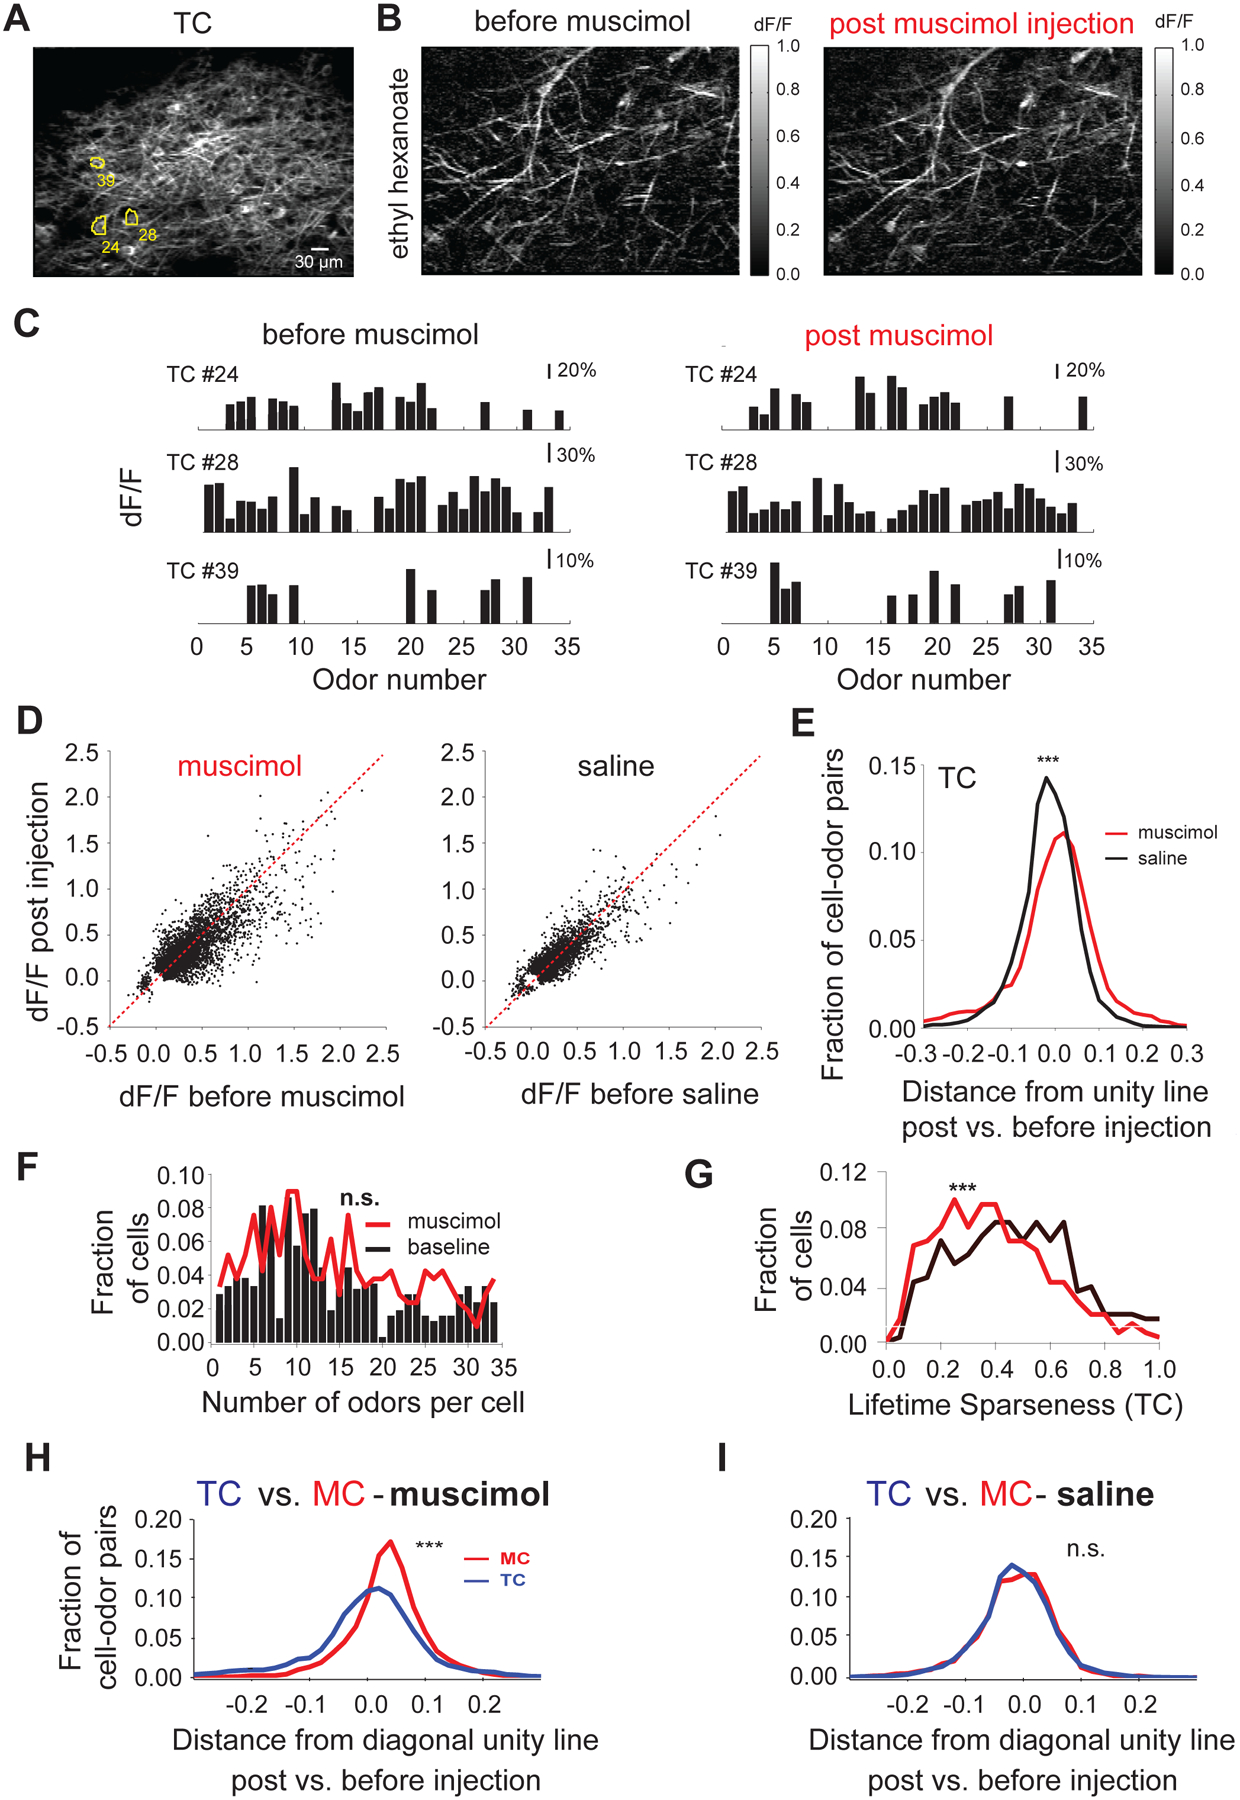
A. Average resting fluorescence of an example field of view containing tufted cell bodies and dendrites in the external plexiform layer (~140 μm from surface);
B. Ratio image (dF/F) showing average fluorescence change in response to ethyl hexanoate in the field of view shown in A. before (Left) and after (Right) muscimol injection;
C. Example ORS (Odor Set B, Table S1) of three tufted cell bodies outlined in E. before (Left) and after (Right) muscimol injection;
D. Scatter plots showing the odor induced change in tufted cell body fluorescence (dF/F) before and after muscimol (Left) and respectively saline injection (Right); each dot indicates the response of a given cell to a given odor (cell-odor pair) before versus after injection; only cell-odor pairs that were detected as significant in at least one of the two conditions are shown; gray line marks slope of 1;
E. Summary histogram showing change in odor evoked tufted cells responses upon muscimol (black) and saline (gray) injections compared to pre-injection baseline; the change for each mitral cell odor response (each dot in D) is quantified as the Euclidian distance from the diagonal (gray line indicating slope of 1);
F. Histogram of the number of odors individual tufted cells responded to before (gray trace) and after (black trace) muscimol injection); Odor Set B, Table S1; n.s. indicates significance level (p = 1, Wilcoxon signed rank test).
G. Histogram of lifetime sparseness values for individual tufted cells before (gray) and after (black) muscimol injection (Avg. lifetime sparseness = 0.47 ± 0.01 pre-muscimol vs. 0.39 ± 0.01 post-muscimol, N = 308 TCs, 5 hemibulbs, Wilcoxon sign rank test, p< 0.001); Odor Set B, Table S1; *** indicate significance level (p<0.001, Wilcoxon signed rank test);
H, I. Summary histograms showing change in odor evoked mitral cell (black) and tufted cell (gray) responses upon muscimol (Avg. distance for MCs = 0.034 ± 0.001, N=7,538 odor-cell pairs vs. Avg. distance for TCs = -0.006 ± 0.002, N=5,662 odor-cell pairs, Wilcoxon rank sum test, p<0.001, H) and saline (Avg. distance for MCs = −0.017 ± 0.001, N=4,719 odor-cell pairs vs. Avg. distance for TCs = −0.0157 ± 0.001, N=3,047 odor-cell pairs, Wilcoxon rank sum test, p=0.56, I) injections compared to pre-injection baseline; the change for each cell odor response (each dot in Figures 5D, 6D) is quantified as the Euclidian distance from the diagonal (dotted line indicating slope of 1); *** indicates significance level (p<0.001, Wilcoxon signed rank test); n.s. indicates p>0.05;
Consistent with previous reports (Nagayama et al., 2004), we found that tufted cells were more responsive than mitral cells for a given panel of odors, both in amplitude and number of odor responses per cell (Figure 6A–C). Suppression of APC activity had substantially milder effects on the amplitude and number of responsive TCs (Figure 6D,E). In comparison to the effect on MCs, muscimol injection did not significantly alter the number of odor responses for a given TC (Avg. number of odor responses per cell = 15.03 ± 0.49 pre-muscimol vs. 14.59 ± 0.51 post-muscimol, N = 309 cells, 5 hemibulbs, Wilcoxon signed rank test, p = 1, Figure 6F, Supplementary movie 5) and only mildly affected TC lifetime sparseness (Figure 6G). No obvious changes were observed in saline injected controls (Avg. number of odor responses per cell = 17.40 ± 0.52 pre-saline vs. 15.63 ± 0.51 post-saline, N=233 cells, 4 hemi-bulbs, Wilcoxon signed rank test, p = 1, Figure S8E,G).
To quantify the effect of APC silencing on mitral and tufted response amplitude, we calculated for each cell the Euclidean distance from the diagonal unity line when plotting its response ‘post’ versus ‘pre’ muscimol injection. Increase in response amplitude post-injection will result in values greater than zero (Figure 5E, 6E, see Methods). Silencing APC resulted in more robust potentiation of MC versus TC response amplitudes (Avg. distance for MCs = 0.034 ± 0.0008, N=7,528 odor-cell pairs vs. = −0.006 ± 0.002, N=5,662 odor-TC cell pairs, Wilcoxon rank sum test, p<0.001, Figure 5E, 6E,H,I). These differential effects between mitral and tufted cells were also reflected in a positive shift in a change index (CI, see Methods) calculated to quantify the modulation of response amplitude (Avg. CI for MCs = 0.26 ± 0.008, N=7,538 odor-cell pairs vs. 0.02 ± 0.004, N=5,662 odor-TC cell pairs, Wilcoxon rank sum test, p < 0.001).
We analyzed the effects of cortical suppression on the mitral and tufted cell population odor representations (Figure 7A). Muscimol injection significantly increased pairwise similarity (correlation) of odor response spectra (ORS) of simultaneously imaged mitral cells (calculated for signals averaged across repeats), compared to pre-muscimol baseline (Avg. MC Similarity = 0.18 ± 0.002, pre-muscimol vs. 0.49 ± 0.002, post-muscimol, N=27,391 mitral cell pairs, Wilcoxon signed rank test, p<0.001, Figure 7B, Figure S8C). Importantly, this increase in pairwise correlation was significantly higher than a shuffled control (Avg. Shuffled MC Similarity = 0.36 ± 0.002, Wilcoxon signed rank test, p = 0, see Methods, Figure S8H) and thus could not simply be explained by increases in the mitral cell odor response amplitude. No significant increase in MC pairwise similarity was observed in saline control experiments (Avg. MC Similarity = 0.17 ± 0.002, pre-saline vs. 0.15 ± 0.002, post-saline, N = 309 cells, 19,329 MC pairs, 4 hemibulbs, Wilcoxon signed rank test, p =1). In contrast, we did not observe any significant change in the pairwise cell ORS similarity across TCs post muscimol injection (Avg. TC Similarity = 0.46 ± 0.002, pre-muscimol vs. 0.46 ± 0.002, post-muscimol, N = 309 cells, 11,522 TC pairs, 5 hemibulbs, Wilcoxon signed rank test, p =0.25, Figure 7C, Figure S8J). Further, scaling down the ‘post-muscimol’ response magnitude by a constant factor (‘downscaled muscimol’) to match the ‘pre-muscimol’ mean response amplitude did not lead to significant correlation change when compared to the ‘post-muscimol’ condition for neither MCs nor TCs (Figure S8L,M).
Figure 7. Suppression of APC activity decorrelates mitral, but not tufted cells odor representations.
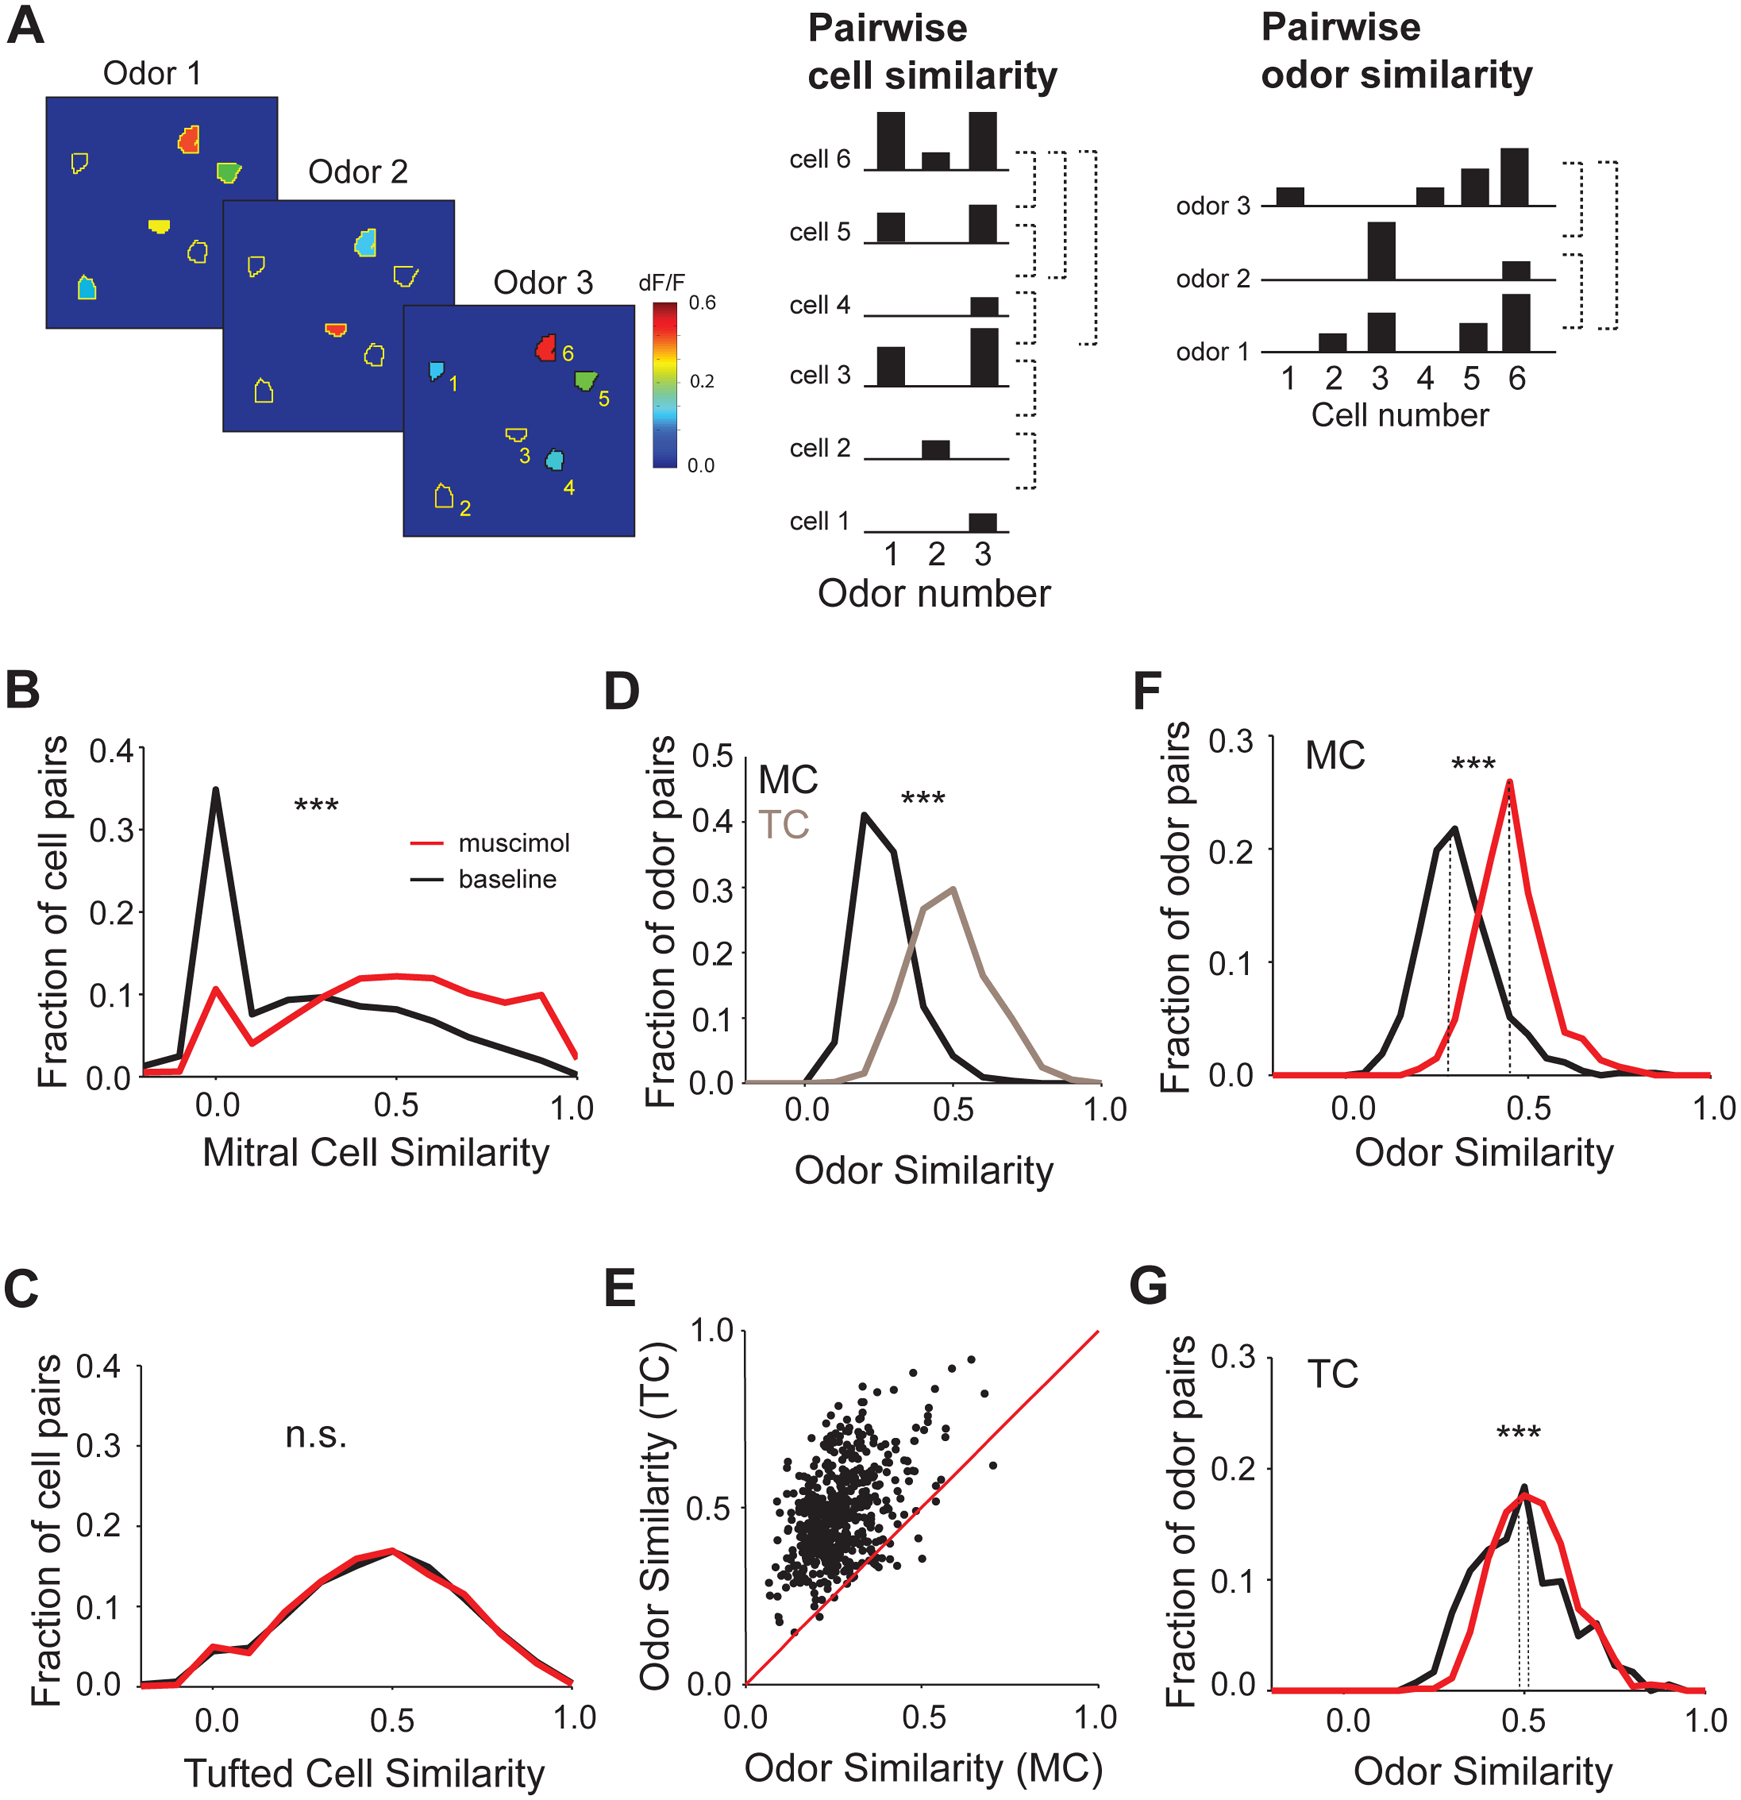
A. Schematic exemplifying pairwise cell similarity and odor similarity calculations for a given field of view; (Left) Cartoon showing responses of six identified ROIs (black outlines) within a given field of view across three odors; colors indicate the average response amplitude (dF/F) for each ROI; (Center) An ORS is calculated for each ROI (cell) as the vector containing the average dF/F for each odor; pairwise cell similarity is calculated as the uncentred correlation between the ORS vectors for each pair of cells (indicated by dotted lines); (Right) A cell response spectrum (CRS) is calculated for each odor as the vector containing the average dF/F for each cell upon presentation of the given odor; pairwise odor similarity is calculated as the uncentred correlation between the CRS vectors for each pair of odors; Odor Set B, Table S1 used for B-G;
B. Histogram of pairwise cell similarity of mitral cells before (gray, baseline) and after (black) muscimol injection; Odor Set B, Table S1;
C. Histogram of pairwise cell similarity of tufted cells before (gray, baseline) and after (black) muscimol injection; n.s. indicate significance level (p = 0.25, Wilcoxon signed rank test);
D. Histogram of pairwise odor similarity of mitral cells (black, MC) and tufted cells (gray, TC) before muscimol injection; E. Scatter plot of averaged pairwise odor similarity of mitral versus tufted cells before muscimol injection; each dot represents the comparison of average similarity scores for a given odor pair obtained from mitral and tufted cells odor representations across all sampled fields of view;
F. Histogram of pairwise odor similarity of mitral cells responses before (gray) and after (black) muscimol injection; dotted lines indicate the median;
G. Histogram of pairwise odor similarity of tufted cells responses before (gray) and after (black) muscimol injection; *** indicate significance level (p<0.001, Wilcoxon signed rank test); dotted lines indicate the median.
The higher odor sensitivity and denser responses in TCs suggest that neuronal representations would be harder to separate on the basis of odor identity when considering TC as opposed to MC population odor responses. Indeed, a pairwise odor correlation analysis (see Methods) indicated that TC odor representations (Figure 7A) are more similar across odor stimuli compared to corresponding MC representations (Avg. MC Odor Similarity = 0.26 ± 0.009 vs. 0.49 ± 0.005, N=528 odor pairs for TC, 10 hemibulbs for MC and 9 hemibulbs for TC, Wilcoxon rank sum test, p<0.001, see Methods, Figure 7D, E). In our experiments, more MCs than TCs were imaged simultaneously in a given field of view, which could account in principle for the lower odor similarity in the mitral cells population responses. However, pooling random subsets of cells per field of view, such as to obtain matching number of mitral and tufted cells for computing the odor similarity, reached the same conclusion as above (see Methods, Figure S8N). APC silencing resulted in a significant increase in odor similarity in the MC population representations (Avg. MC Odor Similarity = 0.29 ± 0.01 pre-muscimol vs. 0.45 ± 0.01 post-muscimol, N=528 odor pairs, 6 hemibulbs, Wilcoxon rank sum test, p<0.001, see Methods, Figure 7F, Figure S8I). In contrast, APC silencing had significantly milder effect on the TC odor representations (Avg. TC Odor Similarity = 0.49 ± 0.005 pre-muscimol vs. 0.53 ± 0.003 post-muscimol, N=528 odor pairs, 5 hemibulbs, Wilcoxon rank sum test, p<0.001, Figure 7G, Figure S8K). Interestingly, suppression of APC activity brought the odor similarity, as well as pairwise ORS similarity computed for MCs post-muscimol in the range of TC baseline (pre-muscimol) representations. No significant increase in odor similarity in the MC population responses was observed in saline control experiments (Avg. MC Odor Similarity = 0.20 ± 0.006, pre-saline vs. 0.20 ± 0.005, post-saline, N = 528 odor pairs, 4 hemibulbs, Wilcoxon signed rank test, p =0.99).
Taken together, our results show the existence of specific cortical feedback regulation of the odor representations of mitral versus tufted cells in awake mice. This form of top-down control differentially decorrelates mitral, but not tufted cell population responses, thus potentially enabling odor separation in subsequent olfactory areas.
Discussion
We characterized the dynamics of corticalbulbar feedback projections in awake head-fixed mice across different bulb layers using multiphoton microscopy. Our results indicate that cortical feedback is odor specific, sparse, layer selective and is routed via two distinct types of boutons which respond mostly with enhancement or suppression of baseline activity (Figures 1–3). Feedback representations were locally diverse and often long lasting (Figures 2,4). Suppression of these feedback signals via pharmacological silencing of the piriform cortex differentially modulated the OB output, resulting in decreased odor separation across populations of mitral cells, but not tufted cells (Figures 5–7).
Corticalbulbar feedback is routed through distinct channels of enhanced and suppressed boutons
Previous work in the APC has described spatially distributed and sparse odor responses (Miura et al., 2012; Poo and Isaacson, 2009; Stettler and Axel, 2009; Zhan and Luo, 2010). A study using intracellular recordings in APC of awake mice has reported equal distribution of sparse (responsive to 1 in 20 stimuli, ~50%) and broadly tuned (responding to half or more of sampled stimuli, ~50%) pyramidal cells. The broadly tuned cells were either predominantly excited (25%), or inhibited (25%) by odorants (Zhan and Luo, 2010). Our results show that responses of cortical boutons that project to the OB are largely sparse and odor selective (Figure 1), broadly tuned boutons representing only a small minority (Figure 1I, Figure S2G, H). Further, irrespective of their tuning (lifetime sparseness), individual boutons fall into distinct types of ‘enhanced’ and ‘suppressed’ boutons based on their response mode. The differences in broadness of tuning between our observations and APC recordings may reflect anatomical biases in corticalbulbar projection patterns. Functional specificity in feedback projections emerging from primary cortical areas has been reported in the visual and somatosensory systems (Glickfeld et al., 2013; Jarosiewicz et al., 2012; Sato and Svoboda, 2010; Vélez-Fort et al., 2014) and may represent a general feature across sensory modalities.
The functional dichotomy between enhanced and suppressed boutons segregated along axons and could not be explained by imaging artifacts, as indicated by electrical stimulation experiments (Figure S4A–C). Our finding is consistent with the existence of different populations of corticalbulbar projecting neurons that respond to odors mostly via enhancement, or mostly through suppression. The dichotomy may arise from recurrent excitatory-inhibitory interactions within the APC itself (Franks et al., 2011; Suzuki and Bekkers, 2011; Zhan and Luo, 2010), via presynaptic modulation of cortical feedback fibers in the OB, or both. These models necessitate specific targeting of individual pyramidal neurons/fibers by regulatory circuits and our approach does not distinguish between them. Screening genetically identified classes of APC pyramidal neurons using intersectional strategies (Fenno et al., 2014) in future studies will provide insight into the underlying substrates and the differential effects of these feedback inputs on their OB targets.
Top-down cortical input to the bulb via distinct channels of enhanced and suppressed boutons may be key to increasing the flexibility of feedback action. In one scenario, differential enhancement and suppression may allow feedback to gate specific subsets of OB interneurons and enhance discriminability of behaviorally relevant odors in a context specific manner.
Cortical feedback responses outlast odor stimuli and are locally diverse
We found that feedback responses, especially in the suppressed boutons, often lingered for seconds, long after the end of stimulus presentation (Figure 2, Figure S7). These lasting signals could not simply be explained by slow calcium (reporter) dynamics or motion artifacts, as they were accompanied in the same field of view and same trial by transient responses in neighboring boutons and were preceded in the same boutons by fast spontaneous events during baseline period (Figures 1E, 3B). Also, electrical stimulation experiments demonstrated fast GCaMP5 dynamics (FigureS5G,J,K). Persistent feedback responses have also been reported in other brain areas (Petreanu et al., 2012) and may constitute a short term memory trace that binds recently elicited activity patterns in the APC to ongoing sensory inputs in the OB.
Importantly, responses of corticalbulbar feedback boutons were locally diverse, lacking apparent spatial modular organization both in the glomerular and granule cell layers (Figure 4). This is consistent with recent reports documenting the non-chemotopic organization and functional diversity of the bulbar circuitry (Soucy et al., 2009). Locally heterogeneous feedback inputs together with the long lasting nature of the responses may allow individual bulbar neurons to integrate olfactory inputs both across a large space of neuronal representations, as well as in time, which are basic ingredients for reconstructing odor identity during active exploration.
Differential decorrelation of mitral but not tufted cell odor representations by cortical feedback
The OB output is relayed to downstream areas via mitral and tufted cells. These two populations differ in anatomical location, response properties and projection patterns (Fukunaga et al., 2012; Igarashi et al., 2012; Nagayama et al., 2004, 2010) and may perform different functions: aiding odor detection versus identification. Suppression of cortical activity had significantly different impact on mitral versus tufted cells (Figures 5–7). This may partly arise from the differences observed in cortical feedback responses across the superficial and deep bulb layers (Figure 3). In the absence of feedback, we observed an increase in the similarity of mitral cell odor responses across the population (Figure 7). In contrast, pairwise response similarity across tufted cells showed no significant change. As a consequence, mitral cell population representations of different odors became more similar, suggesting a substantial loss in odor separability for downstream decoder circuits in the absence of corticalbulbar feedback.
Tufted cells intrinsically show higher excitability (shorter latency and stronger response amplitudes), stronger feedforward evoked excitation (Burton and Urban, 2014) and similarity in the odor responses compared to mitral cells. Tufted cells project in high numbers to the AON and olfactory tubercle, and could also be differentially modulated by feedback originating from more anterior areas, such as the AON, and to lesser degree from the piriform cortex.
Our results suggest that, in addition to intrinsic biophysical and local connectivity differences between mitral and tufted cells, top-down cortical feedback is an essential ingredient for keeping these two OB output streams distinct from each other.
Decorrelation of ensemble neuronal responses in early sensory circuits has been proposed as a mechanism for separation of similar input patterns by downstream circuits (Laurent, 2002; Vinje and Gallant, 2000; Wiechert et al., 2010). The increased mitral cell correlations in the absence of cortical feedback could not be explained by an increase in mitral cell response amplitude (gain), as indicated by odor identity shuffling controls (Figure S8). Thus, the sparse and distributed cortical feedback does not simply downscale network activity in an unspecific manner, but helps redistribute activity across mitral cells and decorrelates their response patterns to aid odor separation. Our data is consistent with the view that cortical feedback acts specifically via interneurons in the OB, such as to sparsen odor representations at the level of MCs. Future experiments involving faster and reversible methods (Boyd et al., 2012; Dhawale et al., 2010; Markopoulos et al., 2012) of suppressing activity, locally applicable in the OB, will help understand how the decorrelation of mitral cell outputs evolves over time and how it impacts odor discrimination speed and accuracy in behaving animals.
Our experiments characterizing the functional properties and spatial-temporal organization of corticalbulbar projections are a starting point in understanding how top-down signals originating in the piriform cortex guide olfactory processing. Monitoring the dynamics of corticalbulbar feedback and the consequences of targeted suppression of feedback fibers in animals analyzing varying odor signals in rich olfactory environments will advance our understanding of cortical feedback function during behavior.
Methods
Experimental Procedures:
All animal procedures conformed to NIH guidelines and were approved by Cold Spring Harbor Laboratory Institutional Animal Care and Use Committee. Detailed methods are available as Supplementary material. To express GCaMP5 in corticalbulbar axons, adult mice were anesthetized with ketamine/xylazine and injected with a cocktail of AAV2.9 Synapsin-Cre and AAV2.9 EF1-DIO-GCaMP5 in the APC at least two weeks before imaging. To gain optical access to the OB, animals were anesthetized, the bone over the bulb was removed and replaced by a 3 mm coverslip (CS-3R, Warner Instruments). A titanium headbar was attached to the skull to fixate the animal during the imaging sessions. Mice were imaged using a Chameleon Ultra II Ti:Sapphire femtosecond pulsed laser (Coherent) coupled to a custom built multiphoton microscope.
Odor Delivery:
Odors were presented in 4 s pulses, preceded by 10 s baseline and followed by 12 s recovery periods. Inter-trial intervals (ITI) of at least 30 seconds were used between recording periods. During each ITI, a high air flow stream (>20 L/min) was pushed through the odor delivery machine to minimize odor contamination across trials. A serial air dilution odor machine was used to deliver odorized air (Odor Set A, Table S1) at 2.5 L/min rate at 0.4 % saturated vapor pressure (Figures 1D–J, 2A, B, D, 3 and 4). For experiments comparing bouton responses in awake vs. anesthetized mice, as well as monitoring the effects of muscimol, a subset of 5 odors was used (acetal, hexanal, ethyl tiglate, ethyl caproate and isoamyl acetate). A second, oil dilution based odor machine (1L/min rate, Dhawale et al., 2010) was used for experiments involving larger odor sets (1:100 mineral oil dilution, Odor Set B, Table S1, for mitral and tufted cell imaging experiments, Figures 5–7), and for probing concentrations (Concentration, Table S1, 1:104 to 1:10 nominal oil dilutions). Odor output was characterized using a photo-ionization device (Aurora Scientific) and calibrated in terms of concentration in air (Figure S6A). Odors in the panel were chemically diverse and activated glomeruli on the dorsal OB surface.
Data analysis
Image registration:
images were registered using either the ImageJ plugin TurboReg (Turboreg), or via a previously described method (Guizar-Sicairos et al., 2008). The average registered image for each individual odor presentation was visually inspected to detect slow drifts in the z-plane. Such instances were further discarded. ROIs were manually drawn for individual boutons (0.9–3 μm diameter) in ImageJ. For mitral and tufted cells imaging sessions, ROIs were manually selected based on anatomy (baseline average fluorescence). Care was taken to avoid selecting ROIs on cell bodies overlapping with neuropil (M/T lateral dendrites). To detect fast z–movement on individual frames, we compared the shapes of each ROI in each frame with their corresponding averaged frames. Frames were a majority of ROIs changed shape were discarded from the analysis.
Spontaneous activity, assignment of boutons and signal detection:
To detect spontaneous events, we estimated the distribution of resting fluorescence from the lower half of fluorescence values in the data. A fluorescence increase was called a spontaneous event if it exceeded the 99th percentile of the resting fluorescence. An ROI was considered spontaneously active if it showed at least two spontaneous events during a 3 minute window. To determine whether two boutons belonged to the same axon, we used visually inspected whether they appeared connected by an axonal segment in the imaged plane (337 ‘same axon’ pairs, 52 axonal segments and 648 ‘different axon’ bouton pairs).
For each ROI and each odor presentation, the fluorescence signal across time was converted into dF/F values.
where, dF/Ft is the baseline subtracted, normalized fluorescence at time t; Ft is the instantaneous fluorescence at time t; and, Fo is the median fluorescence value during the initial air period.
Upon odor presentation, axonal boutons, mitral and tufted cells responded by increasing, and decreasing their fluorescence. ROI response to an odor presentation was quantified as the average dF/F over 4 seconds of odor presentation. To determine significance, we compared the odor evoked normalized fluorescence with values calculated during Air preceding all odor presentations in the session. Responses that exceeded the 99.9 percentile were called significantly enhanced. Responses that were below the 0.1 percentile were considered significantly suppressed. An ROI that showed significant responses to an odor in at least two repeats was considered responsive to that odor.
Concentration invariance:
significance of each ROI for each odor response at each concentration was assessed independently. An ROI was classified as concentration invariant only if it cleared significance at all four concentrations used and the magnitude of responses did not differ across concentrations. To establish whether an ROI showed monotonically increasing or decreasing responses to a given odor across concentrations, its concentration response curve (described above) was fitted with a line and its slope was compared to the distribution of slopes obtained by shuffling the concentration labels. An odor response curve was called monotonically increasing (decreasing) if the slope was larger (smaller) than the 95% (5%) percentile of the slopes of the shuffled distributions.
The Odor Response Spectrum (ORS) for a given ROI was described as the vector of length equally to number of odors used, containing the average responses across trials to each odor. Non-significant odors responses were set to 0. Similarity between the ORS of two ROIs, ORSi and ORSj, was defined as the un-centered correlation coefficient (equivalent to cosine of the angle) between the two vectors:
Similarly, we defined the population response (Cell Response Spectrum, CRS) to an odor for a given field of view (FOV) as the vector of responses of all ROIs in the FOV responsive to that odor. ROIs with non-significant responses were set to zero. Odor similarity between two population responses was also defined as the un-centered correlation coefficient between the population response vectors.
Distance from diagonal unity line before versus after muscimol or saline injection and a change index (CI) were calculated only for cells that showed a significant response before or after injection. Distance from diagonal unity line was defined as shortest distance (normal) to the identity diagonal line in the scatter plot of odor responses before and after injection. Absolute value of change index (CIabs) was defined as:
Sign of distance from diagonal line and CI was positive if:
and negative if:
Most mitral and tufted cell GCaMP3 odor responses (>90%) were positive. Hence, the use of absolute values did not affect our conclusions.
Supplementary Material
Acknowledgements:
We would like to thank P. Gupta for valuable input on manuscript preparation, A. Dăbȃcan, A. Banerjee and members of the Albeanu laboratory for comments on the manuscript. This study was supported by a Pew Scholarship, Whitehall Fellowship and CSHL startup funds. In memoriam Mihai Pătraşcu.
References
- Akerboom J, Chen T-W, Wardill TJ, Tian L, Marvin JS, Mutlu S, Calderón NC, Esposti F, Borghuis BG, Sun XR, et al. (2012). Optimization of a GCaMP Calcium Indicator for Neural Activity Imaging. J. Neurosci. Off. J. Soc. Neurosci 32, 13819–13840. [DOI] [PMC free article] [PubMed] [Google Scholar]
- Babadi B, and Sompolinsky H (2014). Sparseness and expansion in sensory representations. Neuron 83, 1213–1226. [DOI] [PubMed] [Google Scholar]
- Balu R, Pressler RT, and Strowbridge BW (2007). Multiple modes of synaptic excitation of olfactory bulb granule cells. J. Neurosci. Off. J. Soc. Neurosci 27, 5621–5632. [DOI] [PMC free article] [PubMed] [Google Scholar]
- Barak O, Rigotti M, and Fusi S (2013). The sparseness of mixed selectivity neurons controls the generalization-discrimination trade-off. J. Neurosci. Off. J. Soc. Neurosci 33, 3844–3856. [DOI] [PMC free article] [PubMed] [Google Scholar]
- Boyd AM, Sturgill JF, Poo C, and Isaacson JS (2012). Cortical feedback control of olfactory bulb circuits. Neuron 76, 1161–1174. [DOI] [PMC free article] [PubMed] [Google Scholar]
- Burton SD, and Urban NN (2014). Greater excitability and firing irregularity of tufted cells underlies distinct afferent-evoked activity of olfactory bulb mitral and tufted cells. J. Physiol 592, 2097–2118. [DOI] [PMC free article] [PubMed] [Google Scholar]
- Caron SJC, Ruta V, Abbott LF, and Axel R (2013). Random convergence of olfactory inputs in the Drosophila mushroom body. Nature 497, 113–117. [DOI] [PMC free article] [PubMed] [Google Scholar]
- Devore S, and Linster C (2012). Noradrenergic and cholinergic modulation of olfactory bulb sensory processing. Front. Behav. Neurosci 6, 52. [DOI] [PMC free article] [PubMed] [Google Scholar]
- Dhawale AK, Hagiwara A, Bhalla US, Murthy VN, and Albeanu DF (2010). Non-redundant odor coding by sister mitral cells revealed by light addressable glomeruli in the mouse. Nat Neurosci 13, 1404–1412. [DOI] [PMC free article] [PubMed] [Google Scholar]
- Fenno LE, Mattis J, Ramakrishnan C, Hyun M, Lee SY, He M, Tucciarone J, Selimbeyoglu A, Berndt A, Grosenick L, et al. (2014). Targeting cells with single vectors using multiple-feature Boolean logic. Nat. Methods 11, 763–772. [DOI] [PMC free article] [PubMed] [Google Scholar]
- Franks KM, Russo MJ, Sosulski DL, Mulligan AA, Siegelbaum SA, and Axel R (2011). Recurrent circuitry dynamically shapes the activation of piriform cortex. Neuron 72, 49–56. [DOI] [PMC free article] [PubMed] [Google Scholar]
- Fukunaga I, Berning M, Kollo M, Schmaltz A, and Schaefer AT (2012). Two distinct channels of olfactory bulb output. Neuron 75, 320–329. [DOI] [PubMed] [Google Scholar]
- Ghosh S, Larson SD, Hefzi H, Marnoy Z, Cutforth T, Dokka K, and Baldwin KK (2011). Sensory maps in the olfactory cortex defined by long-range viral tracing of single neurons. Nature 472, 217–220. [DOI] [PubMed] [Google Scholar]
- Gilbert CD, and Li W (2013). Top-down influences on visual processing. Nat. Rev. Neurosci 14, 350–363. [DOI] [PMC free article] [PubMed] [Google Scholar]
- Glickfeld LL, Andermann ML, Bonin V, and Reid RC (2013). Cortico-cortical projections in mouse visual cortex are functionally target specific. Nat. Neurosci 16, 219–226. [DOI] [PMC free article] [PubMed] [Google Scholar]
- Gottfried JA (2010). Central mechanisms of odour object perception. Nat. Rev. Neurosci 11, 628–641. [DOI] [PMC free article] [PubMed] [Google Scholar]
- Gray CM, and Skinner JE (1988). Centrifugal regulation of neuronal activity in the olfactory bulb of the waking rabbit as revealed by reversible cryogenic blockade. Exp. Brain Res 69, 378–386. [DOI] [PubMed] [Google Scholar]
- Guizar-Sicairos M, Thurman ST, and Fienup JR (2008). Efficient subpixel image registration algorithms. Opt. Lett 33, 156–158. [DOI] [PubMed] [Google Scholar]
- Haberly LB (2001). Parallel-distributed processing in olfactory cortex: new insights from morphological and physiological analysis of neuronal circuitry. Chem. Senses 26, 551–576. [DOI] [PubMed] [Google Scholar]
- Haberly LB, and Bower JM (1989). Olfactory cortex: model circuit for study of associative memory? Trends Neurosci. 12, 258–264. [DOI] [PubMed] [Google Scholar]
- Haddad R, Lanjuin A, Madisen L, Zeng H, Murthy VN, and Uchida N (2013). Olfactory cortical neurons read out a relative time code in the olfactory bulb. Nat. Neurosci 16, 949–957. [DOI] [PMC free article] [PubMed] [Google Scholar]
- Harris KD, and Mrsic-Flogel TD (2013). Cortical connectivity and sensory coding. Nature 503, 51–58. [DOI] [PubMed] [Google Scholar]
- Igarashi KM, Ieki N, An M, Yamaguchi Y, Nagayama S, Kobayakawa K, Kobayakawa R, Tanifuji M, Sakano H, Chen WR, et al. (2012). Parallel mitral and tufted cell pathways route distinct odor information to different targets in the olfactory cortex. J. Neurosci. Off. J. Soc. Neurosci 32, 7970–7985. [DOI] [PMC free article] [PubMed] [Google Scholar]
- Jarosiewicz B, Schummers J, Malik WQ, Brown EN, and Sur M (2012). Functional biases in visual cortex neurons with identified projections to higher cortical targets. Curr. Biol. CB 22, 269–277. [DOI] [PMC free article] [PubMed] [Google Scholar]
- Johnson BA, and Leon M (2007). Chemotopic odorant coding in a mammalian olfactory system. J. Comp. Neurol 503, 1–34. [DOI] [PMC free article] [PubMed] [Google Scholar]
- Kaplan BA, and Lansner A (2014). A spiking neural network model of self-organized pattern recognition in the early mammalian olfactory system. Front. Neural Circuits 8, 5. [DOI] [PMC free article] [PubMed] [Google Scholar]
- Laurent G (2002). Olfactory network dynamics and the coding of multidimensional signals. Nat. Rev. Neurosci 3, 884–895. [DOI] [PubMed] [Google Scholar]
- Linster C, and Hasselmo ME (2001). Neuromodulation and the functional dynamics of piriform cortex. Chem. Senses 26, 585–594. [DOI] [PubMed] [Google Scholar]
- Ma L, Qiu Q, Gradwohl S, Scott A, Yu EQ, Alexander R, Wiegraebe W, and Yu CR (2012). Distributed representation of chemical features and tunotopic organization of glomeruli in the mouse olfactory bulb. Proc. Natl. Acad. Sci. U. S. A 109, 5481–5486. [DOI] [PMC free article] [PubMed] [Google Scholar]
- Manabe H, and Mori K (2013). Sniff rhythm-paced fast and slow gamma-oscillations in the olfactory bulb: relation to tufted and mitral cells and behavioral states. J. Neurophysiol 110, 1593–1599. [DOI] [PubMed] [Google Scholar]
- Margrie TW, Sakmann B, and Urban NN (2001). Action potential propagation in mitral cell lateral dendrites is decremental and controls recurrent and lateral inhibition in the mammalian olfactory bulb. Proc. Natl. Acad. Sci. U. S. A 98, 319–324. [DOI] [PMC free article] [PubMed] [Google Scholar]
- Markopoulos F, Rokni D, Gire DH, and Murthy VN (2012). Functional properties of cortical feedback projections to the olfactory bulb. Neuron 76, 1175–1188. [DOI] [PMC free article] [PubMed] [Google Scholar]
- Matsutani S (2010). Trajectory and terminal distribution of single centrifugal axons from olfactory cortical areas in the rat olfactory bulb. Neuroscience 169, 436–448. [DOI] [PubMed] [Google Scholar]
- McCollum J, Larson J, Otto T, Schottler F, Granger R, and Lynch G (1991). Short-latency single unit processing in olfactory cortex. J. Cogn. Neurosci 3, 293–299. [DOI] [PubMed] [Google Scholar]
- Miura K, Mainen ZF, and Uchida N (2012). Odor representations in olfactory cortex: distributed rate coding and decorrelated population activity. Neuron 74, 1087–1098. [DOI] [PMC free article] [PubMed] [Google Scholar]
- Miyamichi K, Amat F, Moussavi F, Wang C, Wickersham I, Wall NR, Taniguchi H, Tasic B, Huang ZJ, He Z, et al. (2011). Cortical representations of olfactory input by trans-synaptic tracing. Nature 472, 191–196. [DOI] [PMC free article] [PubMed] [Google Scholar]
- Nagayama S, Takahashi YK, Yoshihara Y, and Mori K (2004). Mitral and tufted cells differ in the decoding manner of odor maps in the rat olfactory bulb. J. Neurophysiol 91, 2532–2540. [DOI] [PubMed] [Google Scholar]
- Nagayama S, Enerva A, Fletcher ML, Masurkar AV, Igarashi KM, Mori K, and Chen WR (2010). Differential axonal projection of mitral and tufted cells in the mouse main olfactory system. Front. Neural Circuits 4. [DOI] [PMC free article] [PubMed] [Google Scholar]
- Nakashima M, Mori K, and Takagi SF (1978). Centrifugal influence on olfactory bulb activity in the rabbit. Brain Res. 154, 301–306. [DOI] [PubMed] [Google Scholar]
- Nunez-Parra A, Maurer RK, Krahe K, Smith RS, and Araneda RC (2013). Disruption of centrifugal inhibition to olfactory bulb granule cells impairs olfactory discrimination. Proc. Natl. Acad. Sci. U. S. A 110, 14777–14782. [DOI] [PMC free article] [PubMed] [Google Scholar]
- Oswald A-M, and Urban NN (2012). There and back again: the corticobulbar loop. Neuron 76, 1045–1047. [DOI] [PubMed] [Google Scholar]
- Otazu GH, and Leibold C (2011). A Corticothalamic Circuit Model for Sound Identification in Complex Scenes. PLoS ONE 6, e24270. [DOI] [PMC free article] [PubMed] [Google Scholar]
- Petreanu L, Gutnisky DA, Huber D, Xu N, O’Connor DH, Tian L, Looger L, and Svoboda K (2012). Activity in motor-sensory projections reveals distributed coding in somatosensation. Nature 489, 299–303. [DOI] [PMC free article] [PubMed] [Google Scholar]
- Petzold GC, Hagiwara A, and Murthy VN (2009). Serotonergic modulation of odor input to the mammalian olfactory bulb. Nat. Neurosci 12, 784–791. [DOI] [PubMed] [Google Scholar]
- Poo C, and Isaacson JS (2009). Odor representations in olfactory cortex: “sparse” coding, global inhibition, and oscillations. Neuron 62, 850–861. [DOI] [PMC free article] [PubMed] [Google Scholar]
- Ranade SP, and Mainen ZF (2009). Transient firing of dorsal raphe neurons encodes diverse and specific sensory, motor, and reward events. J. Neurophysiol 102, 3026–3037. [DOI] [PubMed] [Google Scholar]
- Rao RP, and Ballard DH (1999). Predictive coding in the visual cortex: a functional interpretation of some extra-classical receptive-field effects. Nat. Neurosci 2, 79–87. [DOI] [PubMed] [Google Scholar]
- Rothermel M, and Wachowiak M (2014). Functional imaging of cortical feedback projections to the olfactory bulb. Front. Neural Circuits 8, 73. [DOI] [PMC free article] [PubMed] [Google Scholar]
- Sallaz M, and Jourdan F (1993). C-fos expression and 2-deoxyglucose uptake in the olfactory bulb of odour-stimulated awake rats. Neuroreport 4, 55–58. [DOI] [PubMed] [Google Scholar]
- Sato TR, and Svoboda K (2010). The functional properties of barrel cortex neurons projecting to the primary motor cortex. J. Neurosci. Off. J. Soc. Neurosci 30, 4256–4260. [DOI] [PMC free article] [PubMed] [Google Scholar]
- Shepherd GM (1972). Synaptic organization of the mammalian olfactory bulb. Physiol. Rev 52, 864–917. [DOI] [PubMed] [Google Scholar]
- Shipley MT, and Adamek GD (1984). The connections of the mouse olfactory bulb: a study using orthograde and retrograde transport of wheat germ agglutinin conjugated to horseradish peroxidase. Brain Res. Bull 12, 669–688. [DOI] [PubMed] [Google Scholar]
- Sosulski DL, Bloom ML, Cutforth T, Axel R, and Datta SR (2011). Distinct representations of olfactory information in different cortical centres. Nature 472, 213–216. [DOI] [PMC free article] [PubMed] [Google Scholar]
- Soucy ER, Albeanu DF, Fantana AL, Murthy VN, and Meister M (2009). Precision and diversity in an odor map on the olfactory bulb. Nat Neurosci 12, 210–220. [DOI] [PubMed] [Google Scholar]
- Stettler DD, and Axel R (2009). Representations of odor in the piriform cortex. Neuron 63, 854–864. [DOI] [PubMed] [Google Scholar]
- Suzuki N, and Bekkers JM (2011). Two layers of synaptic processing by principal neurons in piriform cortex. J. Neurosci. Off. J. Soc. Neurosci 31, 2156–2166. [DOI] [PMC free article] [PubMed] [Google Scholar]
- Taniguchi H, He M, Wu P, Kim S, Paik R, Sugino K, Kvitsiani D, Kvitsani D, Fu Y, Lu J, et al. (2011). A resource of Cre driver lines for genetic targeting of GABAergic neurons in cerebral cortex. Neuron 71, 995–1013. [DOI] [PMC free article] [PubMed] [Google Scholar]
- Tian L, Hires SA, Mao T, Huber D, Chiappe ME, Chalasani SH, Petreanu L, Akerboom J, McKinney SA, Schreiter ER, et al. (2009). Imaging neural activity in worms, flies and mice with improved GCaMP calcium indicators. Nat Meth 6, 875–881. [DOI] [PMC free article] [PubMed] [Google Scholar]
- Tobin VA, Hashimoto H, Wacker DW, Takayanagi Y, Langnaese K, Caquineau C, Noack J, Landgraf R, Onaka T, Leng G, et al. (2010). An intrinsic vasopressin system in the olfactory bulb is involved in social recognition. Nature 464, 413–417. [DOI] [PMC free article] [PubMed] [Google Scholar]
- Uchida N, Takahashi YK, Tanifuji M, and Mori K (2000). Odor maps in the mammalian olfactory bulb: domain organization and odorant structural features. Nat. Neurosci 3, 1035–1043. [DOI] [PubMed] [Google Scholar]
- Urban NN, and Sakmann B (2002). Reciprocal intraglomerular excitation and intra- and interglomerular lateral inhibition between mouse olfactory bulb mitral cells. J. Physiol 542, 355–367. [DOI] [PMC free article] [PubMed] [Google Scholar]
- Vélez-Fort M, Rousseau CV, Niedworok CJ, Wickersham IR, Rancz EA, Brown APY, Strom M, and Margrie TW (2014). The stimulus selectivity and connectivity of layer six principal cells reveals cortical microcircuits underlying visual processing. Neuron 83, 1431–1443. [DOI] [PMC free article] [PubMed] [Google Scholar]
- Vickers NJ (2000). Mechanisms of animal navigation in odor plumes. Biol. Bull 198, 203–212. [DOI] [PubMed] [Google Scholar]
- Vinje WE, and Gallant JL (2000). Sparse coding and decorrelation in primary visual cortex during natural vision. Science 287, 1273–1276. [DOI] [PubMed] [Google Scholar]
- Wachowiak M, Wesson DW, Pírez N, Verhagen JV, and Carey RM (2009). Low-level mechanisms for processing odor information in the behaving animal. Ann. N. Y. Acad. Sci 1170, 286–292. [DOI] [PubMed] [Google Scholar]
- Wiechert MT, Judkewitz B, Riecke H, and Friedrich RW (2010). Mechanisms of pattern decorrelation by recurrent neuronal circuits. Nat. Neurosci 13, 1003–1010. [DOI] [PubMed] [Google Scholar]
- Willhite DC, Nguyen KT, Masurkar AV, Greer CA, Shepherd GM, and Chen WR (2006). Viral tracing identifies distributed columnar organization in the olfactory bulb. Proc. Natl. Acad. Sci. U. S. A 103, 12592–12597. [DOI] [PMC free article] [PubMed] [Google Scholar]
- Wilson DA, and Sullivan RM (2011). Cortical processing of odor objects. Neuron 72, 506–519. [DOI] [PMC free article] [PubMed] [Google Scholar]
- Wilson RI, and Mainen ZF (2006). Early events in olfactory processing. Annu. Rev. Neurosci 29, 163–201. [DOI] [PubMed] [Google Scholar]
- Wilson DA, Fletcher ML, and Sullivan RM (2004). Acetylcholine and olfactory perceptual learning. Learn. Mem. Cold Spring Harb. N 11, 28–34. [DOI] [PMC free article] [PubMed] [Google Scholar]
- Zariwala HA, Borghuis BG, Hoogland TM, Madisen L, Tian L, De Zeeuw CI, Zeng H, Looger LL, Svoboda K, and Chen T-W (2012). A Cre-dependent GCaMP3 reporter mouse for neuronal imaging in vivo. J. Neurosci. Off. J. Soc. Neurosci 32, 3131–3141. [DOI] [PMC free article] [PubMed] [Google Scholar]
- Zhan C, and Luo M (2010). Diverse patterns of odor representation by neurons in the anterior piriform cortex of awake mice. J. Neurosci. Off. J. Soc. Neurosci 30, 16662–16672. [DOI] [PMC free article] [PubMed] [Google Scholar]
Associated Data
This section collects any data citations, data availability statements, or supplementary materials included in this article.