

The multi-step evolution of monoclonal gammopathies provides that a small clonal population of long-lived bone marrow (BM) plasma cells (PCs) arises with pre-malignant features (monoclonal gammopathy of undetermined significance - MGUS), expands its burden becoming an indolent cancer (smoldering multiple myeloma - SMM), and finally develops into an overt clinical form requiring treatment (multiple myeloma - MM). Based on long-term follow-up studies, MGUS progresses at a constant and low rate of 1%/year. The risk of transforming from SMM to MM is more heterogeneous.1 Several risk factors have been identified to predict SMM progression at diagnosis, and scorers have been proposed to identify high-risk patients with >50% risk at 2 years.2-4 These would be patients misclassified as SMM while actually carrying active MM, just not recognized based on current diagnostic criteria. Furthermore, these studies focus on population averages and do not account for the variability of individual patients’ trajectories, nor for a change in their risk over years of observation. For example, a recent prospective sampling study highlighted how changes in the dynamics of monoclonal proteins or free serum light chains in MGUS can identify patients converting from low- to high-risk categories years before MM diagnosis.5 Similarly, in SMM a change in hemoglobin and/or monoclonal protein amount predicted increased risk of progression to active myeloma even in patients who were diagnosed as low risk.6 This highlights the need for better diagnostic stratification, and improved serial follow-up, to identify high-risk patients that may benefit from intensive follow-up or early treatment.7,8 Complementing the clinical observations described above, recent genome/exome-wide sequencing efforts in serial samples from SMM-MM patients allowed the identification of different clonal evolution patterns that recapitulate distinct clinical subsets of SMM patients,9,10 suggesting that genomic analysis can improve current risk scores to facilitate the identification of high-risk SMM patients with an “MM-like” genomic profile.11 Clearly, for this to be conceivable, genomic analysis of asymptomatic patients must be feasible in routine clinical practice, also allowing repeated sampling and accounting for MM spatial heterogeneity. Data produced by ours and other groups indicated that circulating cell-free DNA (cfDNA) is a valid source of tumor DNA and well reflects the mutational profile of neoplastic PCs in MM.12–16 Here, we tested whether this is also true in asymptomatic disease forms characterized by a lower tumor burden.
To this aim, we analyzed 104 samples using ultra-low pass whole-genome sequencing (ULP-WGS) and ultra-deep targeted next-generation sequencing (NGS) of 14 MM driver genes. Samples were derived from 65 patients, respectively 15 MGUS, 33 SMM, and 17 MM patients (11 of whom already analyzed).12 In addition, the analyses were also performed in the genomic DNA (gDNA) from BM CD138+ purified PCs of 39 patients (6/15 MGUS, 16/33 SMM and all the 17 MM cases).
We first investigated the 39 BM gDNA samples. Here our targeted panel, through sequencing at a depth of 5435×, identified a median of 0 mutations per patient in MGUS (range: 0–2), 0.5 in SMM (range: 0–3) and 2 in MM (range: 0–4). Overall, we found at least one mutation in 33%, 50% and 82% of MGUS, SMM and MM patients, respectively (SDC Fig. 1A), supporting the notion that mutations are present throughout the natural history of PC dyscrasias, although they accumulate preferentially in later disease stages.
On the same gDNA samples, we performed ULP-WGS at an average depth of 0.1×. Data was analyzed with ichorCNA to derive information on tumor purity and genome-wide copy-number alterations (CNAs). Average tumor purity was 13% in MGUS, 49% in SMM and 58% in MM, confirming how BM PCs are progressively more enriched in tumor cells as the disease evolves (SDC Fig. 1B). IchorCNA returned genome-wide copy number profiles consistent with the known CNAs in the majority of samples (91% confirmed by FISH). Overall, 50% MGUS, 100% SMM and 94% MM showed at least one CNA (SDC Fig. 1A).
We next turned our attention on cfDNA from peripheral blood (PB) of all the 65 patients included in the study. From an average of 6 ml of plasma, we recovered a mean of about 3326 haploid genome equivalents/mL. cfDNA concentrations were comparably distributed between MGUS and SMM, and significantly (on average 2.8-fold) lower than in MM (Kruskal-Wallis rank sum test p value = 0.02; Fig. 1A). In the 48 asymptomatic cases, we found a weak correlation between plasma cfDNA content and serum concentration of paraprotein or the percentage of infiltrated PCs in the BM (Pearson's correlation test two-sided p value = 0.009 and 0.002, respectively) (SDC Fig. 2A-B). We then performed ULP-WGS to estimate how much of the cfDNA had a tumor origin. Tumor fractions were null in 22/48 asymptomatic patients and ranged between 1% and 10% in the remaining 26 samples. We did not find a significant difference between tumor fractions of MGUS and SMM samples; conversely, patients with overt MM had on average almost 4.5× more tumor cfDNA (Kruskal-Wallis rank sum test p value = 0.006) (SDC Fig. 2C). For the 22 MGUS/SMM patients with matched BM-PB samples, we asked whether a correlation exists between tumor load in the 2 compartments. We did not identify a significant linear correlation, but we found that a greater tumor fraction of gDNA from BM PCs corresponded to an increase in the likelihood of finding tumor-specific cfDNA in PB. In particular, a ROC analysis indicated that ULP-WGS had the best performance in detecting circulating tumor DNA when the tumor fraction in the matched BM biopsy was greater than 12%; indeed, above this threshold, ichorCNA detected tumor material in the cfDNA of 12 out of 16 patients (Fig. 1B). Similarly, tumor-specific cfDNA was found in 13/16 asymptomatic patients with a total BMPC infiltrate ≥10%, suggesting that plasma cfDNA can be a possible source of tumor DNA in SMM. As expected, BM PC infiltration and BM tumor fraction were linked by a positive (albeit weak) correlation (SDC Fig. 3).
FIGURE 1.
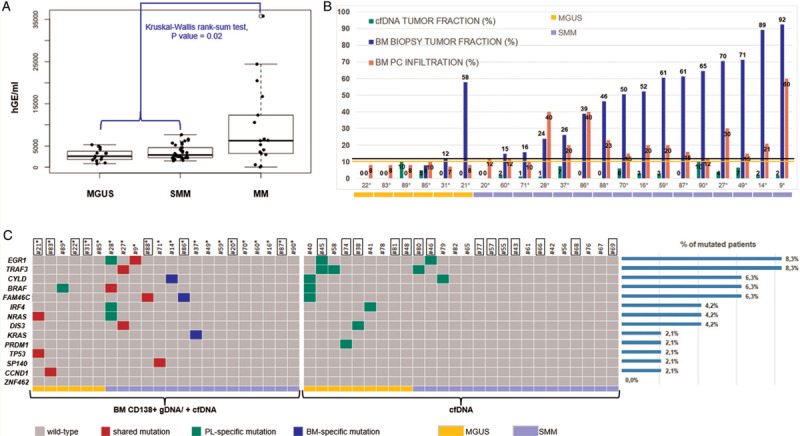
Circulating plasma cell-free DNA: yield, tumor content and gene-mutation analysis. A: Plasma cfDNA content according to diagnosis: the levels of cfDNA are significantly higher in patients with symptomatic MM compared with MGUS/SMM cases (p = 0.03; Kruskal-Wallis rank-sum test). B: Percentage of BM PC infiltration (pink bars) and tumor fraction estimates of matched cfDNA (green bars) and CD138+ gDNA (blue bars) samples in the 22 patients subjected to BM biopsy. The black and yellow lines track the 12% BM tumor fraction and 10% BM PC infiltration thresholds, respectively. C: Overview of identified gene mutations. Gray squares indicate no mutations. Mutations detected in plasma cfDNA and confirmed in tumor gDNA are filled in red; mutations detected in plasma cfDNA only are filled in green; mutations detected in tumor gDNA only are filled in blue. Each column represents one tumor sample and each row represents one gene. The fraction of tumors with mutations in each gene is plotted (right). MGUS samples are indicated in yellow, SMM samples in lilac. IDs of patients in whom ULP-WGS of cfDNA samples did not detect any circulating tumor DNA are framed.
We performed mutational analysis in PB cfDNA of the 48 asymptomatic patients (Fig. 1C). Samples were sequenced to an average of 4523×. Considering the overall results of cfDNA/BM PC gDNA sequencing, 20 patients (42%) carried at least one non-synonymous somatic mutation. The most frequently mutated genes were EGR1 and TRAF3 (each in 4 patients), followed by CYLD, BRAF and FAM46C (3/48), IRF4, NRAS and DIS3 (2/48 each), and KRAS, PRDM1, TP53, SP140, and CCND1 (1/48 each). ZNF462 was never found mutated. Identified substitutions and indels comprised both previously described oncogenic mutations and novel variants. It is worth noting that gene mutations in cfDNA were found in eight of the 22/48 patients in whom ULP-WGS did not detect circulating tumor DNA. In all likelihood, this occurred because the ultra-deep targeted sequencing approach has a much greater sensitivity than ULP-WGS. Focusing on the 22 patients of whom we sequenced also tumor gDNA, all the mutations found in the BM were confirmed in plasma with the exception of 4 mutations identified only in the BM biopsy (FAM46C T354Hfs∗12 in ID86, KRAS G12D and Q61H in patient ID37, and CYLD W847∗ in ID14) (Fig. 1C, blue). Of note, among all the variants called in the tumor tissue, these four mutations had at the lowest variant allelic frequency (VAF) (VAF < 10%; SDC Fig. 4A); therefore, considering how cellular DNA is diluted in PB, their failed detection in cfDNA was expected. We also observed four mutations in cfDNA not confirmed in BM gDNA (EGR1 A243T, IRF4 P237S and NRAS S17Afs∗3 in patient ID28, and BRAF L79Q in ID89). Presumably, cfDNA carries mutations arising in foci distant from the BM biopsy site, as myeloma notoriously displays spatial heterogeneity.17 Overall, for these 22 cases, we did not find correlation between the VAFs computed in tumor gDNA and those in plasma cfDNA (SDC Fig. 4B).
We finally asked whether ULP-WGS could identify genome-wide CNAs in PB cfDNA. However, in this setting the concordance between PB and BM results was much lower than that of mutation analysis (Fig. 2A and SDC Fig. 5): taking any CNA independently, we found a total of 241 abnormalities in BM and PB combined, of which only 14% where shared in the asymptomatic samples. Interestingly, the excess of private variants was mostly found as BM-only. Conversely, the same analysis performed in paired PB-BM samples from MM patients showed a more than three times higher rate of concordance of 51% (Fig. 2B), suggesting that the low amount of tumor-specific cfDNA may be a limiting factor for the use of PB ULP-WGS in the asymptomatic setting.
FIGURE 2.

Copy number alterations estimated by ichorCNA on ULP-WGS data in asymptomatic and symptomatic patients. Right: heatmap of selected chromosomal CNAs as assessed by ULP-WGS and IGH chromosomal translocations as assessed by FISH in the 22 MGUS/SMM (A) and 17 MM (B) patients also analyzed on gDNA from BM CD138+ purified PCs. Gray squares indicate absence of alterations. CNAs detected in plasma cfDNA and confirmed in tumor gDNA are filled in red; CNAs detected in plasma cfDNA only are filled in green; CNAs detected in tumor gDNA only are filled in blue. Each column represents one tumor sample and each row represents one chromosomal alteration. MGUS samples are indicated in yellow, SMM samples in lilac. IDs of patients in whom ULP-WGS of cfDNA samples did not detect any circulating tumor DNA are framed. N.a.: not available information. The fraction of tumors with each alteration is plotted on the right. Left: the percentage of each type of alteration on the total of the identified CNAs in tissue and liquid biopsy, respectively, is plotted in the histograms and Venn diagrams for MGUS/SMM (A) and MM (B) patients.
In conclusion, here we report on the promises and limitations of mini-invasive sampling of PB cfDNA for an extensive genomic characterization of asymptomatic MM stages. Our data support the notion that the lower tumor mass of asymptomatic stages likely correlates with a lower cfDNA tumor fraction. This is in keeping with the better performance of deep mutational analysis than CNA analysis performed at low depth with ULP-WGS in this setting. Even with the more sensitive method, more than half of asymptomatic patients did not show any mutation in cfDNA, likely reflecting a lower mutational load of these stages (clearly, by analyzing a larger gene panel the mutation rate may be higher, but reasonably not to a substantial extent, since the 14 sequenced genes are among the most recurrently mutated in MM). Our data confirm that ichorCNA performance is limited in the setting of very low tumor fractions. However, since ichorCNA estimates the percentage of tumor-derived cfDNA based on the detection of somatic CNAs, it is possible that in patients devoid of clonal CNAs (as non-hyperdiploid, IGH-translocated asymptomatic stages are likely to be) tumor fraction could be underestimated. To optimize the use of liquid biopsy, filling the limits shown by the adopted experimental strategy and increasing sensitivity, a deeper genome-wide approach could be used. However, the cost-benefit ratio should be assessed also at the economic level. Alternatively, in addition to mutational hotspots, even DNA gain and loss hotspots could be targeted by a capture approach and sequenced at higher depth, as already reported on MM PC gDNA.18,19 Finally, to fully exploit the potential of the liquid biopsy as a surrogate of BM sampling, a further upgrade would be required to interrogate plasma also for IGH translocations (by capturing the whole IGH locus or a portion thereof where most of the breakpoints are clustered).18,19 Although the tested cfDNA analysis approach is not ready for prime time to evaluate MGUS and SMM, we believe that with the refinement of these aspects, a thorough genomic assessment of asymptomatic patients is within reach to improve prognostication in a mini-invasive manner.
Supplementary Material
Footnotes
Citation: Manzoni M, Pompa A, Fabris S, Pelizzoni F, Ciceri G, Seia M, Ziccheddu B, Bolli N, Corradini P, Baldini L, Neri A, Lionetti M. Limits and Applications of Genomic Analysis of Circulating Tumor DNA as a Liquid Biopsy in Asymptomatic Forms of Multiple Myeloma. HemaSphere, 2020;4:4(e402). http://dx.doi.org/10.1097/HS9.0000000000000402
This research was funded by: Associazione Italiana Ricerca sul Cancro Investigator Grant n.16722 (to AN); Italian Ministry of Health Ricerca Corrente funds 2019 (to AN); Italian Ministry of University and Research (MIUR) (to AN); European Research Council under the European Union‘s Horizon 2020 research and innovation programme (grant agreement n. 817997) (to NB). MM is supported by fellowship (#22389) from Fondazione Italiana Ricerca sul Cancro (FIRC).
The authors declare no conflict of interest.
REFERENCES
- 1.Kyle RA, Remstein ED, Therneau TM, et al. Clinical course and prognosis of smoldering (asymptomatic) multiple myeloma. N Engl J Med. 2007;356:2582–2590. [DOI] [PubMed] [Google Scholar]
- 2.Paiva B, Vidriales MB, Rosinol L, et al. A multiparameter flow cytometry immunophenotypic algorithm for the identification of newly diagnosed symptomatic myeloma with an MGUS-like signature and long-term disease control. Leukemia. 2013;27:2056–2061. [DOI] [PubMed] [Google Scholar]
- 3.Perez-Persona E, Vidriales MB, Mateo G, et al. New criteria to identify risk of progression in monoclonal gammopathy of uncertain significance and smoldering multiple myeloma based on multiparameter flow cytometry analysis of bone marrow plasma cells. Blood. 2007;110:2586–2592. [DOI] [PubMed] [Google Scholar]
- 4.Lakshman A, Rajkumar SV, Buadi FK, et al. Risk stratification of smoldering multiple myeloma incorporating revised IMWG diagnostic criteria. Blood Cancer J. 2018;8:59. [DOI] [PMC free article] [PubMed] [Google Scholar]
- 5.Landgren O, Hofmann JN, McShane CM, et al. Association of Immune Marker Changes With Progression of Monoclonal Gammopathy of Undetermined Significance to Multiple Myeloma. JAMA Oncol. 2019;5:1293–301. [DOI] [PMC free article] [PubMed] [Google Scholar]
- 6.Ravi P, Kumar S, Larsen JT, et al. Evolving changes in disease biomarkers and risk of early progression in smoldering multiple myeloma. Blood Cancer J. 2016;6:e454. [DOI] [PMC free article] [PubMed] [Google Scholar]
- 7.Lonial S, Jacobus S, Fonseca R, et al. Randomized trial of lenalidomide versus observation in smoldering multiple myeloma. J Clin Oncol. 2020;38:1126–1137. [DOI] [PMC free article] [PubMed] [Google Scholar]
- 8.Mateos MV, Hernandez MT, Giraldo P, et al. Lenalidomide plus dexamethasone versus observation in patients with high-risk smouldering multiple myeloma (QuiRedex): long-term follow-up of a randomised, controlled, phase 3 trial. Lancet Oncol. 2016;17:1127–1136. [DOI] [PubMed] [Google Scholar]
- 9.Bolli N, Maura F, Minvielle S, et al. Genomic patterns of progression in smoldering multiple myeloma. Nat Commun. 2018;9:3363. [DOI] [PMC free article] [PubMed] [Google Scholar]
- 10.Dutta AK, Fink JL, Grady JP, et al. Subclonal evolution in disease progression from MGUS/SMM to multiple myeloma is characterised by clonal stability. Leukemia. 2019;33:457–468. [DOI] [PMC free article] [PubMed] [Google Scholar]
- 11.Maura F, Bolli N, Rustad EH, et al. Moving from cancer burden to cancer genomics for smoldering myeloma: a review. JAMA Oncol. 2020;6:425–432. [DOI] [PMC free article] [PubMed] [Google Scholar]
- 12.Gerber B, Manzoni M, Spina V, et al. Circulating tumor DNA as a liquid biopsy in plasma cell dyscrasias. Haematologica. 2018;103:e245–e248. [DOI] [PMC free article] [PubMed] [Google Scholar]
- 13.Guo G, Raje NS, Seifer C, et al. Genomic discovery and clonal tracking in multiple myeloma by cell-free DNA sequencing. Leukemia. 2018;32:1838–1841. [DOI] [PMC free article] [PubMed] [Google Scholar]
- 14.Kis O, Kaedbey R, Chow S, et al. Circulating tumour DNA sequence analysis as an alternative to multiple myeloma bone marrow aspirates. Nat Commun. 2017;8:15086. [DOI] [PMC free article] [PubMed] [Google Scholar]
- 15.Manier S, Park J, Capelletti M, et al. Whole-exome sequencing of cell-free DNA and circulating tumor cells in multiple myeloma. Nat Commun. 2018;9:1691. [DOI] [PMC free article] [PubMed] [Google Scholar]
- 16.Mithraprabhu S, Morley R, Khong T, et al. Monitoring tumour burden and therapeutic response through analysis of circulating tumour DNA and extracellular RNA in multiple myeloma patients. Leukemia. 2019;33:2022–2033. [DOI] [PubMed] [Google Scholar]
- 17.Rasche L, Chavan SS, Stephens OW, et al. Spatial genomic heterogeneity in multiple myeloma revealed by multi-region sequencing. Nat Commun. 2017;8:268. [DOI] [PMC free article] [PubMed] [Google Scholar]
- 18.Yellapantula V, Hultcrantz M, Rustad EH, et al. Comprehensive detection of recurring genomic abnormalities: a targeted sequencing approach for multiple myeloma. Blood Cancer J. 2019;9:101. [DOI] [PMC free article] [PubMed] [Google Scholar]
- 19.Bolli N, Biancon G, Moarii M, et al. Analysis of the genomic landscape of multiple myeloma highlights novel prognostic markers and disease subgroups. Leukemia. 2018;32:2604–2616. [DOI] [PMC free article] [PubMed] [Google Scholar]
Associated Data
This section collects any data citations, data availability statements, or supplementary materials included in this article.