

Abstract
This paper describes the design and integration of a custom-built optical instrument for in-situ Raman microscopy suitable for collecting high-quality spectroscopic data during the indentation of glass materials. It will further show that the reported experimental setup enables meaningful in-situ spectroscopic observations during indentation of fused silica at forces in the millinewton range. The aim of the paper is to demonstrate the vital importance of matching the analysis volume of the Raman microscope with the indentation-induced deformation volume to capture the full extent of the related spectral alterations by minimizing spectral contributions from the unperturbed bulk material (in-situ and ex-situ) and indenter probe (in-situ only). In this context, the paper will also touch upon possible pitfalls in ex-situ and in-situ Raman measurements on indented glasses in cases where the analysis and deformation volumes are not well matched and describe the misinterpretations that may result.
Keywords: Indentation, Raman spectroscopy, fused silica (silicate glass), in-situ
1. Introduction
The structure of silica glasses is described as a continuous network of SiO4 tetrahedra connected to each other via a corner sharing oxygen atom (Zachariasen model), in which large variations in the orientation of tetrahedra induce disorder into the structure [1]. Different ranges of order have been defined within the fused silica network: a single SiO4 tetrahedron, three-atom Si-O-Si bonds between two tetrahedra, large features of the network topology (e.g., n-membered (Si-O-Si)n ring structures) and large-scale density fluctuations [2,3]. Exposure to mechanical stresses can significantly alter the local structure of the silica network. Consequently, there is great interest in establishing correlations between the mechanical stress applied to a glass and the resulting structural modifications of its network to better evaluate and tailor structure-related properties of glasses important to glass science and engineering [4].
Many in-situ studies of mechanically induced changes in the structure of glasses have been conducted in diamond anvil cells (DAC) in combination with various characterization methods (e.g., Brillouin scattering, vibrational spectroscopy, x-ray scattering or neutron-diffraction [5–8 and refs. within]). DAC studies have advanced our understanding of the effect of hydrostatic pressure on the structure of glasses. However, as has been recently discussed, more can be learned about the structural evolution of glass materials due to mechanical loading if they are exposed to shear stress [4]. In the presence of shear stress, different deformation mechanisms may be activated (e.g., formation of shear bands) than those observed in hydrostatic compression alone [9].
As indentation testing enables the study of glasses under more complex stress states (combination of high hydrostatic pressure and shear), [10,11] numerous indentation studies have been published on various glasses. In combination with indentation testing, Raman spectroscopy is often employed for analyzing the induced structural changes in glasses (e.g., [9,12–15]). The Raman spectra of silica glasses depend on both short-range order (SiO4 tetrahedron) and medium-range order (intertetrahedral bond-angle distribution and ring statistics) [3,16–20]. Consequently, analyses of changes in Raman spectra as a function of mechanical loading provide insight into changes in the glass structure over those distance ranges. However, the reported Raman spectroscopic analyses were performed almost exclusively ex-situ (post mortem) on residual indentations in glass, as the integration of in-situ characterization has been more challenging for indentation experiments than for DAC tests. One report of in-situ Raman spectroscopic measurements during indentation of silica and soda-lime silicate glasses has recently been published [21]. Under appropriate conditions, in-situ Raman microscopy integrated into an indentation instrument has the potential to provide descriptive insights into the relationship between the structure of glasses and their behavior under the exposure to mechanical stresses [9,22]. Furthermore, it would allow for a more detailed comparison between experimental observations and model predictions regarding the mechanical behavior of glasses than that possible with ex-situ Raman data alone [10,23].
Given the dimensional realities (size of deformation region <<< thickness of indented sample) in indentations on glasses, Raman studies are usually conducted in a confocal microscopy configuration. In confocal Raman microscopy, a microscope objective focusses a laser beam to a small focal volume. Only Raman scattered photons generated near the beam waist are collected and passed on to the spectrometer due to the use of a confocal aperture that blocks light originating from outside the focal plane. By moving the focal plane within the sample, depth profiles can be constructed for parameters (e.g., strain, chemical composition) extracted from the Raman spectra. Even with the use of a confocal configuration, it is important to consider the limitations of the microscope objectives used, especially regarding their spatial resolution, and to properly account for factors that may broaden the sampling volume. These factors may include the surface topography around indents and, in the case of sub-surface measurements, the index of refraction of the specimen. A clear understanding of these factors is necessary to properly interpret the confocal Raman data and to insure the acquisition of spectra with optimized signal to noise ratios and spatial resolution [24]. This is of paramount importance in specimens consisting of a small region of perturbed material surrounded by bulk, unperturbed specimen as is encountered in Raman studies of indented glass. The aim of minimizing the spectral contamination from unperturbed bulk material is a key criterion in the design of an optimized Raman spectroscopy configuration, starting with the selection of a suitable microscope objective. For example, a common pitfall in confocal Raman microscopy is the use of standard metallurgical objectives for focusing below the surface and through the volume of a transparent sample. This practice deviates from the purpose for which metallurgical objectives are designed; that is, focusing light at the surfaces of opaque materials. Using a metallurgical objective in this unintended way results in refraction and spherical aberration. Aberration effects cause a lateral broadening of the intensity distribution (widening of the beam waist) and an extension of the focal depth, resulting in the degradation of the attainable three-dimensional spatial resolution, [24] and thus an expansion of the analysis volume. Additionally, the z axis position of the focal plane can be seriously distorted in depth profiling measurements [24].
In this context, consideration of the spatial resolution (analysis volume) of the Raman measurements and its relation to the deformation region is of critical importance to correctly interpreting in-situ Raman spectra but also ex-situ Raman measurements on indented glasses, as has been recently discussed [22]. It is not uncommon to find information for the spatial resolution or sampling volume of about 1 μm3, [15,22] the focal spot size (lateral resolution) ≤ 1 μm [9,13,14] or depth resolution of order of 1 μm to 2 μm [13] in Raman studies on indented glass. These are usually theoretical estimates of the diffraction limited resolution and in some circumstances may not represent the working resolution (analysis volume) of the actual optical setup, which could be significantly larger than the theoretical volume. Deviations from the best-case resolution may be critical in cases of sub-surface imaging with metallurgical objectives and in specimens that deviate from planar geometry [25]. An analysis volume significantly larger than the deformation volume may result in an inaccurate depiction of the actual spectral changes induced during indentation of glass samples, particularly in in-situ Raman measurements, as will be shown in this paper.
This paper describes the design and integration of a custom-built optical instrument for in-situ Raman microscopy suitable for collecting high-quality spectroscopic data during the indentation of glass materials. The paper will touch upon possible pitfalls in ex-situ and in-situ Raman measurements on indented glasses and describe the misinterpretations that may result. The paper will further demonstrate that the reported experimental setup enables meaningful in-situ spectroscopic observations of indentations generated by milli-newton forces rather than forces in the newton-range commonly applied (under acute indentation probes) [13,26–28]. Use of this force range allows spectral observations of the indented region without the occurrence of cracking. The occurrence of cracks may affect the size, shape and nature of the mechanically stressed area [11] and will lead to an increase in scattering that degrades the optical measurements. The in-situ spectroscopic measurements presented in this paper were conducted during the indentation of fused silica samples. Fused silica was selected as the test material as it is a technologically important material with applications in photonics, [29] sensors, [30] microfluidics, micro-optics, microelectronics and microelectromechanical systems (MEMS) [31–34]. Further, fused silica embodies the model material for disordered networks, [16,35] is regarded as a prototype for geologically important silicates [6] and often serves as a reference material in glass studies. Finally, the aim of this paper is to demonstrate experimental conditions under which glasses can be effectively studied using in-situ Raman spectroscopy during indentation tests wherein the analysis volume is maximally overlapped with the deformed region of the specimen and the spectral contribution of bulk material is minimized. The paper is not focused on the material properties or deformation behavior of fused silica, using it only as a model system to demonstrate the measurement technique.
2. Material and methods
2.1. Experimental setup for in-situ Raman microprobe during indentation testing of glasses
2.1.1. Samples
The samples used in this study were made of optically polished, Corning 7980 UV Grade fused silica (Valley Design Corporation, Shirley, MA) [36]. Fused silica samples of two thicknesses were tested. The sample with a thickness of 0.2 mm ± 0.025 mm will be referred to as thin specimen and the sample with a thickness of 1 mm ± 0.05 mm as thick specimen throughout the remainder of the paper.
2.1.2. Experimental configuration
In-situ Raman spectroscopic measurements of indented glass samples were conducted using Raman spectroscopy-enhanced instrumented indentation testing (RS-IT). RS-IT was developed at the National Institute of Standards and Technology (NIST) to conduct in-situ spectroscopic analyses of mechanically deformed regions of optically transparent materials under contact loading. The basic principle of this technique has been presented in detail previously [37] and is described briefly as follows: RS-IT employs an in-house built instrumented indentation testing (IT) device that is coupled to a custom Raman microscope. The force transducer of the IT device allows adjustment of experimental parameters, such as indentation loads and (un)loading rates. An incorporated displacement sensor allows for collection of force-displacement data comparable to that obtained with conventional IT instruments. The load-controlled IT device, along with a specimen holder, is mounted on the X-Y translation stage of an inverted optical microscope. The specimen holder features a circular aperture in the center, allowing optical access from below to the sample region in contact with the indenter probe.
RS-IT was initially developed and designed for in-situ Raman microprobe and scanning of indented crystalline and amorphous silicon thin films on sapphire substrates. The instrumental setup used in these studies has been reported in detail [38–40]. In these cases, the incident and Raman scattered photons passed through relatively thin sections of unperturbed silicon (several hundreds of nanometers) and the Raman signal was dominated by the response of the indented material. In-situ Raman microprobe of bulk glass samples requires the incident photons to traverse a significant thickness of unperturbed glass (several hundreds of micrometers), as there is no chemically distinct substrate to provide mechanical rigidity. Consequently, collection of meaningful spectral data on this group of materials requires modifications of the original experimental setup to ensure a minimal analysis volume. Additionally, glasses are relatively weak Raman scatterers and thus significant efforts were also required to minimize spectral background.
The microscope objectives and optical fiber used as a confocal aperture were both changed from the published design [38–40] in an effort to minimize the Raman analysis volume. Data acquired with three microscope objectives will be presented in this paper:
an 80X metallurgical objective (MO) with a numerical aperture (NA) of 0.75 (ULWD MSPlan, Olympus, Waltham, MA) [36];
a 40X objective with a variable coverslip correction (CO) and an NA of 0.95 (UPlanSApo, Olympus, Waltham, MA) [36] and;
a 100X objective with a variable correction for thick glass substrates (TO) and an NA of 0.6 (LCPlanFl, Olympus, Waltham, MA) [36].
The MO objective had sufficient working distance to image through glass specimens with a range of thicknesses while the variable correction collar of the aberration-corrected objectives could be set to match the thickness of the glass specimens over two thickness ranges (CO: 0.11mm to 0.23 mm and TO: 0.6 mm to 1.2 mm). The CO and TO objectives provide a means to compensate for the spherical and chromatic aberration caused by passing the excitation and Raman scattered beams through the specimen as is required in the in-situ RS-IT setup. Aberration correction is critical to maintaining an analysis volume that overlaps with the deformation region of the glass, as will be demonstrated later in this paper. The original design of the RS-IT instrument utilized a multi-mode optical fiber (M31L10, Thorlabs, Newton, NY) [36] to transport the scattered Raman photons to the spectrometer and the 62.5 μm diameter fiber core served as the confocal aperture. The spectrometer consists of a 0.5m imaging spectrograph equipped with a 1200 g/mm grating blazed at 500 nm (Acton SP2–500i) [36] and a liquid nitrogen cooled CCD camera (Princeton Instruments) [36]. The same fiber was used here for the data acquired with the MO objective. In conjunction with the two aberration-corrected objectives (CO and TO), a single mode optical fiber with a mode field diameter of 4.1 μm (SM450, Thorlabs, Newton, NY) [36] was used to further restrict the depth over which Raman photons were collected.
Given the high NA objectives and confocal collection, precise, reproducible control over the distance between the objective and the specimen surface was important. The mechanical focus adjust on the inverted microscope was not sufficient, so a piezoelectric, z-axis objective scanner (PIFOC, Physik Instrumente, Auburn, MA) [36] was implemented.
Note that the use of a single mode fiber led to some polarization effects that, coupled with the particular characteristics of the diffraction grating used in the spectrometer, resulted in subtle day to day variations in the instrumental sensitivity in the low wavenumber spectral region. An achromatic depolarizer (DPU-25, Thorlabs, Newton, NJ) [36] was used in the entrance optics to the spectrometer to eliminate these variations. Additionally, all of the spectra reported in this paper were corrected for the spectral intensity instrument response function with Standard Reference Material 2242 using the published procedure [41].
2.1.2.1. Spectral contaminations.
In general, glasses are relatively weak Raman scatterers so some changes from our previous design were required to obtain spectra with reasonable signal to noise ratios. 532 nm was chosen as the excitation wavelength and significantly higher power levels (30 mW - 50 mW) than those used in the past were utilized. Even with these changes, spectra of suitable quality required acquisition times in the range of 3 minutes to 5 minutes. Consequently, in-situ Raman measurements on glasses are sensitive to low level, spectral signals from stray room light or chemical residues, such as deposits from cleaning agents used in sample or tip preparation or debris transferred to the probe in prior indentations. Spectroscopic measurements on other groups of materials are usually not susceptible to those low-level spectral contaminations. Thus, special care was taken to reduce the intensity of the spectral background in the Raman measurements on the fused silica specimens.
2.1.2.2. Indenter probe.
One issue that researchers must contend with in in-situ Raman measurements of mechanically stressed glasses is the photoluminescence (PL) of the probe inducing the mechanical stress. PL is a process induced by the Raman excitation light and has been widely seen in diamonds, [42–44] the material of choice for mechanical probes in many DAC and indentation experiments. The PL of diamonds can vary widely depending on their impurities [42–44]. Consequently, diamond probes used for in-situ Raman measurements must be carefully selected so that the intensity of their luminescence is small with respect to the Raman signal of the tested glass sample [42,43,45,46]. Otherwise, the broad Raman bands of the glass sample may be heavily obscured by the PL signature of the probe in the convoluted spectra of sample and probe collected during an in-situ measurement [45–47]. The spectral envelope of the diamond probe luminescence can be rather complex [42,43]. In view of that, the accuracy of simple methods for extracting the spectral signature of the sample from the convoluted probe/sample spectrum (e.g., the subtraction of a linear baseline to account for probe luminescence) appears questionable.
In preparation for this study, the following approach was taken to select a diamond probe suitable for in-situ Raman measurements on indented glass samples. First, the spectral signature of the fused silica glass was collected (referred to as the sample-only spectrum). Then, a diamond probe was installed in the indentation device, brought near the glass sample (hovering about 1 μm above the sample surface) and a Raman spectrum of the sample and probe was measured (referred to as the sample-probe spectrum). This was repeated for several diamond probes. The sample-probe spectra of the different diamond probes were compared to the sample-only spectrum. Fig. 1 shows the spectral signature of fused silica in the sample-only spectrum and examples of sample-probe Raman spectra collected for different diamond probes near the sample. The sample-probe spectra were normalized and offset vertically for visual clarity. As can be seen, the PL of the diamond probes obfuscated the spectral signature of the glass sample to varying degrees. The diamond probe least obscuring the spectral signature of the glass sample (see Fig. 1b) was chosen for further in-situ experimentation.
Fig. 1.

Raman spectrum collected for (a) a fused silica specimen without a diamond probe present (sample-only) and (b) through (d) Raman spectra (sample-probe) collected with different diamond probes near the sample. Characteristic Raman bands of fused silica are indicated in (a): MB… main band, D1/2… defect bands, A… asymmetric band, DB… high-frequency doublet. The Raman intensities of all spectra shown were normalized in such a manner that the intensity of the D1 band was 1.5. The spectra are vertically shifted for a better visualization.
2.2. Experimental procedure for in-situ Raman microprobe during indentation testing of glasses
For reference purposes, Raman spectra of the samples only (without the indenter probe present) and the samples with the probe hovering 1.5 μm above sample surface were collected prior to indentations for the three microscope objectives using the samples of relevant thickness. The Raman spectrum collected with the probe hovering was regarded as the baseline spectrum to the in-situ spectral measurements conducted during an indentation.
In-situ spectroscopic measurements during indentation of the fused silica specimens were conducted with two test protocols, referred to as z-profile and load-sequence experiments in the rest of the paper.
In the z-profile experiments, the indenter probe was brought in contact with the glass sample and continuously loaded to a maximum indentation force of 300 mN (loading rate: 5 mN/s). Then the indentation force was held constant to perform a series of in-situ Raman measurements in the center of the indentation. The first Raman spectrum (surface spectrum) was collected with the microscope objective focus set at the surface of the specimen at the edge the indentation feature. Then seven consecutive Raman spectra were measured where the z-axis position of the microscope objective was shifted 1 μm lower for each spectrum along the indentation axis. This had the effect of shifting the nominal focal plane of the microscope away from the specimen surface into the bulk. The excitation beam was aligned with the center of the indentation region before starting the z-profile measurements. The z-profile experiments were conducted for all three microscope objectives using the samples of relevant thickness (MO and CO with the thin specimen, MO and TO with the thick specimen). The maximum indentation load in the z-profile experiments was set at 300 mN to avoid cracking and also to ensure a favorable ratio of analysis volume to deformation volume (as will be elaborated on later in the paper).
In the load-sequence experiments, the indenter probe was brought in contact with the glass sample and a first indentation force of 50 mN was applied (loading rate: 5 mN/s). The indentation force was held constant while a Raman spectrum was collected in-situ from the center region of the indentation with the microscope objective being focused on the top surface of the specimen at the edge of the indentation imprint. The focal adjustment was made during white light imaging of the contact region (upon reaching the set indentation force) prior to the Raman measurements. Following the spectral acquisition, the indentation force was increased by 50 mN. A Raman spectrum was then collected at that load after re-adjusting the focus of the objective. This routine was continued until a maximum force of 300 mN was reached. Then the indentation force was reduced in 50 mN steps until the sample was completely unloaded (unloading rate: 5 mN/s). At each unloading step, a Raman spectrum was collected in-situ just as in the loading segment of the indentation. The excitation beam had been aligned with the center of the indentation region before starting the loading sequence and was regularly checked and re-adjusted (if necessary) during the in-situ measurements. The load sequence experiments were conducted for the optical arrangement with aberration-corrected objectives only (CO, TO).
The indenter probe used in all of the in-situ measurements was a three-sided, pyramidal diamond probe with an acuity (semi-apical angle ψ = 68.8°) intermediate to Berkovich (ψ = 77°) and cube corner (ψ = 54.7°) probes. The nominal tip radius of the indenter probe was about 150 nm.
2.3. Analysis of spectral data
2.3.1. Assignment of Raman bands
In the wavenumber range analyzed in this paper (180 cm−1 to 1450 cm−1), the Raman spectra collected on the glass samples prior to indentation showed the following characteristic spectral features of fused silica (see Fig. 1a). An asymmetric main band (MB), frequently referred to as the R band at 430 cm−1, has been linked to the oxygen motion within the silica tetrahedra [48] and has also been described as superposition of modes belonging to rings formed by more than four SiO2 tetrahedral units [17,49]. Two sharp Raman peaks around 495 cm−1 and 606 cm−1 are often labelled in the literature as defect bands D1 and D2, respectively. They are associated with the breathing vibrations of oxygen atoms in 4-membered rings [18,50,51] or breathing vibrations of oxygen atoms in 3-membered rings [18,50–52], respectively. Notably, it was recently suggested that the D1 peak might originate from spectral contributions of 4-membered as well as 3-membered rings [52]. An asymmetric band (A) at 800 cm−1 has been assigned to various bending and stretching motions [53,54]. Lastly, a high frequency doublet (DB) at 1060 cm−1 and 1200 cm−1 is associated with stretching involving SiO4 tetrahedral units [49,53,55] and/or Si-O-Si bonds [54] in the silicate network.
2.3.2. Determination of MB position
As mentioned earlier, the emphasis of this paper is not on the relevance of the spectral observations to the material structure but rather on the measurement science of collecting and interpreting confocal Raman data of indented glasses. Numerous previous works have reported on the correlation of Raman spectral changes to underlying structural changes in fused silica [18,20,45,46,56–62]. The quantitative analysis of the Raman spectral data reported here is aimed solely at determining the MB shift in the fused silica spectrum with changes in indentation load. The MB is quite broad and asymmetric, presumably composed of a number of underlying, overlapping bands. Identification of a robust method for measuring the peak shift of the MB is thus not entirely straightforward and various approaches have been reported. Two different approaches previously described in the literature are used here. The first uses nonlinear least squares fitting to a multi-peak (MP) spectral model [17,35] of the experimental spectrum and then finding the root of the first derivative of the best-fit model function to establish the peak position. The second approach utilizes a spectral center-of-mass (CM) approach [63] to define a peak position.
Each method is a reasonable approach to reducing the changes in the spectral shape and position to a single number (shift) and while the algorithms yield different values of the shift, our interest is only in how these shifts vary with load. The adaptation of these approaches to the data presented in this study is laid out in detail in the following section.
2.3.2.3. Multi-peak (MP) fitting.
The MP spectral fitting procedure utilized a spectral model consisting of 6 bands over the spectral range from 180 cm−1 to 680 cm−1. The model is based on that described by Chligui et al. [35] that includes four spectral components that predominantly comprise the asymmetric main band along with the D1 and D2 bands. Non-linear least squares fits to the measured spectra with this spectral model produced accurate representations of the experimental data. While other spectral models might also be suitable, this model was satisfactory for the purposes of identifying the MB peak position. Because the MB is composed of several underlying sub-bands, [35,48] the MB peak position does not coincide exactly with the peak position of any of the sub-bands. To identify the MB peak position, the position of the root of the first derivative of the best-fit model function over the relevant spectral range was utilized.
2.3.2.4. Center of mass (CM) calculation and density calculation.
A second approach to characterizing the change in the MB position in fused silica was also implemented. This CM approach, described in detail by Deschamps et al., [63] defines a quantity as the wavenumber at which the integral over the background corrected spectral region encompassing the MB, D1 and D2 bands reaches half of its total value. Changes in this quantity then provide a measure of how much the overall spectrum in this region shifts. It is similar to center-of-mass approaches to finding band positions and provides a second method for describing the spectral shifts seen in mechanically stressed fused silica with a single number. It can also be related to the degree of densification using a calibration relationship [63] as will be discussed later. Of course, this quantity differs from the MB position extracted from the MP fitting procedure, but the two approaches provide similar information.
3. Results
In the following sections, the results of the load-sequence and z-profile experiments described in Section 2.2 are summarized.
3.1. Baseline spectra
Raman spectra were collected with the indenter probe tip hovering about 1.5 μm above the sample surface (sample-probe spectra) for each microscope objective and relevant sample thicknesses (MO and CO with the thin specimen, MO and TO with the thick specimen). The sample-probe spectra are compared to the corresponding sample-only spectra in Fig. 2.
Fig. 2.

Raman spectra collected in-situ using different microscope objectives (CO, TO, MO) and fused silica specimens of relevant thickness prior to indentation. The thin, black curves show the sample-only spectra and the thick, colored curves represent sample-probe spectra collected with the same diamond probe hovering over the sample. The Raman intensities of all spectra shown were normalized in such a manner that the intensity of the D1 band was 1.5
When using the CO (Fig. 2a) for in-situ Raman measurements on the thin specimen, spectral alterations were mostly seen in the wavenumber region between 1250 cm−1 and 1450 cm−1 (upper boundary of the spectral collection range) due to a strong Raman peak originating from the diamond probe detected in this region. However, the region from 180 cm−1 (lower boundary of spectral collection range) to 1250 cm−1, covering many of the glass bands, was unaffected. In comparison, the spectral measurements on the thick specimen using the TO objective appeared to be more affected by the spectral contributions of the diamond probe (Fig. 2c). The diamond peak at 1350 cm−1 was more pronounced (see greater peak width) and a stronger PL contribution probably caused a slight uplift of the spectral background signal in the region from 500 cm−1 to 1450 cm−1. As a consequence, the weak 1200 cm−1 band of the high frequency doublet was no longer discernable. Nevertheless, the overall spectral profile below 1100 cm−1 was only slightly altered.
The most significant deviations from the sample-only spectral signature of fused silica were observed in the optical configuration employing the MO (Fig. 2b and 2d), though the effects were more severe in spectral measurements on the thick sample. For both the thin and thick sample, a significant increase of the background signal was detected (up to 4 times stronger with the probe hovering over the sample compared to the sample-only spectrum). Of greater concern, the shape of the main band was noticeably affected, resulting in a perceived slight shift in the MB position.
The comparison of sample-probe and sample-only spectra for the different optical configurations revealed that close proximity of the indenter probe and glass sample altered the perceived spectral signature of the unperturbed glass. This effect was observed to varying degree in all optical configurations and was caused by the convolution of spectral contributions from probe and sample inherent to in-situ Raman measurements. However, the largest spectral alterations were seen in the Raman measurements with the metallographic objective, whereas the baseline spectrum collected in CO configuration appeared to be the least affected.
For reference purposes, the sample-probe spectrum collected for an individual optical configuration should be regarded as baseline spectrum (spectral signature) for the unperturbed state in those in-situ Raman measurements with the probe being in close proximity to or in contact with the sample.
3.2. Z-profile experiments
Being an anomalous glass, fused silica deforms primarily by densification during indentation with an acute probe (below the fracture threshold). The nature of the densification-induced changes to the silicate network are still under discussion with two opposing theories emerging: (1) the transformation of larger silicate rings to smaller rings, (2) increase of the average ring size upon densification [9]. However, ex-situ Raman spectroscopic studies of residual indents in FS suggested that the material densified below the indenter probe exhibits a modified spectroscopic profile compared to the pristine, unperturbed FS [9,62,64] with shifts of the main band and defect lines towards higher wavenumbers being the most pronounced changes.
The capability of the different optical configurations to detect those densification-induced spectral changes during an actual indentation event is analyzed next. Starting with the in-situ Raman measurements on the thin specimen, Fig. 3 summarizes spectral data collected during indentation using the CO and MO configurations, respectively. Fig. 3a shows Raman spectra collected with the CO from the center of the indentation impression while an indentation force of 300 mN was applied. The Raman spectra were recorded with the microscope objective being focused on the surface of the sample at the edge of the contact impression (surface spectrum) and with the focal plane shifted 1 μm to 7 μm away from that position along the z axis into the specimen bulk. For comparison, the baseline spectrum of the unperturbed material collected prior to the indentation was overlaid (dashed line) in some instances. The MB positions derived by CM calculations from the spectra shown are given in Fig. 3c for the different positions of the objective along the z axis. The MB position in the corresponding baseline spectrum of the unperturbed material is represented by a solid line in this figure. Complementary to the surface spectrum in Fig. 3a, Fig. 3b shows a Raman spectrum collected in-situ under similar conditions (300 mN, center of contact impression, same position of microscope objective) with the MO rather than the CO. Also, for reference purposes, the baseline spectrum of the unperturbed material is overlaid (dashed line). The Raman spectra collected in-situ with this objective at other positions along the z axis closely resembled the edge spectrum, therefore they are not shown in Fig. 3b. Nevertheless, the MB positions determined for these spectra and the surface spectrum, together with the MB position in the baseline spectrum (dashed line) collected with the MO are included in Fig. 3c. The Raman intensities of all spectra shown in Fig. 3a and b were normalized in such a manner that the intensity of the D1 band was 1.5. All the data represented in Fig. 3c were derived from CM calculations.
Fig. 3.
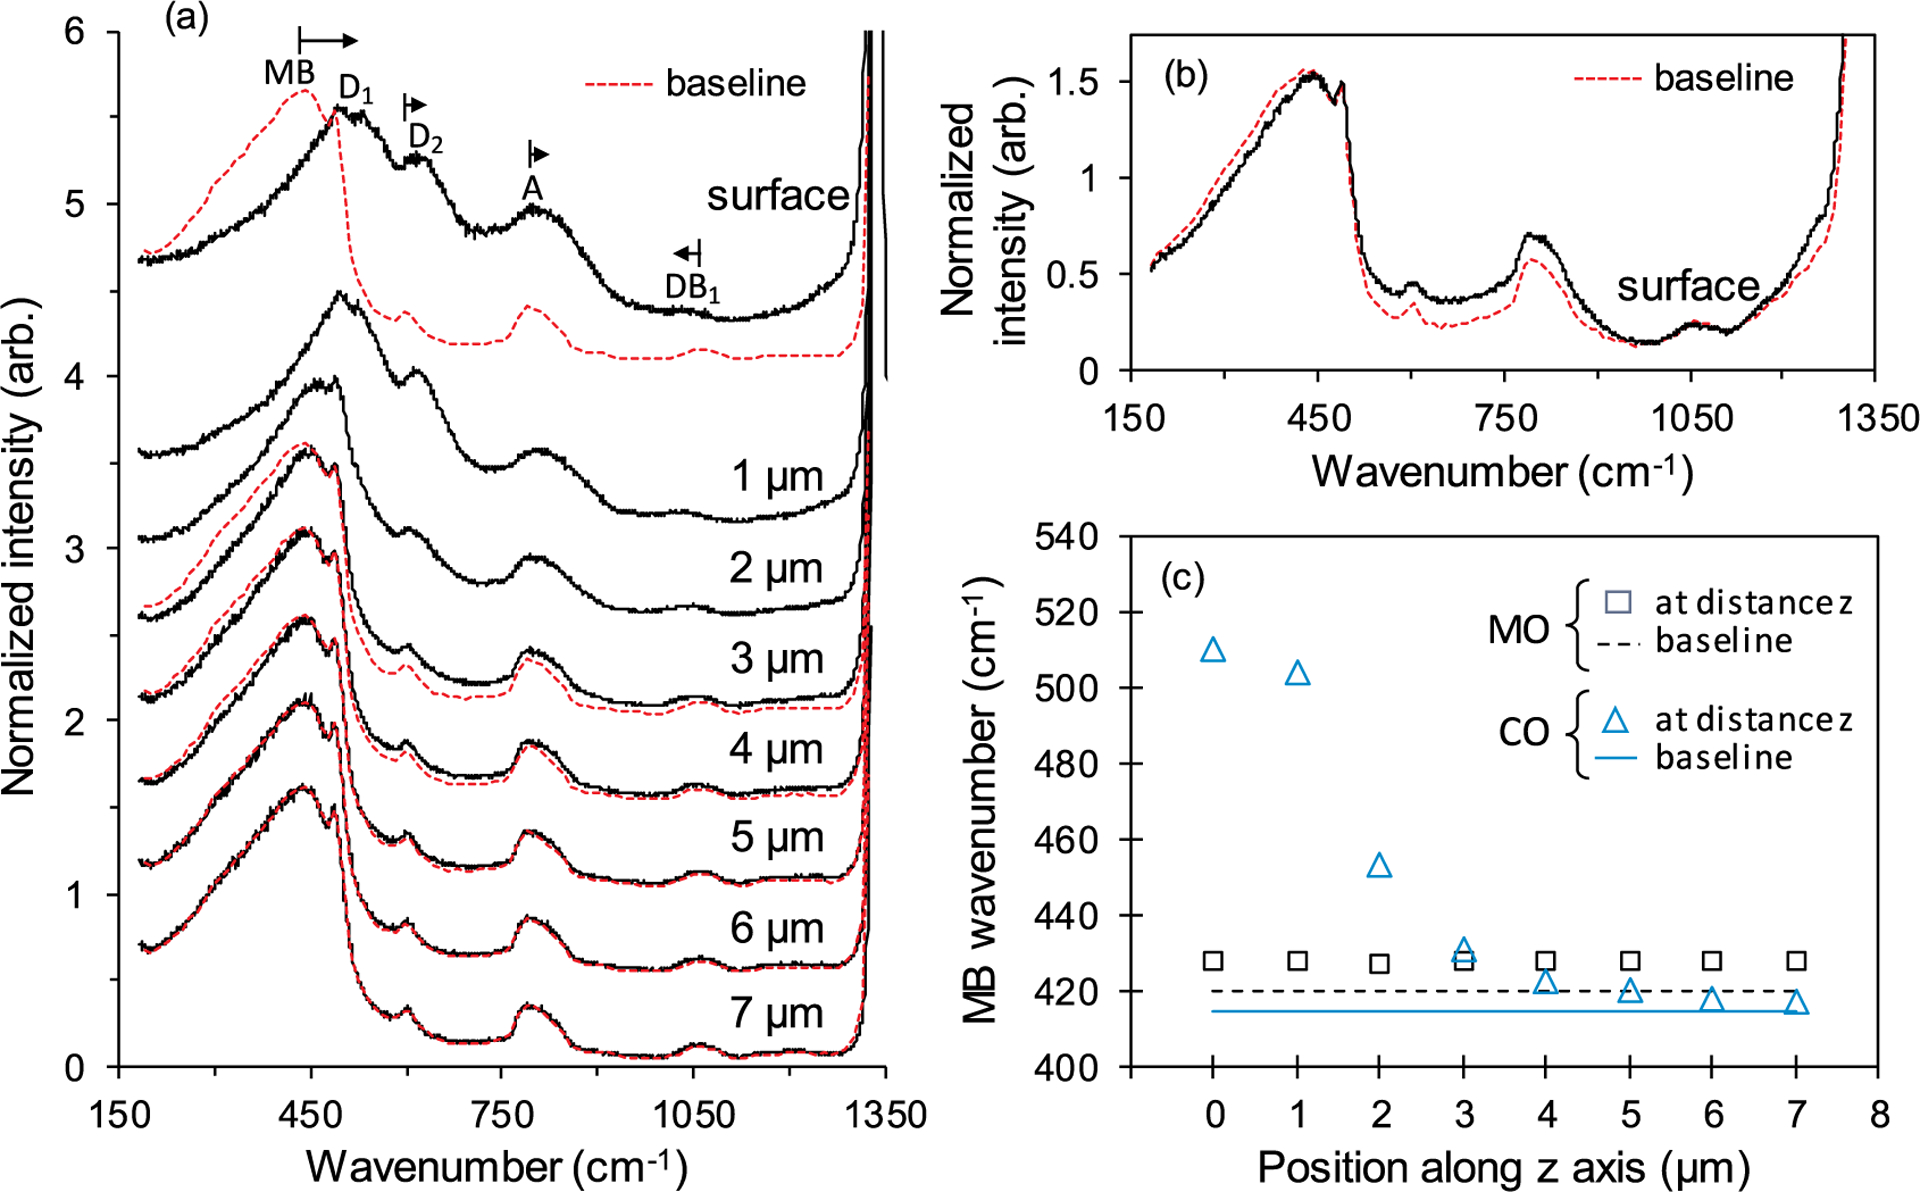
(a) Raman spectra collected in-situ in the center of the indentation imprint on the thin specimen with the CO being focused on the surface of the sample at the edge of the contact impression (surface) and with the focal plane shifted 1 μm to 7 μm away from that position along the z axis into the specimen bulk. The dashed curves represent the baseline spectrum of unperturbed material. For easier comparison, the spectra were offset. The arrows indicate the direction of the wavenumber shift for the Raman bands in the edge spectrum of the perturbed material. (b) Raman spectra collected with the MO of unperturbed material (baseline spectrum, dashed curve) and in-situ in the center of indentation on the thin specimen. The objective was focused on the edge of the indentation imprint. The Raman intensities of all spectra shown in Figures 3a and 3b were normalized in such a manner that the intensity of the D1 band was 1.5. The spectra are vertically shifted for a better visualization. (c) Z profiles of the MO and the CO for spectral measurements on the thin specimen. The MB wavenumbers (symbols) were determined by CM calculation from Raman spectra collected during the indentation of the thin specimen at 300 mN with the microscope objectives being shifted to various positions along the z axis into the specimen bulk. The solid and the dashed lines represent the MB wavenumber of the unperturbed material measured by the CO and the MO, respectively.
Using the CO configuration, significant changes in the spectral profile were seen in the center of the contact impression during indentation (Fig. 3a) compared to the baseline spectrum of the unperturbed material (for the spectral region not obfuscated by the Raman signal from the diamond probe). The MB, D2 and A bands were shifted to larger wavenumbers with the MB experiencing the largest upshift in peak position and at the same time a significant reduction in its peak intensity. The intensity of the D2 band seemed to be increased in relation to the A band. The DB1 band of the high-frequency doublet was shifted to lower wavenumbers. Similar spectral changes have been reported during plastic compression of fused silica at high pressures in DAC tests and their correlation to underlaying modifications of the silicate network structure has been discussed [6,7,18,45,46,60,63,65]. The described spectral changes were the largest in the surface spectrum (objective focused on the sample surface) and weakened with increasing distance from the sample surface into the specimen bulk. Upon shifting the position of the microscope objective 6 μm from the surface, the spectrum collected on the indented region was essentially indistinguishable from the baseline spectrum. To quantifiably analyze the spectral changes, the MB wavenumber was determined by CM fitting from the spectra collected at different focal distances from the surface. As can be seen in Fig. 3c, the MB wavenumber reverted gradually from 510 cm−1 (surface spectrum) back to 417 cm−1 at positions larger than 5 μm nominally equaling the MB wavenumber in the baseline spectrum. A similar result is obtained with the MP fitting method.
In the MO configuration, the edge spectrum collected in the center of the deformation zone was only marginally altered from the corresponding baseline spectrum of the unperturbed material (Fig. 3b). As mentioned earlier, all spectral profiles collected at increased distances from the sample surface in the contact impression closely resembled the surface spectrum. This is also reflected in the quantitative analysis of the MB wavenumber (Fig. 3c): the MB wavenumber was shifted slightly upward from 420 cm−1 in the baseline spectrum to 426 cm−1 but otherwise remained on this level independent of the focal distance at which Raman measurements were conducted.
Similarly diverging observations were made when comparing results from in-situ Raman measurements conducted during indentations of the thick specimen using the TO and MO configurations, respectively. Fig. 4a shows the baseline spectrum of the unperturbed material collected prior to the indentation (dashed line) and a spectrum collected in the center of the contact impression under an indentation force of 300 mN with the TO being focused at the edge of the impression (surface spectrum, solid line). For comparison with the surface spectrum obtained with the TO, Fig. 4b shows the corresponding spectrum collected in-situ in the MO configuration (indentation load: 300 mN, objective focused on surface at edge of impression, spectrum collected in center of contact impression). The baseline spectrum measured with the same objective was also included in that figure. Fig. 4c shows the MB wavenumbers determined by CM calculations from spectral data collected with the TO and the MO with the microscope objective being shifted away from the sample surface to different positions along the z axis into the specimen bulk. Also shown are the MB wavenumbers determined from the baseline spectra that were recorded with both objectives (solid or dashed lines). All of the analyzed spectra were recorded in the center of the indentation impression during an indentation with the force being held at 300 mN. The surface spectrum obtained in the TO configuration was significantly altered in comparison to the corresponding baseline spectrum of the unperturbed material (Fig. 4a), whereas the surface spectrum collected during indentation with the MO was essentially unchanged from its baseline (Fig. 4b). Shifting the microscope objective away from the sample surface did not affect the spectral profiles measured by the MO; all of the Raman spectra collected at different positions along the z axis closely resembled the surface spectrum. It was therefore not surprising that the MB wavenumbers determined from those spectral measurements had virtually the same value as can be seen in Fig. 4c. The spectral measurements performed with the TO at different position along the z axis clearly showed a different trend (Fig. 4c). For TO, the highest MB wavenumber was measured in the Raman spectra collected near the sample surface (surface spectrum, 518 cm−1) and at 1 μm below the surface (522 cm−1), respectively. When shifting the objective further away from the sample surface, the MB moved towards its baseline wavenumber. However, the spectral profile of the baseline spectrum was not quite fully recovered within the investigated position range. At a position of 7 μm below the surface, the MB wavenumber was still slightly larger (430 cm−1) than its position in the baseline spectrum (423 cm−1).
Fig. 4.

(a) Raman spectra collected with the TO of unperturbed material (dashed curve) and in-situ in the center of the indentation on the thick specimen. The objective was focused on the surface of the specimen at the edge the indentation feature. (b) Raman spectra collected with the MO of unperturbed material (dashed curve) and in-situ in the center of indentation on the thick specimen. The objective was focused on the surface of the specimen at the edge the indentation feature. The Raman intensities of all spectra shown in Figures 4a and 4b were normalized in such a manner that the intensity of the D1 band was 1.5 (c) Z profiles of the MO and the TO for spectral measurements on the thick specimen. The MB positions (symbols) were determined by CM calculation from Raman spectra collected during the indentation of the thick specimen at 300 mN with the objective being shifted to different positions along the z axis into the specimen bulk. The solid and the dashed lines represent the MB position in the baseline spectra recorded by the TO and the MO, respectively.
With two aberration-corrected objectives included in this study, it was also worth considering whether the two aberration-corrected objectives supply qualitatively similar spectral data or if the use of one objective is more advantageous than the other. Fig. 5 was devised to evaluate the two aberration-corrected objectives. Raman spectra collected in the center of the contact impression (indentation force: 300 mN, objective focused on the sample surface at the edge of the impression) using the CO and the TO are shown in Fig. 5a. The baseline spectrum of the unperturbed material is displayed as well for each objective. Fig. 5a contains replots of spectra shown in Figs. 3a and 4a without normalizing the Raman intensity in relation to a specific band as was done in the previous figures. Comparing the Raman spectra collected during indentation using the two objectives, similarities in their spectral responses were observed such as size and direction of the wavenumber shifts for the MB, D2, A and DB1 bands and changes in the relative band intensities. However, some differences in their spectral response were also seen. For example, an overall stronger background signal was detected in the spectra measured in the TO configuration. The reason for this might have been a larger susceptibility to spectral contributions from the diamond probe than in the CO configuration. Also, the intensity of the main and A bands appeared to be more severely diminished in the TO spectra than in CO measurements. Another important distinction between the two configurations can be seen in the evolution of the spectral profiles with distance from the sample surface, discussed here based on the shifts in the MB wavenumber. For easier comparison, the MB wavenumber data for both objectives previously shown (Figs. 3c and 4c) were replotted in the form of relative shifts in Fig. 5b. Within this figure, a relative shift of 0 represents the MB wavenumber in the baseline spectrum, a relative shift of 1 marks the largest shift of the MB wavenumber determined in Raman measurements in the center of the contact impression during indentation. Additionally, the relative MB shift determined by MP fitting from spectra collected in both configurations were given in that figure for different positions of the microscope objective along the z axis into the specimen bulk. The results from the two different fitting approaches (MP and CM) aligned quite well with each other. Therefore, a trendline of the z profile based on the combined data sets from both fitting approaches was determined and is shown as a dashed line for each optical configuration in Fig. 5b. The purpose of the trendlines is to serve as guides to the eyes only; no implications about the nature of the functional relationship of the data set should be drawn from the fitting function. For both objectives, the relative MB shift gradually approached a value of zero with increasing distance from the surface (Fig. 5b) reflecting a steady transition of the spectral profile from the surface spectrum near the glass surface towards the baseline spectrum at larger distances into the specimen bulk (as seen for CO configuration in Fig. 3a). However, the trendline of the CO data indicated an accelerated recovery of the spectral profile with depth in comparison to the TO configuration. Indeed, the focal depth at which the MB shift equaled zero and the spectral profile of the baseline spectrum was fully recovered, was estimated to be smaller for the CO (about 5 μm) than for TO configuration (> 7 μm).
Fig. 5.

(a) Raman spectra collected in-situ in the CO (upper graph) and the TO (lower graph) configurations of the unperturbed material (thin, black curve) and in the center of contact impression during indentation of fused silica samples (thick, colored curve). The objective was focused on the surface of the specimen at the edge the indentation feature. (b) Comparison of the relative MB shift in Raman spectra collected with the CO (full symbols) and the TO (empty symbols) with the objectives being shifted to different positions along the z axis into the specimen bulk. The MB wavenumbers determined by MP fitting and by CM calculation are shown as triangle and diamond symbols, respectively. The dashed lines representing trendlines of the combined sets of CM and MP data were added to guide the eye.
The indentation experiments during which the in-situ Raman measurements with both aberration-corrected configurations took place were conducted under comparable conditions. Therefore, the lateral size and depth of the contact impressions were of similar size which was confirmed by white-light images and force-displacement data collected during the indentation. Consequently, there is no obvious explanation rooted in contact mechanics that accounts for the discrepancy in the z-profile measurements between these two configurations.
3.3. Load-sequence experiments
Load-sequence experiments were conducted on fused silica samples using the two aberration-corrected objectives (TO and CO). The data sets collected with both objectives were analyzed as described in Section 2.3.2. Both data sets showed similar trends, but the spectral data collected with the CO were of superior quality as was demonstrated in the previous section. In the interest of brevity, only results stemming from the analysis of load-sequence data obtained with the CO are presented in the paper. Fig. 6a shows the baseline spectrum collected pre-indentation and Raman spectra recorded in-situ with different indentation forces (50 mN, 200 mN, 250 mN and 300 mN) being applied during the loading segment of the indentation experiment. The Raman spectra were recorded with the microscope objective being focused on the surface of the sample at the edge of the contact impression. To better illustrate the indentation-induced spectral changes, dotted lines indicate the wavenumbers of the signature bands of fused silica in the unperturbed state. Fig. 6b shows the relative MB shift as function of the applied indentation force during loading as determined by MP fitting and CM calculation (see Section 2.3.2). The relative MB shift is the difference between the wavenumber of the MB at an indentation force and its wavenumber in the baseline spectrum representing the unperturbed state of the material. During loading, the MB, D2 and A bands in the spectrum at 50 mN have shifted slightly to a higher wavenumber compared to the unperturbed material, while the DB1 band of the high-frequency doublet shifted to a lower wavenumber (Fig. 6a). The directions of the Raman shifts for those bands agree with in-situ observations for fused silica plastically deformed by hydrostatic pressure in DAC experiments [6,45,46,63,66]. The Raman shift of the DB2 band of the high-frequency doublet was difficult to ascertain due to obfuscation by a strong Raman peak originating from the diamond probe during the indentation. The position of the D1 band appears to be unchanged in the spectrum collected at 50 mN as well as at higher indentation forces. The Raman shifts of the MB, D2, A and DB1 bands were more pronounced in the spectrum collected at an indentation force of 200 mN than those observed at 50 mN. However, further increases in the indentation force to 250 mN and 300 mN resulted in only slightly larger Raman shifts for those bands. This behavior is quantitatively described for the MB in Fig. 6b. There, a trendline was added to illustrate the overall tendency in the data set showing the majority of the spectral shift being captured at indentation forces around 200 mN. The same tendency was seen independent of the approach used to determine the wavenumber of the MB (MP or CM), though the values of the relative shift differ between the two approaches due to their inherent differences in methodology. The spectrum at 300 mN in this experimental series was collected under comparable experimental conditions as the surface spectrum in the z-profile experiments using the CO (see Section 3.1, Fig. 3a). The spectral changes observed in the two spectra were similar; readers are referred to the related paragraph in Section 3.1 where the altered spectral profile of indented fused silica has already been described.
Fig. 6.

(a) Raman spectra collected in-situ with the CO prior to the indentation (pre) and during the indentation of fused silica with a pyramidal diamond probe at different indentation loads (loading segment of load-sequence experiment). The spectra were measured in the center of the indentation at the same location. The dotted lines are guides to the eye to assess shifts of characteristic Raman bands of unperturbed fused silica: MB… main band, D1/2… defect bands, A… asymmetric band, DB1/2… high-frequency doublet bands. The spectra are vertically shifted for a better visualization. (b) Relative shift of the main band in comparison to its peak position prior to indenting determined at different indentation forces during the unloading segment. The shifts of the MB position were obtained by MP fitting and CM calculation. The dashed lines represent trendlines for the data sets and serves only as to guide the eye.
It should be pointed out that an indentation force of 50 mN applied to the diamond probe induced plastic deformation of the fused silica sample as was demonstrated by the presence of a residual impression at the indentation site. Earlier observation shows that indentation loads must be limited to below 2 mN to sustain purely elastic behavior during indentations of fused silica with an acute diamond probe [67]. The average contact pressure pc was calculated to be 8.7 GPa ± 0.3 GPa (average ± one standard deviation) at 50 mN. Values for the contact area and the average contact pressure are given in Fig. 7 for the various indentation forces, at which in-situ Raman measurements took place during the loading and unloading segments of the indentation. The contact area was determined from bright field images taken in-situ during the indentation from the contact region of probe and sample. The average contact pressure pc was calculated using pc = F/A where F is the applied indentation force and A is the contact area between sample and probe. In the context of indentation, the calculated contact pressure represents the Meyer hardness of fused silica and is comparable to hardness data published for this material [68–70]. Due to the property of geometrical similarity of pyramidal probes, the contact area increases linearly with the indentation force, which has been seen in earlier in-situ optical observations of the contact region of indented glasses [71,72] and in the present study (see Fig. 7). Consequently, the average contact pressure should be constant during loading with a pyramidal probe, if probe curvature effects can be neglected. Indeed, variations of the calculated pc values with load are insignificant. With the intensity of the indentation stress field being load invariant (pc independent of F) for acute indenter probes [64] and under the absence of cracks, the structural changes related by indentation-induced strains should be comparable. Consequently, the corresponding spectral responses are expected to be equivalent for the various indentation forces applied [22]. Nevertheless, significant difference were found between the spectral data collected at the lowest and the highest indentation forces applied in this study. Fig. 8a shows the Raman spectra collected in the center of the indentation region at the maximum indentation force of 300 mN and for two other indentation forces (150 mN and 50 mN) during the unloading segment of the indentation. For comparison purpose, Raman spectra collected in the center of the residual impression after complete unloading (post-indentation) and prior to the indentation (pre-indentation) were also included in this figure; both represent sample-only spectra. For easier assessment of spectral changes, the position of the characteristic bands of fused silica in the unperturbed state are indicated by dotted lines. Fig. 8b shows the relative shift of the MB as determined by MP fitting and CM calculation (see Section 2.3.2) as a function of the applied indentation force during the unloading segment of the indentation. During unloading, the main spectral changes involved some reversal of the wavenumber shifts observed during loading for the various Raman bands (Fig. 8a, compare Fig. 6a). In the case of the MB, the wavenumber changed by about 10 cm−1 (CM) or 13 cm−1 (MP) during the unloading process (Fig. 8b) but never recovered to the wavenumber of the non-perturbed material. Shifts of the main Raman band towards lower wavenumbers were also observed in-situ during unloading after densification of fused silica in DAC tests [56,58,59]. A comparison between the spectra of the unperturbed material (pre-indentation) and the residual indentation (post-indentation) reveals, in addition to the permanent Raman shifts, a narrowing of the main band as well as an increase in the intensity of the D2 band relative to the main band. These irreversible spectral changes are in line with observations on residuals generated in indentation tests [9,62,73] and DAC experiments (if compressed beyond elastic threshold) [6,45,46,63,66] and are associated with a densification of the silicate network. Based on the Raman-density calibration curve derived from spectral shifts calculated by the CM method described by Deschamps et al. [63], a densification ratio of about 17.5 % was determined from the in-situ Raman measurement on the residual indentation (post indentation). Permanent densification ratios of about 21 % can be achieved during hydrostatic compression of fused silica at room temperature, [65,74] which may indicate that lower densification levels were achieved during the indentation conditions in this study than during hydrostatic compression. However, it is unclear to what extent the calibration relationship between the CM method spectral shift and densification as reported by Deschamps et al. is transferable between Raman spectra measured on different instruments. Subtle variations in spectral shape due to different instrument response functions may alter the quantitative calibration relationship and thus the ratio determined in this study should be viewed as an estimate. Nevertheless, the densification ratio determined in this study is in line with previous density measurements in residual impressions generated by Vickers indentations in fused silica at much higher indentation loads (16 % at 2 N [73] and 17.4 % at 20 N [62]). In these cases, the density was determined from the shift in D2 band. During unloading, the indentation-induced elastic strains relaxed, and the contact impression underwent a horizontal and vertical elastic recovery [75] altering the contact area. However, unlike the observations during loading, the contact area changed in a nonlinear fashion with respect to indentation force, and thus, the average contact pressure no longer remains constant upon removal of the indentation force (Fig. 7).
Fig. 7.

The correlations between contact area and indentation force (circles, black) and between indentation force and contact pressure (triangles, red) are shown for the loading (L, full symbols) and unloading (UL, empty symbols) segments of the indentation test. The lines are for guidance of the eyes: dashed lines for force-contact area data, dash-dot lines for force-contact pressure data. (For interpretation of the references to color in this figure legend, the reader is referred to the web version of this article.)
Fig. 8.

(a) Raman spectra collected in-situ with the CO in the residual impression (post) and during the indentation of fused silica with a pyramidal diamond probe at different indentation forces (unloading segment of the load-sequence experiment). For comparison purposes, the Raman spectrum collected prior to the indentation (pre) was also included. The spectra were measured in the center of the indentation at the same location. The dotted lines are guides to the eye to assess shifts of characteristic Raman bands of unperturbed fused silica: MB… main band, D1/2… defect bands, A… asymmetric band, DB1/2… high-frequency doublet bands. The spectra are vertically shifted for a better visualization. (b) Relative shift of MB at different indentation forces during the unloading segment. The MB shifts were obtained by MP fitting and CM calculation. The dashed lines are linear fits to the data sets to guide the eye.
4. Discussion
4.1. Baseline spectra
As stated earlier, minimizing the spectral contamination from unperturbed bulk material surrounding the deformed region is essential for optimizing Raman spectroscopic measurements on indented glasses. This requires maximizing the three-dimensional spatial resolution (i.e., minimizing the analysis volume) of the experimental setup employed in the spectroscopic measurements. The dependence of the analysis volume on a number of factors (e.g., thickness, opacity, and homogeneity of the sample, and optical configuration of the spectrometer) complicates theoretical calculations of its value, especially for indented glasses due to the non-planarity of the sample surface. However, differences in the analysis volume between various optical configurations can be evaluated experimentally. One possibility is to compare sample-only spectra and baseline spectra collected for individual configurations (see Section 3.1). The comparison also supplied a first indication of the suitability of an optical configuration for in-situ spectral measurements on indented glasses. Deviations of the baseline from the sample-only spectrum were seen for all optical configurations (see Fig. 2). They were attributed to convolution of the spectral signature of fused silica with Raman signals induced by the probe during in-situ Raman measurements with the probe close to (or in contact with) the sample. However, the varying degree of deviation between optical configurations hinted at differences in their susceptibility to spectral contributions from the probe (see Section 3.1) which are assumed to be caused by disparities in the analysis volume of the different microscope objectives. Based on the more severe deviation from the sample-only spectrum, the analysis volume in the MO configuration appeared to have been more expansive than in the baseline measurement conducted on the same sample thickness with an aberration-corrected objective (see Fig. 2a and 2b for the thin and Fig. 2c and 2d for the thick specimens). When using metallurgical objectives, the change in refractive index across the air/glass interface results in refraction and spherical aberrations. This causes an extended beam waist along the z axis and, thus, the analysis volume to expand. [24,76] The baseline spectrum recorded for the thick specimen with MO diverged more from the related sample-only spectrum than in the measurements on the thin specimen (compare Fig. 2b and 2d). This is due to the fact, that the degradation of the focal resolution scales with the thickness of the sample analyzed causing the analysis volume of MO to be farther extended. Hence, the spectral contribution of the probe was more pronounced in the spectral measurements on the thick specimen than on the thin sample.
The comparison of sample-only and baseline spectra for the different optical configurations showed that the integrity of in-situ Raman measurements was most affected when using the metallurgical objective. The aberration-corrected objectives appeared to be more suitable for in-situ Raman measurements on indented glasses as their tighter analysis volume limited the obfuscation of the Raman profile of the glass by spectral contributions from the probe. The ‘purest’ baseline spectrum was collected with CO indicating it as the optical configuration with the most confined analysis volume in this study.
4.2. Z-profile experiments
For a more quantitative assessment of the analysis volume, z-profile experiments were conducted in the different optical configurations (see Section 3.2) under the following premise: When indenting a glass sample with an acute diamond probe at 300 mN, material in a zone of finite dimensions beneath the probe was densified. With the microscope objective focused on the sample surface at the indentation edge in the contact region between probe and sample, the analysis volume of the microscope objective was expected to encompass a large section of that densified region. By shifting the nominal focal plane of the microscope objective step by step away from the sample surface into the specimen bulk and, thus, away from the densified region, the portion of densified material included in the analysis volume was gradually reduced.
If the analysis volume of the microscope objective were comparable in size to the dimension of the densified region, Raman spectrum collected at the sample surface (surface spectrum) should contain mainly spectral contributions associated with densified fused silica. During indentation, the material was exposed to a combination of hydrostatic pressure and shear stress. It is believed that shear stress does not affect the nature of the structural modifications in glass but only accelerates the densification process [12]. Indeed, studies on soda-lime silicate and aluminoborosilicate glasses showed similarities between spectra acquired on residuals of indentations and spectra recorded after hydrostatic compression [12,13]. Therefore, the surface spectrum collected during indentation was assumed to look very similar to the spectral profile of densified fused silica seen in DAC tests. When moving the microscope farther away from the densified region, the spectral contribution of the densified material was expected to weaken relative to Raman signal of the unperturbed material, which eventually would dominate the spectral profile. This spectral evolution was observed for both aberration-corrected objectives: The surface spectra showed significant deviations from the baseline spectrum of the unperturbed material (see Fig. 3a and 4a), that were in line with the spectral signature of densified fused silica reported in DAC studies, as previously explained. Raman spectra collected farther away from the sample surface showed less pronounced alterations and eventually could no longer be differentiated from the baseline spectrum of unperturbed material.
If, on the other hand, the analysis volume of the microscope objective was significantly larger than the densified volume, the Raman signal from the unperturbed material would represent the major spectral contribution in any position along the z axis. Consequently, densification-related spectral alterations would be reflected only in diminished form (e.g., as smaller band shifts) or not be noticeable at all (if the analysis volume was much larger than the deformation region) in the Raman spectra collected in the deformation region. This type of behavior was observed in the in-situ measurements using the MO. Compared to the corresponding spectral measurement obtained in an aberration-corrected configuration, the surface spectrum collected with the MO exhibited significantly less pronounced shifts in band position and changes in relative band intensity for the thin specimen (compare Fig. 3a and 3b). For the thick specimen, hardly any spectral alterations were seen in the spectral measurements in the MO configuration (compare Fig. 4a and 4b). Again, the difference in the spectral response seen between the thick and thin specimens for the MO configuration was caused by a more severe degradation of the focal resolution, resulting in a larger analysis volume on the thicker glass sample. As a consequence, the ratio of densified volume to analysis volume was reduced making Raman measurements with the MO on the thick specimen less sensitive to spectral contributions from the densified material than on thin glasses.
The position of the MB within the spectral profile of fused silica is related to the mean intertetrahedra angle of the silicate network, [6,45,48] which changes upon densification causing the MB to shift towards higher wavenumbers [2,49,60]. As MB shifts were the most prominent spectral alteration observed during the indentation of glasses in this study and could be determined in a robust and reliable way, the MB wavenumber were seen as an useful indicator of densification-induced spectral alterations. Z profiles were created by determining the MB wavenumber from Raman spectra collected in the z-profile experiments (see Section 3.2) and plotting them as a function of the objective position along the z axis. Comparing the MB wavenumbers contained in the z profile to its baseline position (representing the unperturbed state) facilitated the detection of spectral contributions from the densified material along the z axis (indentation axis) into the specimen bulk. In this way, z profiles can provide meaningful information about the analysis volume of an optical configuration and serve as a comparative measure of the analysis volume between optical configurations, as will be discussed in the following paragraphs.
Independent of the sample thickness, the shapes of the z profiles obtained for metallurgical and the aberration-corrected objectives were distinctively different (see Figs. 3c and 4c for the thin and the thick specimens, respectively). The z profiles collected with the MO resembled straight lines reflecting the close resemblance between all Raman spectra recorded in the z-profile experiments on the same sample thickness with this objective. For both thicknesses, the z profile was slightly shifted upwards from its baseline value indicative of small alterations to the spectral profile of fused silica during indentation (see Fig. 3b and 3c). The upshifts was smaller for the thick specimen (≈ 2 cm−1) than for thin one (≈ 8 cm−1). This was a consequence of the more degraded focal resolution of the MO in in-situ measurements on thicker samples and, therefore, a reduced capacity to detect densification-induced spectral alterations, as discussed earlier. On the other hand, the curved shape of z profiles of the aberration-corrected objectives reaffirmed this earlier observation: Spectral alterations (spectral contribution from densified materials) were largest with the microscope objective being focused on the sample surface and then gradually diminished with the focal plane shifted farther into the specimen bulk (see Fig. 3a). The main reason for the difference in z-profile shape between metallurgical and aberration-corrected objectives is believed to be the smaller analysis volume of the latter. As result, aberration-corrected objectives exhibit a higher sensitivity to changes in the volume ratio of densified to non-densified material, hence, stronger sensitivity to spectral contributions of the densified material.
For aberration-corrected objectives, a comparative plot of the z profiles of the two aberration-corrected objectives (see Fig. 5b) showed a steeper decline of the relative MB shift and shallower depth at which the spectra matched the unperturbed spectrum for CO than for TO. The intercept of the z profile with the line representing the wavenumber of unperturbed material marked the position along the z axis where the share of densified fused silica within the analysis volume has declined to such a degree that its spectral contribution could no longer be detected. Based on the intercept position, it was estimated that, the densified zone extended about 5 μm and more than 7 μm from the surface into the specimen bulk (under an applied indentation force of 300 mN) in CO and TO configurations, respectively. The reason for this discrepancy was not be believed to be variations in the size of their deformation regions but rather in their analysis volumes. An early indication of a slightly larger analysis volume for the TO was already seen during the evaluation of the baseline spectra (see Section 4.1). The z profiles of the two objectives shown in Fig. 5b provided further evidence for this assumption. The 1/e fall off for the data plots, which was assumed to represent the extension of the analysis volume along the indentation axis, was about 3 μm for the CO but about 4.5 μm for the TO. The spot size for the two objectives can be estimated based on the diffraction limit (spot size ≈ 1.22 • laser wavelength / NA). The spot sizes of 1 μm2 and 1.4 μm2 for the CO respective TO are probably low estimates, as the topography of the indentation impression may degrade the spot size in the in-situ measurement. Thereby, the analysis volumes were estimated to be roughly 3 μm3 and 6 μm3 for the CO and the TO configurations, respectively. Due to its larger analysis volume, spectral contributions of the densified regions were perceived further into the specimen bulk by the TO causing the deviation between the z profiles of the two objectives and an overestimation of the extension of the densification zone in the TO configuration.
Based on its tighter analysis volume, the estimate of the extent of the densified region was assumed to be more reliable when based on the spectral data collected with CO than in other optical configurations in this study. This estimate was found to be of the same order of magnitude as reported in previous experimental and simulation studies on fused silica: Raman measurements on cross-section of residual Vickers indentations (indentation force 500 mN) showed the densified region to extend up to 3 μm from the surface [77]. Based on an empirical relationship (vertical extension of densified zone ≈ 1.9 • maximum indentation depth) determined in chemical dissolution experiments on Berkovich indentations, [11] the extension along the indentation axis was estimated to be about 5 μm for indentations at 300 mN in this study. In indentation simulations with force and probe parameters as specified, the vertical extension of the densification zone was determined to be about about 2.7 μm (500 mN, conical probe equivalent to a Vickers probe) [77], 2.5 μm (500 mN, Berkovich probe) [78] and 4 μm (500 mN Vickers probe) [79], respectively.
The indentation experiments, during which the in-situ Raman measurements took place, were conducted with the same indentation parameters (maximum force, loading rate, probe) on the same sample (thin specimen for CO and MO, thick specimen for TO and MO). Consequently, comparable stress states should be expected in the center of the contact impression. Nevertheless, large differences in the spectral response to indentation-induced deformation were found between aberration-corrected and metallurgical microscope objectives. The analysis of baseline spectra and z-profile measurements showed that in-situ Raman measurements using the metallurgical objective severely underrepresented the actual spectral changes occurring in glass during indentation. Thereby, the MO configuration provided a less accurate or misleading depiction of related changes to the glass structure.
In this context, recently published in-situ spectral measurements of indented fused silica and soda-lime glasses should be mentioned, where Raman spectra were collected with a metallographic objective during Vickers indentation of 1 mm glass samples at indentation loads of 1 N and 5 N [21,80]. The shifts observed in-situ by Yoshida et al. for the spectral bands of fused silica were generally significantly less pronounced than observed in this study. For example, the MB shift at 5 N was determined to be about 34 cm−1 (data were digitized and analyzed by CM calculation) compared to about 95 cm−1 in the surface spectrum of CO in this study. Furthermore, the spectral profile collected in the residual contact impression was less altered from its unperturbed (pre-indentation) state than observed in this study or in ex-situ Raman measurements on residuals Vickers impressions generated by forces in Newton range [9,62,64]. A densification ratio of only 3% was determined from the spectrum of the residual (by applying the CM method [63] to data published in [21]), which was much lower than the 16 % to 17 % reported in other indentation studies [62,64,81]. The diminished spectral response observed by Yoshida et al. [21,80] was most likely be related to the use of a metallographic objective in their optical setup and its compromised performance in in-situ spectral measurements as demonstrated in this paper.
4.3. Load-sequence experiments
A most crucial observation of the load-sequence experiments with regards to the measurement science of collecting and interpreting confocal Raman data of indented glasses was the variation of the spectral response of fused silica during indentation loading (see Section 3.3). At first glance, this observation appeared to contradict contact mechanics theory. Based on contact mechanics, the intensity of the indentation stress field is load invariant for acute indenter probes (in indentations free of cracking and without occurrence of probe curvature effects) [64]. Therefore, the indentation-induced spectral response of the deformed glass is expected to be uniform across the applied indentation forces [22]. However, when giving proper consideration to the dimensional realities dictating the spectral measurements on indented glasses, the perceived load dependency of the spectral response can be interpreted differently, as will be shown shortly.
The analysis volume of the Raman beam and its relation to the deformation region, which may be described by the deformation volume-to-analysis volume ratio (DA ratio), are of critical importance to correctly interpreting in-situ (and ex-situ) Raman spectra of indented glasses. As has been mentioned previously, the analysis volume is determined by the technical specifications of the optical setup and by sample properties that may lead to refraction and aberration effects. The deformation volume generated in an indentation event is dependent on the mechanical properties of the sample as well as the experimental conditions and parameters applied during the indentation. For fused silica, permanent densification is the dominant deformation mode under indentation. [82–85] The contribution of densification to the total indentation volume was found to range from 85 % [84] up to 92 % [82,83] in indentations with Vickers probes, hence, the volume of densified material might be taken as an approximation for the deformation volume in fused silica indentations. The densification contribution might be slightly lower in the present indentation experiments due to the higher acuity of the indenter probe used. [86] Densification levels within the deformation region were determined between 15 % and 18 % in simulated indentations in the millinewton range [78,79,87] and in actual indentation tests in the newton range [62,73,81] with Berkovich and Vickers probes. Similar densification levels were determined in this study for the millinewton-indentations conducted with a more acute probe. The nature of the density distribution along the indentation axis within the deformation region is still a matter of discussion. In terms of densification levels, a homogeneous distribution with a steep transition to the non-densified material [11,19] as well as a heterogenous distribution [81] with a gradual transition have been suggested, respectively. The extension of the densified region along the indentation axis into the specimen bulk was estimated to be in the range of a few micrometers for indentation loads below 500 mN in simulations and indentation studies with acute indenter probes (see Section 4.2). The overall volume of material densified during indentations with Vickers probes was experimentally determined to 0.6 μm3 [79] or 0.95 μm3 [82] at 100 mN and 8.8 μm3 at 500 mN [79]. The densified volumes observed in simulated Vickers indentations were slightly higher with 1.2 μm3 at 100 mN and 13 μm3 at 500 mN [79].
Based on these values, the volume of densified material at 50 mN, 200 mN and 300 mN (relevant indentation forces applied in this studies) were estimated to be about 0.5 μm3, 3 μm3 and 6 μm3, respectively. Thus, the volume of densified material was assumed to be about 7 times larger at 200 mN and about 12 times larger at 300 mN compared to 50 mN. These estimates scaled roughly with changes in total indentation volume determined from the depth and contact area of residual impressions (obtained in separate tests) at those indentation loads. With the analysis volume of the CO configuration being roughly 3 μm3 (see Section 4.2) and independent of the changing indentation forces, the DA ratio was obviously altered by increasing the indentation force. This change in the DA ratio is believed to be the cause for the difference seen in the spectral response between the applied indentation forces in the load-sequence experiments. At an indentation force of 50 mN, an DA ratio of about 0.17 was obviously sufficient to detect some spectral signal from the densified material within the analysis volume. The Raman spectrum collected within the contact region at this load was clearly altered from the spectral signature of unperturbed fused silica (see Fig. 6a). Nevertheless, the spectral alterations were less pronounced at 50 mN than those seen at higher indentation forces. Clearly, the spectral profile convolving contributions from densified and non-densified regions was dominated by the Raman signal of the unperturbed material due to its larger volumetric presence in the analysis volume at this low indentation load. Increasing the indentation force meant shifting the DA ratio to higher values by enlarging the densified volume and, thereby, creating experimental conditions more favorable to observe the full extent of spectral changes due to indentation-induced densification. For an indentation force of 200 mN and beyond, DA ratios ≥ 1 were achieved indicating the spectral profile collected in the contact region was dominated by the Raman signal of the densified material. The Raman spectra collected under those conditions resembled each other very closely; variations between the spectra collected at 200 mN, 250 mN and 300 mN are hardly discernable in the comparative plot of Fig. 6a. The spectral analysis (CM and MP) showed only an insignificant deviation in the relative MB shift between the spectra collected at 200 mN and 300 mN (see Fig. 6b). The difference in the relative MB shift between the two highest indentation force was negligible. So, variations in the spectral response seen between 50 mN and 200 mN were not related to differences in the deformation of the glass structure (the densification levels at both loads was comparable, as confirmed in separate ex-situ Raman measurements). As has been shown, those spectral variations were linked to the presence of spectral contributions of the unperturbed bulk material attenuating the spectral signature of the densified glass in the deformation region.
To summarize: spectral measurements conducted with DA ratios ≥ 1 showed a largely uniform spectral response at varying indentation forces, because the analysis volume was maximally overlapped with the deformed region of the specimen. Under such circumstances, the in-situ spectroscopic measurements reflected the load-invariance of the indentation stress field expected in indentations with acute indenter probes (above plastic deformation threshold and below the cracking threshold). Load-sequence experiments as described in this paper may help to identify when such favorable DA ratios are achieved for spectroscopic measurements on indented glasses.
For a DA ratio < 1, the volumetric extent of densified material within the analysis volume changed with varying indentation forces. The resulting alterations to the spectral profile may be mistakenly interpreted as load-dependent modifications to the glass structure (and the correlated spectral features). However, volume-dependent changes in the contribution levels of densified and unperturbed material to the spectral profile were identified as true cause for the observed spectral changes. A few such correlations between applied indentation force and observed spectral modifications have been reported in recent years. Kilymis et al. studied the MB upshift as a function of the indentation force (varying from 1 N to 20 N) in ex-situ Raman measurements on residual Vickers impressions generated in sodium borosilicate glasses [15]. Ex-situ Raman maps on Vickers-indented soda-lime silicate glass showed higher MB shifts, hence, densification levels in the center of an indentation made at 20 N compared to a 10 N-indentation [12]. Winterstein-Beckmann et al. found an increase in MB upshift and decrease of the MB width at larger indentation forces in ex-situ Raman measurements on residual Vickers impression for fused silica and silica-rich alkali borosilicate glasses [9,88]. For fused silica, a change in the MB wavenumber from the unperturbed state of about 6 cm−1 and 43 cm−1 were determined in their study after indentation with forces of 0.49 N and 4.91 N, respectively [9]. An in-situ Raman study conducted during Vickers indentation of fused silica stated a broadening of Raman bands and increase of intensity of the D2 band when increasing the indentation force from 1.1 N to 5 N [21,80]. It is worth noting that ex-situ Raman measurements are generally less susceptible, but not completely immune, to the optical effects described in this paper that lead to larger than expected analysis volumes. Nevertheless, based on the findings in this study, it is possible that these observations were based on Raman measurements affected to some extent by low DA ratios and the resulting sensitivity of the spectral profile to variations in the amount of densified material contained within the analysis volume.
Another consequence of conducting Raman measurements at low DA ratios is the potential risk of misrepresenting the extent of indentation-induced spectral change and, hence, to undervalue the underlying alterations to the glass structure. In the indentation tests presented in this paper, a upshift of 85 cm−1 in the MB wavenumber was observed post-indentation for an indentation force of 300 mN, indicating a deformation state close to full densification of the silicate network. Yet, upshifts of only 11 cm−1 and 38 cm−1 were detected on residual indents generated at a substantially larger force of about 5 N in refs. [21] respectively [9] (when applying the CM method to data published in those papers). It is inconceivable that indentations conducted at ten times larger indentation forces would lead to lower densifications levels of the glass structure (even if the probe used this study is slightly more acute than in the Vickers probes in [9,21]).
5. Conclusions
The collection of high-quality spectral data that characterize accurately the spectral changes within the deformation region of indented glasses requires:
high signal to noise ratios which is of special importance for weak Raman scatterers such as glasses (ex-situ and in-situ measurements);
adequate DA ratios to limit or eliminate spectral contribution from the unperturbed specimen bulk (ex-situ and in-situ measurements);
low spectral contaminations stemming from non-glass related Raman signals with the indenter probe being the major contributor (in-situ measurements);
If these requirements are not met, the usefulness of the spectral data collected within the deformation region of indented glasses might be severely limited as:
the full extent of the actual indentation-induced spectral changes is only partially reflected in the collected Raman data;
spectral contributions from the probe may severely obfuscate the spectral signature of glass by elevating the spectrum baseline and possibly altering the shape, intensity and/or position of spectral bands;
perceived spectral variations may originate from changes in the DA ratio rather than reflect actual changes in the glass structure (degree of deformation);
To collect accurate high-quality spectral data, the three main components of an experimental setup, glass specimen, spectroscopic configuration and indentation parameters, and their intercorrelations need to be considered during setup, execution and analysis of spectral measurements on indented glasses (see Fig. 9). The optical components of the Raman spectroscopy setup (most importantly: size of confocal aperture, type of microscope objective, wavelength and power of laser source) must be carefully chosen in accordance with the optical properties and geometry of the glass sample to optimize the performance of the instrument with respect to signal to noise ratio and analysis volume. The analysis volume in turn is an essential parameter in defining the DA ratio for in-situ as well as ex-situ Raman measurements. In an in-situ setup, the analysis volume also determines the extent to which Raman signals from the indenter probe are detected and may obfuscate the spectral measurements on the indented glass sample. In this study, the MO exhibited a significantly larger analysis volume than the two aberration-corrected objectives (CO and TO), thereby, severely compromising the integrity of in-situ spectral measurements conducted on indented glasses and making this objective highly unsuitable for such measurement tasks. Among the aberration-corrected objectives, the spectral data collected with the CO were of superior quality. However, the TO is certainly a viable option for in-situ Raman measurements where limitations in the sample thickness imposed by using the CO might be an issue regrading mechanical stability or rigidity (stiffness) during sample preparation or indentation testing, respectively. The mechanical properties of the glass sample in combination with the test conditions applied in the indentation test (geometry and material of the probe, indentation force) define the size of the deformation volume based on the stress field induced during the indentation into the glass specimen. In indentations with acute probes (e.g. Berkovich, Vickers), the magnitude of the stress field and therefore, the degree of deformation is load-invariant (below crack formation). To evaluate spectral changes in glasses at varying magnitudes of stress, indenter probes with different geometry (e.g. conospherical or spherical probes) can be employed in in-situ Raman measurements.
Fig. 9.

Parameters to consider in in-situ and ex-situ Raman measurements on indented glasses.
As has been demonstrated in this study, maintaining a suitable value of the DA ratio in in-situ and ex-situ spectral measurements is crucial for accurately capturing the actual spectral alterations within the deformed region by maximally overlapping the analysis volume with the deformed region. DA ratios close to or greater than 1 ensure that the spectral profiles collected in the deformation zone are dominated by spectral contributions from the deformed material and Raman signals from the unperturbed bulk are minimized. Once the Raman spectroscopic configuration is setup for a particular glass sample, the analysis volume is a fixed entity and, so, changing the deformation volume is the only way to manipulate the DA ratio. Increasing the indentation force expands the size of the deformation volume and, thereby, allows the adjustment of the DA ratio. However, large indentation forces, particularly in indentations with acute probes, raise the possibility of crack initiation which might be detrimental to the spectral measurement. To stay well below the crack initiation threshold, force applied in indentation experiments need to be limited to the sub-Newton range. This paper described an experimental configuration based on aberration-corrected microscope objectives to enable meaningful in-situ Raman spectroscopic measurements during the indentation of glass materials in the millinewton force range.
Footnotes
Declaration of Competing Interest
The authors declare that they have no known competing financial interests or personal relationships that could have appeared to influence the work reported in this paper.
References
- [1].Galeener FL, Lucovsky G, Longitudinal optical vibrations in glasses: GeO2 and SiO2, Phys. Rev. Lett 37 (1976) 1474–1478, 10.1103/PhysRevLett.37.1474. [DOI] [Google Scholar]
- [2].Hehlen B, Inter-tetrahedra bond angle of permanently densified silicas extracted from their Raman spectra, J. Phys.: Condens. Matter 22 (2010) 025401, , 10.1088/0953-8984/22/2/025401. [DOI] [PubMed] [Google Scholar]
- [3].Vaccaro G, Buscarino G, Agnello S, Messina G, Carpanese M, Gelardi FM, Structural properties of the range-II- and range-III order in amorphous-SiO2 probed by electron paramagnetic resonance and Raman spectroscopy, Eur. Phys. J. B 76 (2010) 197–201, 10.1140/epjb/e2010-00189-y. [DOI] [Google Scholar]
- [4].Salmon PS, Huang L, Impact of pressure on the structure of glass and its material properties, MRS Bull. 42 (2017) 734–737, 10.1557/mrs.2017.210. [DOI] [Google Scholar]
- [5].Salmon PS, Zeidler A, Networks under pressure: the development of in situ high-pressure neutron diffraction for glassy and liquid materials, J. Phys. Condens. Matter 27 (2015) 133201, , 10.1088/0953-8984/27/13/133201. [DOI] [PubMed] [Google Scholar]
- [6].Williams Q, Hemley RJ, Kruger MB, Jeanloz R, High-pressure infrared spectra of α-quartz, coesite, stishovite and silica glass, J. Geophys. Res 98 (B12) (1993) 22157–22170, 10.1029/93JB02171. [DOI] [Google Scholar]
- [7].Vadembroucq D, Deschamps T, Coussa C, Perriot A, Barthel E, Champagnon B, Martinet C, Density hardening plasticity and mechanical ageing of silica glass under pressure: A Raman spectroscopic study, J. Phys. Condens. Matter 20 (2008) 485221stacks.iop.org/JPhysCM/20/485221. [Google Scholar]
- [8].Polian A, Brillouin scattering at high pressure: an overview, J. Raman Spectrosc 34 (2003) 633–637, 10.1002/jrs.1031. [DOI] [Google Scholar]
- [9].Winterstein-Beckmann A, Möncke D, Palles D, Kamitsos EI, Wondraczek L, A Raman-spectroscopic study of indentation-induced structural changes in technical alkali-borosilicate glasses with varying silicate network connectivity, J. Non-Cryst. Solids 405 (2014) 196–206, 10.1016/j.jnoncrysol.2014.09.020. [DOI] [Google Scholar]
- [10].Kermouche G, Guillonneau G, Michler J, Teisseire J, Barthel E, Perfectly plastic flow in silica glass, Acta Mater. 114 (2016) 146–153, 10.1016/j.actamat.2016.05.027. [DOI] [Google Scholar]
- [11].Guin J-P, Keryvin V, Charleux L, Han K, Sangleboeuf J-C, Ferry M, A chemical dissolution technique for challenging existing constitutive models of the densification process beneath an indentation imprint in amorphous silica, https://arxiv.org/abs/1601.06492, 2016. (accessed 13 December 2017).
- [12].Deschamps T, Martinet C, Bruneel JL, Champagnon B, Soda-lime silicate glass under hydrostatic pressure and indentation: a micro-Raman study, J. Phys. Condens. Matter 23 (2011) 035402, , 10.1088/0953-8984/23/3/035402. [DOI] [PubMed] [Google Scholar]
- [13].Kato Y, Yamazaki H, Yoshida S, Matsuoka J, Kanzaki M, Measurements of density distribution around Vickers indentation on commercial aluminoborosilicate and soda-lime silicate glasses by using micro Raman spectroscopy, J. Non-Cryst. Solids 358 (2012) 3473–3480, 10.1016/j.jnoncrysol.2012.04.035. [DOI] [Google Scholar]
- [14].Yoshida S, Nishikubo Y, Konno A, Sugawara T, Miura Y, Matsuoka J, Fracture- and indentation-induced structural changes of sodium borosilicate glasses, Int. J. Appl. Glass Sci 3 (2012) 3–13, 10.1111/j.2041-1294.2011.00077.x. [DOI] [Google Scholar]
- [15].Kilymis D, Faivre A, Michel T, Peuget S, Delaye J-M, Delrieu J, Ramonda M, Ispas S, Raman spectra of indented pristine and irradiated sodium borosilicate glasses, J. Non-Cryst. Solids 464 (2017) 5–13, 10.1016/j.jnoncrysol.2017.03.012. [DOI] [Google Scholar]
- [16].Giacomazzi L, Umari P, Pasquarello A, Medium-range structure of vitreous SiO2 obtained through first principle investigation of vibrational spectra, Phys. Rev. B 79 (2009) 064202, , 10.1103/PhysRevB.79.064202. [DOI] [PubMed] [Google Scholar]
- [17].Goller DD, Phillips RT, Sayce IG, Structural relaxation of SiO2 at elevated temperatures monitored by in situ Raman scattering, J. Non-Cryst. Solids 355 (2009) 1747–1754, 10.1016/j.jnoncrysol.2009.06.018. [DOI] [Google Scholar]
- [18].Rahmani A, Benoit M, Benoit C, Signature of small rings in the Raman spectra of normal and compressed amorphous silica: a combined classical and ab initio study, Phys. Rev. B 68 (2003) 184202, , 10.1103/PhysRevB.68.184202. [DOI] [Google Scholar]
- [19].Keryvin V, Gicquel S, Charleux L, Guin J-P, Nivard M, Sangleboeuf J-C, Densification as the only mechanism at stake during indentation of silica glass? Key Eng. Mater 606 (2014) 53–60, 10.4028/www.scientific.net/KEM.606.53. [DOI] [Google Scholar]
- [20].Shcheblanov NS, Mantisi B, Umari P, Tanguy A, Detailed analysis of plastic shear in the Raman spectra of SiO2 glass, J. Non-Cryst. Solids 428 (2015) 6–19, 10.1016/j.jnoncrysol.2015.07.035. [DOI] [Google Scholar]
- [21].Yoshida S, Nguyen TH, Yamada A, Matsuoka J, In-Situ Raman measurements on silicate glasses during Vickers indentation, Mater. Trans (2018) MD201901, , 10.2320/matertrans.MD201901. [DOI] [Google Scholar]
- [22].Malchow P, Johanns KE, Möncke D, Korte-Kerzel S, Wondraczek L, Durst K, Composition and cooling-rate dependence of plastic deformation, densification, and cracking in sodium borosilicate glasses during pyramidal indentation, J. Non-Cryst. Solids 419 (2015) 97–109, 10.1016/j.jnoncrysol.2015.03.020. [DOI] [Google Scholar]
- [23].Rodney D, Tanguy A, Vandembroucq D, Modeling the mechanics of amorphous solids at different length scale and time scale, Model. Simul. Mater. Sci. Eng 19 (2011) 083001, , 10.1088/0965-0393/19/8/083001. [DOI] [Google Scholar]
- [24].Everall NJ, Confocal Raman microscopy: common errors and artefacts, Analyst 135 (2010) 2512–2522, 10.1039/C0AN00371A. [DOI] [PubMed] [Google Scholar]
- [25].Everall N, The influence of out-of-focus sample regions on the surface specificity of confocal Raman microscopy, Appl. Spectrosc 62 (2008) 591–598, 10.1366/000370208784658057. [DOI] [PubMed] [Google Scholar]
- [26].Gross TM, Deformation J Non-Cryst. Solids 358 (2012) 3445–3452, 10.1016/j.jnoncrysol.2012.01.052. [DOI] [Google Scholar]
- [27].Kassir-Bodon A, Deschamps T, Martinet C, Champagnon B, Teisseire J, Kermouche G, Raman mapping of the indentation-induced densification of a soda-lime-silicate glass, Int. J. Appl. Glass Sci (2012) 1–7, 10.1111/j.2041-1294.2012.00078.x2012. [DOI] [Google Scholar]
- [28].Bartlet M, Delaye J-M, Charpentier T, Gennisson M, Bonamy D, Rouxel T, Roundtree CL, Hardness and toughness of sodium borosilicate glasses via Vickers’s indentations, J. Non-Cryst. Solids 417–418 (2015) 66–79, 10.1016/j.jnoncrysol.2015.02.005. [DOI] [Google Scholar]
- [29].Lancry M, Poumellec B, UV laser processing and multiphoton absorption processes in optical telecommunication fiber materials, Phys. Rep 523 (2013) 207–229, 10.1016/j.physrep.2012.09.008. [DOI] [Google Scholar]
- [30].Girard S, Kuhnhenn J, Gusarov A, Brichard B, Van Uffelen M, Ouerdane Y, Boukenter A, Marcandella C, Radiation effects on silica-based optical fibers: recent advances and future challenges, IEEE Trans. Nucl. Sci 60 (2013) 2015–2036, 10.1109/TNS.2012.2235464. [DOI] [Google Scholar]
- [31].Weigel C, Markweg E, Müller L, Schulze M, Gargouri H, Hoffmann M, A monolithic micro-optical interferometer deep etched into fused silica, Microelectron. Eng 174 (2017) 40–45, 10.1016/j.mee.2017.01.002. [DOI] [Google Scholar]
- [32].Atar G, Eger D, Bruner A, Sfez B, Ruschin S, Yb/Al-codoped fused silica planar waveguide amplifier, Opt. Mater 55 (2016) 49–54, 10.1016/j.optmat.2016.03.017. [DOI] [Google Scholar]
- [33].Del’Haye P, Arcizet O, Schliesser A, Holzwarth R, Kippenberger TJ, Full stabilization of a microresonator-based optical frequency comb, Phys. Rev. Lett 101 (2008) 053903, , 10.1103/PhysRevLett.101.053903. [DOI] [PubMed] [Google Scholar]
- [34].Maex K, Baklanov MR, Shamiryan D, Iacopi F, Brongersma SH, Yanovitskaya ZS, Low dielectric constant materials for microelectronics, Appl. Phys. Rev 93 (2003) 8793–8841, 10.1063/1.1567460. [DOI] [Google Scholar]
- [35].Chligui M, Guimbretière G, Canizarès A, Matzen G, Vaills Y, Simon P, New features in the Raman spectrum of silica: key-points in the improvement on structure knowledge, https://hal.archives-ouvertes.fr/hal-00520823 (accessed 31 January 2019).
- [36].Any mention of commercial products within this paper is for information only; it does not imply recommendation or endorsement by NIST.
- [37].Gerbig YB, Michaels CA, Forster AM, Hettenhouser JW, Byrd WE, Morris DJ, Cook RF, Indentation device for in situ Raman spectroscopic and optical studies, Rev. Sci. Instrum 83 (2012) 125106, , 10.1063/1.4769995. [DOI] [PubMed] [Google Scholar]
- [38].Gerbig YB, Michaels CA, Bradby JE, Haberl B, Cook RF, In situ spectroscopic study of the plastic deformation of amorphous silicon under nonhydrostatic conditions induced by indentation, Phys. Rev. B 92 (2015) 214110, , 10.1103/PhysRevB.92.214110. [DOI] [PMC free article] [PubMed] [Google Scholar]
- [39].Gerbig YB, Michaels CA, Cook RF, In situ observation of the spatial distribution of crystalline phases during pressure-induced transformations of indented silicon thin films, J. Mater. Res 30 (2015) 390–406, 10.1557/jmr.2014.316. [DOI] [Google Scholar]
- [40].Gerbig YB, Michaels CA, Cook RF, In situ observations of Berkovich indentation induced phase transitions in crystalline silicon films, Scr. Mater 120 (2016) 19–22, 10.1016/j.scriptamat.2016.04.007. [DOI] [PMC free article] [PubMed] [Google Scholar]
- [41].SRM 2242, Relative Intensity Correction Standard for Raman Spectroscopy: 532 nm Excitation, National Institute of Standards and Technology; U.S. Department of Commerce, Gaithersburg, MD, 2013. 22 October. [Google Scholar]
- [42].Hirsch KR, Holzapfel WB, Diamond anvil high-pressure cell for Raman spectroscopy, Rev. Sci. Instrum 52 (1981) 52–55, 10.1063/1.1136445. [DOI] [Google Scholar]
- [43].Adams DM, Payne SJ, Martin K, The fluorescence of diamond and Raman spectroscopy at high pressures using a new design of diamond anvil cell, Appl. Spectrosc 27 (1973) 377–381, 10.1366/000370273774333353. [DOI] [Google Scholar]
- [44].Bachmann PK, Wiechert DU, Optical characterization of diamond, Diam. Relat. Mater 1 (1992) 422–433, 10.1016/0925-9635(92)90141-A. [DOI] [Google Scholar]
- [45].Hemley RJ, Mao HK, Bell PM, Mysen BO, Raman spectroscopy of SiO2 glass at high pressure, Phys. Rev. Lett 57 (1986) 747–750, 10.1103/PhysRevLett.57.747. [DOI] [PubMed] [Google Scholar]
- [46].Polsky CH, Smith KH, Wolf GH, Effect of pressure on the absolute Raman scattering cross section of SiO2 and GeO2 glasses, J. Non-Cryst. Solids 248 (1999) 159–168, 10.1016/S0022-3093(99)00238-0. [DOI] [Google Scholar]
- [47].Grimsditch M, Polymorphism in amorphous SiO2, Phys. Rev. Lett 52 (1984) 2379–2381, 10.1103/PhysRevLett.52.2379. [DOI] [Google Scholar]
- [48].McMillan P, Structural studies of silicate glasses and melts - applications and limitations of Raman spectroscopy, Am. Mineral 69 (1984) 622–644. [Google Scholar]
- [49].Burgin J, Guillon C, Langot P, Vallée F, Hehlen B, Foret M, Vibrational modes and local order in permanently densified silica glasses: femtosecond and Raman spectroscopy study, Phys. Rev. B 78 (2008) 184203, , 10.1103/PhysRevB.78.184203. [DOI] [Google Scholar]
- [50].Galeener FL, Planar rings in glasses, Solid State Commun. 44 (182) 1037-1040.10.1016/0038-1098(82)90329-5. [Google Scholar]
- [51].Pasquarello A, Car R, Identification of Raman defect lines as signatures of ring structures in vitreous silica, Phys. Rev. Lett 80 (1998) 5145–5147, 10.1103/PhysRevLett.80.5145. [DOI] [Google Scholar]
- [52].To TT, Bougeard D, Smirnov KS, Molecular dynamics study of the vibrational pattern of ring structures in the Raman spectra of vitreous silica, J. Raman Spectrosc 39 (2008) 1869–1877, 10.1002/jrs.2052. [DOI] [Google Scholar]
- [53].Wilson M, Madden PA, Hemmati M, Angell CA, Polarization effects, network dynamics, and the infrared spectrum of amorphous SiO2, Phys. Rev. Lett 77 (1996) 4023–4026, 10.1103/PhysRevLett.77.4023. [DOI] [PubMed] [Google Scholar]
- [54].Taraskin SN, Elliott SR, Nature of vibrational excitations in vitreous silica, Phys. Rev. B 56 (1997) 8605–8622, 10.1103/PhysRevB.56.8605. [DOI] [Google Scholar]
- [55].Sarntheim J, Pasquarello A, Car R, Origin of the high-frequency doublet in the vibrational spectrum of vitreous SiO2, Science 275 (1997) 1925–1927, 10.1126/science.275.5308.1925. [DOI] [PubMed] [Google Scholar]
- [56].Champagnon B, Martinet C, Boudeulle M, Vouagner D, Coussa C, Deschamps T, Grosvalet L, High pressure elastic and plastic deformations of silica: in situ diamond anvil cell Raman experiments, J. Non-Cryst. Solids 354 (2008) 569–573, 10.1016/j.jnoncrysol.2007.07.079. [DOI] [Google Scholar]
- [57].Deschamps T, Martinet C, de Ligny D, Champagnon B, Elastic anomalous behavior of silica glass under high-pressure: in-situ Raman study, J. Non-Cryst. Solids 355 (2009) 1095–1098, 10.1016/j.jnoncrysol.2009.01.045. [DOI] [Google Scholar]
- [58].Wakabayashi D, Funamori N, Sato T, Taniguchi T, Compression behavior of densified SiO2 glass, Phys. Rev. B 84 (2011) 144103, , 10.1103/PhysRevB.84.144103. [DOI] [Google Scholar]
- [59].Sonneville C, Mermet A, Champagnon B, Martinet C, Margueritat J, de Ligny D, Deschamps T, Balima F, Progressive transformations of silica glass upon densification, J. Chem. Phys 137 (2012) 124505, , 10.1063/1.4754601. [DOI] [PubMed] [Google Scholar]
- [60].Sonneville C, Deschamps T, Martinet C, de Ligny D, Mermet A, Champagnon B, Polyamorphic transitions in silica glass, J. Non-Cryst. Solids 382 (2013) 133–136, 10.1016/j.jnoncrysol.2012.12.002. [DOI] [Google Scholar]
- [61].Heili M, Poumellec B, Burov E, Gonnet C, Le Losq C, Neuville DR, Lancry M, The dependence of Raman defect bands in silica glasses on densification revisited, J. Mater. Sci 51 (2016) 1659–1666, 10.1007/s10853-015-9489-8. [DOI] [Google Scholar]
- [62].Benzine O, Bruns S, Pan Z, Durst K, Wondraczek L, Local deformation of glasses is mediated by rigidity fluctuation on nanometer scale, Adv. Sci 5 (2018) 1800916, , 10.1002/advs.201800916. [DOI] [PMC free article] [PubMed] [Google Scholar]
- [63].Deschamps T, Kassir-Bodon A, Sonneville C, Margueritat J, Martinet C, de Ligny D, Mermet A, Champagnon B, Permanent densification of compressed silica glass: a Raman-density calibration curve, J. Phys. Condens. Matter 25 (2013) 025402, , 10.1088/0953-8984/25/2/025402. [DOI] [PubMed] [Google Scholar]
- [64].Perriot A, Vandembroucq D, Barthel E, Martinez V, Grosvalet L, Ch. Martinet, B. Champagnon, Raman microspectroscopic characterization of amorphous silica plastic behavior, J. Am. Ceram. Soc 89 (2006) 596–601, 10.1111/j.1551-2916.2005.00747.x. [DOI] [Google Scholar]
- [65].Rouxel T, Ji H, Hammouda T, Moréac A, Poisson’s ratio and the densification of glass under high pressure, Phys. Rev. Lett 100 (2008) 225501, , 10.1103/PhysRevLett.100.225501. [DOI] [PubMed] [Google Scholar]
- [66].Poe BT, Romano C, Henderson G, Raman and XANES spectroscopy of permanently densified vitreous silica, J. Non-Cryst. Solids 341 (2004) 162–169, 10.1016/j.jnoncrysol.2004.04.014. [DOI] [Google Scholar]
- [67].Woirgard J, Tromas C, Girard JC, Audurier V, Study of the mechanical properties of ceramic materials by the nanoindentation technique, J. Eur. Ceram. Soc 18 (1998) 2297–2305, 10.1016/S0955-2219(98)00083-1. [DOI] [Google Scholar]
- [68].Sellappan P, Rouxel T, Celarie F, Becker E, Houizot P, Conradt R, Composition dependence of indentation deformation and indentation cracking in glass, Acta Mater. 61 (2013) 5949–5965, 10.1016/j.actamat.2013.06.034. [DOI] [Google Scholar]
- [69].Schiffmann KI, Area function calibration in nanoindentation using the hardness instead of Young’s modulus of fused silica as reference value, Int. J. Mater. Res 98 (2007) 424–429, 10.3139/146.101488. [DOI] [Google Scholar]
- [70].Keryvin V, Charleux L, Hin R, Guin J-P, Sangleboeuf J-C, Mechanical behavior of fully densified silica glass under Vickers indentation, Acta Mater. 129 (2017) 492–499, 10.1016/j.actamat.2017.03.008. [DOI] [Google Scholar]
- [71].Sakai M, Hakiri N, Miyajima T, Instrumented indentation microscope: a powerful tool for the mechanical characterization in microscales, J. Mater. Res 21 (2006) 2298–2303, 10.1557/jmr.2006.0276. [DOI] [Google Scholar]
- [72].Yoshida S, Kato M, Yokota A, Saski S, Yamada A, Matsuoka J, Soga N, Kurkjian CR, Direct observation of indentation deformation and cracking of silicate glasses, J. Mater. Res 30 (2015) 2291–2299, 10.1557/jmr.2015.214. [DOI] [Google Scholar]
- [73].Lawn BR, Cook RF, Probing material properties with sharp indenter: a retrospective, J. Mater. Sci 47 (2012) 1–22, 10.1007/s10853-011-5865-1. [DOI] [Google Scholar]
- [74].Guerette M, Ackerson MR, Thomas J, Yuan F, Watson EB, Walker D, Huang L, Structure and properties of silica glass densified in cold compression and hot compression, Sci. Rep 5 (2015) 15343, 10.1038/srep15343. [DOI] [PMC free article] [PubMed] [Google Scholar]
- [75].Ziemath EC, Herrmann PSP, Densification and residual stresses induced in glass surfaces by Vickers indentations, J. Non-Cryst. Solids 273 (2000) 19–24, 10.1016/S0022-3093(00)00140-X. [DOI] [Google Scholar]
- [76].Froud CA, P Hayward I, Laven J, Advances in the Raman depth profiling of polymer laminates, Appl. Spectrosc 57 (2003) 1468–1474, 10.1366/000370203322640099. [DOI] [PubMed] [Google Scholar]
- [77].Rouxel T, Driving force for indentation cracking in glass: composition, pressure and temperature dependence, Phil. Trans. R. Soc. A 373 (2015) 20140140, , 10.1098/rsta.2014.0140. [DOI] [PMC free article] [PubMed] [Google Scholar]
- [78].Molnár G, Kermouche G, Barthel E, Plastic response of amorphous silicates, from atomistic simulations to experiments – A general constitutive relation, Mech. Mater 114 (2017) 1–8, 10.1016/j.mechmat.2017.07.002. [DOI] [Google Scholar]
- [79].Jebahi M, André D, Dau F, Charles J, Iordanoff I, Simulation of Vickers indentation of silica glass, J. Non-Cryst. Solids 378 (2013) 15–24, 10.1016/j.jnoncrysol.2013.06.007. [DOI] [Google Scholar]
- [80].Yoshida S, Indentation deformation and cracking in oxide glass – toward understanding of crack nucleation, J. Non-Cryst. Solids X 1 (2019) 100009, , 10.1016/j.nocx.2019.100009. [DOI] [Google Scholar]
- [81].Sung Y, Yoshida S, Kato Y, Kurkjian C, Three-dimensional densification measurement of Vickers-indented glass using digital holographic tomography, J. Am. Ceram. Soc 102 (2019) 5866–5872, 10.1111/jace.16508 in press. [DOI] [Google Scholar]
- [82].Yoshida S, Sanglebœuf J-C, Rouxel T, Quantitative evaluation of indentation-induced densification in glass, J. Mater. Res 20 (2005) 3404–3412, 10.1557/jmr.2005.0418. [DOI] [Google Scholar]
- [83].Ji H, Keryvin V, Rouxel T, Hammouda T, Densification of window glass under very high pressure and its relevance to Vickers indentation, Scr. Mater 55 (2006) 1159–1162, 10.1016/j.scriptamat.2006.08.038. [DOI] [Google Scholar]
- [84].Rouxel T, Ji H, Guin JP, Augereau F, Rufflé B, Indentation deformation mechanism in glass: densification versus shear flow, J. Appl. Phys 107 (2010) 094903, , 10.1063/1.3407559. [DOI] [Google Scholar]
- [85].Yuan F, Huang L, Brittle to ductile transition in densified silica glass, Sci. Rep 4 (2014) 5035, 10.1038/srep05035. [DOI] [PMC free article] [PubMed] [Google Scholar]
- [86].Yoshida S, Sawasato H, Sugawara T, Miura Y, Matsuoka J, Effects of indenter geometry on indentation-induced densification of soda-lime glass, J. Mater. Res 11 (2010) 2203–2211, 10.1557/jmr.2010.0287. [DOI] [Google Scholar]
- [87].Xi K, Lambropoulos JC, Densification of Fused Silica: Effects on Nanoindentation, Proceedings of the SPIE, 4102 2000, pp. 112–121, , 10.1117/12.405275. [DOI] [Google Scholar]
- [88].Winterstein-Beckmann A, Möncke D, Pallas D, Kamitsos EI, Wondraczek L, Raman spectroscopic study of structural changes induced by micro-indentation in low alkali borosilicate glasses, J. Non-Cryst. Solids 401 (2014) 110–114, 10.1016/j.jnoncrysol.2013.12.038. [DOI] [Google Scholar]