

Abstract
High-speed thermography is useful tool for researching the laser powder bed fusion process by providing thermal information in heat affected zone. However, it is not directly possible to ascertain the position of the laser spot with respect to the melt pool, which could provide key information regarding how laser energy is distributed and absorbed.
In this paper, we demonstrate a procedure for registering the laser spot position with the melt pool using a bright illumination source co-axially aligned with the laser to project a sharp spot on the build plane. This spot is fixed to the laser position and used as a reference frame for registering the laser spot with the melt pool radiance temperature distribution. Measurement results demonstrate the effect of varying process parameters (laser power and scan speed) on the melt pool thermal field and respective position of the laser spot.
Keywords: Laser powder bed fusion, Additive manufacturing, Thermography
1. Introduction
The physics of the LPBF process exhibit a wide range of temperatures (up to or beyond 3000 °C), large temperature gradients (105 °C/m to 107 °C/m), high surface heating and cooling rates (103 °C/s to 106 °C/s), and small melt pool scale (<1 mm) [1]. Optimization of the material melting, as well as layer-by-layer fabrication of parts, is a nontrivial task. For this purpose, multi-physics simulations are used to numerically replicate the process [2,3], and precise measurements are required to inform and validate these simulations. One important factor is the exact position of energy input relative to the melt pool. Measurement of this factor can guide development of energy input models [4], keyhole or vapor depression models [3,5], or melt pool fluid convection [6]. Ultimately, simulations of melt pool phenomena can guide estimation of the resultant solidified microstructure [7–9]. However, the spatial relationship between laser input and melt pool shape or temperature field is seldom observed or highlighted.
Few studies have attempted to correlate the laser spot position to melt pool phenomena. For instance, Hooper [10] indicated the position of the laser beam coincides with the hottest area in the molten pool. In contrast, Gusarov et al. [11] simulated the effect of scanning speed on the temperature distribution and melt pool size using a conduction based model, which always resulted in the peak temperature located behind the laser profile. Khairallah et al. [2] showed a more complex effect of recoil pressure and Marangoni convection in the melt pool flow which creates complex variations in molten pool surface temperature. Leung et al. showed the position of the laser with respect to vapor depression (without temperature measurement) using high speed X-ray imaging [12].
This paper describes a method for measuring the spatial position of a laser beam relative to the radiance temperature distribution in the melt pool. This enables direct measurement of the laser energy distribution with respect to a surface temperature map of the heat-affected zone (HAZ). This technique allows key physical relationships between the laser energy input and resulting thermal field to be explored.
2. Measurement methods
Measurements were performed on a custom LPBF system called the Additive Manufacturing Metrology Testbed (AMMT). A high-speed, high magnification staring imaging system (static field of view position directly in working zone) was constructed with a long working distance (54 mm) microscope lens, 520 nm bandpass filter, laser cut-off filter at 1000 nm, and attached mirror that allows close-range observation of the melt pool without obstructing the laser (Fig. 1). The camera resolution was 3.07 μm/pixel and frame rate set to 20 000 frames/s. A green laser (532 nm, 0.25 mW) is installed on the same optical path as the ‘hot’ laser (1070 nm, up to 500 W). The green laser is passed through a field stop to project a sharp spot on working surface inside the AMMT chamber. Both green and hot laser focus points are observed in the same camera field of view (Fig. 1). The distance between two laser spots is fixed, and does not change as both lasers scan across the field of view, thereby providing an observable reference position for the invisible 1070 nm hot laser.
Fig. 1.

Schematic and photograph of the AMMT optical system(s) including 532 nm illumination laser, 1070 nm high power heating laser, and high-speed camera.
To measure temperature, any camera must be calibrated against a reference radiance source tied to temperature through Planck’s radiation law. The AMMT has an in-situ calibrator called the transfer integrating sphere source (TISS), which incorporates four thermally stabilized light-emitting diodes (LEDs) which illuminate an integrating sphere at 520 nm wavelength (calibration range 1500 °C to 2500 °C, fitting uncertainty 1.5 °C). Calibration of the staring camera consists of three stages:
Calibrate a transfer pyrometer (λ= 520 nm, called TSP520) against a high temperature blackbody (HTBB) source [13], relating pyrometer signal to HTBB temperature.
Calibrate the TISS using the TSP520, relating the LEDs control current to the indicated pyrometer temperature.
Calibrate the camera against the TISS, relating the digital level (signal) of the camera reference temperature of the TISS.
The HTBB has temperature range 500 °C to 2500 °C, emissivity ϵ ≈ 0.995, and uncertainty of 0.7 °C at 1300 °C and 1.2 °C at 1700 °C [13]. The TSP520 pyrometer has temperature range 1500 °C to 2500 °C, fitting uncertainty 0.7 °C, and repeatability 2.5 °C to 9 °C. Thermal calibrations were up to 2500 °C.
With the thermally calibrated staring camera, a multi-step measurement procedure was designed to simultaneously measure the melt pool thermal field, the projected green laser spot, and the position of the heating laser spot profile (Fig. 2). In step 1, an upward facing imaging array (2.2 μm/pixel) is used to measure the attenuated (by 8 to 9 orders of magnitude) 1070 nm laser spot power distribution. A profile of 86.6% peak laser (representing D4σ width) power is extracted.
Fig. 2.

Diagram demonstrating measurement steps.
The staring imager is installed, and the green laser and hot laser are statically positioned on a metal substrate (step 2). The centroid of each spot (green laser at 80% of its peak and melt pool at 5% of its peak signal) is found, and distance between them measured (Δ1). Since the staring imager is not sensitive to the hot laser wavelength, this method assumes the centroid of the stationary melt pool coincides with the center/peak of the heating laser power profile.
In step 3, the hot laser is scanned on the test substrate at a spec-ified power and speed, and high-speed images acquired. The centroid position for the green laser spot (step 4a) and the melt pool peak (centroid of 5% of peak level, step 4b) are determined, and difference in positions found (Δ2). Finally, the relative offset between the melt pool’s hottest spot and the center of the heating laser is determined from Δ1 - Δ2, which allows the laser spot position to be coordinated and overlaid on the measured melt pool radiance temperature isotherms.
3. Experiment and measurement parameters
All experiments were conducted on bare nickel alloy (IN625) and titanium alloy (Ti6Al4V) plates and repeated on single powder layers of the same respective alloy. A purge box in the AMMT incorporated argon flow and an oxygen sensor (O2 ≤ 0.1%). Bare plates were sanded with 600 grit sandpaper. Powder layer thickness was approximately 50 μm for IN625 and approximately 80 lm for Ti6Al4V. Energy input per unit length (power/speed) of 0.25 J/mm was constant, with laser powers from 100 W to 350 W and scanning speed from 400 mm/s to 1400 mm/s. Each track was 14 mm long, but the measurement was performed over a 1 mm length at the midpoint of the track (averaging about 40 frames for low speeds and 20 frames for high speeds). The same scan parameters were repeated on all four samples. Laser spot D4σ diameter was set to 62 μm.
4. Results and discussion
Despite constant power to speed ratio (P/V), the dimensions of the molten pool, especially length, significantly increased as shown in Fig. 3 and observed in other work [14]. However, peak measured radiance temperature at all scanning parameters varied less than 100 °C. The slight asymmetry of the laser profile visibly affects the temperature distribution, seen on the IN625 at 350 W and 1400 mm/s in Fig. 3.
Fig. 3.
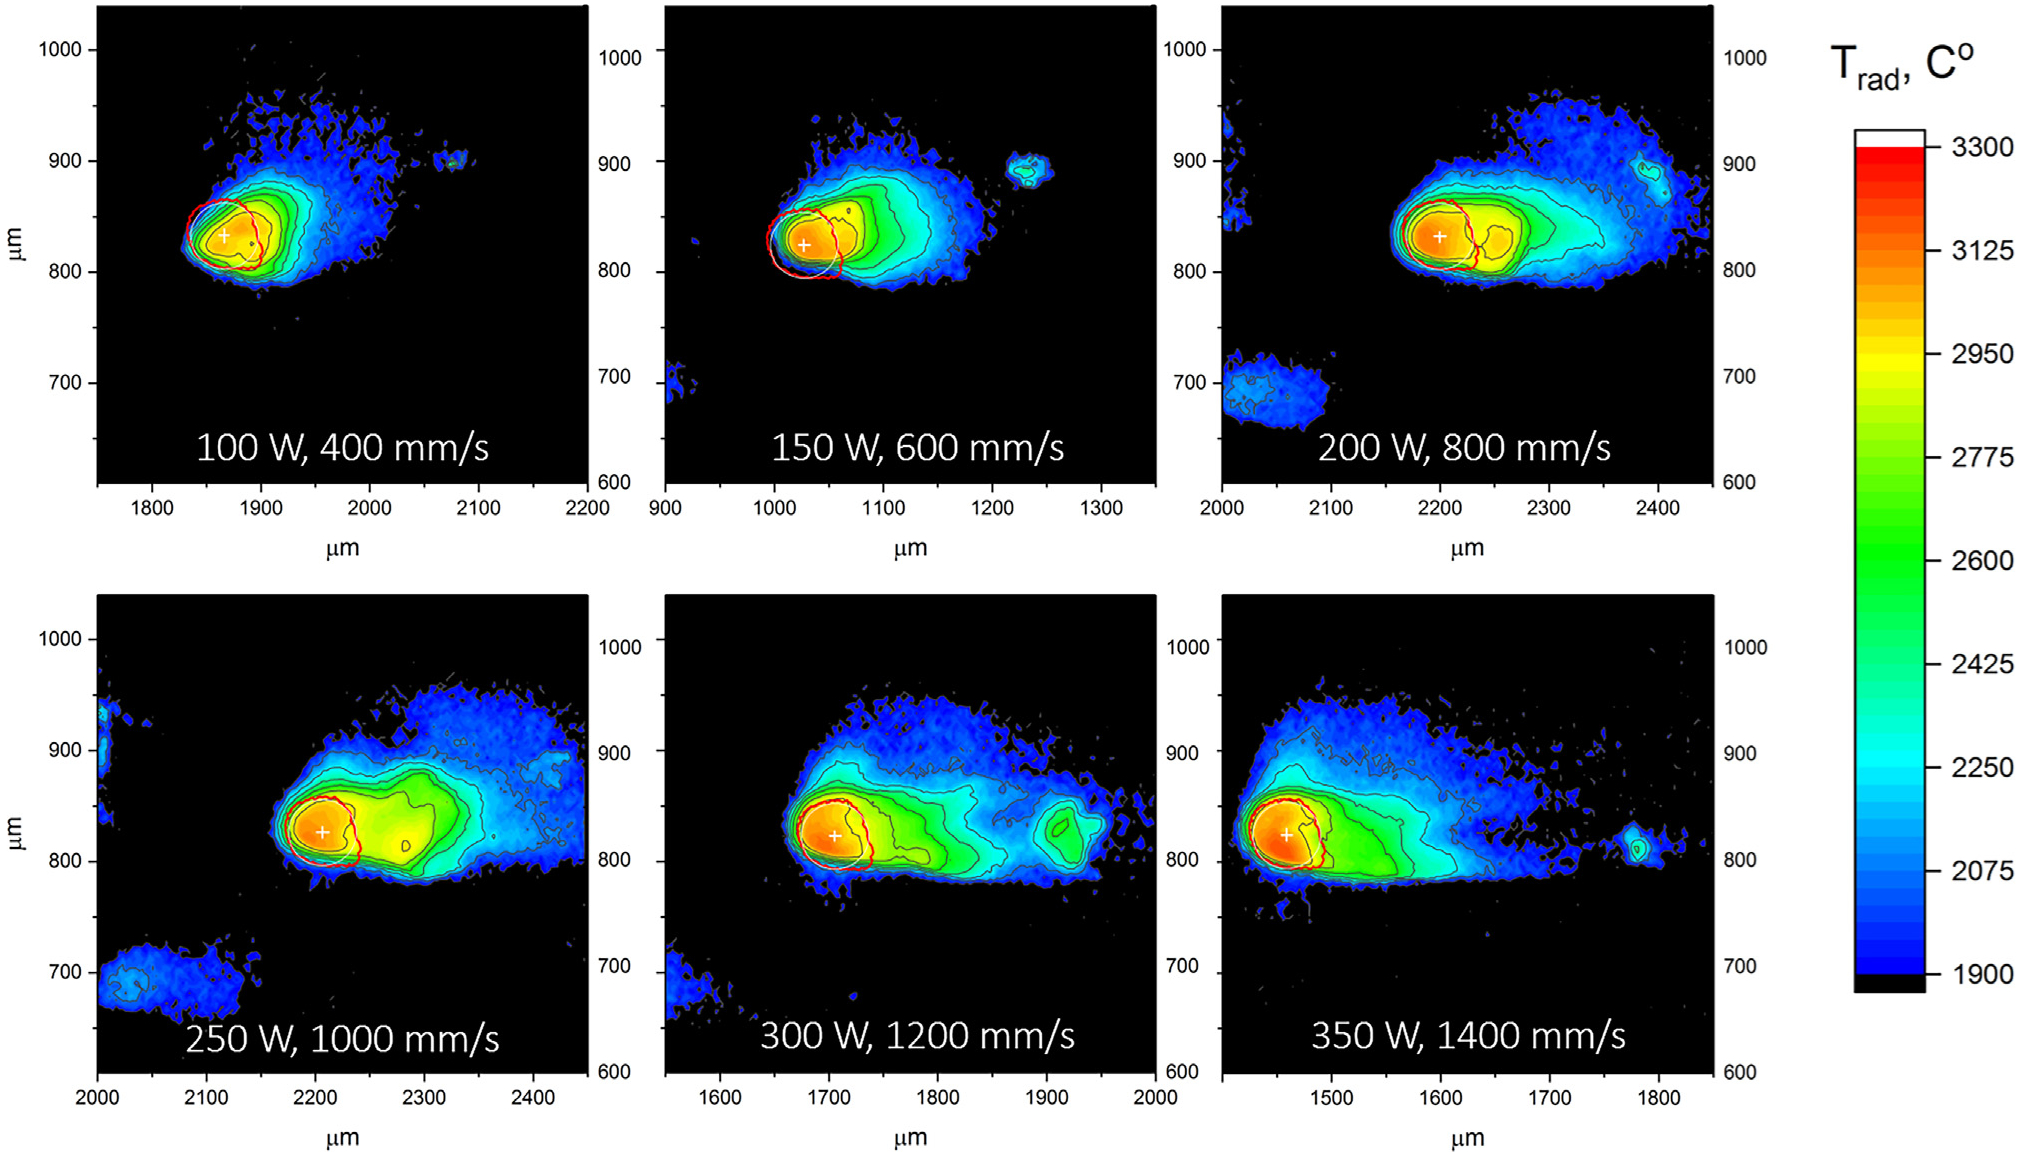
Example thermographic video frames of the IN625 bare plate substrate at different laser power and speeds. The red circle indicates location of the laser profile at 86.6% of the peak power.
The plots in Fig. 4 show that the peak radiance temperature shifts with increasing energy and moves forward relative to the scanning direction for all materials. Comparing the bare plate versus powder for the same material, the opposite trend occurs. The temperature peak leads the laser for IN625 bare substrate but aligns or lags for the powder. For Ti6Al4V bare plate, the laser leads the peak temperature, but is closer to the laser in powder.
Fig. 4.

Central profiles of melt pool images at different process conditions relative to the laser spot power profile (red).
The location of the peak temperature varied from ±1 μm to ±10 μm between video frames (1σ) for different power, speed, and materials. For the materials used, with increasing P/V, the radiance temperature peak shifts to the positive scanning direction. This shift might happen due to an increased metal evaporation, high recoil pressure, and steeper depression of the molten pool, as well as the occurrence of strong flows that contribute to the formation of an intense mass ejection of the melt, as well as non-uniform heating of the cavity wall due to reflection and scattering of the laser energy [2]. Variations due to powder vs. no powder, input laser energy, and material thermal properties have shown to affect the laser absorption [15] as well as vapor depression shape [12]. Nevertheless, this is an ongoing study and the proposed measuring method contributes to the metrological basis for further physical understanding.
5. Conclusions
This research demonstrates a method to measure laser spot position relative to the radiance temperature distribution of the melt pool during LPBF single-track scans. The displacement of the peak radiance temperature relative to the laser spot is statistically distinguishable. With increasing power to speed ratio, melt pool temperature isotherms increase in size and the peak radiance temperature moves forward relative to the scanning direction. Future experiments will include a 850 nm reference laser spot, and extend the temperature range to include the melt pool solidification boundary.
Footnotes
Declaration of Competing Interest
The authors declare that they have no known competing financial interests or personal relationships that could have appeared to influence the work reported in this paper.
References
- [1].Smurov I, Doubenskaia M. Temperature monitoring by optical methods in laser processing Laser-Assisted Fabrication of Materials. Berlin Heidelberg: Springer-Verlag; 2013. p. 373–422. [Google Scholar]
- [2].Khairallah SA, Anderson AT, Rubenchik AM, King WE. Laser powder-bed fusion additive manufacturing: physics of complex melt flow and formation mechanisms of pores, spatter, and denudation zones. Additive Manufacturing Handbook: Product Development for the Defense Industry, 2017. doi: 10.1201/9781315119106. [DOI] [Google Scholar]
- [3].Francois MM, Sun A, King WE, Henson NJ, Tourret D, Bronkhorst CA, et al. Modeling of additive manufacturing processes for metals: Challenges and opportunities. Curr Opin Solid State Mater Sci 2017. 10.1039/F29888401683. [DOI] [Google Scholar]
- [4].Shen F, Yuan S, Chua CK, Zhou K. Development of process efficiency maps for selective laser sintering of polymeric composite powders: Modeling and experimental testing. J Mater Process Technol 2018. 10.1016/j.jmatprotec.2017.11.027. [DOI] [Google Scholar]
- [5].Klassen A, Scharowsky T, Körner C. Evaporation model for beam based additive manufacturing using free surface lattice Boltzmann methods. J Phys D Appl Phys 2014. 10.1088/0022-3727/47/27/275303. [DOI] [Google Scholar]
- [6].Bian Q, Tang X, Dai R, Zeng M. Evolution phenomena and surface shrink of the melt pool in an additive manufacturing process under magnetic field. Int J Heat Mass Transf 2018. 10.1016/j.ijheatmasstransfer.2018.03.024. [DOI] [Google Scholar]
- [7].Liu YJ, Liu Z, Jiang Y, Wang GW, Yang Y, Zhang LC. Gradient in microstructure and mechanical property of selective laser melted AlSi10Mg. J Alloy Compd 2018. 10.1016/j.jallcom.2017.11.020. [DOI] [Google Scholar]
- [8].Akram J, Chalavadi P, Pal D, Stucker B. Understanding grain evolution in additive manufacturing through modeling. Addit Manuf 2018. 10.1016/j.addma.2018.03.021. [DOI] [Google Scholar]
- [9].Keller T, Lindwall G, Ghosh S, Ma L, Lane BM, Zhang F, et al. Application of finite element, phase-field, and CALPHAD-based methods to additive manufacturing of Ni-based superalloys. Acta Mater 2017. 10.1016/j.actamat.2017.05.003. [DOI] [PMC free article] [PubMed] [Google Scholar]
- [10].Hooper PA. Melt pool temperature and cooling rates in laser powder bed fusion. Addit Manuf 2018;22:548–59. 10.1016/j.addma.2018.05.032. [DOI] [Google Scholar]
- [11].Gusarov AV, Yadroitsev I, Bertrand P, Smurov I. Model of radiation and heat transfer in laser-powder interaction zone at selective laser melting. J Heat Transfer 2009;131:72101–11. [Google Scholar]
- [12].Parab ND, Zhao C, Cunningham R, Escano LI, Fezzaa K, Everhart W, et al. Ultrafast X-ray imaging of laser–metal additive manufacturing processes. J Synchrotron Rad 2018;25:1467–77. 10.1107/S1600577518009554. [DOI] [PMC free article] [PubMed] [Google Scholar]
- [13].Chahine K, Ballico M, Reizes J, Madadnia J. Temperature Profile Measurement of a Graphite Tube Furnace Using Optical Fibre and Platinum Thermocouples Metrology Society of Australia’s Biennial Conference (MSA). Australian National University (ANU); 2005. [Google Scholar]
- [14].Heigel JC, Lane BM. Measurement of the melt pool length during single scan tracks in a commercial laser powder bed fusion process. J Manuf Sci Eng 2018;140 10.1115/1.4037571.051012-051012-7. [DOI] [Google Scholar]
- [15].Ye J, Rubenchik AM, Crumb MF, Guss G, Matthews MJ. Laser Absorption and Scaling Behavior in Powder Bed Fusion Additive Manufacturing of Metals. In: Conference on Lasers and Electro-Optics (2018), paper JW2A.117, Optical Society of America. p. JW2A.117. doi: 10.1364/CLEO_AT.2018.JW2A.117. [DOI] [Google Scholar]