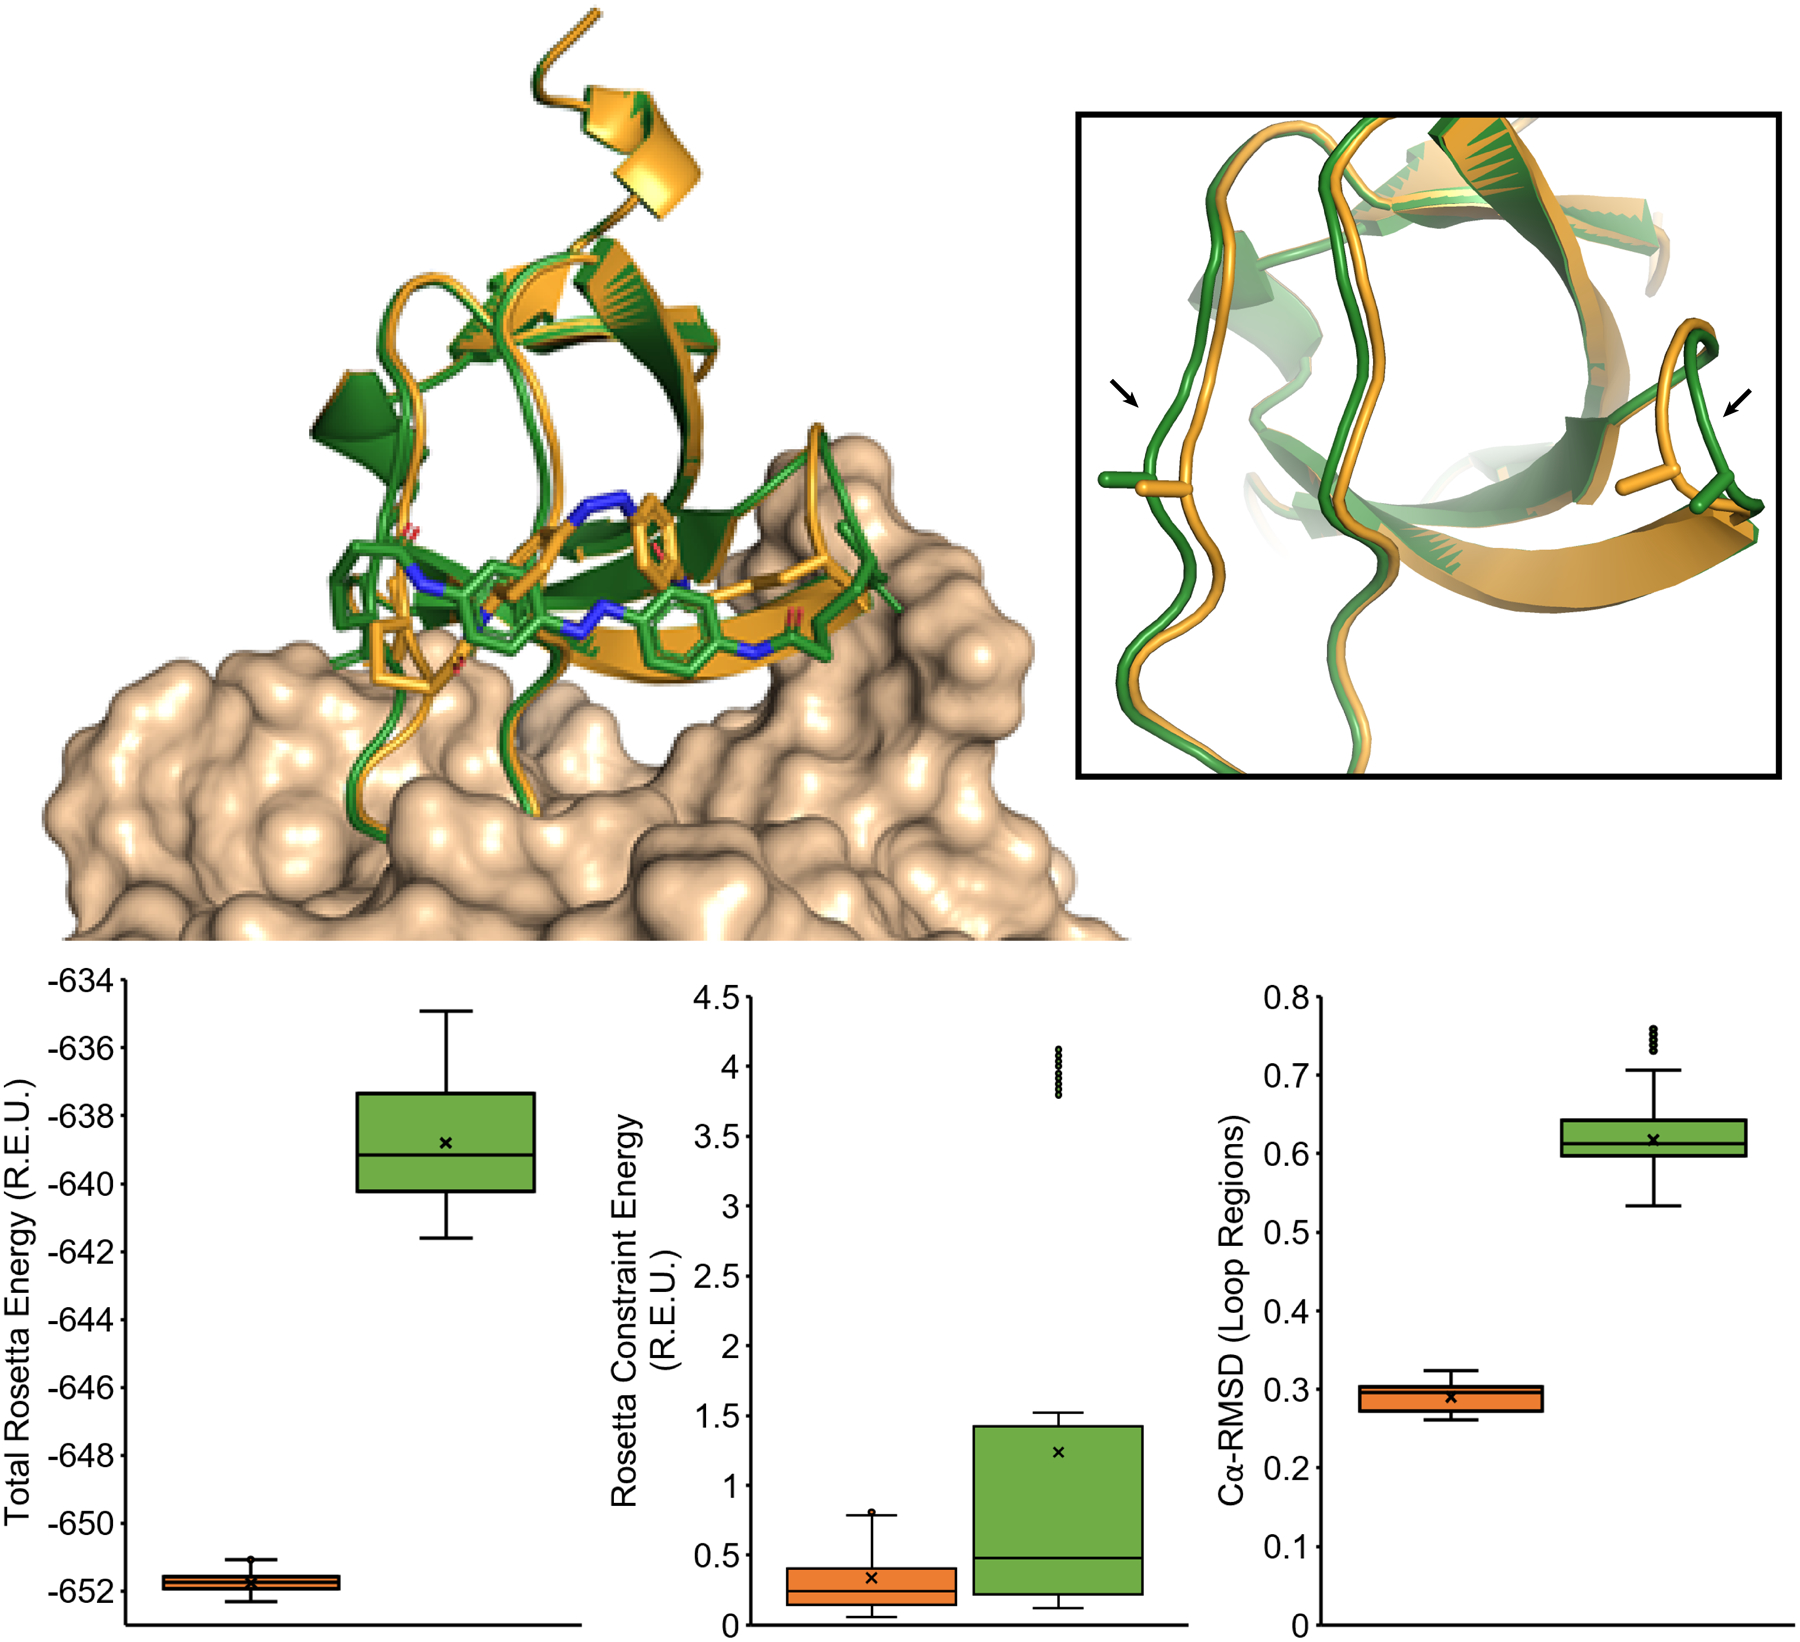
Figure 7.

Models of N11CT44C cross-linked with IAC in the cis-state (orange) and trans-state (green), where the insert highlights movements in the loop regions (arrows). The box plots below compare distributions of Total Rosetta Energy, Rosetta Constraint Energy, and Cα-RMSD from 500 FastRelax simulation trajectories of N11CT44C in the cis (orange, left) and trans (green, right) states, which show a small destabilization in the trans conformation but similarly low constraint scores and small changes in binding loop Cα-RMSD distributions. The models illustrate how small changes in overall Fynomer structure and loop residues (6–23, 41–45) can accommodate IAC isomerization with local flexibility.
