

Abstract
Highly tumorigenic, drug-resistant cancer stem-like cells drive cancer progression. These aggressive cells can arise repeatedly from bulk tumor cells independently of mutational events, suggesting an epigenetic mechanism. To test this possibility, we studied bladder cancer cells as they cyclically shifted to and from a cancer stem-like phenotype, and we discovered that these two states exhibit distinct DNA methylation and chromatin accessibility. Most differential chromatin accessibility was independent of methylation and affected the expression of driver genes such as E2F3, a cell cycle regulator associated with aggressive bladder cancer. Cancer stem-like cells exhibited increased E2F3 promoter accessibility and increased E2F3 expression that drove cell migration, invasiveness and drug resistance. Epigenetic interference using a DNA methylation inhibitor blocked the transition to a cancer stem-like state and reduced E2F3 expression. Our findings indicate that epigenetic plasticity plays a key role in the transition to and from an aggressive, drug-resistant phenotype.
Keywords: cancer plasticity, chromatin accessibility, drug resistance, cancer stem-like cells, E2F
Introduction
Cancer treatment has advanced markedly in recent decades, yet the majority of patients with advanced malignancies still succumb to their disease.1 A major obstacle to achieving lasting cures is intratumoral heterogeneity, the presence or emergence of aggressive cancer cell subpopulations resistant to therapy. This adaptive tumor evolution has been traditionally cast in the form of new DNA mutations that confer selective growth advantage and lead to clonal disease spread.2 However, it is now recognized that even within genetically homogeneous cell populations, significant phenotypic differences can exist or arise in response to environmental cues.3–5 In particular, many tumors contain subpopulations of aggressive, drug-resistant cells, sometimes termed “tumor-initiating cells” due to their high serial tumorigenicity in mice, or “cancer stem cells” due their self-renewal capacity and active transcriptional networks of pluripotency genes.6
Initially, these subpopulations were conceptualized hierarchically, mirroring normal tissue stem cells, with self-renewing, pluripotent cancer cells giving rise to more differentiated transit amplifying cells and their progeny.6–8 However, a significant body of work including results from our group has demonstrated that cancer cells can, in fact, reacquire tumor-initiating, drug-resistant, stem-like properties and that this phenotypic reprogramming does not necessarily require clonal emergence of new DNA mutations.3,5,9–11 For example, we reported that bladder and breast cancer cell lines contain a highly tumorigenic, drug-resistant, cancer stem-like subpopulation that fluctuates in size cyclically and predictably through serial passages in culture.12 This spontaneous conversion was mediated at least in part by PIK3CA/AKT signaling and CBP/β-catenin transcriptional activation.10 Other groups studying breast cancer demonstrated stochastic interconversion between luminal, basal and stem-like phenotypes11 and found no significant genomic distinction (i.e., no driver mutations) between cancer stem-like subpopulations and bulk cancer cells within breast tumors.13 Similarly, in mouse models of colorectal cancer, tumor-initiating cancer stem-like cells were found to arise spontaneously by de-differentiation of other cell subpopulations.14,15 Collectively, these observations established that adaptive cancer stem-like phenotypes can re-emerge in cancer cell populations, driven by transcriptional and signaling networks without involvement of genetic mutations.
Plasticity of the cancer stem-like phenotype may be regulated by epigenetic mechanisms.16 A significant number of genes that promote a cancer stem-like state (e.g., ZEB1) are poised in a “bivalent” state bearing both repressive and activating chromatin marks and can be switched from active to dormant by chromatin modifiers.17 One such group of chromatin modifiers is the KDM (histone lysine demethylase) family of proteins. In several studies, KDM5A/B and KDM6A/B activity was required to produce a slow-cycling, drug-resistant phenotype in a broad spectrum of malignancies.18–20 Other chromatin modifiers play similar roles; for example, EZH2 (H3K27 methylase) was shown to promote epithelial–mesenchymal transition (EMT), a cancer stem-like program that promotes cancer initiation and metastasis.21
In light of these newly discovered epigenetic plasticity mechanisms, we wondered if our prior observations of spontaneous, cyclical transitions in and out of a cancer stem-like phenotype could be better understood in the context of epigenetic regulation. To investigate this possibility, we used a new, high throughput assay recently published by our group21–24 to map global DNA methylation and chromatin accessibility in cancer stem-like versus noncancer stem-like bladder cancer cells.
Materials and Methods
Cell culture
Human bladder cancer cell lines J82 (RRID:CVCL_0359) and T24 (RRID:CVCL_0554) were purchased from ATCC (Manassas, VA) and routinely maintained in the lab using DMEM and RPMI 1640, respectively (Meiatech, Inc., Manassa, VA) supplemented with 10% heat-inactivated fetal bovine serum (Omega), 1% penicillin (100 U/ml, Invitrogen) and 1% streptomycin (100 μg/ml, Invitrogen) at 37° C, 5% CO2.10,12,22 We authenticated the cell lines prior to starting the experiments and re-authenticated them afterward using 9-marker STR profiling (IDEXX BioAnalytics). Interspecies contamination test and mycoplasma PCR evaluation were both negative (IDEXX BioAnalytics).
Flow cytometry
Hoechst staining and fluorescence-activated cell sorting (FACS) of J82 and T24 cancer cells using FACS Aria I were conducted as described previously.10,12 (See Supporting Information Materials & Methods).
AcceSss/ble assay
Nuclei preparation and CpG methyltransferase (M.SssI, New England BioLabs) treatment were performed as previously described.22–24 Briefly, the purified nucleic acids were separated into M.SssI-treated group and no enzyme control (NoE) group. The M.SssI-treated group will gain methylation at accessible sites compared to the NoE group, such that we can identify accessible sites from the difference in methylation between M.SssI-treated and NoE samples. All the samples passed the MethyLight-based quality control (QC) tests.25 The subsequent Infinium DNA methylation assay was performed at the University of Southern California Molecular Genomics Core Facility according to the manufacturer’s specifications (Infinium MethylationEPIC BeadChip). The intensity values were processed using “noob” function in R package minfi.26 See Supporting Information Materials and Methods for analysis details.
The endogenous DNA methylation scale was defined based on the untreated, no enzyme control (NoE) DNA β values of SP cells and NSP cells. Differentially methylated sites (ΔMeth) were identified by subtracting NoE β values of SP cell from NoE β values of NSP cell. ΔMeth >0.2 was defined as gain of DNA methylation or hypermethylation at SP cells, while ΔMeth < −0.2 was defined as loss of methylation or hypomethylation at SP cells as compared to NSP cells. For both SP and NSP cells, accessibility (Acc) was defined as the β-value of M.SssI-treated cells minus the β-value of the NoE cells, defined on a 0–1 scale. Because M.SssI treatment in our assay cannot reduce DNA methylation, we excluded from further analysis any probes with Acc < 0, which could only be caused by technical error and accounted for less than 0.1% of the total probes on the Infinium MethylationEPIC BeadChip. The accessibility change between SP and NSP cells (ΔAcc) was calculated by subtracting the Acc value of NSP cell from the Acce value of SP cell. ΔAcc >0.2 was defined as a gain of chromatin accessibility at SP cells relative to NSP cells, while ΔAcc <−0.2 was defined as loss of accessibility at SP cells relative to NSP cells. ΔAcc (x-axis) and ΔMeth (y-axis) were used to generate Kernel density scatter plots. Groups a, b, c, d, e, f in the scatter plots included probes with ΔAcc >0.2 or <−0.2 and/or ΔMeth >0.2 or <−0.2.
Bisulfite-sequencing and human exome 1.0 ST array
To analyze the E2F3 gene body methylation status, the same PCR products as described in COBRA assay (combined bisulfite restriction analysis;27 detailed methods in the Supporting Information Materials and Methods) were cloned into the pCR4 TOPO-TA vector (Invitrogen, Carlsbad, CA). Plasmid DNA was purified using ZR Plasmid Miniprep-Classic Kit (Zymo Research, Irvine, CA), and sequenced using M13R primer. To analyze the DNA methylation status of E2F3 promoter region, nucleic acid was isolated and treated with M.SssI as described in AcceSssIble assay section. After DNA was isolated and bisulfite converted, a 288-bp region, from −274 to +14 corresponding to the transcription start site, was PCR amplified using 5′-primer: AATTAAGGAGGTTTATGTAAATAGGGTTT and 3′-primer: AACTAAAAAATAACTCCAAAAAACTACTACTA, and was then cloned into pCR4 TOPO-TA vector. Plasmid DNA was purified using ZR Plasmid Miniprep-Classic Kit (Zymo Research), and sequenced using M13R primer.
Human Exome 1.0 ST array was run on SP and NSP cells for gene expression data analysis (See Supporting Information Materials and Methods for details).
GDC data analysis
DNA methylation and RNA-seq data from bladder cancer patients were obtained from the National Cancer Institute (NCI) Genomics Data Commons (GDC) data portal (https://portal.gdc.cancer.gov/). For the Illumina Infinium Human-Methylation450 array data, the processed β values provided on the GDC website were used for analysis. Probes with a median β value of less than 0.05 in both groups (solid normal tissue and primary tumor) were removed as they may represent background noise. Probes on sex chromosomes were also removed as they represent unwanted variations.
For the RNA-seq data, the gene expression level of E2F3 gene (log2(RSEM+1)) was used for comparison. The gene expression difference between normal and tumor samples was compared using the Mann–Whitney test. All analyses for DNA methylation and RNA-seq data were conducted using R version 3.2.5. R package ggplot2 was used to generate plots.
Data analysis for in vitro experiments including quantitative PCR assays, colony formation, invasion, migration assays and drug treatment assays
Quantitative PCR assays, colony formation, invasion, migration and drug treatment assays were performed as published before (See Supporting Information Material and Methods).12,28 Data analysis for quantitative PCR assays, colony formation, invasion, migration and drug treatment assays was performed using Excel. Data from at least three independent experiments were presented as mean ± SD. Two-tailed Student’s t-test was used for two-component comparisons. Confidence level of 0.95 was used for all statistical analyses (α-value = 0.05).
Data availability
All array-based DNA methylation and gene expression data have been deposited in the Gene Expression Omnibus (GEO) database under the accession number GSE123610. Additional data supporting our findings are available from the corresponding author upon reasonable request.
Results
In our prior studies, two distinct cancer cell subpopulations were isolated, side population (SP) and nonside population (NSP), from both J82 bladder cancer cell line and MCF7 breast cancer cell line using Hoechst dye staining and FACS.10,12 We showed in those studies that the SP cells are more cancer stem-like: they are more tumorigenic, drug-resistant and express more pluripotency genes than NSP cells (Fig. 1a). Moreover, the SP cancer stem-like subpopulation fluctuates in size cyclically and predictably through serial passages in culture (Fig. 1b). Importantly, SP cells disappear and re-emerge cyclically not through expansion of existing cancer stem-like cells, but rather through phenotypic plasticity: coordinated, spontaneous conversion of large numbers of cells back to the cancer stem-like state (Fig. 1c). The dynamics of this rapid, coordinated and cyclical transition do not conform to a model of acquired genomic alterations and suggest that epigenetic mechanisms may play a role.
Figure 1.

Plasticity of cancer stem-like subpopulations in bladder cancer cell lines. (a) Two cancer cell states coexist: Hoechst staining and flow cytometry differentiates Side Population (SP: high tumorigenicity, drug resistance, and high pluripotency gene expression) from nonside population (NSP: low tumorigenicity, no drug resistance, and low pluripotency gene expression). (b) Dynamic equilibrium: Cancer stem-like side population (SP) fluctuates in size spontaneously and cyclically over serial passages. (c) Phenotypic plasticity: cancer stem-like side population cells differentiate into nonside population cells, and nonside population cells convert back into side population cells. [Color figure can be viewed at wileyonlinelibrary.com]
Differential chromatin accessibility and DNA methylation between SP and NSP cells
To test whether epigenetic alterations are involved in the interconversion between SP and NSP cells, we performed AcceSssIble assay to measure DNA methylation and chromatin accessibility in these two subpopulations. The AcceSssIble assay was developed in our group24 and has been used successfully to identify potential epigenetic driver genes in renal cell carcinoma22 as well as epigenetic changes after epigenetic therapy.23,24,29 AcceSssIble assay couples the analysis of chromatin accessibility and endogenous DNA methylation using the Infinium MethylationEPIC BeadChip array platform, requires very little input material, is cost-effective, and uses simple and straightforward computational techniques for analysis.22,24
Differences in global DNA methylation and chromatin accessibility levels between SP and NSP cells of J82 were calculated and plotted, and six groups (a–f) of loci with differential methylation and/or accessibility were designated (Figs. 2a and 2b). The six groups (a–f) added up to ~20,000 probes, which represented only about 2% of the 850,000 probes on the Infinium EPIC array (Fig. 2c), suggesting that only a small portion of the genome exhibits differential DNA methylation or nucleosome accessibility between SP and NSP cells. Loci that did exhibit differential DNA methylation and/or chromatin accessibility between SP and NSP cells correspond to six potential models (Fig. 2d). Groups a-d comprise loci with DNA methylation changes alone (b, c) or also with accessibility changes (a, d), whereas CpG sites in groups e and f comprise DNA methylation-independent accessibility changes. Specifically, Group a loci exhibit de novo DNA hypermethylation with decreased accessibility (closed chromatin structure) in SP cells, whereas Group b loci exhibit only de novo DNA hypermethylation but no accessibility changes in SP cells. Conversely, Group d loci exhibit de novo DNA hypomethylation with increased accessibility (open chromatin structure) in SP cells, whereas Group c loci exhibit only de novo DNA hypomethylation but no accessibility changes in SP cells. Most of the SP associated DNA methylation changes are not accompanied by chromatin accessibility changes (Fig. 2c, Groups b and c), and any functional elements (e.g., promoters or enhancers) in these groups are unlikely to be accompanied by gene expression changes.24,30,31 In contrast, Groups a, d, e and f exhibit differential loss or gain of accessibility in SP cells. Differential accessibility is independent of DNA methylation changes in the case of Groups e and f, which are enriched with potential functional regions such as promoters (Fig. 2e), since nucleosome occupancy at gene promoters or enhancers inhibits expression of the relevant gene.31–34
Figure 2.

Differential chromatin accessibility and DNA methylation between SP and NSP in J82 bladder cancer cells. (a) Kernel density scatter plot of differential DNA methylation (ΔMeth, y-axis) versus differential chromatin accessibility (ΔAcc, x-axis) globally between SP and NSP. A threshold of 0.2 or −0.2 is used for both DNA methylation and chromatin accessibility differences. Six groups (a–f) of epigenetic differences can be identified. (b) Equations showing the ΔMeth and ΔAcc calculations used to make the scatter plot in a. (c) The number of probes falling into each of the six groups. (d) Potential models of the six groups with differential DNA methylation (a, b, c, d) and/or chromatin accessibility (a, d, e, f) between SP and NSP cells. (e) Quantitative distribution of probe location of the six groups (a–f) and all probes of the Infinium MethylationEPIC BeadChip (EPIC). Promoter regions (green bar) include TSS, 5′UTR and 1st Exon based on EPIC array annotation. Transcribed regions (yellow bar) include gene body and 3′UTR. Other (blue bar) includes probes not belonging to these two categories. (f) Kernel density scatter plot of differential DNA methylation versus differential chromatin accessibility at promoter regions between SP and NSP with six groups (a–f) of epigenetic differences. (g) The number of probes falling into each of the six groups. (h) Pathway analysis of genes whose promoter probes are located in Groups a, d, e, f consistent with differential chromatin accessibility between SP and NSP. [Color figure can be viewed at wileyonlinelibrary.com]
We also performed the AcceSssIble assay on a second bladder cancer cell line (T24). As with J82, differential patterns of DNA methylation and accessibility between SP and NSP cells were observed (Supporting Information Figs. S1 and S2). Interestingly, a high proportion of chromatin accessibility alterations were independent of DNA methylation (Supporting Information Figs. S1), even more than had been observed in the J82 cells (Fig. 2c).
Differential chromatin accessibility at promoter regions is correlated with gene expression changes between SP and NSP
We sought to confirm whether the chromatin accessibility and DNA methylation changes we identified at gene promoters reflected actual functional changes. When the methylation and accessibility data was restricted only to promoter regions (Fig. 2f), the proportion of loci with differential accessibility in SP (Fig. 2g, Groups a, d, e and f, ~1/2 of all loci in (a–f) was markedly increased compared to the prior global analysis (Fig. 2c, ~1/3 of all loci in a–f), especially those loci that gained accessibility in SP without DNA methylation changes (Group f in Fig. 2g vs. Fig. 2c). Pathway analysis indicates that Group f genes are involved in key cancer-relevant pathways, such as glutamate removal from folates, unfolded protein response, Wnt/Ca+ pathway, and regulators of tumorigenesis (Fig. 2h).
Next, we overlapped differential promoter accessibility with differential gene expression data (SP vs. NSP) generated using a HuEX gene expression array. We identified 38 up-regulated genes that gained accessibility (Supporting Information Table 1a, ΔAcc > 0.2); interestingly, 34 of 38 upregulated genes in SP were in Group f (Figs. 2f–2g), that is, up-regulated independently of DNA methylation (|ΔMeth| < 0.2), suggesting that a major component of their epigenetic regulation is mediated by chromatin accessibility. Similarly, while a smaller number of genes were downregulated with loss of accessibility (Supporting Information Table 1b, ΔAcc < −0.2), 7 of those 10 genes were down-regulated independently of DNA methylation (|ΔMeth| < 0.2). Collectively, these data suggest that accessibility changes at promoter regions may be a stronger predictor of functional changes than DNA methylation alone.30,31,35,36 In addition, differential DNA methylation and accessibility at the promoter region between SP and NSP cells were also observed in T24 cells (Supporting Information Fig. S2).
Clinical characterization and epigenetic regulation of E2F3 in bladder cancer
We used the Oncomine and BaseSpace online transcriptome data mining engines to query the 38 genes exhibiting significantly increased promoter accessibility and concomitant RNA overexpression. Three of the 38 genes, E2F3, FOXJ3 and MAD2L1 were overexpressed in bladder cancer patient samples in the Oncomine and BaseSpace databases. Of these, E2F3 also had the greatest differential expression (about 4.5-fold, Fig. 4a) by qPCR validation in our J82 bladder cancer model. E2F3 is known to activate AKT signaling, which we previously reported28 to promote the SP phenotype. E2F3 was consistently overexpressed in tumors relative to normal tissue in nine independent studies in Oncomine (Fig. 3a) and 11 independent studies in BaseSpace (Fig. 3b). Likewise, we downloaded the TCGA gene expression data for bladder cancer from GDC and analyzed the normalized E2F3 gene expression level (log2(RSEM+1)). E2F3 gene expression level was significantly higher in tumor (408 samples) than in normal tissue (19 samples) with Mann–Whitney p value of 1.172 × 10⁻⁵ (Fig. 3c).
Figure 4.
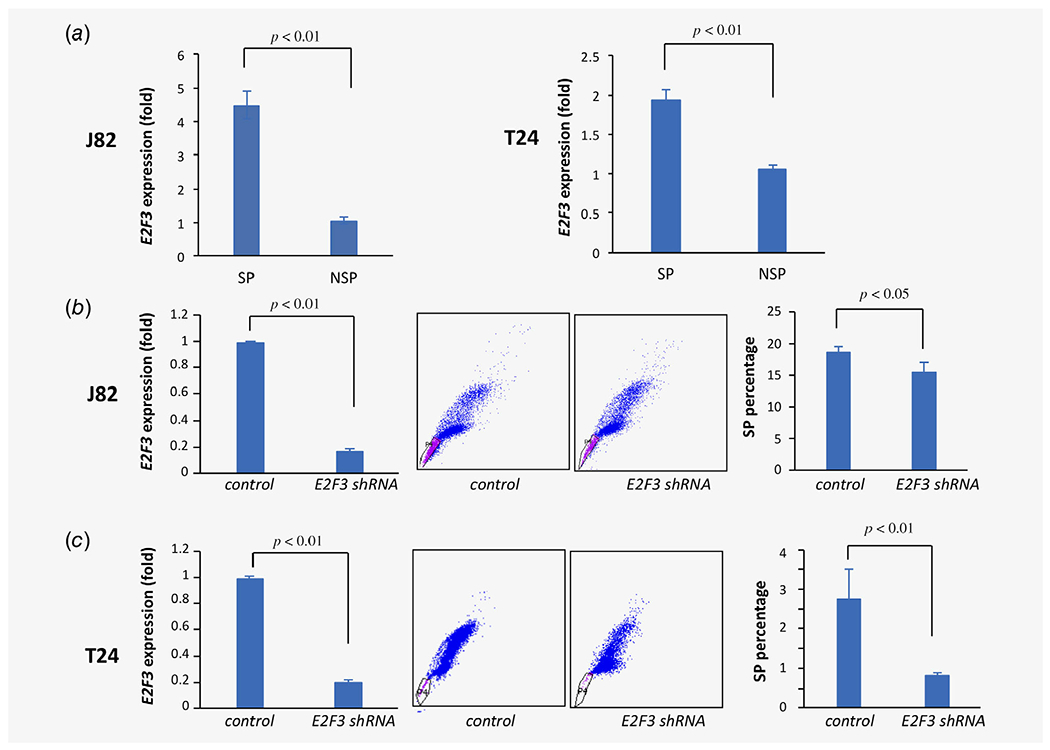
Effects of E2F3 depletion on bladder cancer SP phenotype. (a) E2F3 transcript levels by qRT-PCR in SP vs. NSP in J82 (left, p < 0.01) and T24 cells (right, p < 0.01). (b) Lentiviral shRNA-mediated E2F3 depletion in J82 cells (left, p < 0.01) results in decreased SP (center and right, p < 0.01). (c) Lentiviral shRNA-mediated E2F3 depletion in T24 cells (left, p < 0.01) results in decreased SP (center and right, p < 0.01). [Color figure can be viewed at wileyonlinelibrary.com]
Figure 3.

Epigenetic and clinical characterization of E2F3 in bladder cancer. (a) Association of E2F3 mRNA expression level with bladder cancer versus normal bladder tissue across multiple clinical studies identified using Oncomine. PMIDs for the studies are (1) 15173019; (2) 15173019; (3) 15173019; (4) 20421545; (5) 20421545; (6) 15161696; (7) 15161696; (8) 16432078; (9) 16,432,078. *p < 0.05, **p < 0.01. (b) Association of E2F3 mRNA expression level with bladder cancer vs. normal bladder tissue across multiple clinical studies identified using BaseSpace. Biosets for the studies are Bioset 1: Bladder cancer tissue _vs_ healthy. Buzdin et al. Genome-wide analysis of gene expression in cancerous and normal human bladder tissues. Accessed August 31, 2018; Bioset 2: PMID 21483740; Bioset 3: PMID: 23403633; Bioset 4: PMID: 17099711; Bioset 5: PMID: 17099711; Bioset 6: PMID: 25252918; Bioset 7: Bladder tissues—tumors from bladder cancer patients _vs_ mucosa from healthy donors. Suntsova et al. Bladder tumors and their gene expression profiles. Accessed August 31, 2018; Bioset 8: Bladder cancer tumors from TCGA patients _vs_ normal bladder tissue (Study: The Cancer Genome Atlas (TCGA) mRNA-Seq expression of aggregated samples for several cancers). The results here are part based upon data generated by the TCGA Research Network: http://cancergenome.nih.gov/. Bioset 9: PMID: 21159190; Bioset 10: PMID: 19539325; Bioset 11: PMID: 19539325. *p < 0.05, **p < 0.01. (c) TCGA bladder cancer data (downloaded from GDC) comparing E2F3 expression level between tumor and normal tissue, presented as log2 normalized RSEM. t-test p-value is 1.172E-05 (n = 19 normal vs. 408 tumor samples). (d) Upper panel: vertical short lines show the locations of the EPIC array probes across the E2F3 gene. Black arrow indicates transcription start site and direction. Lower panel: DNA methylation of all probes for E2F3 in J82 NSP (black) and SP (red) cells, arranged in the genomic context, shows hypomethylation at the promoter region and hypermethylation at gene body region. X-axis = genomic location. Y-axis = methylation level (1 is fully methylated and 0 is unmethylated). (e) Differential DNA methylation (orange) and chromatin accessibility (blue) between J82 SP and NSP cells indicate that SP cells have higher accessibility than NSP cells at E2F3 promoter region. X-axis = genomic location. Y-axis = percentage of DNA methylation change and chromatin accessibility change. Red bar at the bottom indicates the promoter region, which is subjected to bisulfite sequence analysis. (f) Upper panel: vertical short lines show the locations of all CpG loci at E2F3 promoter. Lower panel: quantification of the bisulfite sequence result (Supporting Information Fig. S4) confirms the higher accessibility at E2F3 promoter region in SP cells (green) than in NSP cells (purple). [Color figure can be viewed at wileyonlinelibrary.com]
To better understand how chromatin structure is involved in regulation of E2F3 expression during cellular phenotypic shifts, the E2F3 methylation and accessibility map of J82 cells was further analyzed (Figs. 3d and 3e). A close look at all probes for this gene revealed that promoter region methylation is very low in both SP and NSP cells (Fig. 3d). Indeed, E2F3 promoter hypomethylation is also observed in the 408 bladder cancer patient samples in TCGA (median β-value 0.1, range 0.04–0.013, data not shown). However, promoter accessibility in SP is higher than in NSP in a manner that is independent of DNA methylation (Fig. 3e), indicating that chromatin at the promoter region becomes more accessible as cells shift from NSP to SP, likely explaining the 4.5-fold higher E2F3 expression in SP (Fig. 4a). In contrast, at the gene body or transcribed region, DNA methylation and chromatin accessibility are not significantly different between SP and NSP. These differences are also found in T24 cells (Supporting Information Fig. S3).
We confirmed these findings via bisulfite sequencing of the E2F3 promoter region (−274 bp to +14 bp corresponding to the transcription start site) in SP and NSP cells (Fig. 3f and Supporting Information Fig. S4). Before M.SssI treatment, both NSP and SP were unmethylated (0 and 0.62%, respectively), and after M.SssI treatment both gained methylation (79.4 and 88.1%, respectively), indicating that overall the E2F3 promoter is accessible in both NSP and SP cells, albeit slightly more so in SP. The gain of methylation after M.SssI treatment for NSP and SP are 79.4% (79.4–0%) and 87.5% (88.1–0.62%), respectively. However, the targeted bisulfite sequencing revealed marked accessibility differences at individual locations in the promoter regions (Fig. 3f). For example, the CpG located at −154 bp corresponding to the transcription start site, shows 95% accessibility in SP cells and only 65% in NSP cells, suggesting that this specific region may play an important role in regulating E2F3 gene expression.
Thus, gain of accessibility is associated with creation of a nucleosome-depleted region specifically around the promoter region and reactivation of gene expression without significant changes in DNA methylation at the promoter or gene body.
E2F3 as a potential driver gene for phenotypic transition in bladder cancer
We tested the functional role of E2F3 as a potential driver gene for NSP-to-SP phenotypic transition. First, we confirmed differential gene expression between SP and NSP cells using real-time PCR performed on SP and NSP cells sorted from two bladder cancer cell lines. In J82 cells, E2F3 level was 4.48-fold higher (p < 0.01) in SP than in NSP cells, and in T24 cells, E2F3 level it was 1.9-fold higher (p < 0.01) in SP than in NSP cells (Fig. 4a). Using lentiviral shRNA, E2F3 expression was stably depleted by 80% in J82 bladder cancer cells, resulting in an >20% decrease in SP percentage (from 19% down to 15%, p < 0.05, Fig. 4b). Similarly, shRNA depletion of E2F3 in T24 bladder cancer cells resulted in an approximate 70% reduction in SP percentage (from 2.75% down to 0.8%, p < 0.01, Fig. 4c). Hence, E2F3 was expressed at higher levels in SP cells, and E2F3 depletion caused a reduction in the SP phenotype.
Next, we tested the effect of E2F3 depletion on aggressive behaviors typically associated with the SP phenotype. E2F3 depletion by lentiviral shRNA attenuated cell migration in J82 and T24 bladder cancer cells (Fig. 5a). Similarly, E2F3 depletion significantly reduced the invasiveness of J82 cells (50% reduction, p < 0.05) and T24 cells (25% reduction, p < 0.05; Fig. 5b). E2F3 depletion also significantly reduced colony formation by approximately 40% in T24 cells but did not have a significant effect in J82 cells (data not shown). Notably, depletion of E2F3 markedly reduced drug resistance by about 50% (p < 0.01) in both J82 and T24 cells (Fig. 5c). These findings functionally implicate E2F3 as a potential driver gene in the phenotypic transition from the NSP (nonaggressive) to SP (aggressive) state in bladder cancer.
Figure 5.

Effects of E2F3 depletion on bladder cancer cell migration, invasion and drug sensitivity. (a) E2F3 depletion inhibits cancer cell migration in J82 (left) and T24 cells (right). (b) E2F3 depletion inhibits cancer cell invasion in J82 (left, p < 0.05) and T24 cells (right, p < 0.05). (c) E2F3 depletion decreases survival with cisplatin treatment in J82 (left, p < 0.01) and T24 cells (right, p < 0.01). [Color figure can be viewed at wileyonlinelibrary.com]
Epigenetic interference with a DNA methylation inhibitor attenuates the NSP to SP phenotypic transition in bladder cancer
Although we demonstrated that epigenetic chromatin remodeling occurs during the phenotypic transition from NSP to SP in conjunction with increased expression of bladder cancer-associated genes like E2F3, it was not clear whether epigenetic reprogramming is necessary for this process. The DNMT inhibitor, 5-aza-2′-deoxycytidine (DAC), an FDA approved DNA demethylating agent for cancer therapy, demethylates methylated DNA globally and reprograms the epigenome by differential remethylation and an epigenetic switch,24,31,37,38 which may contribute to long-term antitumor memory.37,39 We treated J82 and T24 cells with DAC to disrupt epigenetic reprogramming, resulting in an approximate 20% increase in the cell doubling time (data not shown), as observed previously by others.40,41 Notably, DAC treatment resulted in a significant reduction in SP population by approximately 50% in both cell lines (p < 0.01, Fig. 6a). Moreover, we observed downregulation of E2F3 expression by approximately 15% (p < 0.05, Fig. 6b), which may be caused by demethylation of the transcribed region. To further identify the regions of E2F3 DNA affected by DAC treatments, we performed targeted bisulfite sequencing and COBRA assay, which showed that DAC treatments markedly decreased DNA methylation in the E2F3 gene body regions in both J82 and T24 cells (Fig. 6c and Supporting Information Fig. S5). This is consistent with our previous reports37 that gene body methylation is positively correlated with gene expression, which can, in turn, be downregulated by demethylation of the gene body. These findings suggest that epigenetic reprogramming may be one of the driving forces in the rapid, concerted phenotypic transition between subpopulations of cancer cells.
Figure 6.

Effects of 5-aza-2′-deoxycytidine (DAC) treatment on SP size and E2F3 expression in bladder cancer cells. (a) DAC treatment decreases SP percentage in J82 cells (left, p < 0.01) and T24 cells (right, p < 0.05). (b) DAC treatment decreases E2F3 mRNA expression in J82 cells (left, p < 0.05) and T24 cells (right, p < 0.05). (c) Bisulfite sequencing shows the highly methylated E2F3 gene body region in control cells of both J82 (left) and T24 (right) and the decreased DNA methylation after DAC treatment. Upper panel shows E2F3 gene structure. Black blocks and horizontal lines represent coding exons and introns respectively. The 5′- and 3′-untranslated regions (UTRs) are displayed as thinner blocks on the left and right ends. Not drawn to scale. Red bar indicates the bisulfite-sequenced region. Unfilled circles represent unmethylated CpGs, and filled circles represent methylated CpGs. Percentages are the average methylation levels of this region. [Color figure can be viewed at wileyonlinelibrary.com]
Discussion
Cancer cell subpopulations exhibit a diversity of phenotypes that are independent of driver mutations, and dynamic transitions between these phenotypic states provide critical adaptive advantages to the overall cancer cell population.5,42 Phenotypic state transitions are at least in part regulated by signal transduction networks (STNs) composed of positive and negative feedback loops that ultimately exceed thresholds and “switch” to a particular state. These STN dynamics are governed by stochastic expression levels and signals (e.g., cytokines, receptor ligands) received from a cell’s microenvironment.43 Cancer cells employ these plasticity mechanisms to achieve “bet-hedging”—maintaining two or more concomitant phenotypes (e.g., cancer stem-like and noncancer stem-like) within a population, either a priori or in response to stressors, thereby enabling the population to better absorb environmental insults and to persist until genetically adaptive traits emerge.3
Epigenetic factors such as DNA methylation, histone modification, nucleosome occupancy and noncoding RNA play a role in all human malignancies and have been demonstrated to cooperate with mutations to drive the cancer phenotype.44 Epigenetic regulation of phenotypic plasticity involves a balancing act between functional promoter and enhancer elements that control gene expression and are themselves modulated by repressive chromatin (e.g., H3K27me3, H3K9me3, promoter CpG methylation) that inhibits transcription signal transduction networks, versus activating chromatin (e.g., H3K4me3, H3K27ac, 5hmC) that promotes these networks.18,21,45–47 Recent studies have shown that chromatin-modifying enzymes (e.g., KDM family) are sensitive to environmental factors such as metabolic state, hypoxia and stress response,46 and that these KDM enzymes induce chromatin modifications that regulate genes associated with pluripotency and drug resistance.45 The resulting methylation and transcriptional patterns have been used to derive predictive “stemness-index” signatures that correctly classified more aggressive and metastatic tumors.48 However, whether epigenetic alterations can drive rapid phenotypic state transitions between cancer subpopulations without involvement of mutations is not well studied.
In the current work, we explored whether epigenetic alterations alone—without involvement of mutations—can drive the cyclical state transitions that we described previously in bladder cancer.10,12 As discussed above, phenotypic plasticity in bladder and other cancers is complex, heterogeneous, and multifactorial, involving numerous signals at the genetic, epigenetic, transcriptional and protein levels in tumor cells and their microenvironment. Given this complexity, we aimed to use our well-characterized, tractable cell line model to home in on just one area—chromatin methylation and accessibility—and to elucidate its role in plasticity to and from an aggressive cancer phenotype. Using a new chromatin accessibility assay that we recently developed,22,24 integrative analysis of DNA methylation, nucleosome accessibility and gene expression revealed epigenetic differences (DNA methylation and chromatin accessibility) between the cancer stem-like side population (SP) and the bulk nonside population (NSP) at thousands of loci, many of which mapped to cancer and stemness relevant pathways. Given the rapid transition (3–4 days, Fig. 1) between SP and NSP phenotypes, we did not expect a high level of epigenetic alterations in this system. Yet, surprisingly, the methylation change was much higher than expected, with over 2,000 hypermethylated probes and 12,000 hypo-methylated probes (Fig. 2). This degree of differential methylation between SP and NSP cells is in a similar range to the differential methylation observed between tumor versus normal in the TCGA bladder cancer dataset (~2000–3,000 hypermethylated probes and over 5,000 hypomethylated probes).49 Our findings were similarly unexpected for chromatin accessibility using the AcceSssIble assay, a well-characterized system.22–24 For example, the differential accessibility between SP and NSP was comparable to the difference between tumor and primary adjacent normal clear cell renal cell carcinoma observed in our previous publication.22 The majority of global SP-associated DNA methylation changes were not accompanied by chromatin accessibility changes, consistent with previous observations of a “passenger effect” by our group.22,24 These loci likely remain inaccessible in SP and therefore, most likely remain silent or are repressed by other epigenetic silencing mechanisms.24,30,31 An example would be the “epigenetic switch” between regions occupied by Polycomb Repressive Complex 2 (PRC2) and DNA methylation repression.50,51 In contrast, the correlation between a gene’s promoter structure and expression potential is well established. Accordingly, loci exhibiting SP-NSP differential accessibility regardless of DNA methylation changes were enriched in potential functional regions such as promoters, which are likely to be highly correlated with expression changes, as nucleosome occupancy at gene promoters or enhancers inhibits expression of the relevant gene.31–34 Accordingly, we plan to use a combination of ChIP-seq and RNA-seq with current Infinium data sets to analyze the role of enhancers in our upcoming studies.
One of the genes with increased accessibility and expression in SP cells was E2F3, an E2F family member, which plays a key role in cell cycle control. E2Fs are normally sequestered via Rb1 binding, but in late G1 phase Rb1 becomes multi-phosphorylated by cyclin-dependent kinases and liberates E2F, which in turn binds E2F recognition sites at genes required for DNA synthesis and replication and recruits Pol II and acetyltransferases to activate transcription.52 In addition to promoting S phase, E2F3 has been shown to interact with a complex network of miRNAs in various malignancies, creating feedback loops that modulate proliferation, invasion, apoptosis and metastasis.53 Of particular relevance to our cancer stem-like model, E2F3 activity has been shown to promote epithelial to mesenchymal transition (EMT) and to interact in mutual feedback loops with several key stemness genes, such as Oct4, Sox2 and Nanog.54
When E2F3 methylation and chromatin accessibility were fully mapped using all available Infinium EPIC array probes, indeed the only differences between SP and NSP were in promoter chromatin accessibility, without involvement of DNA methylation, supporting a functional role for nucleosome positioning in activation of this gene when cells shift from NSP to SP state. In silico analysis of available databases using the Oncomine and BaseSpace search engines confirmed that elevated E2F3 mRNA expression is consistently observed in bladder tumors relative to normal bladder tissue, an observation further corroborated in the TCGA database (Fig. 3). The TCGA data did not reveal a statistically significant association between E2F3 expression and clinical disease progression or death, which was not unexpected given that this cohort consists mainly of localized primary tumors resected with curative intent rather than recurrent, drug-resistant disease. We also checked the TCGA database for other malignancies with increased E2F3 expression, and found a correlation with poor survival in kidney cancer55 and hepatocellular carcinoma,56 which have been noted in previous publications. Our finding of elevated E2F3 expression in tumors is in line with several prior studies, where E2F3 overexpression or amplification of the E2F3 locus at 6p22 was found in approximately 20% of bladder tumors and was associated with increased proliferation and an EMT-like neuroendocrine phenotype.57,58 Accordingly, when E2F3 was depleted by lentiviral shRNA in our bladder cancer model, we observed a significant reduction in the numbers of SP cells and a concomitant decrease in migration, invasiveness and drug resistance (Figs. 4 and 5). Importantly, these effects were observed regardless of RBI status (J82 is RB1−/− whereas T24 is RBI-wild type) and in the absence of native 6p22 amplification (neither cell line has this amplification).57 This finding further demonstrates that epigenetic reprogramming between SP and NSP may directly regulate potential driver genes to alter phenotypic changes.
As discussed earlier, differential chromatin accessibility at the E2F3 promoter—not differential methylation—was the epigenetic driver of E2F3 expression. Indeed, promoter methylation was very low and gene body methylation was quite high (~90%) in both SP and NSP in our bladder cancer cell lines (Fig. 3 and Supporting Information Fig. S3) and also in patient samples, as confirmed in the TCGA bladder cancer database. Nevertheless, gene body methylation is known to be highly correlated with gene expression, and gene body demethylation can lead to downregulation of gene expression, as shown previously by our group.37 Accordingly, in our study, we showed that treatment with a DNA methylation inhibitor (DAC) reduced E2F3 gene body methylation, blocked the transition of NSP to SP, and down-regulated E2F3 expression (Fig. 6 and Supporting Information Fig. S5). In a recent study, we demonstrated that DAC can act as a dual inhibitor of DNA methylation and PRC2, leading not only to demethylation of DNA but also to increased chromatin accessibility of PRC2 target loci independently of DNA methylation.23 This may explain why inhibition of DNA methylation has such a dramatic blocking effect on phenotypic transition.
Taken together, our findings suggest that epigenetic plasticity can potentiate rapid, cyclical phenotypic transition in and out of a cancer stem-like state by directly regulating genes like E2F3 that drive an aggressive, drug-resistant phenotype. While E2F3 is certainly not the only such driver of aggressive bladder cancer, it serves as one example illustrating how rapid changes in chromatin accessibility and DNA methylation may contribute to an aggressive cancer phenotype via epigenetic regulation rather than DNA mutation in key driver genes. These effects are disrupted and partially reversed in our model after treatment with a DNA methylation inhibitor, lending further rationale for the concept of epigenetic therapy. Already used as standard treatment in some tumors and actively studied in combination with chemotherapy and immunotherapy in others, epigenetic therapy has the potential to block transition to a drug-resistant aggressive phenotype and to sensitize tumors to chemotherapy and immunotherapy. Based on our current findings, targeting epigenetic plasticity therefore merits further study as potential means for disrupting bladder cancer resistance and progression.
Supplementary Material
What’s new?
Cancer cells can cycle in and out of an aggressive cancer stem cell-like state but mechanisms controlling this process are unknown. Here the authors find that these transitions occur at least in part via epigenetic alterations that drive an aggressive, drug-resistant phenotype. These findings underscore cancer cells’ capacity for rapid, adaptive phenotypic shifts that do not require driver mutations and may offer new therapeutic opportunities in the future.
Acknowledgements
We thank Dr Jeffrey Boyd and Bernadette Masinsin (University of Southern California Flow Cytometry facility) for their help with cell sorting. A.G. is supported by the National Institute of Health, National Cancer Institute (5 R01 CA172436 and P30 CA014089), as well as by the Whittier Foundation, the Coull Foundation and the Hope Foundation. G.L. is supported by the Vicky Joseph Cancer Research Foundation and the National Institute of Health, National Cancer Institute (P30 CA014089).
Abbreviations:
- COBRA
combined bisulfite restriction analysis
- DAC
5-aza-2′-deoxycytidine
- FACS
fluorescence-activated cell sorting
- GEO
gene expression omnibus
- NSP
nonside population
- PRC2
polycomb repressive complex 2
- SP
side population
- TCGA
The Cancer Genome Atlas
Footnotes
Additional Supporting Information may be found in the online version of this article.
Conflict of interest
No potential conflicts of interest disclosed by the authors.
References
- 1.Siegel RL, Miller KD, Jemal A. Cancer statistics, 2019. CA Cancer J Clin 2019;69:7–34. [DOI] [PubMed] [Google Scholar]
- 2.Hanahan D, Weinberg RA. Hallmarks of cancer: the next generation. Cell 2011;144:646–74. [DOI] [PubMed] [Google Scholar]
- 3.Jolly MK, Kulkarni P, Weninger K, et al. Phenotypic plasticity, bet-hedging, and androgen Independence in prostate cancer: role of non-genetic heterogeneity. Front Oncol 2018;8:50. [DOI] [PMC free article] [PubMed] [Google Scholar]
- 4.Li Q, Wennborg A, Aurell E, et al. Dynamics inside the cancer cell attractor reveal cell heterogeneity, limits of stability, and escape. Proc Natl Acad Sci USA 2016;113:2672–7. [DOI] [PMC free article] [PubMed] [Google Scholar]
- 5.Pisco AO, Huang S. Non-genetic cancer cell plasticity and therapy-induced stemness in tumour relapse: ‘What does not kill me strengthens me’. Br J Cancer 2015;112:1725–32. [DOI] [PMC free article] [PubMed] [Google Scholar]
- 6.Batlle E, Clevers H. Cancer stem cells revisited. Nat Med 2017;23:1124–34. [DOI] [PubMed] [Google Scholar]
- 7.Meacham CE, Morrison SJ. Tumour heterogeneity and cancer cell plasticity. Nature 2013;501:328–37. [DOI] [PMC free article] [PubMed] [Google Scholar]
- 8.Kreso A, Dick JE. Evolution of the cancer stem cell model. Cell Stem Cell 2014;14:275–91. [DOI] [PubMed] [Google Scholar]
- 9.Bell RE, Golan T, Sheinboim D, et al. Enhancer methylation dynamics contribute to cancer plasticity and patient mortality. Genome Res 2016; 26:601–11. [DOI] [PMC free article] [PubMed] [Google Scholar]
- 10.He K, Xu T, Xu Y, et al. Cancer cells acquire a drug resistant, highly tumorigenic, cancer stemlike phenotype through modulation of the PI3K/Akt/β-catenin/CBP pathway. Int J Cancer 2014;134:43–54. [DOI] [PubMed] [Google Scholar]
- 11.Gupta PB, Fillmore CM, Jiang G, et al. Stochastic state transitions give rise to phenotypic equilibrium in populations of cancer cells. Cell 2011;146:633–44. [DOI] [PubMed] [Google Scholar]
- 12.He K, Xu T, Goldkorn A. Cancer cells cyclically lose and regain drug-resistant highly tumorigenic features characteristic of a cancer stem-like phenotype. Mol Cancer Ther 2011;10:938–48. [DOI] [PMC free article] [PubMed] [Google Scholar]
- 13.Klevebring D, Rosin G, Ma R, et al. Sequencing of breast cancer stem cell populations indicates a dynamic conversion between differentiation states in vivo. Breast Cancer Res 2014;16:R72. [DOI] [PMC free article] [PubMed] [Google Scholar]
- 14.Schwitalla S, Fingerle AA, Cammareri P, et al. Intestinal tumorigenesis initiated by dedifferentiation and acquisition of stem-cell-like properties. Cell 2013;152:25–38. [DOI] [PubMed] [Google Scholar]
- 15.de Sousa e Melo F, Kurtova AV, Harnoss JM, et al. A distinct role for Lgr5. Nature 2017;543:676–80. [DOI] [PubMed] [Google Scholar]
- 16.Easwaran H, Tsai HC, Baylin SB. Cancer epigenetics: tumor heterogeneity, plasticity of stem-like states, and drug resistance. Mol Cell 2014;54: 716–27. [DOI] [PMC free article] [PubMed] [Google Scholar]
- 17.Chaffer CL, Marjanovic ND, Lee T, et al. Poised chromatin at the ZEB1 promoter enables breast cancer cell plasticity and enhances tumorigenicity. Cell 2013;154:61–74. [DOI] [PMC free article] [PubMed] [Google Scholar]
- 18.Liau BB, Sievers C, Donohue LK, et al. Adaptive chromatin Remodeling drives Glioblastoma stem cell plasticity and drug tolerance. Cell Stem Cell 2017;20:233–46.e7. [DOI] [PMC free article] [PubMed] [Google Scholar]
- 19.Roesch A, Vultur A, Bogeski I, et al. Overcoming intrinsic multidrug resistance in melanoma by blocking the mitochondrial respiratory chain of slow-cycling JARID1B(high)cells. Cancer Cell 2013;23:811–25. [DOI] [PMC free article] [PubMed] [Google Scholar]
- 20.Sharma SV, Lee DY, Li B, et al. A chromatin-mediated reversible drug-tolerant state in cancer cell subpopulations. Cell 2010;141:69–80. [DOI] [PMC free article] [PubMed] [Google Scholar]
- 21.Avgustinova A, Benitah SA. The epigenetics of tumour initiation: cancer stem cells and their chromatin. Curr Opin Genet Dev 2016;36:8–15. [DOI] [PubMed] [Google Scholar]
- 22.Becket E, Chopra S, Duymich CE, et al. Identification of DNA methylation-independent epigenetic events underlying clear cell renal cell carcinoma. Cancer Res 2016;76:1954–64. [DOI] [PMC free article] [PubMed] [Google Scholar]
- 23.Liu M, Zhang L, Li H, et al. Integrative epigenetic analysis reveals therapeutic targets to the DNA Methyltransferase inhibitor Guadecitabine (SGI-110) in hepatocellular carcinoma. Hepatology 2018; 68:1412–28. [DOI] [PMC free article] [PubMed] [Google Scholar]
- 24.Pandiyan K, You JS, Yang X, et al. Functional DNA demethylation is accompanied by chromatin accessibility. Nucleic Acids Res 2013;41:3973–85. [DOI] [PMC free article] [PubMed] [Google Scholar]
- 25.Campan MW, Weisenberger DJ, Trinh B, et al. MethyLight. Methods Mol Biol 2009;507:325–37. [DOI] [PubMed] [Google Scholar]
- 26.Triche TJ Jr, Weisenberger DJ, Van Den Berg D, et al. Low-level processing of Illumina Infinium DNA methylation BeadArrays. Nucleic Acids Res 2013;41:e90. [DOI] [PMC free article] [PubMed] [Google Scholar]
- 27.Xiong Z, Laird PW. COBRA: a sensitive and quantitative DNA methylation assay. Nucleic Acids Res 1997;25:2532–4. [DOI] [PMC free article] [PubMed] [Google Scholar]
- 28.He K, Xu T, Xu Y, et al. Cancer cells acquire a drug resistant, highly tumorigenic, cancer stemlike phenotype through modulation of the PI3K/Akt/beta-catenin/CBP pathway. Int J Cancer 2014;134:43–54. [DOI] [PubMed] [Google Scholar]
- 29.Dimopoulos K, Sogaard Helbo A, Fibiger Munch-Petersen H, et al. Dual inhibition of DNMTs and EZH2 can overcome both intrinsic and acquired resistance of myeloma cells to IMiDs in a cereblon-independent manner. Mol Oncol 2018; 12:180–95. [DOI] [PMC free article] [PubMed] [Google Scholar]
- 30.Kelly TK, Liu Y, Lay FD, et al. Genome-wide mapping of nucleosome positioning and DNA methylation within individual DNA molecules. Genome Res 2012;22:2497–506. [DOI] [PMC free article] [PubMed] [Google Scholar]
- 31.Lay FD, Liu Y, Kelly TK, et al. The role of DNA methylation in directing the functional organization of the cancer epigenome. Genome Res 2015;25: 467–77. [DOI] [PMC free article] [PubMed] [Google Scholar]
- 32.Ay A, Arnosti DN. Nucleosome positioning: an essential component of the enhancer regulatory code? Curr Biol 2010;20:R404–6. [DOI] [PubMed] [Google Scholar]
- 33.Lorch YL, LaPointe JW, Kornberg RD. Nucleosomes inhibit the initiation of transcription but allow chain elongation with the displacement of histones. Cell 1987;49:203–10. [DOI] [PubMed] [Google Scholar]
- 34.Taberlay PC, Kelly TK, Liu CC, et al. Polycomb-repressed genes have permissive enhancers that initiate reprogramming. Cell 2011;147:1283–94. [DOI] [PMC free article] [PubMed] [Google Scholar]
- 35.Komashko VM, Farnham PJ. 5-azacytidine treatment reorganizes genomic histone modification patterns. Epigenetics 2010;5:229–40. [DOI] [PubMed] [Google Scholar]
- 36.Wolff EM, Chihara Y, Pan F, et al. Unique DNA methylation patterns distinguish noninvasive and invasive urothelial cancers and establish an epigenetic field defect in premalignant tissue. Cancer Res 2010;70:8169–78. [DOI] [PMC free article] [PubMed] [Google Scholar]
- 37.Yang X, Han H, De Carvalho DD, et al. Gene body methylation can alter gene expression and is a therapeutic target in cancer. Cancer Cell 2014;26:577–90. [DOI] [PMC free article] [PubMed] [Google Scholar]
- 38.Jones PA, Issa JP, Baylin S. Targeting the cancer epigenome for therapy. Nat Rev Genet 2016;17: 630–41. [DOI] [PubMed] [Google Scholar]
- 39.Tsai HC, Li H, Van Neste L, et al. Transient low doses of DNA-demethylating agents exert durable antitumor effects on hematological and epithelial tumor cells. Cancer Cell 2012;21:430–46. [DOI] [PMC free article] [PubMed] [Google Scholar]
- 40.Liang G, Gonzales FA, Jones PA, et al. Analysis of gene induction in human fibroblasts and bladder cancer cells exposed to the methylation inhibitor 5-aza-2′-deoxycytidine. Cancer Res 2002;62:961–6. [PubMed] [Google Scholar]
- 41.Roulois D, Loo Yau H, Singhania R, et al. DNA-Demethylating agents target colorectal cancer cells by inducing viral mimicry by endogenous transcripts. Cell 2015;162:961–73. [DOI] [PMC free article] [PubMed] [Google Scholar]
- 42.Pisco AO, Brock A, Zhou J, et al. Non-Darwinian dynamics in therapy-induced cancer drug resistance. Nat Commun 2013;4:2467. [DOI] [PMC free article] [PubMed] [Google Scholar]
- 43.Kolch W, Halasz M, Granovskaya M, et al. The dynamic control of signal transduction networks in cancer cells. Nat Rev Cancer 2015;15:515–27. [DOI] [PubMed] [Google Scholar]
- 44.Baylin SB, Jones PA. Epigenetic determinants of cancer. Cold Spring Harb Perspect Biol 2016;8: a019505. [DOI] [PMC free article] [PubMed] [Google Scholar]
- 45.Feinberg AP, Koldobskiy MA, Gondor A. Epigenetic modulators, modifiers and mediators in cancer aetiology and progression. Nat Rev Genet 2016;17:284–99. [DOI] [PMC free article] [PubMed] [Google Scholar]
- 46.Flavahan WA, Gaskell E, Bernstein BE. Epigenetic plasticity and the hallmarks of cancer. Science 2017;357:eaal2380. [DOI] [PMC free article] [PubMed] [Google Scholar]
- 47.Black JC, Manning AL, Van Rechem C, et al. KDM4A lysine demethylase induces site-specific copy gain and rereplication of regions amplified in tumors. Cell 2013;154:541–55. [DOI] [PMC free article] [PubMed] [Google Scholar]
- 48.Malta TM, Sokolov A, Gentles AJ, et al. Machine learning identifies Stemness features associated with oncogenic dedifferentiation. Cell 2018;173: 338–54.e15. [DOI] [PMC free article] [PubMed] [Google Scholar]
- 49.Robertson AG, Kim J, Al-Ahmadie H, et al. Comprehensive molecular characterization of muscle-invasive bladder cancer. Cell 2017;171:540–56.e25. [DOI] [PMC free article] [PubMed] [Google Scholar]
- 50.Gal-Yam EN, Egger G, Iniguez L, et al. Frequent switching of Polycomb repressive marks and DNA hypermethylation in the PC3 prostate cancer cell line. Proc Natl Acad Sci USA 2008;105: 12979–84. [DOI] [PMC free article] [PubMed] [Google Scholar]
- 51.Widschwendter M, Fiegl H, Egle D, et al. Epigenetic stem cell signature in cancer. Nat Genet 2007;39:157–8. [DOI] [PubMed] [Google Scholar]
- 52.Fischer M, Muller GA. Cell cycle transcription control: DREAM/MuvB and RB-E2F complexes. Crit Rev Biochem Mol Biol 2017;52:638–62. [DOI] [PubMed] [Google Scholar]
- 53.Gao Y, Feng B, Lu L, et al. MiRNAs and E2F3: a complex network of reciprocal regulations in human cancers. Oncotarget 2017;8:60624–39. [DOI] [PMC free article] [PubMed] [Google Scholar]
- 54.Schaal C, Pillai S, Chellappan SP. The Rb-E2F transcriptional regulatory pathway in tumor angiogenesis and metastasis. Adv Cancer Res 2014;121:147–82. [DOI] [PubMed] [Google Scholar]
- 55.Liang B, Zhao J, Wang X. Clinical performance of E2Fs 1–3 in kidney clear cell renal cancer, evidence from bioinformatics analysis. Genes Cancer 2017;8:600–7. [DOI] [PMC free article] [PubMed] [Google Scholar]
- 56.Zeng X, Yin F, Liu X, et al. Upregulation of E2F transcription factor 3 is associated with poor prognosis in hepatocellular carcinoma. Oncol Rep 2014;31:1139–46. [DOI] [PubMed] [Google Scholar]
- 57.Feber A, Clark J, Goodwin G, et al. Amplification and overexpression of E2F3 in human bladder cancer. Oncogene 2004;23:1627–30. [DOI] [PubMed] [Google Scholar]
- 58.Olsson AY, Feber A, Edwards S, et al. Role of E2F3 expression in modulating cellular proliferation rate in human bladder and prostate cancer cells. Oncogene 2007;26:1028–37. [DOI] [PubMed] [Google Scholar]
Associated Data
This section collects any data citations, data availability statements, or supplementary materials included in this article.
Supplementary Materials
Data Availability Statement
All array-based DNA methylation and gene expression data have been deposited in the Gene Expression Omnibus (GEO) database under the accession number GSE123610. Additional data supporting our findings are available from the corresponding author upon reasonable request.