

Abstract
Researchers studying the biological effects of combustion particles typically rely on suspending particles in de-ionized (DI) water, buffer, and/or media prior to in vitro or in vivo experiments. However, the hydrophobic nature of combustion particles makes it difficult to obtain well-suspended, evenly dispersed mixtures, which also makes it difficult to obtain equivalent dosing and endpoint comparisons. This study explored the use of a quartz crystal microbalance (QCM) to measure the mass concentration of combustion particle suspensions. It compared the QCM mass concentration to that estimated by placing a known mass of combustion particles in DI water. It also evaluated the effect of drop volume and combustion particle type on QCM measurements. The results showed that QCM is a promising direct method for measuring suspended combustion particle mass concentrations, and it is particularly effective for quantifying concentrations of difficult-to-suspend particles and for combustion particles placed in polystyrene containers, which can lead to substantial particle losses.
Keywords: quartz crystal microbalance, combustion particles, dosimetry, nanoparticles, particle suspensions
1. Introduction:
Increased ambient levels of fine particulate matter (PM2.5, particulate matter with an aerodynamic diameter less than 2.5 μm) are linked to numerous adverse human health effects, including cardiovascular diseases (Bai et al., 2019; Downward et al., 2018; Rizza et al., 2019), premature death (Hu et al., 2017; Maji, Arora, & Dikshit, 2018), and decreased lung function (Habre et al., 2018; Laumbach & Kipen, 2012). Combustion particles are a major contributor to ambient PM2.5, particularly in urban areas (Karagulian et al., 2015). Consequently, engine exhaust, coal fly ash, wood burning, and flame particles are commonly used in in vitro and in vivo studies to develop a mechanistic understanding of the pathways leading to adverse biological effects. Many in vivo and in vitro studies rely on creating a known concentration of suspended combustion particles for dosing. However, difficulties in generating this known concentration can introduce uncertainty in the delivered dose, which can qualitatively and quantitatively affect biological responses (Danielsen et al., 2011; Durga, Nathiya, Rajasekar, & Devasena, 2014).
Combustion particles used for in vitro and in vivo instillation studies are typically collected on filters and subsequently suspended in DI water, buffer, or aqueous media (Antiñolo, Willis, Zhou, & Abbatt, 2015; Danielsen et al., 2011; Dumax-Vorzet, Tate, Walmsley, Elder, & Povey, 2015; Fox et al., 2015; Holder, Carter, Goth–Goldstein, Lucas, & Koshland, 2012; Jalava et al., 2012b, 2010; Jaramillo et al., 2018; Kocbach, Namork, & Schwarze, 2008a; Kumar Sharma, Wallin, & Alstrup Jensen, 2007; Lichtveld et al., 2012; Sarkar et al., 2014; Verschaeve, Nemery, Don Porto Carero, Hoet, & Schoeters, 2002). Other combustion particle collection methods include: scraping particles from a tailpipe (Brinchmann et al., 2018; Deering-Rice et al., 2011a) or cool surfaces in the exhaust system (Holder, Lucas, Goth-Goldstein, & Koshland, 2008), or directly collecting combustion particles in DI water (Gualtieri, Capasso, D’Anna, & Camatini, 2014; Pedata et al., 2013, 2012), ethanol (Fukagawa et al., 2013) or other suitable solution. Table 1 summarizes common methods used to prepare combustion particle suspensions and their corresponding limitations.
Table 1:
Methods for estimating the concentration of combustion particle suspensions and corresponding limitations.
| # | Method | Limitations |
|---|---|---|
| 1 | Weighing aluminum cuvettes/glass vials before and after evaporating a known volume of suspension (De Vizcaya-Ruiz et al., 2006; Fox et al., 2015; Gualtieri et al., 2014) | Requires sufficient PM mass to significantly exceed the balance limitations. Long wait times for evaporation of solvents (DI water is up to 4-5 days). Assumes that all particles are well suspended (no wall losses). |
| 2 | Grinding a filter punch containing a known deposited mass (Turóczi et al., 2012) | Assumes uniform deposition on filter. Assumes filter material is biologically inert. Assumes that all particles are well suspended (no floating and settled particles and no wall losses). |
| 3 | Weighing dry combustion particles ⁑ (Dang et al., 2008; Danielsen et al., 2011; Deering-Rice et al., 2011b; Dybdahl et al., 2004; Holder et al., 2008; Jalava et al., 2010; Jaramillo et al., 2018; Kocbach et al., 2008a; Kumar Sharma et al., 2007; Soto et al., 2008; Verschaeve et al., 2002) | Assumes that lyophilization and organic solvents do not change particle physicochemical properties* Assumes that all particles are well suspended (no floating and settled particles and no wall losses) |
| 4 | Weighing a filter before and after particle resuspension in aqueous media (Antiñolo et al., 2015;Lichtveld et al., 2012; Sarkar et al., 2014) | Assumes that all particles are well suspended (no floating and settled particles and no wall losses) |
| 5 | Measuring the absorbance spectra of suspension from UV-visible spectrometer(Holder et al., 2012; Pedata et al., 2013, 2012), in junction with the Lambert-Beer equation | Requires approximations about particle absorptivity, refractive index, and density, and these properties vary with fuel type and combustion conditions. (Henriksen, Ring, Call, Eddings, & Sarojim, 2007; Kim et al., 2015; Leskinen et al., 2014) |
Water condensation and evaporation from the soot particles causes morphological changes.(Ma, Zangmeister, Gigault, Mulholland, & Zachariah, 2013)
References include combustion particles scraped from a filter or impaction plate, particle standards obtained from NIST, and dried particles obtained after evaporating DI water (lyophilization) or organic solvent used to extract particles from a filter.
The assumption that all particles suspend well in DI water, buffer, or media is not appropriate for many combustion particles, which tend to be hydrophobic. These particles tend stick to the walls of containers, float on the surface of solutions, or settle when suspended in DI water (Holder et al., 2012). This can lead to an over- or under-estimation of the particle mass concentration and an inaccurate estimate of delivered dose. Consequently, there is a need for an improved method to measure combustion particle concentrations in a suspension.
The quartz crystal microbalance (QCM) is a well-established method for measuring mass (Mecea, 2006), and it is commonly used to determine airborne PM mass concentration (Chen, Romay, Li, Naqwi, & Marple, 2016; Lenz et al., 2009; Sarangi, Aggarwal, Sinha, & Gupta, 2016). Investigators have used QCM to measure the mass concentrations of colloidal suspensions. For example, Pham et al. (2004) successfully applied a QCM to measure the mass concentration of clay and polystyrene latex spheres in DI water. Reipa et al. (2010) demonstrated the use of a QCM for measuring the mass concentration of silica, silver, rhodamine B, and ferrocene nanoparticle colloids in methanol and cyclohexane. Zhuang et al. (2008) also studied the evaporation of alumina nanoparticle colloidal suspensions using the QCM crystal surface. To the best of our knowledge, the use of QCM for determining the mass concentration of combustion particle suspensions has not been throughly explored.
This study evaluated the validity of using a QCM to determine the mass concentration of three types of combustion particles (reference diesel particulate matter, flame-generated particles, and coal-fly ash particles suspended in solution) and one non-combustion particle (silica nanoparticles). The ability to estimate particle loss to container walls and to estimate the dissolved fraction of combustion particle suspensions was also tested.
2. QCM Theory
The QCM uses the change in frequency of an oscillating quartz crystal to estimate the mass of a sample. When a liquid drop is placed on the oscillating crystal, it causes a shift in the resonance frequency of the crystal. After complete evaporation of the drop, the mass of residue left on the crystal can be measured using the Sauerbrey equation (Sauerbrey, 1959):
| (1) |
where Δf is the observed change in the resonance frequency (Hz) after complete evaporation of the drop, Δm is the change in the mass (μg), Cf is the sensitivity factor of the crystal (56.6 Hz μg−1 cm2 for a 5 MHz AT-cut quartz crystal at room temperature), and A is the piezoelectrically active area (the area between the electrodes, cm2). The Sauerbrey equation is applicable only if: 1) the mass deposited is small compared to the mass of the quartz crystal; 2) the mass is rigidly deposited; and 3) the mass is evenly distributed over the crystal surface.
3. Experimental methods
This study evaluated one reference combustion particle (diesel particulate matter from an industrial Forklift, NIST 2975), flame-generated particles, coal-fly ash particles, and silica nanoparticles. The reference diesel particle suspensions were used for QCM method development, and flame and coal-fly ash particles were used to demonstrate the utility of the QCM method. To extend the method for non-combustion particles, silica nanoparticles suspensions were also tested.
3.1. Particle collection and sample preparation
Premixed flat-flame burner (FFB) generated particles were prepared by combusting a jet-fuel surrogate (Hex-12 in Table 1 of Eddings et al. (2005)) at an equivalence ratio of 2.5. A vaporizer converted the liquid fuel surrogate to the gas phase, without affecting the chemical composition of fuel after the vaporization (Table 1S, Supplementary material). All particles were collected at a height of 15 cm above the burner (post-flame region).The flame particles were collected in three different ways: 1) collection on a cold plate following by scraping, 2) collection on a PTFE filter (0.2 μm pore size, Whatman, Ltd.), and 3) direct collection via bubbling into DI water (Fig. 1S, Supplementary material). The particles deposited on the cold plate were scraped into an aluminum container. The particle-loaded filter was placed DI water and sonicated for 1 hour to resuspend particles, after which the filter was removed from the suspension. The directly collected particles were bubbled into DI water with an impinger.
The reference diesel and flame-generated particles are agglomerates of small (10 – 40 nm diameter) primary carbonaceous particles. These primary particles have a center core of elemental carbon with adsorbed species on their surface. Reference diesel contains adsorbed organic species, including polyaromatic hydrocarbons (PAHs) and nitro-PAHs, and small amounts of sulfates, nitrates, metals, and trace elements. The flame-generated particles have adsorbed PAHs, but these particles contain no sulphates, nitrates, metals, or trace elements.
Coal fly ash (CFA), derived from combustion of low-sulfur bituminous coal, was collected from the Hunter power plant near Castle Dale, UT. This CFA is a mixture of mineral-rich, mostly spherical particles, with occasional needle- and prism-shaped materials. It is composed primarily of Si (45.6%), Al (22.0%), Ca (12.1%), and Fe (7.5 %) oxides and/or salts (Lamb et al., 2017). The CFA was screened to 30 μm and subsequently fractionated to PM ≤ 2.5 μm using an Anderson Cascade Impactor interfaced with a rotary tumbler.
Silica nanoparticles were produced using a modified Stöber method (Stöber, Fink, & Bohn, 1968). First, 100 mL of absolute ethanol (200 proof, Decon Laboratories, Inc., King of Prussia, PA) was mixed with 2.8 mL of deionized water in a 250 mL flask. Then, 22.5 mL of ammonium hydroxide (28–30%, EMD Millipore Corporation, Billerica, MA) was added to the solution and the solution stirred for 10 min at room temperature. Then, 3.6 mL of tetraethyl orthosilicate (TEOS, Sigma-Aldrich (St. Louis, MO) was added dropwise to the mixture, and the reaction was left under stirring conditions for 24 h at 400 rpm. The product was washed three times by centrifugation at 5000 rpm for 30 min and stored in ethanol. The ethanol was evaporated by placing the mixture in the desiccator overnight to obtain the dried silica nanoparticles.
3.1.1. Particle suspension preparation
In-vitro studies frequently involve preparation of stock particle suspensions with concentrations up to 5 mg/mL (Jalava et al., 2012a; Kocbach, Namork, & Schwarze, 2008b; Turóczi et al., 2012), which are further diluted to concentrations required for exposure studies. The mass concentration of diluted suspensions is generally not measured prior usage. Consequently, an accurate estimate of the stock solution’s mass concentration is critical. Consequently, this study evaluated QCM behavior for suspensions with concentrations up to 3750 μg/mL. A known concentration was prepared by suspending a target mass of particles (Table 2, weighed on an AE 240 balance, Mattler-Toledo , LLC, USA; accuracy: ± 0.1 mg) in a known volume of DI water. Each suspension was sonicated for 30 min and was vigorously shaken for 10 seconds every 5 min. A 1 mL aliquot of the well-suspended fraction of each suspension was pipetted from the middle of the vial and transferred to 2 mL chromatography glass vials (Restek, France) for mass concentration measurements. Two different vial materials were used for scraped flame particles and CFA particles to understand particle losses to the walls of the container.
Table 2:
Type of nanoparticle and their concentrations used in the study
| Nanoparticle | Particle type |
Prepared concentration (μg/mL) |
Vial material | Unstableγ cone. (μg/mL) |
Mean hydrodynamic radiusφ(nm) |
|---|---|---|---|---|---|
| Reference diesel | Combustion particle | 50, 75, 150, 250, 325, 560, 1100, 2000, 3750 | Glass* | >1000 | 85.7 (0.7%) |
| Scraped flame particle | Combustion particle | 50, 100, 250, 500, 750, 1000 | Glass and Polypropylene** | >1000 | 103 (1.2%) |
| Coal-fly ash | Combustion particle | 50, 100, 250, 500, 750, 1000 | Glass and Polypropylene** | All concentrations | 765 (5.5%) |
| Silica nanoparticles | Non-combustion particle | 100, 250, 500, 750, 1000 | Glass | stable for all | 57.7 (0.3%) |
Glass: 40 mL, borosilicate, Cole Palmer
Polypropylene: 15 mL, conical polypropylene centrifuge tubes, Thermo Fischer Scientific
Unstable is defined as suspensions with visible particles either floating or settling. For reference diesel and flame particle suspensions, the particles were found floating on the surface. For CFA, particles settled at the bottom of vial.
as measured by Dynamic Light Scattering (DLS). The numbers in the parentheses represent % standard deviation (% of mean radius, n=3 for all particles except for coal-fly ash; n=6 for coal-fly ash
The suspensions for reference diesel and scraped flame particles were unstable (as evidenced by floating particles, Fig. 2S in Supplementary material) at concentrations above 1000 μg/mL. The data points for higher concentrations (> 1000 ug/mL) are reported for reference diesel particles for illustrative purposes but are excluded for the scraped flame particles.
3.1.2. Sample preparation for comparing conventional methods with QCM
The QCM measurements of flame-generated, filter-collected particles were compared with two conventional methods for determining mass concentration:
Method A: Flame particles were collected on a pre-weighed filter. After particle collection, the filter was placed in a desiccator for 2 hours, after which it was weighed in triplicate using a balance (AE 240, Mettler-Toledo). The filter was placed in a centrifuge tube containing a known volume of DI water. The solution was sonicated for 1 hour with vigorous shaking for 10 sec, every 10 min. After removal of particles from the filter, the filter was left in a desiccator overnight for drying before being weighed again in triplicate on the same microbalance (temperature between 20 – 23 °C, and relative humidity between 20 – 30%). The difference in filter mass before and after the particle removal was used to determine the particle mass resuspended in the DI water. The concentration of the suspension was estimated by dividing the mass resuspended by the volume of DI water. The particle extraction efficiency from the filter was calculated using Equation (2).
| (2) |
Method B: After particle collection, the filter was placed in a desiccator for 2 hours, after which it was weighed using a balance. The filter was placed in a 40 mL glass vial containing 20 mL of methanol (A.C.S. reagent, Aldrich Chemical Co., Inc., USA). The solution was sonicated for 45 minutes, followed by 15 min of vortexing. After extraction, the filter was left in a desiccator overnight for drying before being weighed again on the same balance in triplicate to determine extraction efficiency. The methanol extract was concentrated using a gentle flow of nitrogen to a volume of 10 mL, which was divided equally into two pre-weighed glass vials (20 mL, borosilicate, Cole Palmer). The methanol was evaporated from each vial with a gentle flow of nitrogen and in-situ heating (temperature of 55 °C) to obtain dry particles. The vials were placed in a desiccator overnight before being weighed again. The difference in the mass of vials was used to determine the mass of dried particles. A known volume of DI water was added to each vial to prepare a suspension of known concentration.
For each method, a 1 mL aliquot of the suspension was pipetted into a 2 mL glass vial for QCM analysis.
3.1.3. Sample preparation for measuring the dissolved fraction of the flame-collected samples
QCM estimates of the fraction of dissolved species in the samples (flame generated particle suspensions) were obtained for the three particle collection methods (scraped from a cold surface, collected on afilter, and directly collected in DI water, Section 3.1). Dissolved species in these samples can come from organics that leech from the particle surface into the aqueous phase (all samples) or from gas-phase species that are sufficiently soluble in the aqueous phase to remain in DI water (direct collection method). To measure the contribution of dissolved species to the total mass of the suspension, each of the suspensions was filtered through a 20-nm syringe filter (Anotop, Whatman, GE Healthcare Life Sciences, UK), followed by QCM measurements of both the unfiltered and the 20-nm filtered samples. Dynamic light scattering (DLS, Mobius, Wyatt technology corporation) confirmed the absence of any particles in the 20-nm filtered samples. The percent dissolved species was calculated using Equation 3.
| (3) |
3.2. Mass concentration using QCM
Particle mass concentration was measured using a QCM (QCM200, Stanford Research System, CA, USA) and a 5MHz AT-cut crystal (Plano – Plano, Cr/Au, 1-inch diameter). Before placing the drop on the crystal, the crystal was stabilized inside an incubator (Model 10E, Quincy Lab, Inc. USA) at a constant temperature of 25 °C (± 1 °C). After the crystal frequency attained a constant value (± 0.1 Hz), a drop of known volume (0.5 μL, 5 μL, or 10 μL) of the suspension was carefully placed in the center of the crystal using a micro-syringe (SGE Analytical Science Pty Ltd, Australia) and left to dry. After complete evaporation of the drop and after the frequency signal had remained stable for one minute (± 0.1 Hz), the change in the crystal’s resonance frequency of crystal was measured. The mass of the residual material on the crystal was estimated from the Sauerbrey equation (Eq. 1), with a crystal area (A) of 0.28274 cm2 (radius of 0.3 cm). Placing a drop of DI water (blank) on the QCM revealed no residual mass remaining on the crystal (Fig. 3S, Supplementary material). The micro syringe was rinsed with ethanol between samples. The sample was sonicated for a minute before every measurement. The crystal was changed between sample types and after every four consecutive readings. For concentrations greater than 250 μg/mL, the crystal was changed after two readings. For silica nanoparticles, the crystal was changed after every run for all concentrations. The used crystal was then cleaned using a standard clean-1 solution (5 parts DI water, 1 part 27% ammonium hydroxide, 1 part 30% hydrogen peroxide at 70°C for 10 min). For each sample and drop volume, four QCM readings were collected.
4. Results and Discussion
4.1. QCM behavior during evaporation of a suspension
Figure 1 shows the typical characteristics of the crystal frequency signal during the evaporation of a 0.5 μL drop of NIST reference diesel and flame-particle suspensions. The frequency patterns were similar for both the samples, i.e., a sudden drop in frequency when the drop was placed on the crystal, after which the frequency remained somewhat constant followed by a sudden drop before returning to a stable value. The final stable frequency was lower than the original frequency because of the residue left after the drop evaporated. Pham et al.(Pham et al., 2004) described similar behavior from the evaporation of a 0.5 μL drop of 1.9 μm monodisperse latex spheres. When a drop was placed on the crystal, a portion of the crystal-air interface was replaced with a crystal-liquid interface, causing a decrease in frequency (f, noted as ‘1’ in Fig. 1) and increase in resistance (R). As the drop began evaporating, the drop height began decreasing without any solid deposition on the crystal surface, which yielded a constant frequency (‘2’ in Fig. 1) and resistance. Before complete evaporation of the drop, the particles flowed to the edge of the drop, increasing the density-viscous product, which led to damping of crystal oscillation and consequently a sudden drop in frequency (‘3’ in Fig. 1) and rise in resistance. At this stage, the particles were not firmly deposited on the crystal surface due to a fine film of water between the particles and crystal. When all the water finally evaporated, the frequency increased (‘4’ in Fig. 1) and then returned to a constant value (± 0.1Hz), and the resistance returned to the starting value (before drop placement), i.e. ΔR = 0, indicating that the particles were firmly deposited on the crystal. The firm deposition allows the use of the Sauerbrey equation. A change in resistance (ΔR ≠ 0) after the drop fully evaporated is an indicator of dissipative losses, which further implies non-rigid deposition of particles on the crystal surface. The Sauerbrey equation cannot be used for non-rigid deposition of particles.
Figure 1:


QCM resonance frequency (left axis) and resistance (right axis) versus time for 0.5 μL drops of: a) reference diesel suspension, and b) scraped flame-particle suspension. The numbers in (a) show the different stages of drop evaporation. The change in resonance frequency, Δf after the drop fully evaporated was used in Equation 1 for mass estimates.
4.2. Effect of drop volume on QCM estimated concentrations
After complete evaporation of each drop, the deposition of the particles on the crystal was not uniform but in the form a ring, which increased in diameter with drop volume. The radii of the deposited ring for 0.5 μL, 5 μL, and 10 μL samples were 0.5, 1.5, and 2.1 mm, respectively (Fig 4S). The 0.5 μL, 5 μL, and 10 μL volumes required approximately 5, 20, and 35 min, respectively, for complete evaporation. As shown in Figure 2, for the 0.5 μL drop size and for concentrations up to 500 μg/mL, the estimated concentration from the QCM for the reference diesel suspension was within 1% of the prepared solution (slope of 1.007 ± 0.002). With increasing drop volume, the QCM mass concentration estimates were lower than those of the corresponding prepared solutions. The QCM’s underestimation of particle mass concentration at higher drop volumes was due to the effect of Gaussian radial distribution on mass. As discussed by Pham et al. (2004), the effect of Gaussian radial distribution on mass can be neglected for a 5MHz AT-cut crystal with electrode size of 2.5 mm (radius) when the radius of the deposited particle ring is within 1 mm of the center of the crystal. Because our electrode size is slightly larger, 3mm, the effect of Gaussian radial distribution can be neglected within a radius of slightly more than 1mm. The size of the region where the effect of Gaussian radial distribution may be neglected depends on the size of the electrode and the crystal’s resonance frequency (Huang, Bai, Hu, & Hou, 2017). Consequently, the smallest volume sample (0.5 μL) provided the best estimation of mass, compared to the 5 μL and 10 μL samples, and it also evaporated in the shortest time. Therefore, 0.5 μL drop size was used for all further analyses. Since the combustion particles sticks to polypropylene pipette tips, for all particle types a micro syringe was used for placing the 0.5 μL drop on the crystal. The drop volume less than 0.5 μL were not attempted. We believe that, below 0.5 μL it may be difficult to obtain a homogeneous suspension.
Figure 2:

Effect of drop size (0.5 μL 5 μL and 10 μL) on estimated mass by QCM for reference diesel suspensions. The y-error bars denote standard deviation (n = 4). The x-error bar is estimated from the balance accuracy (± 0.1 mg) associated with the measured target mass.
For measurements of stable suspensions at a constant drop volume of 0.5 μL the QCM estimates of mass were within 0.3 to 12% of the target mass concentration, and the standard deviation of the QCM measurements varied by 0.5 to 9%. Several factors can affect our estimates of accuracy and precision. First, the estimated accuracy of the QCM measurements is affected by the ability to prepare suspensions with known concentrations, which are being compared to the QCM, and this is affected by the accuracy of the balance and the accuracy of pipetting a known volume of DI water into the target mass.. These uncertainties will affect the final slopes obtained from the linear fit between the prepared concentration and QCM estimated concentrations. Second, suspension homogeneity, the ability to obtain accurate and consistent drop volumes, drop placement on the crystal, and temperature fluctuations can all cause variability in the QCM readings.
4.3. Sequential drop measurements
Sequential drop method, i.e., use of the same crystal for multiple measurements without changing and cleaning the crystal in between measurements, allows for faster measurements (saves time required for changing the crystal and time for crystal equilibrium). However, careful consideration is required before using a sequential drop method for nanoparticle suspensions. Depending on the type of nanoparticle used, sequential drop placement may or may not lead to a rigid layer of dried mass on the crystal. As discussed in Section 2, the Sauerbrey equation (Eq. 1) is only valid for rigid layer deposition, which can be confirmed by negligible dissipative losses, i.e., the change in resistance (ΔR) after the drop fully evaporates should be negligible. For combustion particles (i.e., coal fly ash, Fig. 3a) the dissipative losses were found to be negligible for sequential drop placements. However, for silica nanoparticle (Fig. 3b), the dissipative losses after the second sequential drop were not negligible i.e. ΔR ≠ 0, requiring a change of crystal after every run.
Figure 3:
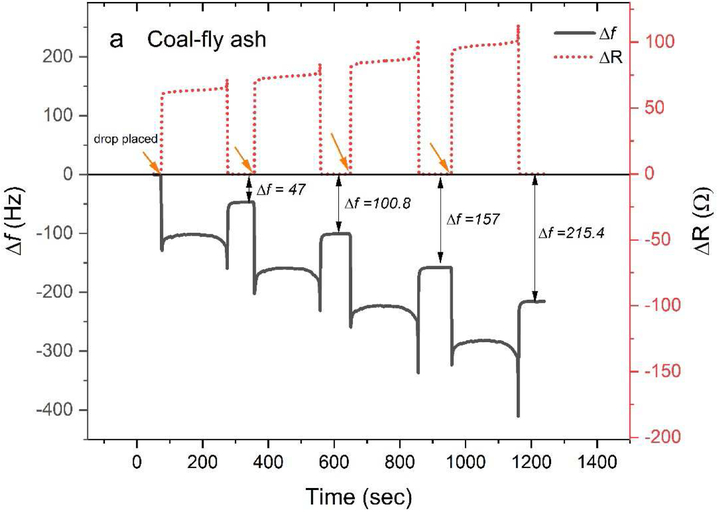

QCM resonance frequency versus time for sequential application (at the time indicated by arrows) of 0.5 μL drops of a) coal-fly ash particle suspension (500 μg/mL), and b) silica nanoparticle suspension (500 μg/mL). The numbers for Δf represent the change in resonance frequency of the crystal after the drop fully evaporated. The resistance, ΔR (seen from the red dotted line), for silica nanoparticle suspension after the second drop is nonzero.
4.4. QCM response to nanoparticle suspensions
4.4.1. Reference diesel
Figure 4a shows the QCM calibration curve for the reference diesel particle concentrations with a 0.5 μL drop size. For concentrations up to 1100 μg/mL, the QCM exhibited a linear response to the prepared concentrations, with a slope of 1.012 ± 0.005. The suspensions were unstable at higher concentrations (>1100 μg/mL), with ~30 % (based on QCM measurements, ‘unstable suspension’ points shown in Fig. 4a) of the mass floating on the surface of the DI water. Such unstable concentrations can lead to incorrect estimates of mass concentration and consequently of delivered doses in biological studies.
Figure 4:


Prepared vs. estimated mass concentration for 0.5 μL drop volumes: a) Reference diesel particles; b) Scraped flame particles prepared in two different vial materials (glass and polypropylene); c) Coal-fly ash; and d) Silica nanoparticles.
4.4.2. Scraped flame particle suspensions
The QCM also preformed well for flame-generated combustion particle suspensions when the suspensions were prepared in glass vials (Fig. 4b). The QCM provided a linear response compared to the concentrations prepared in glass vials, with a slope of 1.070 ± 0.020. This suggests that the QCM can provide an accurate mass concentration estimate of flame-particle suspensions, within 7% of that obtained by weighing a target mass of particles followed by suspension in a known volume of DI water. Comparing Figure 4a and Figure 4b shows that the agreement between QCM response and the prepared particle mass differs for reference diesel (within 1.2%) and for flame-generated particles (within 7%). The difference in the wettability of these two particles could be the primary reason for such behavior. As suggested by Petters et al. (2006) the presence of more hydrophilic species, such as sulphates, nitrates, and secondary organic species, determines the hydrophobic-to-hydrophilic conversion of carbonaceous particles. Therefore, one would expect the reference diesel particles, which contain sulphate and nitrate species, to have better wettability than the flame- generated particles, which do not contain sulphates or nitrates. Other potential sources for these differences include homogeneity of the sample, errors in weighing the target mass of particles, and the accuracy of the balance.
When the same particle concentrations were prepared in sterile polypropylene centrifuge tubes (Fig. 4b), the concentrations of the well-suspended portion of the suspensions were significantly lower than the prepared concentrations. The slope of the linear fit between prepared and estimated concentration decreased from 1.070 ± 0.020 to 0.632 ± 0.030 (a statistically significant difference, p<0.01). A substantial mass of the particles, as high as 35 % for higher concentrations, was lost to the walls of the vial (observed visibly, see Fig. 2S in Supplementary material). This finding underlines the need to account for potential particle losses when preparing suspensions for biological analysis, particularly when particles with different physicochemical properties are being compared (i.e., PM loss may be non-uniform, thus affecting relative doses).
4.4.3. Coal-fly ash particle suspensions
For CFA particle suspensions prepared in glass vials (Fig 4c), a linear fit between QCM estimated and prepared concentration with a slope of 1.026 ± 0.02 was observed. A similar fit was observed for the suspensions prepared in polypropylene vials (slope of 1.001 ± 0.018, Fig. 5S, Supplementary material). Unlike flame particles, no loss of particles to the vial walls was observed for CFA suspensions. However, due to their larger size (<2.5 μm, aerodynamic diameter size cut), the settling rate was high for the CFA particles (visible settling within 5 min after a minute of sonication, Fig. 6S, Supplementary material). The high settling rate can affect the homogeneity of the suspension. To avoid the effect of the settling on the QCM readings, it was necessary to sonicate and vortex the suspension before every measurement.
4.4.4. Silica nanoparticle suspension
The response of the QCM for silica nanoparticle suspensions in DI water were compared against known suspension concentrations. From Figure 4d, linear fit with slope 1.003 ± 0.006, were obtained between prepared and estimated concentrations, indicating that QCM is also effective for non-combustion particle suspensions.
4.5. Comparison with conventional methods
As shown in Table 3, particle collection Method A estimated a higher mass concentration than the QCM method. Method A samples were prepared in a polypropylene vial, and some particles were lost to the walls of the vials (also observed visually). Method A ignored particle losses and assumed all particles were suspended in the water, which led to an overestimation of particle mass concentration, and this overestimation increased as particle mass concentration increased (from 2 % to 23 % loss). On the other hand, the QCM provided a direct estimate of the suspended particle concentration and consequently a lower mass concentration.
Table 3:
Comparison of QCM with two conventional methods for estimating the mass concentration of flame-generated particle suspensions.
| Method | Total particle mass collected on the filter (mg) |
Extraction efficiency from filter (%) |
Dried mass in vials (mg) |
Prepared concentration (μg/mL) |
QCM estimated concentration (μg/mL) |
|||
|---|---|---|---|---|---|---|---|---|
| Vial 1 | Vial 2 | Vial 1 | Vial 2 | Vial 1 | Vial 2 | |||
| A | 2.7±0.1* | 79.6±3.70 | 215±10.0 | 210±1.17$ | ||||
| A | 1.5±0.1 | 66.7±6.38 | 333±33.3 | 254±32.0 | ||||
| B | 4.8±0.1 | 100±2.09 | 2.3± 0.1 | 2.4± 0.1 | 300±7.42 | 500±20.8 | 267±29.1 | 392±41.1 |
error due to the weighing balance accuracy i.e. ± 0.1 mg
error in QCM readings (standard deviation, n=3)
Particle collection Method B was able to achieve 100% collection efficiency. The dried particle mass obtained in each vial was 2.3 and 2.4 mg, respectively (Table 3). Based on this mass, suspensions with concentrations of 300 μg/mL and 500 μg/mL were prepared by adding a known volume of DI water. Again, the values obtained by QCM were lower than those estimated by Method B. These suspensions were prepared in glass vials, and no particle loss to the walls was observed. However, the particles obtained after methanol evaporation were found to be more hydrophobic than the particles prepared by Method A, and the suspensions were unstable (particles visibly observed floating on the surface and settled at the bottom of the vial). The evaporation of methanol at 55 °C could have driven off semi-volatile species from the sample, making the particles more hydrophobic. Because only the well-suspended part of the sample was analyzed by QCM, Method B overestimated the sample’s mass concentration compared to the QCM. Furthermore, this change in hydrophobicity associated with Method B was an indication of a change in the physicochemical properties of the combustion particles, and it is important to understand how different particle collection and processing methods affect combustion particle physicochemical properties. Additional study of these changes would be worthwhile.
In summary, our results suggest that QCM may provide a more accurate estimate of combustion particle mass concentrations than conventional methods because it does not rely on an extraction-evaporation process.
4.6. Determining dissolved species in suspension
One more potential advantage of the QCM method is the ability to quickly estimate the mass of dissolved species in the suspension using a small volume of sample. The difference in QCM readings from 20-nm filtered suspensions and unfiltered suspensions for the three collection methods (scraped, filtered, and direct collection in DI water) allowed the calculation of the mass contribution from dissolved species for each collection method. The direct collection method contained 56.4 % (± 9.3 %) dissolved species, whereas the filtered and scraped samples contained 34.21 % (± 3.4 %) and 25.8 % (± 2 %) dissolved species, respectively. The number in the parenthesis corresponds to the standard deviation of the QCM readings. The dissolved organic content of combustion particle suspensions is an important factor governing biological responses. For example, Libalova et al. (2018) found that polycyclic aromatic hydrocarbon content in the extracts of ambient PM induced cellular reactive oxygen species production in a model human lung cell line.
4.7. Limitations and sources of error
Although this study demonstrated the promise of the QCM method, this method still has limitations. For example, we performed the study using DI water. Studies have used a variety of media for particle suspension, e.g. cellular media, phosphate-buffered saline (PBS), and DMSO (Dybdahl et al., 2004; Fox et al., 2015; Jalava et al., 2012b; Kocbach et al., 2008a; Soto, Garza, Shi, & Murr, 2008). We attempted to suspend particles directly in RPMI media (Roswell Park Memorial Institute medium 1640, Bio-Rad, Inc. Hercules, CA) and PBS solutions. However, the high salt concentrations in these media caused such high background mass estimates that combustion particle concentrations could not be estimated (Fig. 3S, Supplementary material). Consequently, this method may not be feasible for media that contains salts or significant levels of background particles. To eliminate the effect of solvent background on the QCM readings, use of particle-free and salt-free solvent is advised.
The QCM could also be subject to potential sources of error, including, pipetting an exact drop volume; placing the drop exactly in the center of the crystal; fluctuating temperature; non-uniform distribution of particles in the suspension; and vibrational noise from external sources. Many of these potential sources of error can be mitigated through standard operating procedures and limiting vibration. Our standard operating procedures included operation in an incubator to control temperature. Vibration from normal activities in the laboratory did not affect the QCM’s response. However, operation of a vortex and construction activities did affect the QCM’s response, and we did not perform our tests during these times. It is also important to consider the stability of the crystal itself at the QCM measurement temperature. AT-cut crystals (used in this study) have good stability (± 3 Hz/°C) at room temperature. Consequently, it is important to select the correct crystal and maintain a constant temperature (i.e., in a precision regulated incubator) when measuring the concentration using QCM. Another parameter of interest could be humidity, which may affect the rate of drop evaporation. For all the experiments performed in this study, the humidity was not controlled, and the ambient humidity level was stable between value 20 – 30 %. In case the measurements are being taken in environment with high relative humidity levels, use of desiccant is suggested.
5. Implications
The results of this study suggest that QCM can be used for other types of nanoparticles beyond those considered in this study as long as they fulfill the Sauerbrey equation requirements. For the particles evaluated in this study, a linear fit can provide a universal relationship between QCM estimated mass and prepared concentration (Fig. 7S, slope of 1.027 ±0.008). This linear fit with and error of 2.7% suggests that for small drop volumes, the response of the QCM is unaffected by the particle type.
Accurate measurements of combustion particle mass concentrations are an important step toward a better estimate of the delivered dose in toxicological studies. The QCM also (1) allows for an estimation of dissolved organic species (discussed in Section 4.6), and (2) can facilitate an estimate of particle surface area dose. The total delivered surface area has been suggested as better dose metric than mass dose in biological studies (Schmid & Stoeger, 2016). The estimation of total delivered surface area requires information about the total number of primary particles in a sample (Ku & Kulkarni, 2012). The total number of primary particles in a sample can be determined from the QCM mass measurement, the size (measured by HR-TEM) of the primary particle, and the true density of the primary particles (Ouf et al., 2019; Teoh et al., 2019).
6. Conclusions
This study demonstrated that the QCM is a promising technique for accurately estimating the mass concentration of combustion particles in suspensions. The QCM provided accurate and precise estimates of mass concentration for reference diesel PM (± 1.2%), flame-generated combustion particles (± 7%), coal-fly ash (± 2.6%), and silica nanoparticles (± 0.3%). The method required a small sample volume (0.5 μL) and provided rapid results (5 min). The QCM can be used to determine the mass concentration of different types of combustion particles, irrespective of their collection method. Furthermore, the QCM method facilitates the estimation of particle loss (due to interactions with container walls, floating on the surface or due to settling), and coupled with a 20-nm filter, can rapidly estimate the proportion of dissolved organics of a sample. Overall, QCM may be a useful tool for quantifying the mass concentrations of combustion particle suspensions, and with broad applications in in vitro and in vivo studies of combustion particles.
Supplementary Material
Highlights.
QCM allows precise mass concentration measurements of combustion particle suspensions
Substantial particle loss can occur due to particle-wall interactions
QCM allows estimation of dissolved organic fraction of a suspension
Acknowledgments
Support for this research was provided by grants from the National Institute of Environmental Health Sciences, National Institutes of Health (5K25ES027504-02, R01ES024681, ES017431, and ES027015). This work was supported by a Merit Research Grant from the Department of Veterans Affairs (660-D64122).
Biography

Kamaljeet Kaur
Kamaljeet Kaur received the B. Tech. and M. Tech. degrees in chemical engineering from IIT Kanpur, Kanpur, India, in 2015. She is currently pursuing her Ph.D. degree in chemical engineering at the University of Utah, Salt Lake City, Utah, USA. Her current research focuses on linking the physicochemical properties such as size, shape, and chemical composition of combustion particles with health effects.

Raziye Mohammadpour
A cellular and molecular biologist by background, Dr. Mohammadpour’s research is focused on understanding the in vitro and in vivo toxicity of silica nanoparticles and poly(amido amine) dendrimers as a function of physicochemical properties such as size, porosity and surface functionality. Her current investigation involves acute, subchronic, and chronic in vivo toxicity assessments of nonporous and mesoporous silica nanoparticles in rodents.

Cristina Jaramillo
Isabel C Jaramillo is a Research associate of the Chemical Engineering Department at the University of Utah. She earned her Master Science degree in Chemical and Fuels Engineering and PhD in Chemical Engineering from the same university. Her research focuses on combustion-generated fine particulate matter formation, soot oxidation and the characterization of flame-generated soot. Her interests include particle sampling methods and the application of different statistical source-receptor models such as Principal Component Analysis (PCA), Positive Matrix Factorization (PMF) and Chemical Mass Balance (CMB), to characterize and quantify the potential Particulate Matter (PM) emissions from combustion sources. Her work has been featured in many scientific journals.

Hamid Ghandehari
Hamid Ghandehari is a Professor at the Departments of Pharmaceutics and Pharmaceutical Chemistry and Bioengineering. His research focuses on the design of polymeric drug delivery systems and assessing the toxicity of nanoparticles. Dr. Ghandehari is Editor in Chief of Advanced Drug Delivery Reviews, Fellow of the American Institute for Medical and Biological Engineering, the American Association of Pharmaceutical Scientists and the Controlled Release Society. He has published nearly 190 articles and given over 250 invited talks. He received his BS in Pharmacy and Ph.D. in Pharmaceutics and Pharmaceutical Chemistry from the University of Utah.

Christopher Reilly
Dr. Reilly is a Professor in the Department of Pharmacology and Toxicology at the University of Utah. His research focuses on elucidating biochemical mechanisms by which xenobiotics interact with and affect, in beneficial and adverse ways, humans. Dr. Reilly’s research program focuses on: 1) the role of transient receptor potential (TRP) ion channels in environmental lung diseases such as asthma and COPD; 2) the role of cytochrome P450 enzymes in regulating the toxicity and therapeutic efficacy of xenobiotics; and 3) drug discovery, specifically focusing on TRP modulators to manage inflammation, pain, respiratory and other diseases.

Robert Paine
Robert Paine MD is Chief of Pulmonary and Critical Care Medicine at the University of Utah and is actively engaged in clinical care, basic and clinical research, and medical education. Paine has a long-term research interest in alveolar cell biology in pulmonary innate immunity. He directs an active basic research laboratory investigating the effects of stressors including infection, air pollution, and other environmental factors on these innate immune responses. He is also involved in human studies to understand chronic smoking-related illnesses. He has been a leader in state policy issues related to air pollution, and currently leads the University of Utah program for air quality health and society.

Kerry Kelly
Dr. Kerry Kelly is an Assistant Professor in Chemical Engineering at the University of Utah. Her research focuses on the links between energy, air quality, and human health. She received a B.S. in Chemical Engineering from Purdue University, a M.S. in Environmental Engineering from the University of North Carolina-Chapel Hill, and a Ph.D. in Environmental Engineering from the University of Utah. Her research includes projects to understand the links between combustion particle properties and their health effects, to develop the next-generation of low-cost particulate matter sensors, and to help engage high-school and middle-school students as citizen scientists.
Footnotes
Publisher's Disclaimer: This is a PDF file of an unedited manuscript that has been accepted for publication. As a service to our customers we are providing this early version of the manuscript. The manuscript will undergo copyediting, typesetting, and review of the resulting proof before it is published in its final citable form. Please note that during the production process errors may be discovered which could affect the content, and all legal disclaimers that apply to the journal pertain.
References
- Antiñolo M, Willis MD, Zhou S, & Abbatt JPD (2015). Connecting the oxidation of soot to its redox cycling abilities. Nature Communications, 6, 6812 10.1038/ncomms7812 [DOI] [PMC free article] [PubMed] [Google Scholar]
- Bai L, Weichenthal S, Kwong JC, Burnett RT, Hatzopoulou M, Jerrett M, … Chen H (2019). Associations of Long-Term Exposure to Ultrafine Particles and Nitrogen Dioxide With Increased Incidence of Congestive Heart Failure and Acute Myocardial Infarction. American Journal of Epidemiology, 188(1), 151–159. 10.1093/aje/kwy194 [DOI] [PubMed] [Google Scholar]
- Brinchmann BC, Ferrec E, Le Podechard N, Lagadic-Gossmann D, Shoji KF, Penna A, … Øvrevik J (2018). Lipophilic chemicals from diesel exhaust particles trigger calcium response in human endothelial cells via aryl hydrocarbon receptor non-genomic signalling. International Journal of Molecular Sciences, 19(5), 1–20. 10.3390/ijms19051429 [DOI] [PMC free article] [PubMed] [Google Scholar]
- Chen M, Romay FJ, Li L, Naqwi A, & Marple VA (2016). A novel quartz crystal cascade impactor for real-time aerosol mass distribution measurement. Aerosol Science and Technology, 50(9), 971–983. 10.1080/02786826.2016.1213790 [DOI] [Google Scholar]
- Dang SS, Serafino A, Müller JO, Jentoft RE, Schlögl R, & Fiorito S (2008). Cytotoxicity and inflammatory potential of soot particles of low-emission diesel engines. Environmental Science and Technology, 42(5), 1761–1765. 10.1021/es0716554 [DOI] [PubMed] [Google Scholar]
- Danielsen PH, Møller P, Jensen KA, Sharma AK, Wallin H, Bossi R, … Loft S (2011). Oxidative Stress, DNA Damage, and Inflammation Induced by Ambient Air and Wood Smoke Particulate Matter in Human A549 and THP-1 Cell Lines. Chemical Research in Toxicology, 24(2), 168–184. 10.1021/tx100407m [DOI] [PubMed] [Google Scholar]
- De Vizcaya-Ruiz A, Gutiérrez-Castillo ME, Uribe-Ramirez M, Cebrián ME, Mugica-Alvarez V, Sepúlveda J, … Froines J (2006). Characterization and in vitro biological effects of concentrated particulate matter from Mexico City. Atmospheric Environment, 40, 583–592. 10.1016/J.ATM0SENV.2005.12.073 [DOI] [Google Scholar]
- Deering-Rice CE, Romero EG, Shapiro D, Hughen RW, Light AR, Yost GS, … Reilly CA (2011a). Electrophilic components of diesel exhaust particles (DEP) activate transient receptor potential ankyrin-1 (TRPA1): A probable mechanism of acute pulmonary toxicity for DEP. Chemical Research in Toxicology, 24(6), 950–959. 10.1021/tx200123z [DOI] [PMC free article] [PubMed] [Google Scholar]
- Deering-Rice CE, Romero EG, Shapiro D, Hughen RW, Light AR, Yost GS, … Reilly CA (2011b). Electrophilic Components of Diesel Exhaust Particles (DEP) Activate Transient Receptor Potential Ankyrin-1 (TRPA1): A Probable Mechanism of Acute Pulmonary Toxicity for DEP. Chemical Research in Toxicology, 24(6), 950–959. 10.1021/tx200123z [DOI] [PMC free article] [PubMed] [Google Scholar]
- Downward GS, van Nunen EJHM, Kerckhoffs J, Vineis P, Brunekreef B, Boer JMA, … Vermeulen R (2018). Long-Term Exposure to Ultrafine Particles and Incidence of Cardiovascular and Cerebrovascular Disease in a Prospective Study of a Dutch Cohort. Environmental Health Perspectives, 126(12), 127007 10.1289/EHP3047 [DOI] [PMC free article] [PubMed] [Google Scholar]
- Dumax-Vorzet AF, Tate M, Walmsley R, Elder RH, & Povey AC (2015). Cytotoxicity and genotoxicity of Urban particulate matter in mammalian cells. Mutagenesis, 30(5), 621–633. 10.1093/mutage/gev025 [DOI] [PMC free article] [PubMed] [Google Scholar]
- Durga M, Nathiya S, Rajasekar A, & Devasena T (2014). Effects of ultrafine petrol exhaust particles on cytotoxicity, oxidative stress generation, DNA damage and inflammation in human A549 lung cells and murine RAW 264.7 macrophages. Environmental Toxicology and Pharmacology, 38(2), 518–530. 10.1016/j.etap.2014.08.003 [DOI] [PubMed] [Google Scholar]
- Dybdahl M, Risom L, Bornholdt J, Autrup H, Loft S, & Wallin H (2004). Inflammatory and genotoxic effects of diesel particles in vitro and in vivo. Mutation Research - Genetic Toxicology and Environmental Mutagenesis, 562(1–2), 119–131. 10.1016/j.mrgentox.2004.05.010 [DOI] [PubMed] [Google Scholar]
- Eddings EG, Yan S, Ciro W, & Sarofim AF (2005). Formulation of a surrogate for the simulation of jet fuel pool fires. Combustion Science and Technology, 177(4), 715–739. [Google Scholar]
- Fox JR, Cox DP, Drury BE, Gould TR, Kavanagh TJ, Paulsen MH, … Kaufman JD (2015). Chemical characterization and in vitro toxicity of diesel exhaust particulate matter generated under varying conditions. Air Quality, Atmosphere & Health, 8(5), 507–519. 10.1007/s11869-014-0301-8 [DOI] [PMC free article] [PubMed] [Google Scholar]
- Fukagawa NK, Li M, Poynter ME, Palmer BC, Parker E, Kasumba J, & Holmén BA (2013). Soy biodiesel and petrodiesel emissions differ in size, chemical composition and stimulation of inflammatory responses in cells and animals. Environmental Science & Technology, 47(21), 12496–12504. [DOI] [PMC free article] [PubMed] [Google Scholar]
- Gualtieri M, Capasso L, D’Anna A, & Camatini M (2014). Organic nanoparticles from different fuel blends: In vitro toxicity and inflammatory potential. Journal of Applied Toxicology, 34(11), 1247–1255. 10.1002/jat.3067 [DOI] [PubMed] [Google Scholar]
- Habre R, Zhou H, Eckel SP, Enebish T, Fruin S, Bastain T, … Gilliland F (2018). Short-term effects of airport-associated ultrafine particle exposure on lung function and inflammation in adults with asthma. Environment International, 118, 48–59. 10.1016/J.ENVINT.2018.05.031 [DOI] [PMC free article] [PubMed] [Google Scholar]
- Henriksen T, Ring T, Call D, Eddings E, & Sarojim A (2007). Determination of Soot Refractive Index as a Function of Height in an Inverse Diffusion Flame. 5th US Combustion Meeting, 1795–1803. Retrieved from https://collections.lib.utah.edu/dl_files/db/6e/db6ea129148614ff69621d4489ada15c866418e8.pdf [Google Scholar]
- Holder AL, Carter BJ, Goth–Goldstein R, Lucas D, & Koshland CP (2012). Increased cytotoxicity of oxidized flame soot. Atmospheric Pollution Research, 3, 25–31. 10.5094/apr.2012.001 [DOI] [Google Scholar]
- Holder AL, Lucas D, Goth-Goldstein R, & Koshland CP (2008). Cellular response to diesel exhaust particles strongly depends on the exposure method. Toxicological Sciences, 103(1), 108–115. [DOI] [PubMed] [Google Scholar]
- Hu J, Huang L, Chen M, Liao H, Zhang H, Wang S, … Ying Q (2017). Premature Mortality Attributable to Particulate Matter in China: Source Contributions and Responses to Reductions. Environmental Science & Technology, 51(17), 9950–9959. 10.1021/acs.est.7b03193 [DOI] [PubMed] [Google Scholar]
- Huang X, Bai Q, Hu J, & Hou D (2017). A Practical Model of Quartz Crystal Microbalance in Actual Applications. Sensors (Basel, Switzerland), 17(8). 10.3390/s17081785 [DOI] [PMC free article] [PubMed] [Google Scholar]
- Jalava PI, Happo MS, Kelz J, Brunner T, Hakulinen P, Mäki-Paakkanen J, … Hirvonen M-R (2012a). In vitro toxicological characterization of particulate emissions from residential biomass heating systems based on old and new technologies. Atmospheric Environment, 50, 24–35. [Google Scholar]
- Jalava PI, Happo MS, Kelz J, Brunner T, Hakulinen P, Mäki-Paakkanen J, … Hirvonen MR (2012b). Invitro toxicological characterization of particulate emissions from residential biomass heating systems based on old and new technologies. Atmospheric Environment, 50(2012), 24–35. 10.1016/j.atmosenv.2012.01.009 [DOI] [Google Scholar]
- Jalava PI, Salonen RO, Nuutinen K, Pennanen AS, Happo MS, Tissari J, … Hirvonen M (2010). Effect of combustion condition on cytotoxic and in fl ammatory activity of residential wood combustion particles. Atmospheric Environment, 44(13), 1691–1698. 10.1016/j.atmosenv.2009.12.034 [DOI] [Google Scholar]
- Jaramillo IC, Sturrock A, Ghiassi H, Woller DJ, Deering-Rice CE, Lighty JAS, … Kelly KE (2018). Effects of fuel components and combustion particle physicochemical properties on toxicological responses of lung cells. Journal of Environmental Science and Health - Part A Toxic/Hazardous Substances and Environmental Engineering, 53(4), 295–309. 10.1080/10934529.2017.1400793 [DOI] [PMC free article] [PubMed] [Google Scholar]
- Karagulian F, Belis CA, Dora CFC, Prüss-Ustün AM, Bonjour S, Adair-Rohani H, & Amann M (2015). Contributions to cities’ ambient particulate matter (PM): A systematic review of local source contributions at global level. Atmospheric Environment, 120, 475–483. 10.1016/J.ATMOSENV.2015.08.087 [DOI] [Google Scholar]
- Kim J, Bauer H, Dobovičnik T, Hitzenberger R, Lottin D, Ferry D, … Dobovi T (2015). Assessing Optical Properties and Refractive Index of Combustion Aerosol Particles Through Combined Experimental and Modeling Studies. Aerosol Science and Technology, 49(5), 340–350. 10.1080/02786826.2015.1020996 [DOI] [Google Scholar]
- Kocbach A, Namork E, & Schwarze PE (2008a). Pro-inflammatory potential of wood smoke and traffic-derived particles in a monocytic cell line, 247, 123–132. 10.1016/j.tox.2008.02.014 [DOI] [PubMed] [Google Scholar]
- Kocbach A, Namork E, & Schwarze PE (2008b). Pro-inflammatory potential of wood smoke and traffic-derived particles in a monocytic cell line. Toxicology, 247(2–3), 123–132. [DOI] [PubMed] [Google Scholar]
- Ku BK, & Kulkarni P (2012). Comparison of diffusion charging and mobility-based methods for measurement of aerosol agglomerate surface area. Journal of Aerosol Science, 47, 100–110. 10.1016/J.JAEROSCI.2012.01.002 [DOI] [PMC free article] [PubMed] [Google Scholar]
- Kumar Sharma A, Wallin H, & Alstrup Jensen K (2007). High volume electrostatic field-sampler for collection of fine particle bulk samples. Atmospheric Environment, 41(2), 369–381. 10.1016/j.atmosenv.2006.07.034 [DOI] [Google Scholar]
- Lamb JG, Romero EG, Lu Z, Marcus SK, Peterson HC, Veranth JM, … Reilly CA (2017). Activation of Human Transient Receptor Potential Melastatin-8 (TRPM8) by Calcium-Rich Particulate Materials and Effects on Human Lung Cells. Molecular Pharmacology, 92(6), 653–664. 10.1124/mol.117.109959 [DOI] [PMC free article] [PubMed] [Google Scholar]
- Laumbach RJ, & Kipen HM (2012). Respiratory health effects of air pollution: Update on biomass smoke and traffic pollution. Journal of Allergy and Clinical Immunology, 129(1), 3–11. 10.1016/J.JACI.2011.11.021 [DOI] [PMC free article] [PubMed] [Google Scholar]
- Lenz A, Karg E, Lentner B, Dittrich V, Brandenberger C, Rothen-Rutishauser B, … Schmid O (2009). A dose-controlled system for air-liquid interface cell exposure and application to zinc oxide nanoparticles. Particle and Fibre Toxicology, 6(1), 32 10.1186/1743-8977-6-32 [DOI] [PMC free article] [PubMed] [Google Scholar]
- Leskinen J, Ihalainen M, Torvela T, Kortelainen M, Lamberg H, Tiitta P, … Jokiniemi J (2014). Effective Density and Morphology of Particles Emitted from Small-Scale Combustion of Various Wood Fuels. Environmental Science & Technology, 48(22), 13298–13306. 10.1021/es502214a [DOI] [PubMed] [Google Scholar]
- Libalova H, Milcova A, Cervena T, Vrbova K, Rossnerova A, Novakova Z, … Rossner P (2018). Kinetics of ROS generation induced by polycyclic aromatic hydrocarbons and organic extracts from ambient air particulate matter in model human lung cell lines. Mutation Research - Genetic Toxicology and Environmental Mutagenesis, 827(January), 50–58. 10.1016/j.mrgentox.2018.01.006 [DOI] [PubMed] [Google Scholar]
- Lichtveld KM, Ebersviller SM, Sexton KG, Vizuete W, Jaspers I, & Jeffries HE (2012). In Vitro Exposures in Diesel Exhaust Atmospheres: Resuspension of PM from Filters versus Direct Deposition of PM from Air. Environmental Science & Technology, 46(16), 9062–9070. [DOI] [PMC free article] [PubMed] [Google Scholar]
- Ma X, Zangmeister CD, Gigault J, Mulholland GW, & Zachariah MR (2013). Soot aggregate restructuring during water processing. Journal of Aerosol Science, 66, 209–219. 10.1016/j.jaerosci.2013.08.001 [DOI] [Google Scholar]
- Maji KJ, Arora M, & Dikshit AK (2018). Premature mortality attributable to PM2.5 exposure and future policy roadmap for ‘airpocalypse’ affected Asian megacities. Process Safety and Environmental Protection, 118, 371–383. 10.1016/j.psep.2018.07.009 [DOI] [Google Scholar]
- Mecea VM (2006). Is quartz crystal microbalance really a mass sensor ? Sensors and Actuators, 128, 270–277. 10.1016/j.sna.2006.01.023 [DOI] [Google Scholar]
- Ouf F-X, Bourrous S, Fauvel S, Kort A, Lintis L, Nuvoli J, & Yon J (2019). True density of combustion emitted particles: A comparison of results highlighting the influence of the organic contents. Journal of Aerosol Science, 134, 1–13. 10.1016/J.JAEROSCI.2019.04.007 [DOI] [Google Scholar]
- Pedata P, Bergamasco N, D’Anna A, Minutolo P, Servillo L, Sannolo N, & Balestrieri ML (2013). Apoptotic and proinflammatory effect of combustion-generated organic nanoparticles in endothelial cells. Toxicology Letters, 219(3), 307–314. [DOI] [PubMed] [Google Scholar]
- Pedata P, Boccellino M, La Porta R, Napolitano M, Minutolo P, Sgro LA, … Quagliuolo L (2012). Interaction between combustion-generated organic nanoparticles and biological systems: In vitro study of cell toxicity and apoptosis in human keratinocytes. Nanotoxicology, 6(4), 338–352. [DOI] [PubMed] [Google Scholar]
- Petters MD, Prenni AJ, Kreidenweis SM, DeMott PJ, Matsunaga A, Lim YB, & Ziemann PJ (2006). Chemical aging and the hydrophobic-to-hydrophilic conversion of carbonaceous aerosol. Geophysical Research Letters, 33(24), L24806 10.1029/2006GL027249 [DOI] [Google Scholar]
- Pham NT, McHale G, Newton MI, Carroll BJ, & Rowan SM (2004). Application of the quartz crystal microbalance to the evaporation of colloidal suspension droplets. Langmuir, 20(3), 841–847. [DOI] [PubMed] [Google Scholar]
- Reipa V, Purdum G, & Choi J (2010). Measurement of nanoparticle concentration using quartz crystal microgravimetry. The Journal of Physical Chemistry B, 114(49), 16112–16117. [DOI] [PubMed] [Google Scholar]
- Rizza V, Stabile L, Vistocco D, Russi A, Pardi S, & Buonanno G (2019). Effects of the exposure to ultrafine particles on heart rate in a healthy population. Science of The Total Environment, 650, 2403–2410. 10.1016/J.SCITOTENV.2018.09.385 [DOI] [PubMed] [Google Scholar]
- Sarangi B, Aggarwal SG, Sinha D, & Gupta PK (2016). Aerosol effective density measurement using scanning mobility particle sizer and quartz crystal microbalance with the estimation of involved uncertainty, 859–875. 10.5194/amt-9-859-2016 [DOI] [Google Scholar]
- Sarkar S, Zhang L, Subramaniam P, Lee K-B, Garfunkel E, Strickland PAO, … Schwander S (2014). Variability in Bioreactivity Linked to Changes in Size and Zeta Potential of Diesel Exhaust Particles in Human Immune Cells. PLoS ONE, 9(5), e97304 10.1371/journal.pone.0097304 [DOI] [PMC free article] [PubMed] [Google Scholar]
- Sauerbrey G (1959). Verwendung von Schwingquarzen zur W~igung diinner Schichten und zur Mikrow~igung*. Zeitschrift fiir Physik (Vol. 55). Retrieved from http://jmfriedt.sequanux.org/t/sauerbrey.pdf [Google Scholar]
- Schmid O, & Stoeger T (2016). Surface area is the biologically most effective dose metric for acute nanoparticle toxicity in the lung. Journal of Aerosol Science, 99, 133–143. 10.1016/j.jaerosci.2015.12.006 [DOI] [Google Scholar]
- Soto KF, Garza KM, Shi Y, & Murr LE (2008). Direct contact cytotoxicity assays for filter-collected, carbonaceous (soot) nanoparticulate material and observations of lung cell response. Atmospheric Environment, 42(9), 1970–1982. 10.1016/j.atmosenv.2007.12.027 [DOI] [Google Scholar]
- Stöber W, Fink A, & Bohn E (1968). Controlled growth of monodisperse silica spheres in the micron size range. Journal of Colloid and Interface Science, 26(1), 62–69. 10.1016/0021-9797(68)90272-5 [DOI] [Google Scholar]
- Teoh R, Stettler MEJ, Majumdar A, Schumann U, Graves B, & Boies AM (2019). A methodology to relate black carbon particle number and mass emissions. Journal of Aerosol Science, 132, 44–59. 10.1016/J.JAEROSCI.2019.03.006 [DOI] [Google Scholar]
- Turóczi B, Hoffer A, Tóth Á, Kováts N, Ács A, Ferincz, … Gelencsér A (2012). Comparative assessment of ecotoxicity of urban aerosol. Atmospheric Chemistry and Physics, 12(16), 7365–7370. 10.5194/acp-12-7365-2012 [DOI] [Google Scholar]
- Verschaeve L, Nemery B, Don Porto Carero A, Hoet PHM, & Schoeters G (2002). Genotoxic effects of carbon black particles, diesel exhaust particles, and urban air particulates and their extracts on a human alveolar epithelial cell line (A549) and a human monocytic cell line (THP-1). Environmental and Molecular Mutagenesis, 37(2), 155–163. 10.1002/em.1023 [DOI] [PubMed] [Google Scholar]
- Zhuang H, Lu P, Lim SP, & Lee HP (2008). Study of the evaporation of colloidal suspension droplets with the quartz crystal microbalance. Langmuir, 24(15), 8373–8378. 10.1021/la800661g [DOI] [PubMed] [Google Scholar]
Associated Data
This section collects any data citations, data availability statements, or supplementary materials included in this article.