

Abstract
Objectives:
Clinical prediction models that support treatment decisions are usually evaluated for their ability to predict the risk of an outcome rather than treatment benefit – the difference between outcome risk with versus without therapy. We aimed to define performance metrics for a model’s ability to predict treatment benefit.
Study Design and Setting:
We analyzed data of the Synergy between Percutaneous Coronary Intervention with Taxus and Cardiac Surgery (SYNTAX) trial, and of 3 recombinant tissue plasminogen activator trials. We assessed alternative prediction models with a conventional risk concordance-statistic (c-statistic) and a novel c-statistic for benefit. We defined observed treatment benefit by the outcomes in pairs of patients matched on predicted benefit but discordant for treatment assignment. The ‘c-for-benefit’ represents the probability that from two randomly chosen matched patient pairs with unequal observed benefit, the pair with greater observed benefit also has a higher predicted benefit.
Results:
Compared to a model without treatment interactions, the SYNTAX Score II had improved ability to discriminate treatment benefit (c-for-benefit 0.590 versus 0.552), despite having similar risk discrimination (c-statistic 0.725 versus 0.719). However, for the simplified Stroke-Thrombolytic Predictive Instrument (TPI) versus the original Stroke-TPI, the c-for-benefit (0.584 versus 0.578) was similar.
Conclusion:
The proposed methodology has the potential to measure a model’s ability to predict treatment benefit not captured with conventional performance metrics.
Keywords: Individualized treatment decisions, Treatment benefit, Prediction models, Discrimination, Concordance
Introduction
Treatments that demonstrate benefit on average in clinical trials help some patients but not others. A major focus of patient-centered outcomes research and personalized medicine is to better understand this heterogeneity of treatment effect (HTE) so that treatment might be targeted to those who benefit, and avoided in those where it is useless or harmful [1–3]. A risk modeling approach to clinical trial analysis has been proposed [4]; examples of this approach to trial analysis have been described for selecting patients for surgical versus medical therapy in carotid endarterectomy [5], for thrombolytic choice in acute myocardial infarction [6], for percutaneous coronary intervention versus coronary artery bypass in non-acute coronary artery disease patients [7], for continuation of dual antiplatelet therapy following PCI [8] and for better targeting prevention programs such as diabetes prevention [9] or lung cancer screening [10].
A clinical risk prediction model – any model that uses patient characteristics to predict patient outcomes conditional on a treatment strategy – can well support treatment decision making when it accurately predicts individual treatment benefit, i.e. the difference in potential outcomes under different treatment regimens [11, 12]. However, risk prediction models are usually validated for their ability to predict risk, not for their ability to predict treatment benefit – the difference between outcome risk with versus without therapy (or with two alternative strategies). Optimizing commonly used performance measures, such as the concordance-statistic (c-statistic) used to assess a risk prediction model’s discriminative ability (i.e. its ability to predict higher risks for those patients with the outcome compared to those without the outcome [13–15]), does not necessarily optimize a model’s decision making potential, because performance measures for treatment selection should assess how well a model discriminates patients who benefit from those who do not [16–18]. However, discrimination measures are based on comparing predictions to actual outcomes in individual patients; measuring discriminative ability of benefit predictions is thus hampered by the fact that the actual benefit for each patient is inherently unobservable, since their potential (counterfactual) outcome under the alternative therapy is not known [19, 20].
Thus, we aimed to develop methods for validation of models that are used for predicting treatment benefit. We hereto adapt popular measures of predictive performance, and apply these measures to two previously developed prediction models intended to support decision making on reperfusion therapy: the SYNTAX Score II – developed to stratify patients according to their benefit from coronary artery bypass graft (CABG) compared to percutaneous coronary intervention (PCI) – and the Stroke-Thrombolytic Predictive Instrument (Stroke-TPI), which predicts benefit from thrombolysis in acute ischemic stroke.
METHODS
Theoretical background
The performance of a prediction model is typically measured in two dimensions: discrimination and calibration [21]. Discrimination is a model’s ability to separate low risk subjects from high risk subjects. For binary or time-to-event outcomes, it is usually measured by a c-statistic, which is the proportion of all possible pairs of observations discordant on the outcome (i.e. one with the outcome and one without), in which the subject with the outcome had a higher predicted probability than the one without the outcome [13, 14]. Calibration refers to the agreement of a model’s predicted probabilities with observed frequencies across the range of predictions [22]. Calibration may be measured by the difference between predicted and observed outcomes in groups defined by quantiles of predicted risk [23]. When we similarly aim to measure a prediction model’s performance in predicting treatment benefit this requires predictions and observations of benefit instead of risk.
With clinical trial data, we can predict treatment benefit based on a multivariable model which regresses the outcome of interest with both the treatment and baseline characteristics. The individual predicted (absolute) treatment benefit can be defined as the predicted risk with one treatment minus the predicted risk with an alternative treatment. For example, when an individual’s predicted mortality is 10% under one treatment and 8% under the alternative treatment, then the predicted absolute treatment benefit of the alternative treatment is 2%. Often a constant relative treatment effect is assumed, implying no statistical interactions between the treatment and the prognostic factors. In contrast, relative treatment effect heterogeneity – i.e. variation of relative treatment effect across individuals – can be modeled by including treatment interactions in the prediction model [4, 24, 25].
While calculating the predicted benefit in an individual is straightforward, we cannot directly observe the actual treatment benefit for an individual patient in a clinical trial, because the counterfactual outcome is missing. Since we are interested in observed treatment benefit conditional on predicted treatment benefit, we propose to define observed treatment benefit as the difference in outcomes between 2 patients with the same predicted benefit but different treatment assignments. With a binary outcome (say, alive or dead), there are only 4 possible outcome combinations for a pair of patients of whom the first is in the intervention and the second is in the control arm: the first alive and the second dead indicates treatment benefit, both alive and both dead indicate no treatment effect, and the first dead while the second is alive indicates treatment harm (Table 1) [26].
Table 1.
Definition of observed treatment benefit for a pair of matched patients
| Observed outcome of patient in treatment arm A | Observed outcome of patient in treatment arm B | Observed treatment benefit of treatment B versus treatment A |
|---|---|---|
| 0 (alive) | 1 (dead) | −1 (harm) |
| 0 (alive) | 0 (alive) | 0 (no effect) |
| 1 (dead) | 1 (dead) | 0 (no effect) |
| 1 (dead) | 0 (alive) | 1 (benefit) |
Having matched each patient from one trial arm with a patient from the other trial arm with similar (ideally identical) predicted treatment benefit, the agreement between predictions and observations of treatment benefit can be assessed with standard validation techniques, using these pairs of patients (with a trinary response variable: −1=harm; 0=no effect; +1=benefit) instead of individuals (with a binary response variable). The c-statistic for benefit (‘c-for-benefit’) is defined as the proportion of all possible pairs of matched patient pairs with unequal observed benefit in which the patient pair receiving greater treatment benefit was predicted to do so (Illustrated in Supplementary table 1). The c-for-benefit thus represents the probability that from two randomly chosen matched patient pairs with unequal observed benefit, the pair with greater observed benefit also has a higher predicted benefit. Calibration for benefit assesses whether the absolute observed benefit matches the predicted benefit. This can be examined by ordering observations according to predicted benefit, and grouping into subgroups (e.g. quintiles of predicted benefit).
Matching of patients could alternatively be based on the covariates that are used to predict treatment benefit instead of the predicted treatment benefit itself. The independence from the treatment benefit prediction model and closer matching of patient characteristics may be considered advantages of a covariate matching procedure, at the expense of less accurate matching of the predicted treatment benefit. To analyze the sensitivity for the choice between these two matching procedures we compared Mahalanobis-metric covariate matching with predicted treatment benefit matching [27, 28].
Case studies
To understand how informative the evaluation of benefit might be in comparison with a more conventional risk-focused approach, we examined alternative versions of two published predictive models that were developed to predict treatment benefit.
SYNTAX Score II
The SYNTAX Score II was derived in the Synergy between Percutaneous Coronary Intervention with Taxus and Cardiac Surgery (SYNTAX) trial (ClinicalTrials.gov, number NCT00114972) [29, 30]. In the SYNTAX trial 1,800 patients (178 deaths during 4 years of follow-up) with unprotected left main coronary artery (ULMCA) disease or de novo three vessel disease that were randomized to either CABG or PCI with first generation drug eluting stents (baseline characteristics in Table 2). The SYNTAX Score II includes eight prognostic factors for mortality and treatment interactions with each of the prognostic factors [7]. For comparison we also considered a prediction model with the eight prognostic factors and an overall treatment effect, i.e. without treatment interactions [25]. The models are described in Table 3. The following approach for measuring the ability to predict benefit was applied to these two models consecutively.
Table 2.
Baseline characteristics of SYNTAX and Stroke TPI case studies
| Characteristic | Metric | SYNTAX | ATLANTISc | NINDS |
|---|---|---|---|---|
| Treatment arma | % (ratio) | 50.2 (903/1800) | 49.3 (303/614) | 49.1 (290/591) |
| Age (years) | median [IQR] (n) | 66 [58,72] (1800) | 67.9 [58.8,74.7] (614) | 68.4 [59.7,75.4] (591) |
| Male sex | % (ratio) | 77.7 (1398/1800) | 60.3 (370/614) | 42.8 (253/591) |
| SYNTAX score | median [IQR] (n) | 28 [20,36] (1789) | ||
| Creatinine clearance (mL/min) | median [IQR] (n) | 81.3 [64.5,103.3] (1638) | ||
| LVEF(%) | median [IQR] (n) | 60 [50,66] (1126) | ||
| poor LVEF (<30%) | % (ratio) | 1.9 (34/1772) | ||
| moderate LVEF (30–49%) | % (ratio) | 17.7 (313/1772) | ||
| good LVEF (≥50%) | % (ratio) | 80.4 (1425/1772) | ||
| ULMCA disease | % (ratio) | 39.2 (705/1799) | ||
| COPD | % (ratio) | 8.6 (154/1800) | ||
| Peripheral vascular disease | % (ratio) | 9.8 (177/1800) | ||
| Diabetes | % (ratio) | 21.0 (129/614) | 21.2 (125/591) | |
| Prior stroke | % (ratio) | 15.1 (93/614) | 13.0 (77/591) | |
| SBP (mm Hg) | median [IQR] (n) | 153 [137,168] (614) | 152 [140,170] (591) | |
| Minutes from stroke to treatment | median [IQR] (n) | 273 [240,293] (614) | 110 [89,157] (591) | |
| NIHSS | median [IQR] (n) | 10 [7,15] (614) | 15 [9,20] (591) | |
| 3-variable stroke severity scale | median [IQR] (n) | 2 [0,3] (614) | ||
| Outcomeb | % (ratio) | 9.9 (178/1800) | 40.4 (248/614) | 34.5 (204/591) |
Treatment arm: PCI in SYNTAX; rt-PA in ATLANTIS and NINDS
Outcome: All cause death in SYNTAX; Functionally normal/near-normal (mRS score 0 or 1) in ATLANTIS and NINDS
Patients of the ATLANTIS A trial and the ATLANTIS B trial were merged
Table 3.
Model descriptions of SYNTAX and Stroke TPI case studies
| A. Multivariable hazard ratios (95% confidence interval) for mortality of non-acute coronary artery disease patients. For continuous factors the hazard ratio of the interquartile range is presented. When a factor interacts with treatment (all factors in the SYNTAX Score II) the treatment-specific hazard ratio is calculated based on the combination of a factor’s main effect and the factor’s treatment interaction effect. Hazard ratios above 1 indicate an increase in mortality risk. | ||||
|---|---|---|---|---|
| Factor | Constant relative treatment effect | SYNTAX Score II | ||
| CABG | PCI | CABG | PCI | |
| PCI vs. CABGa | 1.47 (1.08,1.98) | 1.44 (0.97,2.13) | ||
| SYNTAX score 36 vs 20 | 1.23 (1.01,1.51) | 1.23 (1.01,1.51) | 0.95 (0.69,1.31) | 1.47 (1.13,1.91) |
| Age (years) 72 vs 58 | 1.80 (1.33,2.43) | 1.80 (1.33,2.43) | 2.68 (1.57,4.55) | 1.49 (0.96,2.31) |
| CrCl (mL/min) 90 vs 65 | 0.68 (0.53,0.89) | 0.68 (0.53,0.89) | 0.79 (0.52,1.20) | 0.60 (0.43,0.83) |
| LVEF (%) 50 vs 10 | 0.18 (0.08,0.40) | 0.18 (0.08,0.40) | 0.50 (0.14,1.81) | 0.10 (0.04,0.28) |
| ULMCA disease | 1.06 (0.78,1.43) | 1.06 (0.78,1.43) | 1.47 (0.93,2.34) | 0.82 (0.54,1.23) |
| Male sex | 0.90 (0.64,1.26) | 0.90 (0.64,1.26) | 1.68 (0.91,3.12) | 0.59 (0.38,0.90) |
| COPD | 1.87 (1.25,2.79) | 1.87 (1.25,2.79) | 2.84 (1.64,4.90) | 1.35 (0.74,2.47) |
| PVD | 2.64 (1.85,3.76) | 2.64 (1.85,3.76) | 2.79 (1.66,4.71) | 2.79 (1.72,4.53) |
| B. Multivariable odds ratios (95% confidence interval) for good outcome after acute ischemic stroke. For continuous factors the odds ratio of the interquartile range is presented. When a factor interacts with treatment (male sex, prior stroke, SBP and minutes to treatment in the original Stroke TPI; SBP and minutes to treatment in the simplified Stroke TPI) the treatment-specific odds ratio is calculated based on the combination of a factor’s main effect and the factor’s treatment interaction effect. Odds ratios above 1 indicate an increase in the probability of good outcome. | ||||
| Factor | Original Stroke TPI | Simplified Stroke TPI | ||
| Control | rt-PA | Control | rt-PA | |
| rt-PAa | 1.51 (1.23,1.86) | 1.45 (1.18,1.78) | ||
| Age (years) 75 vs 59b | 0.73 (0.63,0.85) | 0.73 (0.63,0.85) | 0.75 (0.65,0.87) | 0.75 (0.65,0.87) |
| Male sex | 1.45 (1.07,1.96) | 0.95 (0.71,1.28) | 1.03 (0.83,1.26) | 1.03 (0.83,1.26) |
| Diabetes | 0.48 (0.37,0.62) | 0.48 (0.37,0.62) | 0.50 (0.38,0.65) | 0.50 (0.38,0.65) |
| Prior stroke | 1.46 (0.99,2.15) | 0.67 (0.45,1.00) | 0.93 (0.70,1.23) | 0.93 (0.70,1.23) |
| SBP (mm Hg) 169 vs 139 | 0.86 (0.69,1.07) | 0.61 (0.49,0.76) | 0.91 (0.73,1.13) | 0.62 (0.50,0.78) |
| Minutes from stroke to treatment 288 vs 155 | 1.04 (0.81,1.33) | 0.63 (0.50,0.81) | 0.88 (0.64,1.20) | 0.49 (0.37,0.66) |
| NIHSS 17 vs 8c | 0.17 (0.14,0.21) | 0.17 (0.14,0.21) | ||
| 3-variable stroke severity scale 3 vs 1c | 0.24 (0.20,0.29) | 0.24 (0.20,0.29) | ||
At average prognostic factor levels
At average NIHSS and average 3-variable stroke severity scale
At average age
For each patient the predicted benefit (of treatment with CABG) was calculated as the absolute risk prediction when treating with PCI minus the absolute risk prediction when treating with CABG. To realize an equal number of patients in both trial arms we randomly selected 897 out of 903 patients in the PCI arm. Each of the 897 patients in the CABG arm was matched to one of the 897 selected patients in the PCI arm, based on their rank of predicted benefit within the treatment arm. For each pair of patients, the predicted benefit of treating with CABG was set to the average of their individual benefit predictions. The observed benefit for each patient pair was calculated as the mortality outcome (0 = alive; 1 = dead) of the patient in the PCI arm minus the mortality outcome of the patient in the CABG arm (Table 1). For the set of 897 predicted and observed treatment benefits, we calculated the c-for-benefit, and we plotted average observed benefit versus predicted benefit in quintiles of predicted benefit (calibration plot).
When a model is validated in the same data that was used for model derivation, estimates of model performance will be too optimistic [31, 32]. We therefore corrected the c-for-benefit and the calibration plot for optimism with a bootstrap procedure based on 1000 samples with replacement from the original data, stratified by treatment arm. The sample size in both treatment arms of the bootstrap sample was equal to the sample size of the treatment arms in the original data [33]. The models were refitted in each bootstrap sample. The optimism for each bootstrap resample was calculated as the difference in performance between validation in the bootstrap sample and validation in the original data. The optimism was subtracted from the apparent performance estimate. We used empirical quantiles of the bootstrap distribution as confidence intervals for the risk c-statistic, the c-for-benefit, and for the difference of these performance measures between the SYNTAX Score II and the model without treatment interactions.
Stroke TPI
The Stroke TPI was developed on a pooled database of 5 clinical trials testing recombinant tissue plasminogen activator (rt-PA) against placebo in the treatment of acute ischemic stroke (n = 2184 patients). The Stroke TPI predicts the probability of a good functional outcome (modified Rankin Score mRS <=1) and the probability of severe disability or death (mRS >=5) with and without rt-PA. The model for prediction of good functional outcome contained 7 prognostic factors, the treatment and 4 interactions between treatment and prognostic factors [34]. Recently, a modified Stroke TPI was developed, primarily to improve ease-of-use by non-specialists, by replacing a full NIH stroke severity score with a simplified 3-item version. Importantly, 2 of the 4 treatment interactions were eliminated [35]. Both models are described in Table 3. While discriminatory performance was shown to be relatively well maintained in the simplified compared to the original model, a remaining concern is that the simplified Stroke TPI may have a reduced ability to segregate patients by their probability of benefiting. Herein, we test these models on the NINDS trial and the ATLANTIS A and B trial (baseline characteristics in Table 2) which comprise a subset of the development dataset for these tools [36–38]. The NINDS Trial (n=591) included patients treated from 0 to 180 minutes from symptom onset; the ATLANTIS A Trial (n=48) from 0 to 360 minutes; and the ATLANTIS B Trial (n=566) from 180 to 300 minutes. The ECASS 2 Trial (n=778) was excluded from validation in our study [39].
For each patient in this 1205 patients sample the predicted benefit (of treatment with rt-PA) was calculated as the predicted probability of a good functional outcome when treated with rt-PA minus the predicted probability of a good functional outcome when treated with placebo, for both the original and the simplified Stroke TPI. The methods used for matching of patients, calculation of observed treatment benefit and assessment of discrimination and calibration of treatment benefit predictions (with calibration plots and with c-statistics, respectively) were identical to the methods described above for the SYNTAX trial. We chose not correct for optimism in the performance of the Stroke TPI, because variable selection was based on clinical judgement in the development of the simplified Stroke TPI and therefore could not have been iteratively replicated in a bootstrap approach [33].
RESULTS
In non-acute coronary artery disease in the SYNTAX trial, the model assuming a constant relative treatment effect (i.e. without treatment interactions) discriminated high-risk from low-risk patients only slightly worse than the SYNTAX Score II (risk c-statistics corrected for optimism 0.719 vs 0.725; Table 4). The SYNTAX trial arms were well balanced for predicted benefit regardless of the two models that were used to predict benefit (Figure 1). Due to the treatment interactions in the SYNTAX Score II, the range of predicted treatment benefit was much wider and, notably, contained negative benefit (treatment with PCI favorable). The c-for-benefit was 0.065 (95% CI −0.003 to 0.144) higher for the SYNTAX Score II than for the model assuming a constant relative treatment effect (0.620 vs 0.555; Table 4), although the difference was corrected for optimism to 0.038 (95% CI −0.030 to 0.117) (0.590 vs 0.552; Table 4). Due to the uncertainty in the interaction effect estimates the performance measures of the SYNTAX Score II required a 10 times larger correction for optimism (c-for-benefit corrections 0.030 vs. 0.003; Table 4). Calibration in quintiles of predicted benefit was fairly good for the SYNTAX Score II (Figure 2). Again, the SYNTAX Score II required a larger correction for optimism than the model without interactions.
Table 4.
C-statistics (95% confidence interval) for risk and for benefit
| Measure | Constant relative treatment effect | SYNTAX Score II | Difference | Original Stroke TPI | Simplified Stroke TPI | Difference |
|---|---|---|---|---|---|---|
| Risk c-statistic | ||||||
| Apparent | 0.729 (0.690,0.764) | 0.744 (0.707,0.780) | 0.015 (0.002,0.030) | 0.811 (0.790,0.830) | 0.790 (0.767,0.812) | −0.021 (−0.039,−0.003) |
| Optimism | 0.009 | 0.018 | 0.009 | |||
| Corrected | 0.719 (0.681,0.754) | 0.725 (0.689,0.761) | 0.006 (−0.007,0.021) | |||
| Benefit c-statistic | ||||||
| Apparent | 0.555 (0.496,0.615) | 0.620 (0.565,0.673) | 0.065 (−0.003,0.144) | 0.578 (0.547,0.607) | 0.584 (0.552,0.615) | 0.006 (−0.023,0.028) |
| Optimism | 0.003 | 0.030 | 0.027 | |||
| Corrected | 0.552 (0.493,0.612) | 0.590 (0.535,0.643) | 0.038 (−0.030,0.117) |
Correction for optimism in the SYNTAX trial without treatment interactions (“Constant relative treatment effect”) and the SYNTAX Score II was based on internal validation with 1,000 bootstrap samples.
Figure 1. Matching patient pairs on predicted treatment benefit.
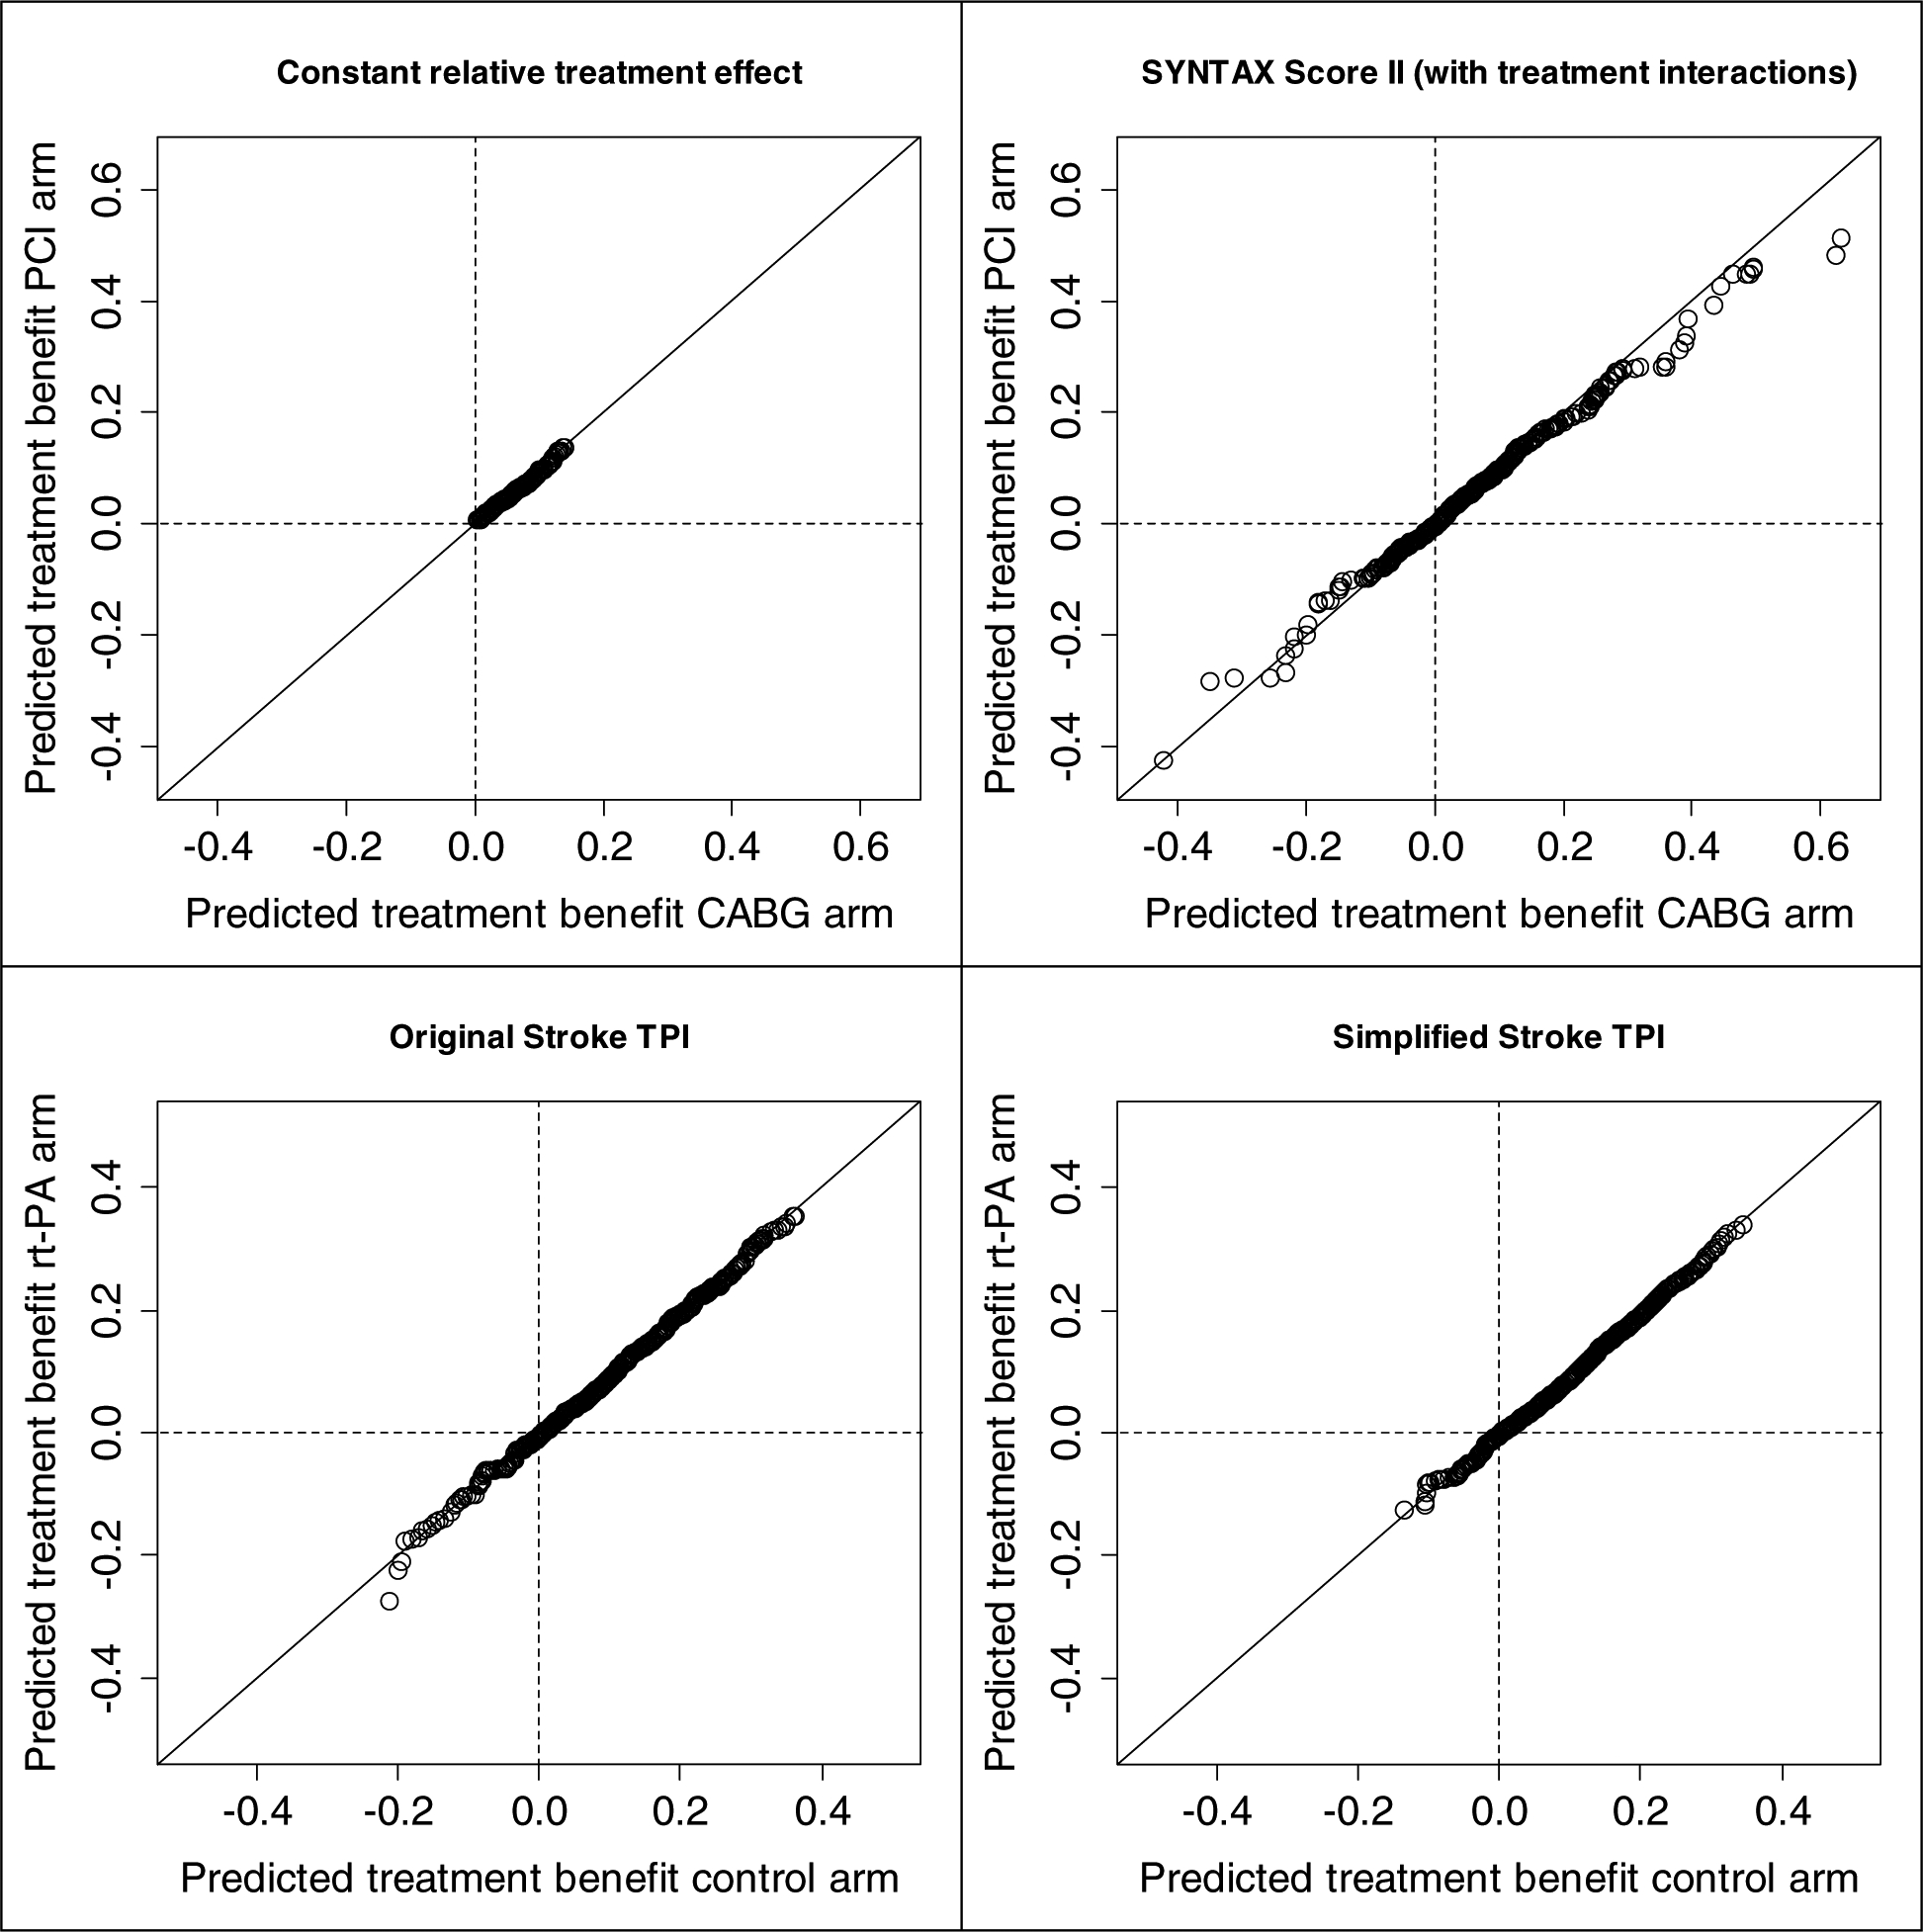
For each matched patient pair the predicted treatment benefit in one trial arm is plotted versus the predicted treatment benefit in the other trial arm. Perfect matching would result in dots located exactly on the diagonal. Upper left: SYNTAX Score II without treatment interactions (“Constant relative treatment effect”) ; Upper right: SYNTAX Score II; Lower left: Original Stroke TPI; Lower right: Simplified Stroke TPI.
Figure 2. Calibration plots: observed treatment benefit versus predicted treatment benefit in 5 equally sized groups of matched patient pairs with increasing predicted treatment benefit (quintiles).
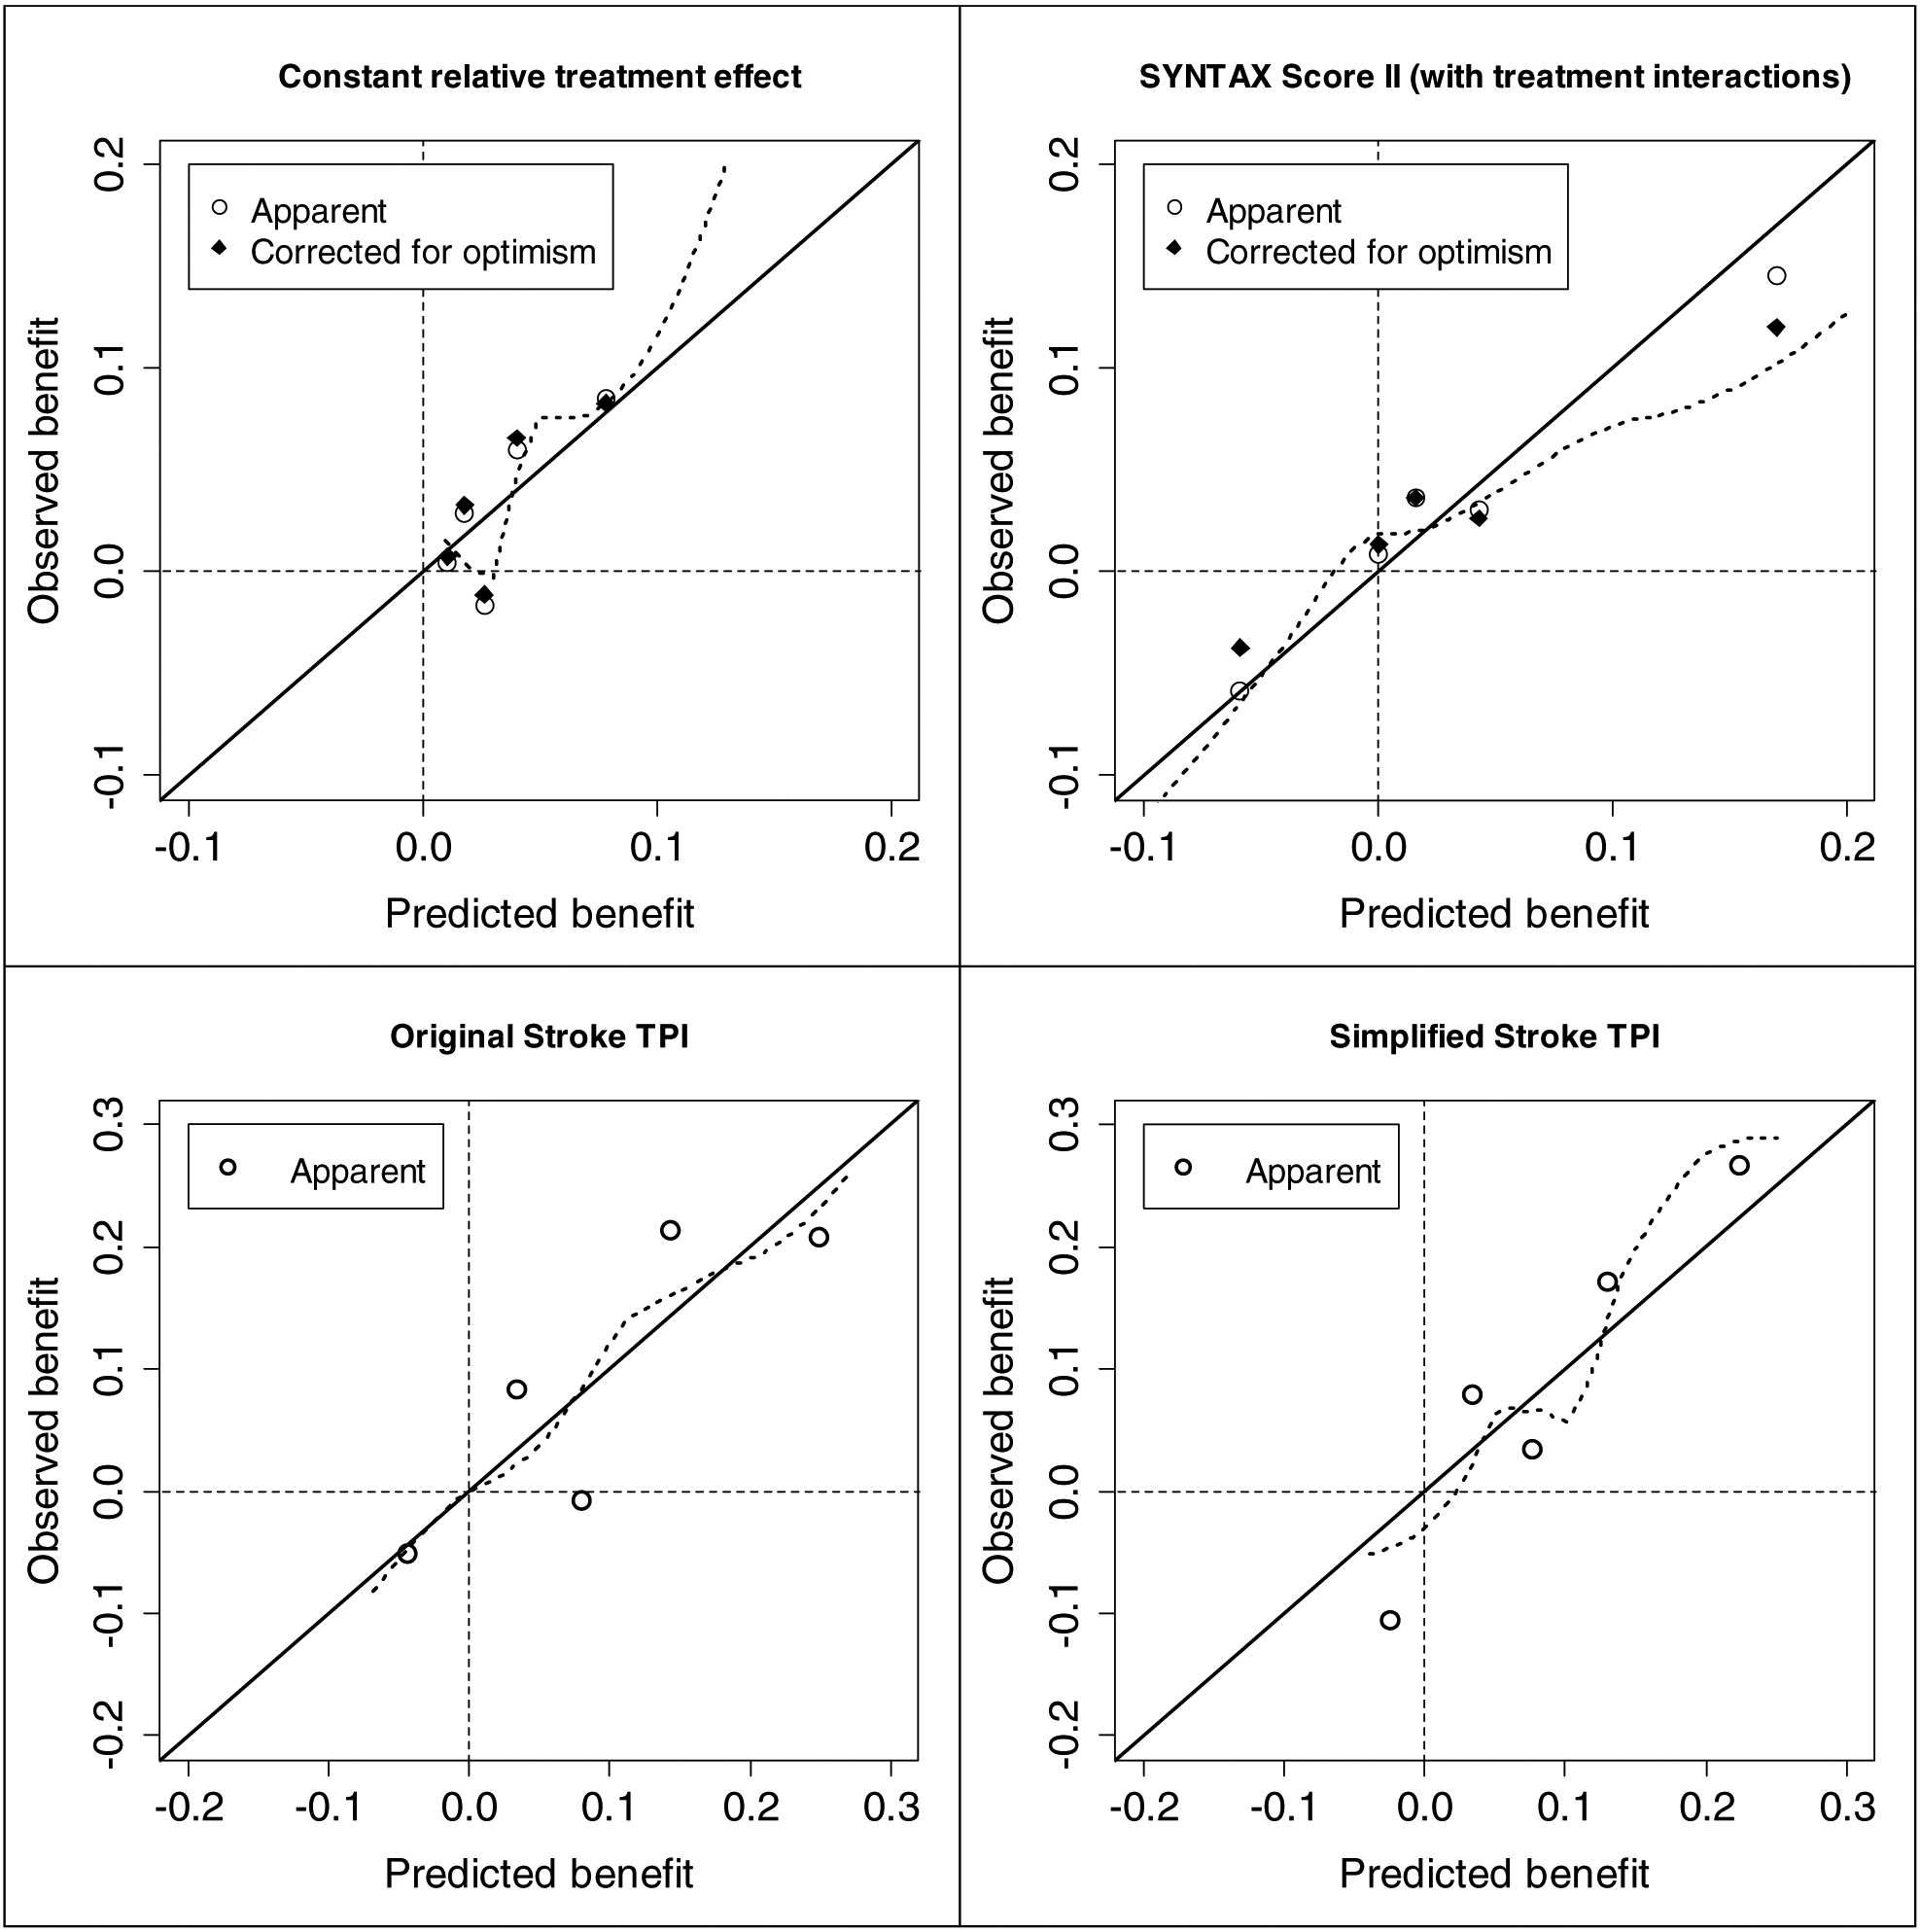
Upper left: Benefit of treatment with CABG according to the SYNTAX Score II without treatment interactions (“Constant relative treatment effect”) ; Upper right: Benefit of treatment with CABG according to the SYNTAX Score II; Lower left: Benefit of treatment with rt-PA according to the Original Stroke TPI; Lower right: Benefit of treatment with rt-PA according to the Simplified Stroke TPI.
As expected, the discriminative ability of the simplified Stroke TPI was somewhat less than the original Stroke TPI (risk c-statistics 0.790 vs 0.811, respectively; Table 4). Again, trial arms were well balanced for predicted benefit for both models (Figure 1). Due to less treatment interactions in the simplified Stroke TPI, the range of predicted treatment benefit was smaller as compared to the original Stroke TPI, especially for patients with predicted treatment harm (negative benefit). Surprisingly, the c-for-benefit was not worse for the simplified Stroke TPI (0.584 vs 0.578 for the original Stroke TPI; difference 0.006 [95% CI −0.023 to 0.028]; Table 4), and neither was calibration (Figure 2). These results indicate that the additional complexity of the original Stroke TPI does not increase the ability to predict treatment benefit for the patients in this validation subpopulation.
As expected, when patients were matched based on their covariates instead of on their predicted treatment benefit, the predicted treatment benefit for two patients within a matched pair was less similar (Supplementary figure 1). However, the c-for-benefit, and its difference between two models, was very similar both for the SYNTAX Score II and for the Stroke TPI (Supplementary table 2; Supplementary figure 2).
DISCUSSION
We proposed measures to validate predictions of treatment benefit, extending widely used approaches to validate predictions of risk. Hereto we defined observed treatment benefit as the difference in outcomes between 2 patients with the same predicted benefit but discordant on treatment assignment. The proposed methodology gave interpretable measures of discrimination and calibration, both for the SYNTAX score II and a simplified alternative [25], and for the original and the simplified Stroke TPI [34, 35]. The metrics were robust to the method of selecting patient pairs, matching either on the predicted benefit or on the underlying covariates. The metrics proposed may help refocus the goals of clinical prediction modeling from discrimination on the basis of outcome risk to discrimination on the basis of potential for treatment benefit, which can theoretically better support optimizing outcomes when considering two alternative treatment strategies [18].
The increase in c-for-benefit of 0.038 (95% CI −0.030 to 0.117) when using treatment interaction terms in the SYNTAX Score II (from 0.552 to 0.590) indicated a major – although imprecise – improvement in discriminative ability. The absolute difference with the c-statistic of a coin toss (0.5; random treatment assignment) almost doubles from 5.2% to 9.0%. The superiority of the SYNTAX Score II is likewise reflected in the calibration curves. While all patient subgroups appear to benefit from bypass surgery compared to PCI when the simplified score is used, there are clearly two “low benefit” quintiles identified with the SYNTAX Score II, for whom bypass surgery may not to be justified – particularly among the lowest benefit quintile for whom PCI appears clearly superior.
In contrast, the simplified Stroke TPI had a similar c-for-benefit compared to the original, indicating that removal of the treatment interactions included in the original equation did not diminish the discriminative ability for treatment benefit in the trial population included in this study. This contrasted with a small decrement in discrimination in outcome risk seen with simplified model compared to the original reflected in the conventional c-statistic. The conserved ability to predict benefit with the simplified Stroke TPI was also reflected in the calibration curve (Figure 2), which shows predicted harm in a single quintile in either model.
In addition to highlighting the novel statistical metrics, these examples also emphasize the importance of a risk modeling approach to clinical trial analysis when there are alternative treatments with distinct trade-offs. For the acute ischemic stroke example, there appear to be patients who are more likely to be harmed from thrombolysis despite the overall benefit; presumably because the risks of thrombolytic-related intracranial hemorrhage in these selected patients (i.e. those with especially high blood pressure arriving late in the treatment window) exceeds any benefits anticipated from reperfusion. Similarly, bypass surgery provides substantial mortality benefit for most patients, but for some the far less invasive PCI strategy would appear to be superior. Carefully developed and validated models that optimize performance metrics for treatment benefit can better segregate patients to the appropriate treatment strategy, in contrast to more conventional evidence based medicine approaches, which emphasize broad application of the best treatment on average.
We note that the c-for-benefit seen in these examples is in a range that would typically be considered only weakly predictive for conventional risk c-statistics. We would caution that new benchmarks are needed to interpret the c-for-benefit. Limits on the prediction of treatment benefit derive in part from the fact that the actual individual treatment benefit are (unlike individual outcomes) inherently unobservable. Our definition of ‘observed benefit’ – the difference between outcomes in pairs of matched patients discordant for treatment assignment – implicitly assumes that the potential outcomes with the two therapies are independent within each patient. Since the potential outcomes within each patient are presumably dependent to some (unknowable) degree, the observed benefit according to our definition contains more randomness than the actual – unobservable – individual patient treatment benefit. As a consequence, this observed benefit will be harder to predict, resulting in conservative c-for-benefit estimates. Because improvements in discrimination for benefit are generally more relevant for clinical decision making than improvements in performance measures for risk, these relatively small improvements might be of great clinical importance. Although more experience with this approach is needed, we anticipate that a c-for-benefit above 0.6 might be very unusual, except in the presence of highly deterministic markers that indicate a treatment mechanism. This reflects the greater difficulty in predicting benefit compared to predicting outcome risk, the main challenge of personalized medicine.
We and others have previously emphasized the importance of both prognostic factors and treatment effect interactions for determining benefit [6, 24]. This is reflected in the improvement of the c-for-benefit in the SYNTAX example. The c-for-benefit might increase the appreciation of the importance of these interaction terms for predicting benefit. However, while treatment effect interactions are particularly helpful, we note that these interactions can be highly unreliable. Because less is known about effect modifiers than risk predictors and because power is much poorer to detect treatment effect interactions, statistically significant interactions often turn out “false positive” findings, particularly when multiple interaction effects are explored [40, 41]. Interactions should be motivated by external information, and including interaction effects makes external validation for benefit (i.e. on a sample including both treatment arms) even more critical than validation for risk. This is reflected in both examples: in SYNTAX, the c-for-benefit showed a higher optimism correction than the risk c-statistic; in the Stroke-TPI statistically significant interactions failed to improve the c-for-benefit. These considerations suggest that trials aimed at exploring HTE will need to be substantially larger than conventional trials to be adequately powered for interaction effects in addition to main effects.
Analogous to the methods we proposed here, a ROC measure was proposed for treatment-selection markers using a potential outcomes framework [42]. This is a model-based measure, calculating the expected ROC curve for predicted benefit under the assumption that the benefit predictions are correct. Instead of assuming a correct benefit prediction model, we matched patients with discordant treatment on predicted treatment benefit to obtain observed values of treatment benefit.
Various other methods have been proposed to measure the ability of prediction models to support clinical decisions. Benefit graphs were proposed to measure the difference in outcome when two different models are used for treatment decision making, by multiplying the proportion of patients with different treatment recommendations with their observed mortality difference in the randomized treatment arms [25, 43]. Net benefit of treatment can also be evaluated across a range of treatment benefit thresholds, where benefit is the difference between the probabilities of an event under treatment and under control [44]. Net benefit is then determined for those patients for whom the treatment recommendation was congruent with the treatment allocation in the trial, and compared to the net benefit of all patients in the treatment arm (“treat all”). These evaluations can be shown in decision curves. A key element of decision curves is that the risk threshold at which a patient would opt for treatment is used both to determine the sensitivity (true-positive-rate) and specificity (true-negative-rate) of the prediction model and to weigh the relative harms of false-positive and false-negative predictions [45]. This dual role of the risk threshold makes the curves useful for evaluating the quality of decision making based a risk model, but (anecdotally) also make it cognitively demanding and confusing for non-experts. The advantage of the methods we propose here is that they leverage simple and widely used metrics of model performance, i.e. measures for discrimination and calibration and might therefore be more easily understood by non-experts.
In case of time-to-event outcomes instead of binary outcomes, the proposed methodology is still applicable, although the definition of observed benefit is somewhat different. Treatment benefit (+1) and treatment harm (−1) are defined as a shorter observed time-to-event for the patient in the intervention arm and in the control arm, respectively. When the shorter time-to-event outcome is censored there is no observed treatment effect (0) for a patient pair.
Nonetheless, there are limitations to our approach. The c-for-benefit inherits the main limitation of the c-statistic in that it measures statistical discrimination, which does not take into account the decisional context. Thus, a given c-statistic may be adequate in one context and not in another. Additionally, theoretical arguments and carefully designed simulation studies, as well as more empirical work, are warranted in order to further understand and test the value of our proposed approach. While extension to trials with unbalanced treatment groups is easily accomplished through matching with replacement, more work is needed to understand how matching procedures might be adapted to unbalanced treatment groups, in particular in an observational setting, where the balance between treatment groups might vary over different levels of predicted benefit.
These caveats aside, our proposed measures are closely aligned with the goal of prediction for personalized medicine – that is, to segregate the population by their likelihood of benefiting from one therapy versus another, thus supporting treatment decisions in individual patients that optimize outcomes taking as much information about each patient into account as possible [46]. To deliver on this promise of more patient-centered evidence, new methods are necessary to explore HTE; the proposed methodology has the potential to measure and communicate a prediction model’s ability to predict treatment benefit, in contrast to conventional metrics which measure a prediction model’s ability to predict outcome risk.
Supplementary Material
WHAT IS NEW?
Key findings
We proposed a statistic of the concordance between predicted and observed treatment benefit (c-for-benefit). Observed treatment benefit was defined as the outcome difference in pairs of patients matched on predicted benefit but discordant for treatment assignment.
In the SYNTAX trial, compared to a model without treatment interactions, the SYNTAX Score II had a substantially higher c-for-benefit, despite having similar outcome risk c-statistics.
What this adds to what was known
In contrast with conventional performance metrics, the c-for-benefit has the potential to measure a model’s ability to predict treatment benefit.
What is the implication, and what should change now
We recommend the c-for-benefit for comparing prediction models that are used for treatment decision making.
ACKNOWLEDGMENTS
The authors express their gratitude to all of the principal investigators and patients participating in the SYNTAX trial and in the rt-PA trials NINDS (trial 1 and trial 2) and ATLANTIS (trial A and trial B). The SYNTAX trial was sponsored by Boston Scientific Corporation. The ATLANTIS trial was sponsored by Genentech.
This work was supported by the National Institutes of Health (grant U01NS086294). The funding agreement ensured the authors’ independence in designing the study, interpreting the data, writing, and publishing the report.
Footnotes
Publisher's Disclaimer: This is a PDF file of an unedited manuscript that has been accepted for publication. As a service to our customers we are providing this early version of the manuscript. The manuscript will undergo copyediting, typesetting, and review of the resulting proof before it is published in its final citable form. Please note that during the production process errors may be discovered which could affect the content, and all legal disclaimers that apply to the journal pertain.
REFERENCES
- [1].Rothwell PM. Can overall results of clinical trials be applied to all patients? Lancet. 1995;345:1616–9. [DOI] [PubMed] [Google Scholar]
- [2].Kravitz RL, Duan N, Braslow J. Evidence-based medicine, heterogeneity of treatment effects, and the trouble with averages. Milbank Q. 2004;82:661–87. [DOI] [PMC free article] [PubMed] [Google Scholar]
- [3].Vickers AJ, Kent DM. The Lake Wobegon Effect: Why Most Patients Are at Below-Average Risk. Ann Intern Med. 2015. [DOI] [PMC free article] [PubMed]
- [4].Kent DM, Rothwell PM, Ioannidis JP, Altman DG, Hayward RA. Assessing and reporting heterogeneity in treatment effects in clinical trials: a proposal. Trials. 2010;11:85. [DOI] [PMC free article] [PubMed] [Google Scholar]
- [5].Rothwell PM, Warlow CP. Prediction of benefit from carotid endarterectomy in individual patients: A risk-modelling study. Lancet. 1999;353:2105–10. [DOI] [PubMed] [Google Scholar]
- [6].Califf RM, Woodlief LH, Harrell FE Jr., Lee KL, White HD, Guerci A, et al. Selection of thrombolytic therapy for individual patients: development of a clinical model. GUSTO-I Investigators. Am Heart J. 1997;133:630–9. [DOI] [PubMed] [Google Scholar]
- [7].Farooq V, van Klaveren D, Steyerberg EW, Meliga E, Vergouwe Y, Chieffo A, et al. Anatomical and clinical characteristics to guide decision making between coronary artery bypass surgery and percutaneous coronary intervention for individual patients: development and validation of SYNTAX score II. Lancet. 2013;381:639–50. [DOI] [PubMed] [Google Scholar]
- [8].Yeh RW, Secemsky EA, Kereiakes DJ, Normand SL, Gershlick AH, Cohen DJ, et al. Development and Validation of a Prediction Rule for Benefit and Harm of Dual Antiplatelet Therapy Beyond 1 Year After Percutaneous Coronary Intervention. Jama. 2016;315:1735–49. [DOI] [PMC free article] [PubMed] [Google Scholar]
- [9].Sussman JB, Kent DM, Nelson JP, Hayward RA. Improving diabetes prevention with benefit based tailored treatment: risk based reanalysis of Diabetes Prevention Program. Bmj. 2015;350:h454. [DOI] [PMC free article] [PubMed] [Google Scholar]
- [10].Kovalchik SA, Tammemagi M, Berg CD, Caporaso NE, Riley TL, Korch M, et al. Targeting of low-dose CT screening according to the risk of lung-cancer death. N Engl J Med. 2013;369:245–54. [DOI] [PMC free article] [PubMed] [Google Scholar]
- [11].Rothwell PM, Mehta Z, Howard SC, Gutnikov SA, Warlow CP. Treating individuals 3: from subgroups to individuals: general principles and the example of carotid endarterectomy. Lancet. 2005;365:256–65. [DOI] [PubMed] [Google Scholar]
- [12].Kent DM, Hayward RA. Limitations of applying summary results of clinical trials to individual patients: the need for risk stratification. JAMA. 2007;298:1209–12. [DOI] [PubMed] [Google Scholar]
- [13].Hanley JA, McNeil BJ. The meaning and use of the area under a receiver operating characteristic (ROC) curve. Radiology. 1982;143:29–36. [DOI] [PubMed] [Google Scholar]
- [14].Harrell FE Jr., Califf RM, Pryor DB, Lee KL, Rosati RA. Evaluating the yield of medical tests. JAMA. 1982;247:2543–6. [PubMed] [Google Scholar]
- [15].Steyerberg EW, Vickers AJ, Cook NR, Gerds T, Gonen M, Obuchowski N, et al. Assessing the performance of prediction models: a framework for traditional and novel measures. Epidemiology. 2010;21:128–38. [DOI] [PMC free article] [PubMed] [Google Scholar]
- [16].Tajik P, Oude Rengerink K, Mol BW, Bossuyt PM. SYNTAX score II. Lancet. 2013;381:1899. [DOI] [PubMed] [Google Scholar]
- [17].Farooq V, van Klaveren D, Steyerberg EW, Serruys PW. SYNTAX score II - Authors’ reply. Lancet. 2013;381:1899–900. [DOI] [PubMed] [Google Scholar]
- [18].Kent DM, Hayward RA, Dahabreh IJ. Using group data to treat individuals: understanding heterogeneous treatment effects in the age of precision medicine and patient-centered evidence. International journal of epidemiology. 2016;In press. [DOI] [PMC free article] [PubMed]
- [19].Holland PW. Statistics and Causal Inference. Journal of the American Statistical Association. 1986;81:945–60. [Google Scholar]
- [20].Rubin DB. Causal Inference Using Potential Outcomes. Journal of the American Statistical Association. 2005;100:322–31. [Google Scholar]
- [21].Steyerberg EW. Clinical Prediction Models: A Practical Approach to Development, Validation, and Updating. New York: Springer; 2009. [Google Scholar]
- [22].Van Calster B, Nieboer D, Vergouwe Y, De Cock B, Pencina MJ, Steyerberg EW. A calibration hierarchy for risk models was defined: from utopia to empirical data. J Clin Epidemiol. 2016. [DOI] [PubMed]
- [23].Harrell FE Jr., Lee KL, Califf RM, Pryor DB, Rosati RA. Regression modelling strategies for improved prognostic prediction. Stat Med. 1984;3:143–52. [DOI] [PubMed] [Google Scholar]
- [24].Hingorani AD, Windt DA, Riley RD, Abrams K, Moons KG, Steyerberg EW, et al. Prognosis research strategy (PROGRESS) 4: stratified medicine research. BMJ. 2013;346:e5793. [DOI] [PMC free article] [PubMed] [Google Scholar]
- [25].van Klaveren D, Vergouwe Y, Farooq V, Serruys PW, Steyerberg EW. Estimates of absolute treatment benefit for individual patients required careful modeling of statistical interactions. J Clin Epidemiol. 2015. [DOI] [PMC free article] [PubMed]
- [26].Greenland S, Robins JM. Identifiability, exchangeability, and epidemiological confounding. International journal of epidemiology. 1986;15:413–9. [DOI] [PubMed] [Google Scholar]
- [27].Rubin DB. Bias Reduction Using Mahalanobis-Metric Matching. Biometrics. 1980;36:293–8. [Google Scholar]
- [28].Sekhon JS. Multivariate and Propensity Score Matching Software with Automated Balance Optimization: The Matching package for R. 2011. 2011;42:52. [Google Scholar]
- [29].Ong AT, Serruys PW, Mohr FW, Morice MC, Kappetein AP, Holmes DR Jr., et al. The SYNergy between percutaneous coronary intervention with TAXus and cardiac surgery (SYNTAX) study: design, rationale, and run-in phase. Am Heart J. 2006;151:1194–204. [DOI] [PubMed] [Google Scholar]
- [30].Serruys PW, Morice MC, Kappetein AP, Colombo A, Holmes DR, Mack MJ, et al. Percutaneous coronary intervention versus coronary-artery bypass grafting for severe coronary artery disease. N Engl J Med. 2009;360:961–72. [DOI] [PubMed] [Google Scholar]
- [31].Siontis GCM, Tzoulaki I, Castaldi PJ, Ioannidis JPA. External validation of new risk prediction models is infrequent and reveals worse prognostic discrimination. Journal of Clinical Epidemiology. 2015;68:25–34. [DOI] [PubMed] [Google Scholar]
- [32].Steyerberg EW, Harrell FE Jr. Prediction models need appropriate internal, internal–external, and external validation. Journal of Clinical Epidemiology. 2016;69:245–7. [DOI] [PMC free article] [PubMed] [Google Scholar]
- [33].Harrell FE Jr., Lee KL, Mark DB Multivariable prognostic models: issues in developing models, evaluating assumptions and adequacy, and measuring and reducing errors. Stat Med. 1996;15:361–87. [DOI] [PubMed] [Google Scholar]
- [34].Kent DM, Selker HP, Ruthazer R, Bluhmki E, Hacke W. The stroke-thrombolytic predictive instrument: a predictive instrument for intravenous thrombolysis in acute ischemic stroke. Stroke. 2006;37:2957–62. [DOI] [PubMed] [Google Scholar]
- [35].Kent DM, Ruthazer R, Decker C, Jones PG, Saver JL, Bluhmki E, et al. Development and validation of a simplified Stroke-Thrombolytic Predictive Instrument. Neurology. 2015;85:942–9. [DOI] [PMC free article] [PubMed] [Google Scholar]
- [36].The National Institute of Neurological Disorders and Stroke rt-PA Stroke Study Group. Tissue plasminogen activator for acute ischemic stroke. N Engl J Med. 1995;333:1581–7. [DOI] [PubMed] [Google Scholar]
- [37].Clark WM, Albers GW, Madden KP, Hamilton S. The rtPA (alteplase) 0- to 6-hour acute stroke trial, part A (A0276g) : results of a double-blind, placebo-controlled, multicenter study. Thromblytic therapy in acute ischemic stroke study investigators. Stroke. 2000;31:811–6. [DOI] [PubMed] [Google Scholar]
- [38].Clark WM, Wissman S, Albers GW, Jhamandas JH, Madden KP, Hamilton S. Recombinant tissue-type plasminogen activator (Alteplase) for ischemic stroke 3 to 5 hours after symptom onset. The ATLANTIS Study: a randomized controlled trial. Alteplase Thrombolysis for Acute Noninterventional Therapy in Ischemic Stroke. Jama. 1999;282:2019–26. [DOI] [PubMed] [Google Scholar]
- [39].Hacke W, Kaste M, Fieschi C, von Kummer R, Davalos A, Meier D, et al. Randomised double-blind placebo-controlled trial of thrombolytic therapy with intravenous alteplase in acute ischaemic stroke (ECASS II). Second European-Australasian Acute Stroke Study Investigators. Lancet. 1998;352:1245–51. [DOI] [PubMed] [Google Scholar]
- [40].Hernandez AV, Boersma E, Murray GD, Habbema JD, Steyerberg EW. Subgroup analyses in therapeutic cardiovascular clinical trials: are most of them misleading? Am Heart J. 2006;151:257–64. [DOI] [PubMed] [Google Scholar]
- [41].Burke JF, Sussman JB, Kent DM, Hayward RA. Three simple rules to ensure reasonably credible subgroup analyses. Bmj. 2015;351:h5651. [DOI] [PMC free article] [PubMed] [Google Scholar]
- [42].Huang Y, Gilbert PB, Janes H. Assessing treatment-selection markers using a potential outcomes framework. Biometrics. 2012;68:687–96. [DOI] [PMC free article] [PubMed] [Google Scholar]
- [43].Steyerberg EW, Vedder MM, Leening MJG, Postmus D, D’Agostino RB, Van Calster B, et al. Graphical assessment of incremental value of novel markers in prediction models: From statistical to decision analytical perspectives. Biometrical Journal. 2014:n/a-n/a. [DOI] [PubMed]
- [44].Vickers AJ, Kattan MW, Daniel S. Method for evaluating prediction models that apply the results of randomized trials to individual patients. Trials. 2007;8:14. [DOI] [PMC free article] [PubMed] [Google Scholar]
- [45].Vickers AJ, Elkin EB. Decision curve analysis: a novel method for evaluating prediction models. Med Decis Making. 2006;26:565–74. [DOI] [PMC free article] [PubMed] [Google Scholar]
- [46].Pauker SG, Kassirer JP. Decision Analysis. New England Journal of Medicine. 1987;316:250–8. [DOI] [PubMed] [Google Scholar]
Associated Data
This section collects any data citations, data availability statements, or supplementary materials included in this article.