

Abstract
We have previously shown that functional residual capacity (FRC) and lung clearance index were significantly greater in sleeping healthy infants when measured by N2 (nitrogen) washout using 100% O2 (oxygen) versus 4% SF6 (sulfur hexafluoride) washout using air. Following 100% O2 exposure, tidal volumes decreased by over 30%, while end‐expiratory lung volume (EELV, i.e., FRC) rose markedly based on ultrasonic flow meter assessments. In the present study to investigate the mechanism behind the observed changes, N2 MBW was performed in 10 separate healthy full‐term spontaneously sleeping infants, mean (range) 26 (18–31) weeks, with simultaneous EELV monitoring (respiratory inductance plethysmography, RIP) and oxygen uptake (V´O2) assessment during prephase air breathing, during N2 washout by exposure to 100% O2, and subsequently during air breathing. While flow meter signals suggested a rise in ELLV by mean (SD) 26 (9) ml over the washout period, RIP signals demonstrated no EELV change. V'O2/FRC ratio during air breathing was mean (SD) 0.43 (0.08)/min, approximately seven times higher than that calculated from adult data. We propose that our previously reported flow meter‐based overestimation of EELV was in fact a physiological artifact caused by rapid and marked movement of O2 across the alveolar capillary membrane into the blood and tissue during 100% O2 exposure, without concomitant transfer of N2 to the same degree in the opposite direction. This may be driven by the high observed O2 consumption and resulting cardiac output encountered in infancy. Furthermore, the low resting lung volume in infancy may make this error in lung volume determination by N2 washout relatively large.
Keywords: breathing pattern, functional residual capacity, inert gas washout, respiratory inductance plethysmography, ultrasonic flow sensor
In infancy, 100% O2 exposure during MBW decreased tidal volumes by >30%, whilst end‐expiratory lung volume (EELV, i.e., FRC) rose markedly, based on ultrasonic flow meter assessments. Respiratory inductance plethysmography signals demonstrated no EELV change. We propose this flow meter EELV overestimation is a physiological artifact caused by rapid marked O2 movement across the alveolar capillary membrane into blood and tissue during 100% O2 exposure, without concomitant equivalent N2 transfer in opposite direction. High O2 consumption and cardiac output in infancy may drive this. Low resting lung volume in infancy may make this lung volume determination error by N2 MBW relatively large.
1. INTRODUCTION
The multiple‐breath inert gas washout (MBW) method is increasingly used in young children for early detection of lung disease and to assess the impact on lung function from serious conditions such as cystic fibrosis (CF). Its high sensitivity to detect peripheral airway impairment from infancy (Amin et al., 2010; Gustafsson, De Jong, Tiddens, & Lindblad, 2008; Lum et al., 2007) is combined with high feasibility in all age groups (Robinson et al., 2018). The lung clearance index (LCI) from the MBW test has been recently endorsed as a primary outcome measure in CF clinical trials (Kent et al., 2014). The impact of inert gas choice remains of great interest (Guglani et al., 2018; Gustafsson, Bengtsson, Lindblad, & Robinson, 2017) and nitrogen‐based (N2) MBW using 100% oxygen (O2) continues to be advocated for this infant age group (Koucky, Skalicka, & Pohunek, 2018). Our work has focused on defining the physiological impact of 100% O2 exposure during MBW in this age group. Our initial study, published in the Journal of Applied Physiology in 2017, reported results from a study in 10 healthy full‐term spontaneously sleeping infants, comparing FRC (functional residual capacity), LCI, and breathing pattern during MBW performed with two different inert gas choices, nitrogen‐based (N2) MBW using 100% oxygen (O2) and sulfur hexafluoride (SF6) washout by air using the same recording device (Gustafsson et al., 2017). We demonstrated that both measured FRC and indices of ventilation inhomogeneity (i.e., LCI) were significantly greater using N2 washout versus SF6 MBW. Importantly, 100% O2 exposure during N2 MBW was associated with significant changes in the breathing pattern of the infants studied. These were not observed during SF6 MBW where O2 exposure was kept constant at 21%.
Exposure to 100% O2 led to a transient significant reduction in tidal volume (VT), minute ventilation (V′E), and “respiratory drive” (mean inspiratory flow; VTin/Tin) with a concomitant increase in end‐tidal CO2, while respiratory rate was unchanged (Koucky et al., 2018). A significant rise of the end‐expiratory lung volume (EELV, i.e., FRC) by a mean of 19 ml (≈10% relative) occurred based on the cumulative difference between inspiratory and expiratory tidal volumes (VTin ‐ VTex) measured by the ultrasonic flow meter over the course of the N2 washout phase. The lack of change during in vitro N2 MBW testing was consistent with an apparent physiological effect. Previous explanations for the fall in VT and V’E include “unloading” of the peripheral chemoreceptors leading to reduced “respiratory drive”, however, this was the first clear description in the literature of a change in EELV with 100% O2 exposure. Another potential explanation for this marked physiological artifact is the excess movement of O2 across the alveolar capillary membrane driven by the high metabolic rate or O2 consumption present in infants, due to a high O2 consumption per unit of alveolar gas volume.
Respiratory inductance plethysmography (RIP) is a method for monitoring breathing pattern based on the use of two elastic belts containing insulated sinusoid wire coils (Konno & Mead, 1967). These transducer bands are placed around the rib cage (RC) and the abdomen (ABD) and are connected to an oscillator. The recorded frequency in the respective circuits is proportional to the cross‐sectional area of the body at their respective positions and changes relative to VT excursions. The frequency signal is demodulated electronically to derive digital waveforms replicating the VT. The RIP signals can be calibrated using various maneuvers (Stromberg, Dahlback, & Gustafsson, 1993; Stromberg & Gustafsson, 2000) or they can be directly used and all changes are then relative. RIP can be run in either alternate current (AC) or direct current DC mode. In AC mode, signals have a relatively long time constant allowing the signals to return to a starting set point. This avoids volume drift and ensures good quality of VT assessments even when body position is changed, but does not allow accurate monitoring of EELV changes. In DC mode, signal output is proportional to cross‐sectional body surface area with no built‐in signal time constant, making it ideal for monitoring of breathing pattern and EELV in supine sleeping subjects who do not change body posture, such as sleeping infants monitored over the course of several minutes.
The purpose of the present study was to test the hypothesis that 100% O2 exposure during N2 MBW in healthy sleeping infants does not lead to an increase in EELV as assessed using RIP. Resting oxygen consumption was derived from MBW data collected prior to the start of washout with 100% O2 and compared to previously collected adult data.
2. METHODS
2.1. Test subjects and ethics
We recruited a separate cohort of healthy normally developed full‐term infants without a history of congenital lung malformations or health problems other than common transient upper airway or gastrointestinal infections. Invitation letters were sent out to care‐givers of infants in East Skaraborg County, West Sweden, using addresses provided from the Swedish population register. The infants were tested in the supine posture during quiet spontaneous sleep after a feed. A prephase of stable air breathing for 30–50 s (termed “pre‐phase”) was followed by N2 washout using 100% O2 (termed “exposure phase”), and subsequent N2 washin during medical air breathing (termed “recovery phase”). The study was approved by the Ethics Committee of the University of Gothenburg (DNR 746‐15).
2.2. Recording systems and procedures
MBW testing was performed using the Exhalyzer® D (ECO Medics AG, Switzerland), which measures N2 indirectly from the O2 and CO2 signals recorded. The calibration and N2 MBW recording procedures were performed in identical manner as reported in our previous study (Gustafsson et al., 2017), to which we refer for details. Data were recorded at 200 Hz per channel. Spiroware software version 3.2.1 was used for the recordings and data analysis. An infant‐size NOX RIP thorax belt was placed around the chest at the level of the nipples (No 7072197, RC‐band) and a NOX RIP abdomen belt was placed around the abdomen at the level of the umbilicus (No 7072196, ABD‐band; NOX RIP BELTs Disposable Pediatric N0 7072086, NOX Medical Katrinartun 2, 105 Reykjavik, Iceland). A custom‐built RIP oscillator and demodulator was used, and data were recorded at 200 Hz per channel using a custom‐written LabView (National Instruments, Cambridge, UK) application. The DC‐mode RC and ABD voltage signals were added to obtain a surrogate uncalibrated VT voltage signal allowing for monitoring of VT excursions and EELV. The sum RIP signal was scaled and synchronized with the corresponding flow meter signals. From the recordings made in each infant one test was selected for inclusion in the final analysis based on having the best quality of N2 washout and RIP traces, focusing on stability of EELV and VT in the prephase and lack of evidence of leaks or sighs over the washout and subsequent N2 washin. From a minimum of 20 breaths obtained during prephase air breathing recordings, V´O2, CO2 excretion (V´CO2), and RQ (Respiratory quotient, respiratory exchange ratio) were calculated after conversion of gas volumes into ambient temperature pressure dry conditions. Indirect calorimetry metabolic rate was calculated using the Weir equation (Weir, 1949): resting energy expenditure (REE) = [(3.941 × V´O2 (L)) + (1.106 × V´CO2 (L))] × 1,440 (kcal/day).
2.3. Data analysis and statistics
Microsoft Excel 2010 was used to compile and graphically display data. Tidal volume traces obtained from the synchronized, calibrated, and BTPS‐corrected output files (“B‐files”) using the Spiroware v3.2.1 software were visually aligned with the RIP VT traces as described above. The maximum cumulative differences between inspiratory and expiratory tidal volumes (VTin−VTex) starting with the first washout breath were calculated using Excel based on the tabulated output data from Spiroware.
3. RESULTS
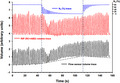
Twelve infants were recruited and subsequently attended the Department of Pediatrics at the Central Hospital in Skövde. Of these, 10 contributed at least one technically acceptable N2 MBW with simultaneous RIP recording. The remaining two subjects did not fall asleep or woke at the start of test procedures. The study group consisted of 10 healthy infants (six boys) aged mean (SD; range) 25 (4; 18–31) weeks) (Table 1), performing 2–4 N2 washout tests in the same session. Table 2 summarizes FRC, LCI, and breathing pattern results. Mean (SD) FRC was 129 (26) ml or 16.3 (2.7) ml/kg and LCI was 8.43 (0.75) across the cohort. During the exposure phase, VT dropped initially but to varying degrees among the subjects. For the study group as a whole, minimum expiratory VT during the exposure phase fell to a mean (SD) 47 (14)% of the maximum prephase VT value, or 63 (20)%, if expressed as a proportion of median exposure phase VT. Figure 1 (panels a–j) summarizes the N2 concentration, uncalibrated combined rib cage and abdomen volume, and ultrasonic flow meter volume traces during the prephase, exposure, and recovery phases separately in all 10 participants.
TABLE 1.
Demographic data of study population
| Subject | Initials | Gender | Age (weeks) | Body weight (kg) | Height (cm) |
|---|---|---|---|---|---|
| 1 | AVH | Male | 18 | 7.4 | 64 |
| 2 | AN | Female | 30 | 7.3 | 67 |
| 3 | OSW | Male | 24 | 7.4 | 66 |
| 4 | VK | Female | 23 | 8.6 | 68 |
| 5 | KF | Male | 23 | 9.1 | 71 |
| 6 | AL | Female | 21 | 6.5 | 61 |
| 7 | GS | Male | 28 | 8.9 | 68 |
| 8 | IL | Male | 29 | 7.4 | 65 |
| 9 | LL | Female | 31 | 7.8 | 69 |
| 10 | ON | Male | 25 | 8.6 | 68 |
| Mean | 25 | 7.9 | 67 | ||
| SD | 4 | 0.8 | 3 |
TABLE 2.
N2 multiple‐breath washout results
| Subject | FRC (ml) | LCI | Number of washout breaths | VTex (ml) | Cumulative VTin−VTex difference (ml) | Number of tests | ||
|---|---|---|---|---|---|---|---|---|
| Median | Max | Min | ||||||
| 1 | 117 | 7.85 | 32 | 35 | 48 | 21 | 31 | 2 |
| 2 | 120 | 7.68 | 23 | 49 | 58 | 24 | 20 | 2 |
| 3 | 155 | 9.55 | 25 | 64 | 99 | 55 | 20 | 2 |
| 4 | 144 | 8.78 | 32 | 45 | 59 | 26 | 12 | 3 |
| 5 | 165 | 7.50 | 24 | 58 | 78 | 46 | 27 | 3 |
| 6 | 81 | 8.24 | 23 | 35 | 50 | 26 | 24 | 2 |
| 7 | 124 | 8.55 | 24 | 49 | 59 | 33 | 30 | 4 |
| 8 | 96 | 9.60 | 24 | 47 | 64 | 30 | 22 | 3 |
| 9 | 146 | 7.76 | 22 | 55 | 70 | 40 | 43 | 4 |
| 10 | 138 | 8.75 | 33 | 47 | 63 | 7 | 32 | 4 |
| Mean | 129 | 8.43 | 26 | 48 | 65 | 31 | 26 | 3 |
| SD | 26 | 0.75 | 4 | 9 | 15 | 14 | 9 | 1 |
Abbreviations: FRC, functional residual capacity; LCI, lung clearance index; VTex, expired tidal volume; VTin, inspired tidal volume.
FIGURE 1.
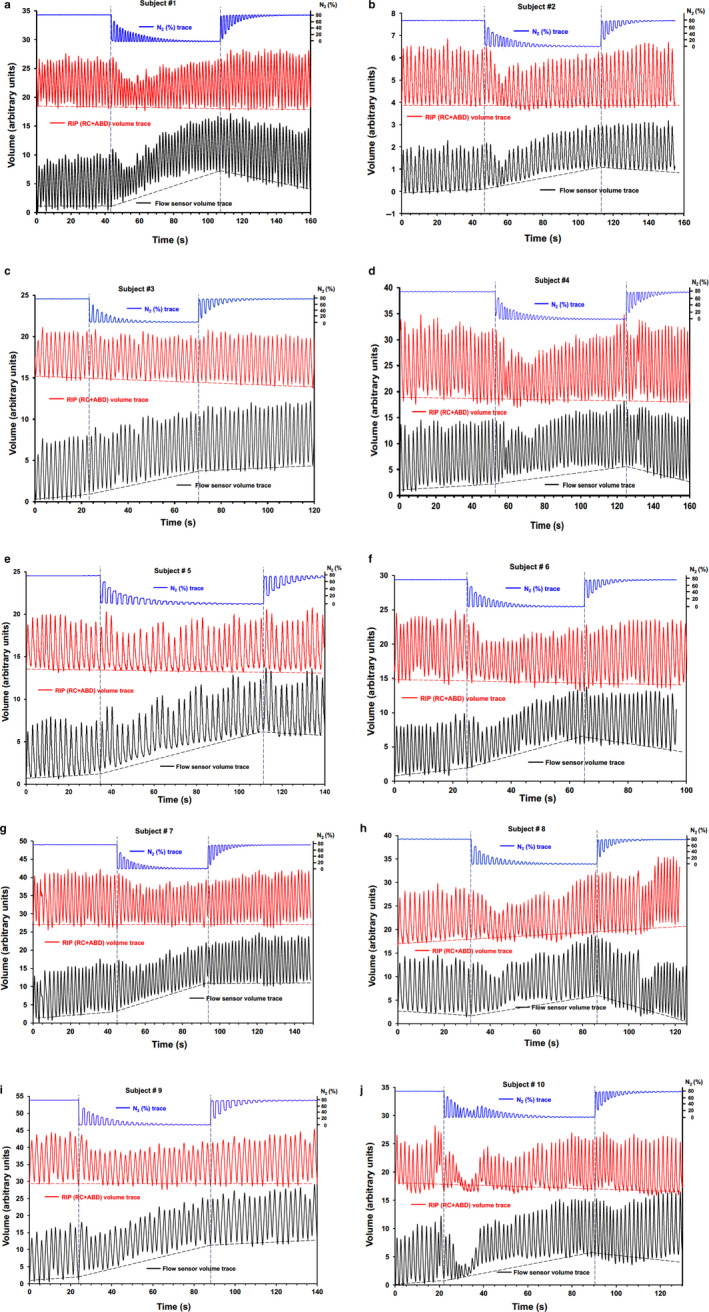
(panel a–j). N2 concentrations, RIP (respiratory inductance plethysmography) and flow sensor derived volume traces during air breathing prephase (stable N2 concentrations), 100% O2 exposure phase (falling N2 end‐tidal concentrations) in 10 infants, and subsequent air breathing recovery phase (rising N2 end‐tidal concentrations). Vertical dashed lines delineate the start and end of the exposure phase, while the direction of change in EELV before, during, and after the exposure phase for the flow meter and RIP signals is also shown
A very close agreement between the RIP and flow meter based VT excursions was visually confirmed. Overall, the prephase showed a stable EELV as recorded by the two independent methods. In contrast, EELV appeared to rise over the first half or two thirds of the washout as recorded by the flow meter, followed by a stable or falling EELV. However, RIP signals remained consistent with a stable EELV. The maximum cumulative difference in flow meter based inspiratory and expiratory VT was mean (SD; range) 26 (9; 12–43) ml (Table 2), constituting a mean (SD; range) 52 (20)% of median expiratory VT and 20 (7)% of measured FRC (mean (SD)), for the study group as a whole.
Mean (SD) V´O2 and V´CO2 during air breathing were 6.75 (0.67) and 6.12 (0.99) ml min−1 kg−1 body weight, respectively, giving an RQ of mean (SD) 0.91 (0.13) (Table 3). The REE (metabolic rate) was mean (SD) 48.0 (4.7) kcal 24 h−1 kg−1 body weight.
TABLE 3.
Metabolic results from indirect calorimetry during prephase air breathing
| Subject number | V'O2 | V'CO2 | RQ | Metabolic rate | |||
|---|---|---|---|---|---|---|---|
| (ml/min) | (ml min−1 kg−1) | (ml/min) | (ml min−1 kg−1) | (kcal/24 h) | (kcal 24 h−1 kg−1) | ||
| 1 | 49.06 | 6.65 | 44.35 | 6.01 | 0.90 | 349 | 47.3 |
| 2 | 47.00 | 6.44 | 43.15 | 5.91 | 0.92 | 336 | 46.0 |
| 3 | 54.25 | 7.36 | 58.46 | 7.93 | 1.08 | 401 | 54.4 |
| 4 | 66.48 | 7.15 | 43.71 | 4.70 | 0.66 | 447 | 48.1 |
| 5 | 47.27 | 5.22 | 43.44 | 4.79 | 0.92 | 337 | 37.2 |
| 6 | 45.66 | 7.02 | 39.84 | 6.13 | 0.87 | 323 | 49.6 |
| 7 | 55.18 | 6.19 | 62.84 | 7.05 | 1.14 | 413 | 46.4 |
| 8 | 52.66 | 7.12 | 43.54 | 5.88 | 0.83 | 368 | 49.8 |
| 9 | 57.97 | 7.47 | 54.35 | 7.00 | 0.94 | 416 | 53.5 |
| 10 | 59.02 | 6.83 | 50.42 | 5.84 | 0.85 | 415 | 48.1 |
| Mean | 53.45 | 6.75 | 48.41 | 6.12 | 0.91 | 380 | 48.0 |
| SD | 6.54 | 0.67 | 7.72 | 0.99 | 0.13 | 43 | 4.7 |
Abbreviations: RQ, respiratory quotient or respiratory exchange ratio; V´CO2, CO2 excretion; V´O2, oxygen uptake. Data presented as measured and per kg body weight values.
4. DISCUSSION
4.1. Summary of findings
The present study confirms our previously published observations (Gustafsson et al., 2017) of a marked reduction in VT and an apparent rise in EELV over the course of an N2 MBW using 100% O2 for washout of N2 in a separate cohort of healthy infants. By using concomitant flow meter and RIP recordings in the present study, we have confirmed our hypothesis that the rise in EELV during washout, based on the flow meter signal, represents a physiological artifact and not a true change in EELV. This has not been clearly described before in the literature. Our findings provide further evidence to support the view that N2 MBW using 100% O2 is not the MBW method of choice in infancy. The hypothesis that significant transfer of gas species across the alveolar capillary membranes plays a significant factor in the larger N2 versus SF6 FRC and LCI values in infants previously reported (Gustafsson et al., 2017) is further supported by the greater REE (metabolic rate) values observed in these infants studied, compared to previously published values for adults.
4.2. Interpretation of findings
In our previously reported study comparing N2 and SF6 MBW results in healthy spontaneously sleeping infants (Gustafsson et al., 2017) in vitro tests demonstrated that inspiratory and expiratory VT difference during 100% O2 exposure was not due to a technical artifact. We propose that a large influx of O2 into the blood and further into other body tissue, not balanced by a corresponding N2 outflow, might explain the apparent changes in EELV. While partial pressure of N2 in blood or other tissue is similar to that in the atmosphere, O2 partial pressure is lower in blood and tissue than in the atmosphere. The influx of O2 is driven by the high resting metabolic rate, measured in our infants, and as a result they have a high cardiac output for body and lung size (FRC).
Our estimates of resting metabolic rate are consistent with the previously published literature in the age range, with reported values within 15% of those obtained using published prediction equations (Brody, 1945; Lindahl, 1989). Lindahl studied 38 children aged 1 day to 7 years during anesthesia and reported prediction equations based on the fact that metabolism was related to body weight: for the overall cohort, V´O2 = 5.0 × kg + 19.8 (r .94) and V´CO2 = 4.8 × kg + 6.4 (r .94); in those <10 kg (n = 21), V´O2 = 6.8 × kg + 8.0 (r .78) and V´CO2 = 7.2 × kg + −8.9 (r .90); RQ was 0.7–1.0 (Lindahl, 1989). Compared to predicted values, our measured values underestimated V´O2 by 9.9% and 13.4% (<10 kg specific equation) and overestimated V´CO2 by 9.2% and 0.4%, respectively. Compared to predicted values based on the Brody equation (V´O2 = 10*BW3/4, where BW is body weight in kg) V´O2 was overestimated by 13.5%. This latter Brody equation is, however, based on lean body weight. In our studies, the accuracy of O2 and CO2 flow measurements is further supported by the fact that both are used in assessments of FRC N2 and FRC SF6 using the Exhalyzer® D device, and FRC measurement validated accuracy has been demonstrated in vitro previously (Gustafsson, Robinson, Lindblad, & Oberli, 2016; Singer, Houltz, Latzin, Robinson, & Gustafsson, 2012).
In the present study the mean (SD) ratio of V´O2 to FRC in the infants was 0.43 (0.08)/min. Subtraction of airway dead space (estimated as 2 ml/kg body weight) to calculate VA (alveolar volume) elevated this ratio to 0.49 (0.11). This is greater than previous estimates for this age range. Dharmakumara, Prisk, Royce, Tawhai, and Thompson (2014) reported values of approximately 1.11/min for V´O2/VA in mice, as representative for small animals. The authors estimated V´O2/VA in an adult male to be approximately 0.04/min (Dharmakumara et al., 2014), and proposed similar V´O2/VA values in children (≈0.10/min). Infants and neonates were thought to have values of about 0.20/min, based on the Lindahl (1989) study data.
Agreement with this trend is also illustrated from derived adult data for resting V´O2/FRC ratio. Cunha et al measured resting V´O2 in 125 healthy males (aged 17–38 years) and reported mean (95% confidence interval) values of 3.21 (3.13–3.30) ml kg−1 min−1 (Cunha, Midgley, Montenegro, Oliveira, & Farinatti, 2013). In our lung function testing laboratory, the N2‐derived MBW FRC values measured in an adult healthy control dataset (n = 137, aged 18–40 years, 66 females) were mean (SD) 48.7 (12.3) ml/kg body weight. Combining these two mean values of the datasets, and subtracting 200 ml airway dead space from FRC to derive VA, produces an adult V´O2/VA estimate of 0.066/min. These comparative data suggest that V´O2/VA was approximately 7.4 times greater in the infants studied than this adult estimate (0.49 vs. 0.066), supporting our hypothesis that a relatively large O2 influx in relation to both resting lung volume and N2 efflux could explain EELV drift and overestimation using the flow sensor. We have not directly compared the flux of O2 and N2 as N2 is indirectly measured using the combined O2 and CO2 signals with Exhalyzer® D. We believe, however, that the relatively greater influx of O2 into tissue of the infants is to some degree balanced by tissue N2 being transported into the lungs and further exhaled. This may account for the greater FRC and LCI using N2 versus SF6 MBW infants previously reported (Gustafsson et al., 2017).
4.3. Strengths and weakness with the present study
The present study was undertaken in sleeping healthy infants during spontaneous sleep. By avoiding the influence of sedation or lung disease, these findings are very likely to reflect true physiological events provoked by exposure to 100% O2. The narrow age range of the infants studied (18–31 weeks) reflects attempts made to obtain successful sleep induction after a daytime meal, but did not allow us to investigate whether there is an age influence on the “apparent EELV effect” reported. It will be of interest to explore this in future studies and to explore if there is a correlation between the magnitude of this EELV difference and the difference between N2 versus SF6 FRC and LCI indices in a given subject. Due to limited infant sleep time of the infants studied, sufficient high‐quality data to allow formal comparison of within‐subject variability of RIP data were not obtained, nor was concurrent SF6 MBW testing with RIP attempted. However, in our earlier study no EELV effect was observed with flow meter signals during SF6 MBW, and is therefore unlikely to be present on RIP signals.
RIP signals were not directly calibrated against a flow meter (Konno & Mead, 1967; Stromberg et al., 1993; Stromberg, Eklund, & Gustafsson, 1996) due to its time consuming nature and potential detrimental impact and the ability of the child to maintain quiet sleep for sufficient MBW testing. A previous study has validated the use of uncalibrated RIP signals to determine infant tidal breathing indices (Stick, Ellis, LeSouef, & Sly, 1992), and the close agreement between flow meter and RIP VT traces reinforce our approach that calibration of RIP was not necessary for obtaining trustworthy replications of the true EELV course during washout. Two infants (subject # 6 and 8; Table 2) had markedly lower FRC than the remainders. The parents of these infants did not report any history of respiratory problems and none of the participants was born prematurely. Possible explanations include overfeeding before testing and/or variation in sleep state such that EELV was not actively maintained, in contrast to the normal dynamic lung volume control exerted by young infants (Kosch & Stark, 1984). Nevertheless, the pattern of VT and “apparent EELV changes” were similar in these two infants compared to the remaining participants.
Formal studies comparing EELV and VT course over N2 MBWs with 100% O2 in older subjects during sleep or wakefulness and in different body postures are lacking. Firm conclusions about the generalizability of present findings in spontaneously sleeping supine infants to older age groups can therefore not be drawn and further studies are warranted. Ideally, direct measurements of N2 and O2 in and out flux should be made. Comparisons of cardiac output and metabolic rate across childhood during or in very close time with N2 and SF6 MBW would be of great interest to test the idea that a high cardiac output in relation to body size or lung size is a driving mechanism of the tissue N2 causing a greater difference between N2‐ and SF6‐derived FRC and LCI values in younger ages.
4.4. Summary and conclusions
Based on ultrasonic flow meter signals, EELV appeared to rise markedly in sleeping healthy infants over the course of an N2 washout using 100% O2 and then stabilize or decline over subsequent N2 washin. Simultaneous DC‐mode RIP recordings, however, demonstrate that EELV remains stable over the washout. We propose that a rapid and marked movement of O2 across the alveolar capillary membrane into the blood and tissue occurs during pure O2 exposure, without concomitant transfer of N2 to the same degree in the opposite direction. The cause of this may be the relatively high V´O2 and cardiac output of infants in relation to their resting lung volume. Modeling studies in the future would be of great value to investigate this mechanism further.
AUTHOR CONTRIBUTIONS
Per M. Gustafsson initiated, designed, and planned the study, developed some of the recording devices and software, and analyzed data. Laszlo Kadar, Sanna Kjellberg, Lena Andersson, Anders Lindblad, and Paul D. Robinson participated in the design and planning of the study. Laszlo Kadar, Sanna Kjellberg, and Lena Andersson recruited test subjects and recorded data, and performed preliminary reviews of recorded data. Per M. Gustafsson performed the final analysis of data and drafted the manuscript together with Paul D. Robinson. All authors contributed significantly to the final writing of the manuscript.
ACKNOWLEDGEMENTS
The studies for this article were performed at the Department of Pediatrics, Central Hospital, Skövde, Sweden. The study was financed by a 2015 Vertex Innovation grant for a project entitled “Optimizing Multiple Breath Washout Methods for CF infants and Preschool Children”. None of the authors have any additional potential conflicts of interest to declare, and specifically have no commercial interests in ECO MEDICS AG or any of the products from ECO MEDICS AG.
Gustafsson PM, Kadar L, Kjellberg S, Andersson L, Lindblad A, Robinson PD. End‐expiratory lung volume remains stable during N2 MBW in healthy sleeping infants. Physiol Rep. 2020;8:e14477 10.14814/phy2.14477
REFERENCES
- Amin, R. , Subbarao, P. , Jabar, A. , Balkovec, S. , Jensen, R. , Kerrigan, S. , … Ratjen, F. (2010). Hypertonic saline improves the LCI in paediatric CF patients with normal lung function. Thorax, 65, 379–383. [DOI] [PubMed] [Google Scholar]
- Brody, S. (1945). Bioenergetics and growth. New York: Reinhold Publishing Company. [Google Scholar]
- Cunha, F. A. , Midgley, A. W. , Montenegro, R. , Oliveira, R. B. , & Farinatti, P. T. (2013). Metabolic equivalent concept in apparently healthy men: A re‐examination of the standard oxygen uptake value of 3.5 mL.kg(‐1).min(‐1.). Applied Physiology, Nutrition and Metabolism, 38, 1115–1119. [DOI] [PubMed] [Google Scholar]
- Dharmakumara, M. , Prisk, G. K. , Royce, S. G. , Tawhai, M. , & Thompson, B. R. (2014). The effect of gas exchange on multiple‐breath nitrogen washout measures of ventilation inhomogeneity in the mouse. Journal of Applied Physiology, 117, 1049–1054. 10.1152/japplphysiol.00543.2014 [DOI] [PMC free article] [PubMed] [Google Scholar]
- Guglani, L. , Kasi, A. , Starks, M. , Pedersen, K. E. , Nielsen, J. G. , & Weiner, D. J. (2018). Difference between SF6 and N2 Multiple Breath Washout kinetics is due to N2 back diffusion and error in N2 offset. Journal of Applied Physiology. 10.1152/japplphysiol.00326.2018 [DOI] [PubMed] [Google Scholar]
- Gustafsson, P. M. , Bengtsson, L. , Lindblad, A. , & Robinson, P. D. (2017). The effect of inert gas choice on multiple breath washout in healthy infants: Differences in lung function outcomes and breathing pattern. Journal of Applied Physiology, 123, 1545–1554. 10.1152/japplphysiol.00524.2017 [DOI] [PubMed] [Google Scholar]
- Gustafsson, P. M. , De Jong, P. A. , Tiddens, H. A. , & Lindblad, A. (2008). Multiple‐breath inert gas washout and spirometry versus structural lung disease in cystic fibrosis. Thorax, 63, 129–134. 10.1136/thx.2007.077784 [DOI] [PubMed] [Google Scholar]
- Gustafsson, P. M. , Robinson, P. D. , Lindblad, A. , & Oberli, D. (2016). Novel methodology to perform sulfur hexafluoride (SF6)‐based multiple‐breath wash‐in and washout in infants using current commercially available equipment. Journal of Applied Physiology, 121, 1087–1097. [DOI] [PubMed] [Google Scholar]
- Kent, L. , Reix, P. , Innes, J. A. , Zielen, S. , Le Bourgeois, M. , Braggion, C. , … De Boeck, K. (2014). European Cystic Fibrosis Society Clinical Trial Network Standardisation C. Lung clearance index: Evidence for use in clinical trials in cystic fibrosis. Journal of Cystic Fibrosis, 13, 123–138. 10.1016/j.jcf.2013.09.005 [DOI] [PubMed] [Google Scholar]
- Konno, K. , & Mead, J. (1967). Measurement of the separate volume changes of rib cage and abdomen during breathing. Journal of Applied Physiology, 22, 407–422. 10.1152/jappl.1967.22.3.407 [DOI] [PubMed] [Google Scholar]
- Kosch, P. C. , & Stark, A. R. (1984). Dynamic maintenance of end‐expiratory lung volume in full‐term infants. Journal of Applied Physiology: Respiratory, Environmental and Exercise Physiology, 57, 1126–1133. 10.1152/jappl.1984.57.4.1126 [DOI] [PubMed] [Google Scholar]
- Koucky, V. , Skalicka, V. , & Pohunek, P. (2018). Nitrogen multiple breath washout test for infants with cystic fibrosis. European Respiratory Journal, 52 10.1183/13993003.00015-2018 [DOI] [PubMed] [Google Scholar]
- Lindahl, S. G. (1989). Oxygen consumption and carbon dioxide elimination in infants and children during anaesthesia and surgery. British Journal of Anaesthesia, 62, 70–76. 10.1093/bja/62.1.70 [DOI] [PubMed] [Google Scholar]
- Lum, S. , Gustafsson, P. , Ljungberg, H. , Hulskamp, G. , Bush, A. , Carr, S. B. , … Stocks, J. (2007). Early detection of cystic fibrosis lung disease: Multiple‐breath washout versus raised volume tests. Thorax, 62, 341–347. 10.1136/thx.2006.068262 [DOI] [PMC free article] [PubMed] [Google Scholar]
- Robinson, P. D. , Latzin, P. , Ramsey, K. A. , Stanojevic, S. , Aurora, P. , Davis, S. D. , … Ratjen, F. (2018). Pediatrics ATSAo. Preschool Multiple‐Breath Washout Testing. An Official American Thoracic Society Technical Statement. American Journal of Respiratory and Critical Care Medicine, 197, e1–e19. 10.1164/rccm.201801-0074ST [DOI] [PubMed] [Google Scholar]
- Singer, F. , Houltz, B. , Latzin, P. , Robinson, P. , & Gustafsson, P. (2012). A realistic validation study of a new nitrogen multiple‐breath washout system. PLoS One, 7, e36083 10.1371/journal.pone.0036083 [DOI] [PMC free article] [PubMed] [Google Scholar]
- Stick, S. M. , Ellis, E. , LeSouef, P. N. , & Sly, P. D. (1992). Validation of respiratory inductance plethysmography ("Respitrace") for the measurement of tidal breathing parameters in newborns. Pediatric Pulmonology, 14, 187–191. 10.1002/ppul.1950140308 [DOI] [PubMed] [Google Scholar]
- Stromberg, N. O. , Dahlback, G. O. , & Gustafsson, P. M. (1993). Evaluation of various models for respiratory inductance plethysmography calibration. Journal of Applied Physiology, 74, 1206–1211. 10.1152/jappl.1993.74.3.1206 [DOI] [PubMed] [Google Scholar]
- Stromberg, N. O. , & Gustafsson, P. M. (2000). Ventilation inhomogeneity assessed by nitrogen washout and ventilation‐perfusion mismatch by capnography in stable and induced airway obstruction. Pediatric Pulmonology, 29, 94–102. [DOI] [PubMed] [Google Scholar]
- Stromberg, T. , Eklund, J. , & Gustafsson, P. M. (1996). A method for measuring the CO2 dead space volume in facial visors and respiratory protective devices in human subjects. Ergonomics, 39, 1087–1106. [DOI] [PubMed] [Google Scholar]
- Weir, J. B. (1949). New methods for calculating metabolic rate with special reference to protein metabolism. Journal of Physiology, 109, 1–9. 10.1113/jphysiol.1949.sp004363 [DOI] [PMC free article] [PubMed] [Google Scholar]