

ABSTRACT
The ability of small extracellular vesicles (sEVs) to reprogram cancer cells is well established. However, the specific sEV components able to mediate aberrant effects in cancer cells have not been characterized. Integrins are major players in mediating sEV functions. We have previously reported that the αVβ3 integrin is detected in sEVs of prostate cancer (PrCa) cells and transferred into recipient cells. Here, we investigate whether sEVs from αVβ3-expressing cells affect tumour growth differently than sEVs from control cells that do not express αVβ3. We compared the ability of sEVs to stimulate tumour growth, using sEVs isolated from PrCa C4-2B cells by iodixanol density gradient and characterized with immunoblotting, nanoparticle tracking analysis, immunocapturing and single vesicle analysis. We incubated PrCa cells with sEVs and injected them subcutaneously into nude mice to measure in vivo tumour growth or analysed in vitro their anchorage-independent growth. Our results demonstrate that a single treatment with sEVs shed from C4-2B cells that express αVβ3, but not from control cells, stimulates tumour growth and induces differentiation of PrCa cells towards a neuroendocrine phenotype, as quantified by increased levels of neuroendocrine markers. In conclusion, the expression of αVβ3 integrin generates sEVs capable of reprogramming cells towards an aggressive phenotype.
KEYWORDS: Prostate cancer, tumour growth, synaptophysin, aurora kinase A, iodixanol density gradient
Introduction
Extracellular vesicles (EVs) are particles that are delimited by a lipid bilayer and that are released from cells [1]. In this manuscript, we define small EVs (sEVs) as those particles isolated from cell supernatants using iodixanol density gradients, as well as vesicles isolated from the plasma of TRAMP mice through differential centrifugation. We further define sEVs predominantly by their size (50–150 nm in diameter), and their enrichment of specific proteins, such as CD9, CD63, CD81, TSG101 and ALIX [1,2].
sEVs are involved in regulating a variety of cellular processes, including adhesion, migration, proliferation and differentiation, and they carry integrins [3–5]. Integrins, which are transmembrane receptors composed of two subunits, termed α and β, appear to play a role in cancer, as indicated by various studies that have shown altered integrin composition in cells during cancer, including prostate cancer (PrCa), progression [6,7]. For example, it has been reported that some β1 integrin heterodimers are downregulated in PrCa [8], while αVβ1, αVβ6 and α6β1 integrins are overexpressed in PrCa [9–12].
The αVβ3 integrin is usually present at very low levels in normal human prostate cells but is highly expressed in PrCa cells and metastasis, and is believed to promote invasion and adhesion of cancer cells to extracellular matrix proteins, such as vitronectin [7,13,14]. Given its widespread distribution in PrCa, αVβ3 has been explored as a therapeutic target in some studies [15,16]; however, its role and expression have not been explored in the most aggressive forms of PrCa, such as neuroendocrine PrCa (NEPrCa). NEPrCa is an aggressive subtype of PrCa that typically develops from subsets of castrate-resistant PrCa (CRPrCa) [17]. NEPrCa does not express androgen receptor (AR) or prostate-specific antigen (PSA) but does express neuron-specific proteins, such as aurora kinase A (AURKA), synaptophysin (SYP), and neuron specific enolase (NSE) [18] that activate pro-tumorigenic pathways independently from the AR [19,20]. NEPrCa frequently metastasizes, responds poorly to chemotherapy, and is often associated with poor prognosis, with a life expectancy of less than one year [21]. How PrCa differentiates into NEPrCa is unclear; this knowledge is particularly important for understanding the onset of NE differentiation (NED) and developing new therapeutic strategies to block it.
Here, we describe studies designed to shed light on the role of αVβ3-containing sEVs in PrCa, and particularly in NEPrCa. We show, for the first time, that sEVs, isolated using iodixanol density gradients from CRPrCa cells that express αVβ3, promote tumour growth and induce NED in recipient cancer cells both in vivo and in vitro. Conversely, sEVs isolated from CRPrCa cells that do not express αVβ3 exert a minimal effect on tumour growth. Overall, we demonstrate that the cellular expression of αVβ3 integrin generates sEVs with the ability to reprogram cells towards an aggressive phenotype.
Materials and methods
Cell lines
C4-2B β3, C4-2B Mock, C4-2B β3-GFP, C4-2B Mock-GFP, DU145, PC3, LNCaP and LNCaP β3 cells, and culture conditions have been previously described [5,22,23].
Antibodies
The following antibodies (Abs) were used for immunoblotting (IB) analysis: mouse monoclonal Abs against: CD9 (Santa Cruz, sc18869), CD63 (Abcam, ab8219), CD81 (Abcam, ab23505), SYP (Dako, M0776) and ALIX (Abcam, ab117600); rabbit polyclonal Abs against: TSG101 (Abcam, ab30871) and CANX (Santa Cruz, sc-11397); rabbit monoclonal Ab against AURKA (Cell Signalling, D3E4Q). A rabbit polyclonal Ab against the cytoplasmic domain of the human β3 subunit has been described [13]. For immunofluorescence assays, AP3 mouse monoclonal Ab against β3 (ATCC) was used. For immunohistochemistry analysis, rabbit monoclonal Ab against β3 integrin (Cell Signalling, 13166 S) and rabbit monoclonal Ab against synaptophysin (SP11, Ventana, 790–4407) were used. For sEV treatments, mouse monoclonal Ab against αVβ3 integrin (LM609, Millipore MAB1976) and mouse IgG1 (Thermo Scientific, 31202) were used.
For ExoView assays, the following NanoView Biosciences Abs were used: CD81 (JS-81), CD63 (H5 C6), CD9 (HI9A), CD41 (HIP8) and mouse IgG1 (MOPC-21); also, EpCAM (9C4, Biolegend) and β3 integrin/CD61 (VIPL2, BD Biosciences) were used.
sEV isolation by differential centrifugation
Isolation of sEVs from C4–2B β3, C4–2B Mock, C4–2B β3-GFP and LNCaP β3 cells was performed as previously described [2,22,23]. The culture supernatant (SN) was collected after 48 h of serum starvation and processed by differential ultracentrifugation. The SN was first precleared of dead cells and debris by centrifugation at 2000 × g for 20 min at 4°C. The SN was then transferred to a fresh ultracentrifuge tube and centrifuged at 10,000 × g for 35 min at 4°C. The remaining SN was then centrifuged at 100,000 × g for 70 min at 4°C. The pellet was further washed in PBS, followed by a filtration step using 0.22 μm filters (Milex®GP, Millipore #SLGP033RS) and a second wash at 100,000 × g for 70 min at 4°C. The final pellet (P100) was resuspended in 1×PBS for storage at – 80°C and subsequent nanoparticle tracking analysis (NTA) and immunoblotting (IB). Total cell lysates and sEV lysates were prepared in RIPA buffer.
sEV isolation from TRAMP (transgenic adenocarcinoma of the mouse prostate) mouse plasma
Male TRAMP mice were used in this study. For TRAMP: n = 3; for Wild-Type: n = 3. At 20 weeks of age, when palpable tumours have formed, the blood was collected through intracardiac withdrawal from the animals and the plasma was isolated by centrifuging the blood at 16,100 × g for 30 min at 4°C. Using 500 μL of plasma, the sEVs were isolated as described above. Care of animals was in compliance with standards established by the Office of Laboratory Animal Welfare, Department of Health and Human Services at NIH. Experimental protocols were approved by the Institutional Animal Care and Use Committee (IACUC) at Thomas Jefferson University.
Iodixanol density gradient
The P100 pellets, isolated from the differential centrifugations described above, were subjected to iodixanol density gradient isolation as previously described [5,24]. The 30%, 20% and 10% wt/vol iodixanol solutions were prepared by diluting a stock solution (60% wt/vol) of iodixanol (OptiPrep™, Sigma #1556) with a buffer solution (0.25 M sucrose, 10 mM Tris, 1 mM EDTA, pH 7.4). The P100 was mixed with stock iodixanol solution to generate 1.6 mL of 30% iodixanol-P100 suspension and loaded at the bottom of a SW55Ti rotor tube (Beckman). Next, 0.7 mL of 20% and 0.7 mL of 10% (wt/vol) iodixanol were successively layered on top of the 30% iodixanol-P100 suspension to generate a discontinuous iodixanol density gradient. The tubes were then centrifuged for 70 min at 350,000 × g, 4°C, in a SW55Ti rotor using a Beckman L8–70M Ultracentrifuge. Ten fractions of 260 μL each were then collected, starting from the top of the tube. The density of each fraction was assessed with an ABBE-3L refractometer (Fisher Scientific). All fractions were diluted and washed with 1 mL PBS and centrifuged for 2 h at 100,000 × g, 4°C, in a TLA-100.2 rotor using a Beckman Optima TL Ultracentrifuge. The resulting pellets for each fraction were re-suspended in 30 μL of PBS and stored at −80°C until further use.
Immunoblotting (IB) analysis
The total protein concentration of sEVs was determined using BioRad DCTM protein assay kit as per the manufacturer’s protocol. Equal amounts of proteins (7–50 μg) were separated by 12.5% sodium dodecyl sulphate-polyacrylamide gel electrophoresis (SDS-PAGE), transferred to PVDF membranes (Immobilon-E PVDF membrane, Millipore), blocked with blocking buffers (5% non-fat dry milk in Tris Buffer Saline with 0.1% Tween 20 [TBST]) for 1 hour at room temperature, incubated overnight (16 hours) with primary Abs at 4°C followed by TBST washes (4 × 5 min) at room temperature, then incubated with horseradish peroxidase (HRP)-conjugated anti-mouse or -rabbit secondary Abs for 1 hour at room temperature, followed by TBST washes (4 × 5 min) at room temperature. For visualization, WesternBrightTM ECL HRP substrate kits (Advansta Inc., CA, USA) were used.
Nanoparticle tracking analysis (NTA)
NTA (NS300, Malvern Instruments, MA) was used to determine the size distribution and concentration of sEVs released from C4-2B β3, C4-2B Mock, C4-2B β3-GFP and C4-2B Mock-GFP cells. Briefly, sEV suspensions were diluted 1:1000 in PBS, and the analysis was performed using camera level settings ranging from 11 to 13 to avoid saturation (coloured pixels). Using the standard measurement, described in the NTA software SOP, video files of 30 or 60 s (repeated 3 or 5 times) were captured with a frame rate of 25 frames per second of particles moving under Brownian motion at a temperature ranging between 22°C and 25°C. The analysis of videos was performed at a detection threshold ranging from 3–5, NTA software version 3.1.54.
Detection and characterization of αVβ3 on sEVs using SP-IRIS (single particle interferometric reflectance imaging sensor)
Immunocapturing and digital detection of the sEVs was performed as described in Daaboul et al. [25]. Briefly, NanoView Biosciences produced chips with capture Abs against human CD63, CD81, CD9, CD41 and EpCAM together with the negative control IgG. For technical replicates, the Abs were spotted on the chips in quadruplicate. All samples were diluted in the NanoView Biosciences Solution A before being incubated on the ExoView chip arrayed with the capture Ab. The samples were incubated on the chip for 16 h at room temperature in a sealed 24-well plate. The chips were then washed three times in 750 µL of Solution A for 3 min each on an orbital shaker. Then the chips were incubated with a fluorescent β3 integrin Ab labelled with CF555 diluted to a final concentration of 0.1 µg/mL in Solution A with 2% BSA for 1 h. The chips were then washed once in NanoView Solution A, three times in NanoView Solution B followed by a rinse in filtered DI water and dried. The chips were then imaged with the ExoView R100 reader using nScan 2.8.4 acquisition software. The data were then analysed using NanoViewer 2.8.11 with sizing thresholds set to 50 to 200 nm diameter. To normalize the particle count between different capture Abs, the analysis area was restricted to the area of a circle with a diameter of 150 µm.
Immunofluorescence (IF) analysis
DU145 cells (150,000) were grown in 12-well plates and serum-starved for 24 h before incubation with 20 μg (corresponding to ~6 × 10¹⁰ particles) of sEVs isolated using iodixanol density gradients from C4-2B β3-GFP cells or C4-2B Mock-GFP cells. After 16-h incubation, cells were detached and plated on glass coverslips coated with 10 μg/mL human plasma vitronectin and allowed to attach for 4 h. Cells were then washed with PBS (2 washes), fixed with 4% PFA for 15 min at room temperature, washed with PBS (3 washes), quenched with 50 mmol/L NH4 Cl for 15 min, permeabilized with 0.25% Triton-100 for 10 min, blocked for 1 h using 5% BSA in PBST (PBS and 1% Tween 20), followed by overnight incubation with primary Ab (AP3, anti-β3) in blocking solution at 4°C. After overnight incubation, the coverslips were washed with PBS (3 washes) and incubated with secondary Ab (Goat anti mouse, Alexa 546) for 1 h and washed three times with PBST. The glass coverslips were mounted on glass slides using ProLong™ diamond antifade containing DAPI (Invitrogen). The slides were analysed, and images were captured by a Nikon A1 R confocal microscope. A Z-stack image analysis using imaging software ImageJ FIJI (version 4.11.0) was also performed to evaluate sEV internalization into DU145 cells.
Anchorage-independent growth assay
DU145 and PC3 cells after sEV treatment were assayed for anchorage-independent growth. DU145 cells (300,000) were plated in 6-well plates and serum-starved for 5 h. After starvation, cells were treated overnight (16 h) in serum-free media with 109 sEVs isolated by iodixanol gradient from C4-2B β3 or C4-2B Mock. When LM609 or IgG was used, 109 sEVs isolated by iodixanol gradient were pre-treated with 5 μg/mL of LM609 mAb or IgG for 24 h at 4°C. Then, this mixture was added to the starved cells. The next day, new 6-well plates were coated with 0.8% agarose to create a bottom layer. Treated cells were trypsinized, and 10,000 cells from each well were resuspended in 2 mL of complete medium (DMEM containing 10% FBS, 100 μg/mL streptomycin, and 100 U/mL penicillin). The cell suspension was then mixed with 0.2 mL of 3% agarose and layered gently on top of the basement layer to seed cells in a final concentration of 0.3% soft agar matrix. After solidification, 0.5 mL of complete medium was added. Each experimental condition was repeated three times. After 3 weeks, the image of the entire well was captured using a Keyence BZ-x710 microscope at 40× magnification, and the average colony area of all detectable colonies was measured using Fiji ImageJ [26].
In vivo effects of sEVs
DU145 cells (2.5 × 10⁷) were treated for 16 h in serum-free media with 8 × 10¹⁰ αVβ3 sEVs or Mock sEVs isolated by iodixanol gradient. After incubation, the sEVs were removed by washing the cells two times with PBS. The cells were then maintained for 24 h in complete medium, and 2 × 10⁶ cells from each treatment group were subcutaneously injected into nine male nude mice (6 week-old, Taconic #NCRNU-M). Tumour growth was monitored twice a week for 74 days using a caliper, and the tumour volume calculated by the following formula:
Where H is height, W is width and L is length of the tumour. After 74 days, all mice were euthanized. The tumours collected were either lysed using RIPA buffer and analysed by IB or processed as blocks fixed in formalin and embedded in paraffin for immunohistochemistry. The care and handling of animals followed IACUC experimental protocols.
In vitro effects of sEVs on NE marker expression
DU145 and PC3 cells (300,000) were plated in 10 cm plates and serum starved for 5 h. After starvation, cells were treated overnight (16 h) in serum-free media with 109 sEVs isolated by iodixanol gradient from C4-2B β3 or C4-2B Mock cells. Then, this mixture was added to the starved cells. After the sEV treatment, the cells were washed with PBS and kept in complete medium. The cell pellets were lysed and stored at −80°C until IB analysis.
Human subject inclusion criteria
The bone metastasis specimens from prostate cancer patients (n = 8) were provided by the Thomas Jefferson University, Sidney Kimmel Cancer Center Biorepository, a College of American Pathologists (CAP) accredited biorepository. All specimens were de-identified and discarded in accordance with IRB-approved protocols.
Immunohistochemistry (IHC)
IHC was performed on tissue sections from tumours generated in nude mice subcutaneously injected with DU145 cells treated with equal numbers of sEVs isolated using iodixanol density gradients from C4-2B β3 or C4-2B Mock cells, or on human bone metastasis samples. Decalcification of the human bone metastasis was performed for 24–48 h at 4°C with 0.5 M EDTA in dH2O (Sigma) with a ratio of EDTA solution to tissue of 20:1. The tissue sections were baked at 60°C for 1 h, followed by deparaffinization with xylene (3 min × 2), rehydration with a graded alcohol series (100%, 90%, 70%, 50%, 30% for 3 min each) followed by deionized water (3 min × 2). The sections were incubated with 3% H2O2 solution for quenching endogenous peroxidase activity, followed by heat-induced antigen retrieval with citrate buffer (10 mM sodium citrate, 0.05% Tween 20, pH 6.0) at 95°C for 15 min. Sections were washed once with deionized water for 5 min, followed by PBS wash for 5 min, and blocked with 5% goat serum in PBST for 2 h. The tissue sections were incubated overnight at 4°C with an Ab β3 integrin (1:25), or Rabbit-IgG (RbIgG) as negative control. The following day, the tissue sections were washed with PBST (5 min × 2), followed by PBS (5 min), and incubated with secondary Ab (Biotinylated Goat Anti-Rabbit IgG, 10 μg/mL in PBST) for 30 min at room temperature. The unbound secondary Ab was washed with PBST (5 min × 2), followed by PBS (5 min). The tissue sections were incubated with streptavidin horseradish peroxidase (SAP, 5 μg/mL in PBS) for 30 min at room temperature. The unbound SAP was washed with PBST (5 min × 2), followed by PBS (5 min). The colour was developed by adding substrate chromogen, 3,3′-diaminobenzidine solution (DAB substrate kit). The DAB reaction was stopped by rinsing the tissue sections in deionized water. The sections were counterstained with Harris haematoxylin, dehydrated in a graded ethanol series (30%, 50%, 70%, 90%, 100% for 5 min each) followed by xylene (5 min × 2), dried, and finally mounted with Permount (Vector Laboratories). Synaptophysin staining was performed on an automated VENTANA Discovery XT staining instrument according to the manufacturer’s recommendations. Briefly, antigen retrieval was performed on the Roche Discovery ULTRA staining platform using Discovery CCI (Roche cat#950-500) for a total application time of 36 min. Primary immunostaining was performed using synaptophysin (SP11) (Roche cat#790-4407) at 36°C for 32 min. Secondary immunostaining used a horseradish peroxidase (HRP) multimer cocktail (Roche cat#760-500) and immune complexes were visualized using the ultraView Universal DAB Detection Kit (Roche, 760–500). Slides were then washed with a Tris-based reaction buffer (Roche cat#950-300) and counterstained with Haematoxylin II (Ventana cat #790-2208) for 4 min.
At least two members of the team reviewed each tumour section. The β3 Integrin staining quantification in Figure 5(c) was performed using the Fiji ImageJ “color deconvolution” tool. The DAB image intensity was measured, and the OD (Optical Density) calculated using the following formula:
Figure 5.

Tumour growth increase and induction of NE markers (AURKA, SYP, NSE) by αVβ3 sEVs in vivo. (a) αVβ3 sEV and Mock sEV-treated DU145 cells (2.5 × 10 7cells/10 × 1010 sEVs) were injected subcutaneously in nude mice; the xenografts were collected 74 days after injection. Time course of tumour growth was measured as tumour volume (left panel) or tumour weight (right panel) 74 days after cell injection, as described in the Material and Methods section. P-values are indicated in the figure. (b) Left panel, IB analysis for αVβ3, and NE markers: aurora kinase A (AURKA), synaptophysin (SYP), and neuron specific enolase (NSE) of the xenografts. Lanes 1–4 are representative tumour lysates from the Mock sEV treatment, whereas lanes 5–8 are tumour lysates from the αVβ3 sEV treatment group. Right panel, IB analysis of NE markers, AURKA and SYP, of the sEVs used to treat DU145 cells. All IB analysis was performed under reducing conditions. (c) Left panel, immunohistochemical analysis of αVβ3-positive areas (0.075 mm2) of the sEV-treated DU145 xenografts shown above. Right panels, representative images of the data quantified in the left panel; IgG was used as negative control. The bar represents 10 μm.
where max intensity is 255 for an 8-bit picture.
Data mining of publicly available dataset
The Neuroendocrine Prostate Cancer dataset [19] from the cBio Cancer Genomics Portal (https://www.cbioportal.org/) was used to obtain the mutation profile for the ITGB3, SYP, AURKA, ITGB6 and ITGAV genes. Only the samples corrected for “putative copy-number alterations adjusted by ploidy and purity with CLONET” were used to obtain genomic alterations in the studied genes.
Statistical Analysis
Colony areas were log10 transformed before data analysis to improve normality and homoscedasticity. ANOVA with post-hoc Tukey’s multiple comparisons were performed and adjusted P-values were reported for between groups’ comparisons. Means, standard errors, medians, and interquartile ranges were calculated, and Student’s t-test or Wilcoxon rank sum test was used for two-group comparative analyses for continuous outcomes. To determine if treatments induced significant differences in tumour growth in vivo, the velocities of tumour growth were compared between groups using a linear mixed-effects model with both random intercept and random slopes at mouse level. A likelihood ratio testing nested models (with versus without the interaction term of treatment with follow-up days) was used to examine if tumour growth slopes are overall significantly different between treatments. P < 0.05 was considered statistically significant.
Quantitative PCR with reverse transcription
Total RNA was extracted from sEVs using RNeasy® Mini Kit (Qiagen, 74,106) following the manufacturer’s instructions. The RNA thus obtained (270 ng) was reverse transcribed using random hexamers (50 pmol, Invitrogen 100,026,484) and the Super Script™ II Reverse Transcriptase (Invitrogen, 18064-022) kit following the manufacturer’s instructions. Finally, mRNA for ITGB3 (FW: ATT GGC CTT GCC GCC CTG CTC and RW: ATC ATT AAG TGC CCC GGT ACG) and GAPDH (FW: GGG AAG GTG AAG GTC GGA GT and RW: GTT CTC AGC CTT GAC GGT GC) were quantified by qPCR using PowerUP™ SYBR™ Green Master Mix (Applied biosystems, MAN0013511) as per the manufacturer’s instructions except that the number of cycles was increased from 40 to 50.
Results
Characterization of αVβ3-positive and αVβ3-negative sEVs from prostate cancer cells
We hypothesized that the expression of molecules in sEVs might affect the function of these vesicles. We focused our study on αVβ3, an integrin known to be present in sEVs [22,23,27], and we thus performed our analysis by comparing sEVs containing αVβ3 to sEVs that lack this integrin. We isolated sEVs from C4-2B CRPrCa cells that express αVβ3, using iodixanol density gradients to remove any possible debris resulting from the differential centrifugation method (Figure 1(a)). The fractions containing αVβ3 integrin, CD63, and CD81 were pooled and further characterized for other EV markers (Figure 1(b)). Immunoblotting (IB) analysis confirms the enrichment of the known EV markers TSG101, CD81, CD9 and ALIX in the isolated sEVs. Calnexin is used as negative control. The vesicles thus isolated also contain AR, but there is no difference in AR expression in the vesicles from C4-2B β3 or C4-2B Mock. Finally, nanoparticle tracking analysis (NTA) confirms that the vesicles isolated using this approach fall in the expected sEV size range of 100–150 nm (Figure 1(c)).
Figure 1.

Characterization of αVβ3 sEVs and Mock sEVs isolated by iodixanol density gradient. (a) αVβ3 sEVs and Mock sEVs were isolated by differential centrifugation and iodixanol density gradient from the culture medium of C4-2B β3 and C4-2B Mock cells. Then, the sEVs were analysed by IB for β3, and sEV markers CD63, CD81. IB analysis was performed under non-reducing conditions. Calnexin (CANX), which is supposed to be absent in sEVs, was also analysed. (b) Fractions 1–5 for αVβ3 sEVs, and 1–6 for Mock sEVs from the iodixanol density gradients shown in (a) were pooled and further characterized to confirm expression of Androgen Receptor (AR), β3, TSG101, CD81, CD9 (left panel); ALIX and calnexin (right panel). IB analysis was performed under reducing conditions. (a and b, TCL = total cell lysate). Different gels were used to separate samples under reducing or non-reducing conditions. (c) NTA analysis of the pooled fractions characterized in (b).
To confirm the presence of αVβ3 in the sEVs isolated using iodixanol density gradients, we used the ExoView assay (Figure 2). This assay allows us to both phenotype and digitally count various populations of the sEVs captured on a microarray-based chip using different Abs against CD63, CD81, CD9, CD41 (αIIb) and EpCAM. To determine the number of vesicles positive for αVβ3, the immunocaptured vesicles on the chip were labelled with a fluorescent Ab against αVβ3. Our results show that when an Ab against one of the tetraspanins, which form complexes with integrins, was used to capture the sEVs on the chip, a clear signal for αVβ3 integrin was observed. On the other hand, when Ab to CD41 (or the isotype control) was used to capture the vesicles, αVβ3 integrin was not detectable (Figure 2(a)). Moreover, we were able to detect αVβ3 when the EpCAM Ab was used for immunocapturing the sEVs, as previously reported by our group [5]. We validated our ExoView assay findings using vesicles from LNCaP αVβ3 cells (Figure 2(b)). Our results clearly show that αVβ3 integrin is in the sEVs and is not co-isolated with them during the isolation process.
Figure 2.

Digital detection of αVβ3 on sEVs using SP-IRIS (Single Particle Interferometric Reflectance Imaging Sensor). sEVs were isolated by differential centrifugation and iodixanol density gradient and analysed by SP-IRIS. (a) Left panel, C4-2B β3 sEVs captured on the chip by the Ab indicated on the x-axis were visualized using a fluorescent β3 integrin Ab labelled with CF555. The normalized number of particles is shown in the bar graph. Right panels, the αVβ3 integrin positive sEVs captured on the chip were visualized. Representative images of the sEVs captured on the chip are shown; the top right panel shows sEVs captured on the chip using CD81 Ab; the bottom right panel shows the sEVs captured on the chip by the isotype control. The bar represents 5 μm. (b) The normalized number of particles positive for αVβ3 integrin from LNCaP β3 sEVs is shown. (a-b) The number of particles was normalized as described in the Material and Methods section.
In parallel, we tested the ability of the sEVs to transfer αVβ3 into recipient cells. First, we isolated sEVs from C4-2B β3-GFP cells, which express a fluorescent GFP-tagged β3 integrin subunit, using iodixanol density gradients (Fig. S1A) as described above. NTA analysis of αVβ3-GFP sEVs exhibits a similar particle size range as αVβ3 sEVs (Fig. S1B). IB analysis confirmed the presence of αVβ3-GFP (approximately 125 kDa) in the C4-2B β3-GFP cells (Fig. S1B). The sEVs were then incubated with DU145, a widely used human prostate cancer cell line, for 16 h in serum-free conditions; after this period, the cells were fixed and observed using a confocal microscope (Figure 3). Under the conditions used in our experiment, about 20% of the cells were able to uptake either αVβ3-GFP sEVs or Mock-GFP sEVs. In these cells, confocal Z-stack analysis confirms the intracellular localization of the sEVs (Figure 3) as well as colocalization of αVβ3 (red signal) and GFP (green signal), thus indicating that αVβ3-GFP had been taken up by the cells (Figure 3 and S2).
Figure 3.

Uptake by DU145 cells of αVβ3 positive and negative sEVs isolated using iodixanol density gradients. Immunofluorescence analysis of αVβ3 transfer to DU145 cells. DU145 cells (150,000) incubated with 20 μg (corresponding to ~6 × 10¹⁰ particles) sEVs derived from C4-2B β3-GFP cells (left panel) or C4-2B Mock-GFP (right panel) were plated on vitronectin-coated coverslips. Arrows indicate GFP. The Z-stack analysis confirmed the intracellular colocalization of a red fluorescent signal (AP3, β3 Ab) and a green fluorescent signal corresponding to GFP, indicating the internalization of β3-GFP from sEVs. DAPI was used to detect cell nuclei (blue). The bar represents 10 μm. Seventy-eight cells were examined for each treatment group; 15–16 cells were positive for GFP in both treatments.
αVβ3 sEV treatment stimulates anchorage-independent growth in vitro
To assess the effects of αVβ3-positive sEVs on other cells, we treated 300,000 DU145 or PC3, another human prostate cancer cell line, cells with 109 αVβ3 sEVs or Mock sEVs from C4-2B cells for 16 h under serum-free conditions (Figure 4). After treatment, the cells were embedded in 0.3% agar and allowed to grow for 21 days. After this period, the colony size was measured. We observe that αVβ3 positive sEVs increase the colony size of DU145 or PC3 cells when compared to the control cells pre-treated with αVβ3-negative sEVs (Figure 4(a,b)). There was no significant difference in the number of colonies between the treatments used in this experiment (data not shown). These results indicate that αVβ3 sEVs can reprogram PrCa cell behaviour (by stimulating anchorage-independent growth) after a single treatment and that their effects persisted for at least 21 days (Figure 4(a)). Moreover, we pre-treated our sEVs (αVβ3 sEVs or Mock sEVs) with the Ab LM609 that binds specifically to αVβ3 [28] and has been reported to be inhibitory [29,30]. The pre-treatment of the sEVs with LM609 had no effects on the stimulation of anchorage-independent growth of DU145 and PC3 cells induced by the treatment with αVβ3 sEVs (Figure 4(a)), indicating that the uptake of sEVs is not mediated by αVβ3 on the vesicles. We conclude that the increased expression of αVβ3 in the donor cells (C4-2B) causes a change in the composition of the vesicles that stimulates anchorage-independent growth.
Figure 4.

Stimulation of anchorage-independent growth and induction of synaptophysin by αVβ3 sEVs in vitro. (a) Quantification of anchorage-independent growth expressed as log10 of the average colony area. sEVs (10,000 cells/3.3 × 106 sEVs) were incubated with LM609 Ab, mouse IgG or with PBS for 24 h and then, added to DU145 (left panel) or PC3 (right panel) cells for 16 h. The cells then were embedded in 0.3% agar-containing complete medium and were allowed to grow for 3 weeks. The average colony area was measured as described in the Materials and Methods section. Mock+609 and β3+609 indicate that the sEVs used to treat DU145 and PC3 cells were incubated with the monoclonal Ab LM609 against αVβ3 Integrin, as described in the Material and Method section. Mock+IgG and β3+IgG indicate that the sEVs used to treat DU145 and PC3 cells were incubated with mouse IgG used as negative control. The first 3 groups were incubated with PBS, Ab LM609 or mouse IgG without sEVs; the remaining groups were incubated with sEVs. (b) Representative images of the data quantified in (a). The bar represents 0.5 mm. (c) IB analysis of synaptophysin (SYP) expression in DU145, PC3, and LNCaP recipient cells after 16 hour treatment with either αVβ3 or Mock sEVs (16 h) and 21 days after treatment (21dd). LNCaP lysates were also tested for AR expression. Actin was used as loading control.
To confirm these findings, we performed an experiment in which DU145, PC3 and LNCaP cells were treated for 16 h with αVβ3 or Mock sEVs; the same cells/sEVs ratio was used throughout our experiments (300,000 cells/109 sEVs). Cells were lysed immediately after the treatment and at 21 days after the treatment. We observed that, when these three PrCa cell lines were treated with αVβ3 sEVs, the levels of SYP are increased. On the other hand, Mock sEV treatment do not induce an increase in this NE marker in any of the cell lines (Figure 4(c)). These results show that treatment with αVβ3 sEVs induces NED in PrCa cells. When analysed using IB, the AR is not transferred from the sEVs to the AR-negative cell lines DU145 or PC3 (data not shown), nor are the levels of AR increased in LNCaP cells (Figure 4(c)). However, AR is downregulated in LNCaP 21 days post-treatment with αVβ3 sEVs, and this decrease in AR levels correlates with SYP upregulation (Figure 4(c)). Moreover, the β3 integrin subunit is not detected in the recipient cells using IB analysis or through qPCR (data not shown). In conclusion, the sEVs from C4-2B cells that express high levels of αVβ3 integrin induce SYP expression and reduce the expression of AR in the recipient cells.
αVβ3 sEV treatment induces NED in DU145 cells in vivo
Based on these results, we tested the effects of αVβ3-positive sEVs in vivo using a mouse model of tumour growth. For this experiment, we pre-treated 2.5 × 10⁷ DU145 cells for 16 h with 8 × 10¹⁰ sEVs isolated by iodixanol gradient for each group (αVβ3 or Mock). The sEV-treated cells (2 × 10⁶) were subcutaneously injected into 6-week-old male nude mice, and the tumour growth was monitored twice a week for approximately 10 weeks. When the injected cells had been treated with αVβ3 sEVs, the tumour volumes were significantly larger from 36 to 74 days than the tumour volumes from the Mock control treatment group (Figure 5(a), left panel). The mice were sacrificed 74 days after the subcutaneous injection, and the tumours were harvested. When the tumour weight was measured, the αVβ3 sEV treatment group had significantly heavier tumours compared to the Mock sEV control group (Figure 5(a), right panel). IB analysis of the xenograft lysates from the αVβ3 sEV treatment group reveals a significant increase in the typical NE markers such as AURKA, SYP and NSE, compared to the Mock control group (Figure 5(b)). Remarkably, sEVs do not contain the NE markers detected in the xenografts (Figure 5(b), right panel). Proteomic analysis of PC3 sEVs also confirms the absence of NE markers (data not shown) [27]. IB analysis reveals an increase in αVβ3 when the injected cells were treated with αVβ3 sEVs (Figure 5(b) and 5(c), left panels), and IHC analysis shows that αVβ3 is localized in the blood vessels of the xenografts (Figure 5(c), right panel).
Bioinformatic analysis of a public dataset on cBioPortal [19] reveals amplification of β3 integrin (ITGB3), AURKA and SYP genes in at least 30% of NEPrCa patients. In contrast, (ITGAV) or β6 (ITGB6) integrin subunits were only amplified in 7% and 3%, respectively (Figure 6(a)), indicating that amplification of ITGB3, AURKA, and SYP genes may occur in a subset of NEPrCa patients. Given previous reports that metastatic lesions express αVβ3 [7,31,32], we analysed metastatic bone samples from PrCa patients using IHC staining. We analysed 10 samples from eight different patients. When stained for αVβ3 integrin, seven samples resulted in positive signals. Of the seven αVβ3-positive samples, five were also positive for SYP. Moreover, the three remaining samples that were negative for β3 integrin were also negative for SYP.
Figure 6.

Upregulation of αVβ3 integrin in NEPrCa patients. (a) Bioinformatic analysis of public datasets. cBioPortal OncoPrint graphic [33,34] showing the genomic alterations in ITGB3, AURKA, SYP, ITGAV and ITGB6 genes across the NEPrCa dataset containing 44 NEPrCa patient samples [19]. Glyphs and colour coding are used to summarize genomic alterations such as amplification (red). Grey colour coding indicates no alterations. Benign tissues and blood samples were used as controls. (b) Representative image of the immunohistochemical analysis for SYP and αVβ3 in PrCa bone (stern) metastasis. A total of 10 specimens from eight patients were analysed. IgG was used as negative control. The bar represents 10 μm.
The αVβ3 integrin and SYP positive cells appeared clustered and this made the quantitative comparison difficult; however, in the positive cluster of tumour cells, the staining was strong in >90% of the tumour cells.
Our results demonstrate co-expression of αVβ3 and SYP in the metastatic bone lesions (Figure 6(b)). In conclusion, our database analysis and IHC staining of human samples indicate an upregulation of αVβ3 in NE patients in agreement with our findings that αVβ3 sEV treatment induces NE in vitro and in vivo.
Finally, our group has previously reported increased levels of αVβ3 integrin in the sEVs isolated from the plasma of TRAMP mice [22], which develop progressive forms of PrCa including NE cancer and metastasis at distant sites. We confirm those findings here using differential centrifugations to isolate sEVs from the plasma of TRAMP mice as described in the Material and Methods section (Figure S3). These sEVs did not contain CANX (data not shown). These findings confirm an upregulation of circulating vesicular αVβ3 in the plasma of TRAMP mice.
Discussion
Our results confirm that the expression of a single integrin subtype, αVβ3, in sEVs affects the function of these vesicles upon their uptake in recipient cells. Specifically, we demonstrate in this study, for the first time, that a single treatment with sEVs, isolated from PrCa cells using iodixanol density gradients, significantly stimulates tumour growth, and induces NED in recipient cells both in vivo and in vitro. Our schematic diagram in Figure 7 summarizes these findings.
Figure 7.
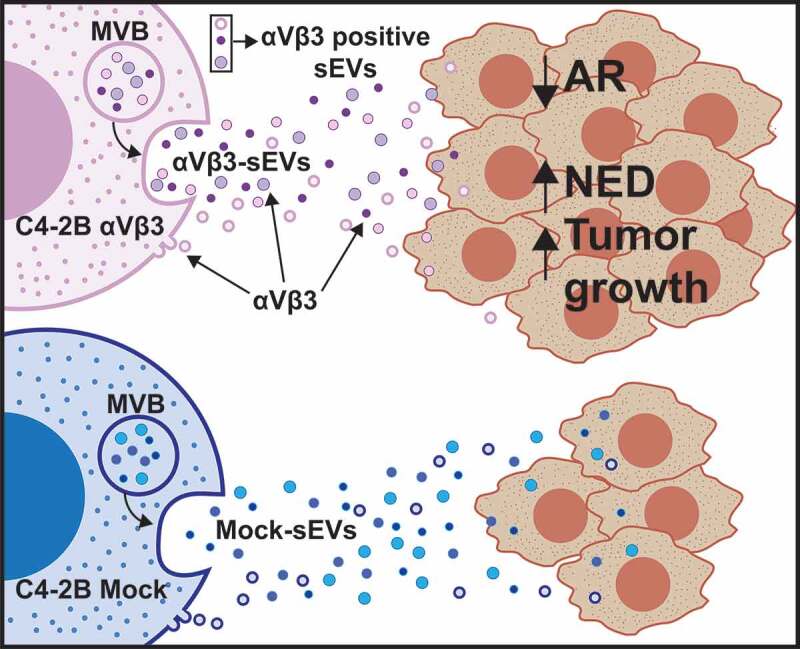
Schematic representation of the findings described in this study. The schematic diagram shows that the transfer of sEVs from prostate cancer cells (C4-2B) expressing αVβ3 induces NED in the recipient cells (DU145, PC3, or LNCaP), whereas transfer of Mock sEVs does not. The sEVs used in this study may have multiple origins (e.g., Multi Vesicular Body, MVB, or membrane budding).
We also demonstrate that this pathway is mediated by the αVβ3 integrin expressed in the donor cells (C4-2B) since this molecule is the only difference between αVβ3-positive sEVs and Mock αVβ3-negative sEVs. The upregulation of αVβ3 in the donor cells (C4-2B in this study) may alter the cargo composition of the sEVs released by the cells and enable them to induce NED in the recipient cells. Previous examples of modulation of sEV cargo by a drug or a single molecule have been reported [35–37]. A recent publication [35] has also shown that enzalutamide treatment of LNCaP cells stably expressing AR induce changes in the sEV composition by increasing the levels of BRN2 and BRN4 mRNA. Another study [36] has shown that the upregulation of the tetraspanin Tspan8 in a breast cancer rat model changes sEV composition by upregulation of E-cadherin and p120-catenin in circulating rat plasma vesicles. Finally, RNA sequencing and proteomic analysis of sEVs isolated from melanoma cells upon down-regulation of the insulin-like growth factor 2 mRNA-binding protein 1 (IGF2BP1) reveal differential expression of several mRNAs, proteins and miRNAs [37]. We confirmed the presence of αVβ3 integrin in the sEVs through sEV immunocapturing on a chip using Abs against CD81, CD63, and CD9 and labelling the captured sEVs with a fluorescent Ab against αVβ3 (Figure 2(a)). However, this integrin does not appear to mediate sEV uptake in recipient cells since, when we pre-treated the sEVs with an inhibitory Ab against αVβ3 integrin (LM609), anchorage-independent growth of recipient cells was not affected (Figure 4(a)). Whether one, or more, of the many pathways activated by αVβ3 is responsible for the different cargo of the sEVs released by C4-2B β3 and Mock cells remains to be established. For example, it has been recently reported that the sole expression of αVβ3 is associated with activation of the KRAS–RalB–NF-κB pathway, indicating a role of αVβ3 in tumour stemness and drug resistance [38]. Based on our findings, we speculate that a pro-NE component is differentially packaged into the sEVs when αVβ3 is expressed in the donor cells.
Studies from our group and others have shown dysregulation of the αVβ3 integrin in PrCa [13,14], and that αVβ3 integrin in the tumour promotes angiogenesis [29], cell migration [22,31], cell invasion [39], and in general its expression correlates with low patient survival [40]. However, its role in NEPrCa has not been characterized. Based on the findings from our study, it is reasonable to assume that sEVs released from cancer cells that express αVβ3 integrin stimulate the surrounding cells to differentiate into a more aggressive phenotype with NE characteristics. It should be pointed out that while the expression of αVβ3 integrin is required to generate pro-NE sEVs, αVβ3 is not detected in the lysates of the PrCa cells that overexpress NE markers, indicating that permanent expression of αVβ3 is not required for the recipient cells to develop NED (Figure 4(c)). Furthermore, αVβ3 sEVs do not contain NE markers (Figure 5(b), right panel), indicating that the NE markers detected in recipient cells are induced, and not transferred, by the αVβ3 sEVs.
It is still unclear how NED is induced in PrCa cells. The ability to induce NE in PrCa using αVβ3 sEVs will open new possibilities to study the mechanism of NED in PrCa. A dominant NE marker, the serine/threonine kinase AURKA, has been well studied, and its ability to promote mitotic entry and cytokinesis has generated interest in developing AURKA inhibitors as therapeutic targets in prostate and breast cancers [41]. Indeed, the AURKA gene is amplified in these cancers, as is also shown in our analysis of NEPrCa. Furthermore, its transgenic overexpression in mouse mammary epithelium induces tetraploidy and centrosome amplification leading to breast cancer development. It is known that overexpression of AURKA in benign prostate cells induces SYP and NSE, NE-specific markers, indicating a role of AURKA in modulating NED [42]. AURKA also stabilizes the transcription factor N-MYC, one of the transcription factors important in AR-independent CR NEPrCa (Rb1, p53, N-MYC), by preventing its proteasomal degradation, and thus promoting G1-S progression [43,44]. Regulation of AURKA by sEVs or by integrins has never been shown, although many studies have described the mechanisms underlying integrin regulation of cell cycle progression [45]. Specifically, αVβ3 activation of cell cycle progression, as well as tumorigenesis, has been shown [46], and we thus envision activation of aberrant cell division upon αVβ3 sEV transfer to recipient cells (Figure 7, schematic diagram).
Our analysis of the publicly-available database and IHC staining of human samples confirms a positive association between β3 integrin subunit and NED in patients (Figure 6); this analysis reveals gene amplification of β3 integrin subunit, SYP, and AURKA in about 30% of NEPrCa patients, suggesting that αVβ3 integrin is involved in NED. It is possible that the cells from the metastatic lesions that overexpress αVβ3 (Figure 6(b)) release αVβ3 positive sEVs (similar to those characterized in this study) that in turn induce NED in the primary tumour. Although we are not implying that sEVs mediate genomic events, EV mediated transfer represents another way for these molecular markers to be co-expressed. Because treatment with αVβ3 sEVs increases NED in the recipient cells, and our previous study showed an increase in αVβ3 EVs isolated from blood plasma of patients affected by PrCa [5], a therapeutic approach that targets αVβ3 might be an effective strategy against NEPrCa [47]. Moreover, αVβ3-positive sEVs might serve as a suitable biomarker to predict NED in PrCa patients.
Another implication of our study is that sEVs containing αVβ3 might be used to target the tumour microenvironment enriched in αVβ3 ligands. Our study adds value to recent research, which has demonstrated that increased levels of αVβ3 and its ligands can be used to target cancer cells. In one study, Ross et al. were able to inhibit tumour growth in αVβ3-positive bone metastasis from breast cancer by using nanoparticles (~12.5 nm) coated with a specific αVβ3 ligand and loaded with a microtubule inhibitor [48]. Moreover, they were able to detect the induction of αVβ3 integrin in the metastatic lesions. In another study, Tian et al. were able to confer organ specificity to sEVs by inducing the expression of lysosome-associated membrane glycoprotein 2b (Lamp2b) fused with an iRGD peptide [49], a well-known ligand for αVβ3 [50], as previosly described by Sugahara et al. [51]. In Tian et al. study, the investigators were able to specifically deliver doxorubicin into breast cancer cells, which resulted in a significant inhibition of tumour growth, by using circulating Lamp2b-iRGD sEVs [49].
Androgen deprivation therapy is currently the standard-of-care treatment for PrCa; however, once the cancer acquires castrate resistance, it invariably becomes lethal. It is still not clear how AR regulates NED. Previous studies have shown that NED is frequently associated with AR deprivation [42,52], although one study reported AR amplification in therapy-resistant CRPrCa [53]. In our studies here, αVβ3 sEV treatment causes downregulation of AR in LNCaP cells in association with increased SYP expression, indicating that under the conditions used in our experiments, AR depletion may be necessary for NED to be induced. Further study of the involvement of AR in NED is necessary, especially in view of our evidence showing that sEVs may modulate AR levels in recipient cells.
In conclusion, here we show that the expression of a single molecule in the donor cells affects the function of secreted sEVs. The novelty of these findings lies in our evidence that αVβ3 sEVs reprogram PrCa cells towards a NE phenotype, thus demonstrating that released sEVs regulate a critical step in PrCa progression.
Supplementary Material
Acknowledgments
The authors would like to thank Dr Michael Root for access to the refractometer, Dr Lorraine Iacovitti and Dr Eric Kostuk for the use of the Keyence BZ-x710 microscope. Dr Beatrice Knudsen for her expert advice on the xenograft histology and Dr Matthew Schiewer for the useful discussion on AR.
We would also like to thank Dr James Keen and Yolanda Covarrubias of the Sidney Kimmel Cancer Center (SKCC) Bioimaging Facility at Thomas Jefferson University for support with confocal imaging; Dr Jianke Zhang and Amir Yarmahmoodi of SKCC Flow Cytometry Facility at Thomas Jefferson University for technical support with NTA; Dr Mark Fortini, Pamela Walter and Jennifer Wilson at Thomas Jefferson University for editing comments; Veronica Robles for administrative assistance with the preparation of the manuscript. We would like to thank Raymond O’Neill for the IHC staining for SYP. We would also like to thank Dr Haifeng Yang and Danielle Wentworth of the Thomas Jefferson University – Sidney Kimmel Cancer Center Biorepository, a College of American Pathologists (CAP)-accredited biorepository for providing the human specimens used in this study as well as Wei Jiang and Zhijiu Zhong, Translational Research/Pathology Facility at Thomas Jefferson University for technical support with immunohistochemistry experiments.
Author contributions
FQ and LRL conceptualized the study and designed experiments. FQ performed the experiments. SRK assisted in performing an experiment and reviewed the manuscript. SS assisted in performing experiments. GD performed the SP-IRIS experiments shown in Figure 2 and analysed the results. QL performed the statistical analysis. FQ and LRL analysed all the results. RP, GK and JDD and PF performed the gene amplification analysis (Figure 6(a, b)). PMC reviewed the pathological features of the specimens used, analysed the immunohistochemical data and provided insights regarding the results and conclusions of the study. WKK performed the clinical evaluation of the human specimens used in this study and provided insights regarding the results and conclusions of the study. HB provided insights with respect to the NE gene analysis and on the results and conclusions of the paper. FQ and LRL wrote the manuscript.
Disclosure statement
No potential conflict of interest was reported by the author(s). George Daaboul is CSO and co-founder of NanoView Bioscience.
References
- [1].Thery C, Witwer KW, Aikawa E, et al Minimal information for studies of extracellular vesicles 2018 (MISEV2018): a position statement of the international society for extracellular vesicles and update of the MISEV2014 guidelines. J Extracell Vesicles. 2018;7:1535750. [DOI] [PMC free article] [PubMed] [Google Scholar]
- [2].Thery C, Amigorena S, Raposo G, et al. Isolation and characterization of exosomes from cell culture supernatants and biological fluids. Curr Protoc Cell Biol. 2006;30:3.22.1–3.22.29 by John Wiley & Sons, Inc. [DOI] [PubMed] [Google Scholar]
- [3].Sansone P, Savini C, Kurelac I , et al. Packaging and transfer of mitochondrial DNA via exosomes regulate escape from dormancy in hormonal therapy-resistant breast cancer. Proc Natl Acad Sci U S A. 2017;114: E9066–E9075. [DOI] [PMC free article] [PubMed] [Google Scholar]
- [4].Hoshino A, Costa-Silva B, Shen TL, et al Tumour exosome integrins determine organotropic metastasis. Nature. 2015;527:329–16. [DOI] [PMC free article] [PubMed] [Google Scholar]
- [5].Krishn SR, Singh A, Bowler N, et al Prostate cancer sheds the αvβ3 integrin in vivo through exosomes. Matrix Biol. 2019;77:41–57. [DOI] [PMC free article] [PubMed] [Google Scholar]
- [6].Hamidi H, Ivaska J.. Every step of the way: integrins in cancer progression and metastasis. Nat Rev Cancer. 2018;18:533–548. [DOI] [PMC free article] [PubMed] [Google Scholar]
- [7].Desgrosellier JS, Cheresh DA. Integrins in cancer: biological implications and therapeutic opportunities. Nat Rev Cancer. 2010;10:9–22. [DOI] [PMC free article] [PubMed] [Google Scholar]
- [8].Drivalos A, Chrisofos M, Efstathiou E, et al Expression of α5-integrin, α7-integrin, E-cadherin, and N-cadherin in localized prostate cancer. Urol Oncol. 2016;165(34):e11–18. [DOI] [PubMed] [Google Scholar]
- [9].Goel HL, Li J, Kogan S, et al. Integrins in prostate cancer progression. Endocr Relat Cancer. 2008;15:657–664. [DOI] [PMC free article] [PubMed] [Google Scholar]
- [10].Fornaro M, Manes T, Languino LR. Integrins and prostate cancer metastases. Cancer Metastasis Rev. 2001;20:321–331. [DOI] [PubMed] [Google Scholar]
- [11].Lu H, Wang T, Li J, et al ανβ6 Integrin Promotes Castrate-Resistant Prostate Cancer Through JNK1-Mediated Activation of Androgen Receptor. Cancer Res. 2016;1:5163–5174. [DOI] [PMC free article] [PubMed] [Google Scholar]
- [12].Cress AE, Rabinovitz I, Zhu W, et al. The α6β1 and α6β4 integrins in human prostate cancer progression. Cancer Metastasis Rev. 1995;14:219–228. [DOI] [PubMed] [Google Scholar]
- [13].Zheng DQ, Woodard AS, Fornaro M, et al. Prostatic carcinoma cell migration via alpha(v)beta3 integrin is modulated by a focal adhesion kinase pathway. Cancer Res. 1999;59:1655–1664. [PubMed] [Google Scholar]
- [14].Stucci S, Tucci M, Passarelli A, et al. Avbeta3 integrin: pathogenetic role in osteotropic tumors. Crit Rev Oncol Hematol. 2015;96:183–193. [DOI] [PubMed] [Google Scholar]
- [15].Jin H, Varner J. Integrins: roles in cancer development and as treatment targets. Br J Cancer. 2004;90:561–565. [DOI] [PMC free article] [PubMed] [Google Scholar]
- [16].Mulgrew K, Kinneer K, Yao XT, et al Direct targeting of alphavbeta3 integrin on tumor cells with a monoclonal antibody, Abegrin. Mol Cancer Ther. 2006;5:3122–3129. [DOI] [PubMed] [Google Scholar]
- [17].Vlachostergios PJ, Puca L, Beltran H. Emerging Variants of Castration-Resistant Prostate Cancer. Curr Oncol Rep. 2017;19:32. [DOI] [PMC free article] [PubMed] [Google Scholar]
- [18].Wang W, Epstein JI. Small cell carcinoma of the prostate. A morphologic and immunohistochemical study of 95 cases. Am J Surg Pathol. 2008;32:65–71. [DOI] [PubMed] [Google Scholar]
- [19].Beltran H, Prandi D, Mosquera JM, et al Divergent clonal evolution of castration-resistant neuroendocrine prostate cancer. Nat Med. 2016;22:298–305. [DOI] [PMC free article] [PubMed] [Google Scholar]
- [20].Otto T, Horn S, Brockmann M, et al Stabilization of N-Myc is a critical function of Aurora A in human neuroblastoma. Cancer Cell. 2009;15:67–78. [DOI] [PubMed] [Google Scholar]
- [21].Palmgren JS, Karavadia SS, Wakefield MR. Unusual and underappreciated: small cell carcinoma of the prostate. Semin Oncol. 2007;34:22–29. [DOI] [PubMed] [Google Scholar]
- [22].Singh A, Fedele C, Lu H, et al. Exosome-mediated Transfer of alphavbeta3 Integrin from Tumorigenic to Nontumorigenic Cells Promotes a Migratory Phenotype. Mol Cancer Res. 2016;14:1136–1146. [DOI] [PMC free article] [PubMed] [Google Scholar]
- [23].Fedele C, Singh A, Zerlanko BJ, et al. The alphavbeta6 integrin is transferred intercellularly via exosomes. J Biol Chem. 2015;290:4545–4551. [DOI] [PMC free article] [PubMed] [Google Scholar]
- [24].Lobb RJ, Becker M, Wen SW, et al Optimized exosome isolation protocol for cell culture supernatant and human plasma. J Extracell Vesicles. 2015;4:27031. [DOI] [PMC free article] [PubMed] [Google Scholar]
- [25].Daaboul GG, Gagni P, Benussi L, et al Digital Detection of Exosomes by Interferometric Imaging. Sci Rep. 2016;6:37246. [DOI] [PMC free article] [PubMed] [Google Scholar]
- [26].Schindelin J, Arganda-Carreras I, Frise E, et al Fiji: an open-source platform for biological-image analysis. Nat Methods. 2012;9:676. [DOI] [PMC free article] [PubMed] [Google Scholar]
- [27].Lu H, Bowler N, Harshyne LA, et al Exosomal alphavbeta6 integrin is required for monocyte M2 polarization in prostate cancer. Matrix Biol. 2018;70:20–35. [DOI] [PMC free article] [PubMed] [Google Scholar]
- [28].Cheresh DA. Human endothelial cells synthesize and express an Arg-Gly-Asp-directed adhesion receptor involved in attachment to fibrinogen and von Willebrand factor. Proc Natl Acad Sci USA. 1987;84:6471–6475. [DOI] [PMC free article] [PubMed] [Google Scholar]
- [29].Brooks PC, Clark RA, Cheresh DA. Requirement of vascular integrin alpha v beta 3 for angiogenesis. Science. 1994;264:569–571. [DOI] [PubMed] [Google Scholar]
- [30].Brooks PC, Montgomery AM, Rosenfeld M, et al Integrin alpha v beta 3 antagonists promote tumor regression by inducing apoptosis of angiogenic blood vessels. Cell. 1994;79:1157–1164. [DOI] [PubMed] [Google Scholar]
- [31].McCabe NP, De S, Vasanji A, et al. Prostate cancer specific integrin alphavbeta3 modulates bone metastatic growth and tissue remodeling. Oncogene. 2007;26:6238–6243. [DOI] [PMC free article] [PubMed] [Google Scholar]
- [32].Cooper CR, Chay CH, Pienta KJ. The role of αvβ3 in prostate cancer progression. Neoplasia. 2002;4:191–194. [DOI] [PMC free article] [PubMed] [Google Scholar]
- [33].Gao J, Aksoy BA, Dogrusoz U, et al Integrative analysis of complex cancer genomics and clinical profiles using the cBioPortal. Sci Signal. 2013;6:pl1. [DOI] [PMC free article] [PubMed] [Google Scholar]
- [34].Cerami E, Gao J, Dogrusoz U, et al The cBio cancer genomics portal: an open platform for exploring multidimensional cancer genomics data. Cancer Discov. 2012;2:401–404. [DOI] [PMC free article] [PubMed] [Google Scholar]
- [35].Bhagirath D, Yang TL, Tabatabai ZL, et al BRN4 Is a Novel Driver of Neuroendocrine Differentiation in Castration-Resistant Prostate Cancer and Is Selectively Released in Extracellular Vesicles with BRN2. Clin Cancer Res. 2019;25:6532–6545. [DOI] [PMC free article] [PubMed] [Google Scholar]
- [36].Voglstaetter M, Thomsen AR, Nouvel J, et al Tspan8 is expressed in breast cancer and regulates E-cadherin/catenin signalling and metastasis accompanied by increased circulating extracellular vesicles. J Pathol. 2019;248:421–437. [DOI] [PMC free article] [PubMed] [Google Scholar]
- [37].Ghoshal A, Rodrigues LC, Gowda CP, et al Extracellular vesicle-dependent effect of RNA-binding protein IGF2BP1 on melanoma metastasis. Oncogene. 2019;38:4182–4196. [DOI] [PMC free article] [PubMed] [Google Scholar]
- [38].Seguin L, Kato S, Franovic A, et al An integrin beta(3)-KRAS-RalB complex drives tumour stemness and resistance to EGFR inhibition. Nat Cell Biol. 2014;16:457–468. [DOI] [PMC free article] [PubMed] [Google Scholar]
- [39].Gladson CL, Cheresh DA. Glioblastoma expression of vitronectin and the alpha v beta 3 integrin. Adhesion mechanism for transformed glial cells. J Clin Invest. 1991;88:1924–1932. [DOI] [PMC free article] [PubMed] [Google Scholar]
- [40].Montgomery AM, Reisfeld RA, Cheresh DA. Integrin alpha v beta 3 rescues melanoma cells from apoptosis in three-dimensional dermal collagen. Proc Natl Acad Sci USA. 1994;91:8856–8860. [DOI] [PMC free article] [PubMed] [Google Scholar]
- [41].Otto T, Sicinski P. Cell cycle proteins as promising targets in cancer therapy. Nat Rev Cancer. 2017;17:93–115. [DOI] [PMC free article] [PubMed] [Google Scholar]
- [42].Beltran H, Rickman DS, Park K, et al Molecular characterization of neuroendocrine prostate cancer and identification of new drug targets. Cancer Discov. 2011;1:487–495. [DOI] [PMC free article] [PubMed] [Google Scholar]
- [43].Chen H, Liu H , Qing G, Targeting oncogenic Myc as a strategy for cancer treatment. Signal Transduct Target Ther. 2018:3:5. [DOI] [PMC free article] [PubMed] [Google Scholar]
- [44].Labbé DP, Brown M. Transcriptional Regulation in cancer Prostate Cold Spring Harb. Perspect. Med. 2018:8: pii:a030437. doi: 10.1101/cshperspect.a030437 [DOI] [PMC free article] [PubMed] [Google Scholar]
- [45].Walker JL, Assoian RK. Integrin-dependent signal transduction regulating cyclin D1 expression and G1 phase cell cycle progression. Cancer Metastasis Rev. 2005;24:383–393. [DOI] [PubMed] [Google Scholar]
- [46].Moreno-Layseca P, Streuli CH. Signalling pathways linking integrins with cell cycle progression. Matrix Biol. 2014;34:144–153. [DOI] [PubMed] [Google Scholar]
- [47].Oxboel J, Binderup T, Knigge U, et al. Quantitative gene-expression of the tumor angiogenesis markers vascular endothelial growth factor, integrin alphaV and integrin beta3 in human neuroendocrine tumors. Oncol Rep. 2009;21:769–775. [PubMed] [Google Scholar]
- [48].Ross MH, Esser AK, Fox GC, et al Bone-induced expression of integrin β3 enables targeted nanotherapy of breast cancer metastases. Cancer Res. 2017;77:6299–6312. [DOI] [PMC free article] [PubMed] [Google Scholar]
- [49].Tian Y, Li S, Song J, et al A doxorubicin delivery platform using engineered natural membrane vesicle exosomes for targeted tumor therapy. Biomaterials. 2014;35:2383–2390. [DOI] [PubMed] [Google Scholar]
- [50].Sutherland M, Gordon A, Shnyder SD, et al. RGD-Binding Integrins in Prostate Cancer: expression Patterns and Therapeutic Prospects against Bone Metastasis. Cancers (Basel). 2012;4:1106–1146. [DOI] [PMC free article] [PubMed] [Google Scholar]
- [51].Sugahara KN, Teesalu T, Karmali PP, et al. Tissue-penetrating delivery of compounds and nanoparticles into tumors. Cancer Cell. 2009;16:510–520. [DOI] [PMC free article] [PubMed] [Google Scholar]
- [52].Guo H, Ci X, Ahmed M, et al ONECUT2 is a driver of neuroendocrine prostate cancer. Nat Commun. 2019;10:278. [DOI] [PMC free article] [PubMed] [Google Scholar]
- [53].Aggarwal R, Huang J, Alumkal JJ, et al. Clinical and genomic characterization of treatment-emergent small-cell neuroendocrine prostate cancer: A multi-institutional prospective study. J Clin Oncol. 2018;36:2492–2503. [DOI] [PMC free article] [PubMed] [Google Scholar]
Associated Data
This section collects any data citations, data availability statements, or supplementary materials included in this article.