

Abstract
The dopamine transporter (DAT) operates via facilitated diffusion, harnessing an inward Na+ gradient to drive dopamine from the extracellular synaptic cleft to the neuron interior. The DAT is relevant to central nervous system disorders such as Parkinson disease and attention-deficit hyperactivity disorder and is the primary site of action for the abused psychostimulants cocaine and amphetamines. Crystallization of a DAT homolog, the bacterial leucine transporter LeuT, provided the first reliable 3-D DAT template. Here, the LeuT crystal structure and the DAT molecular model have been combined with their respective substrates, leucine and dopamine, in lipid bilayer molecular dynamics simulations toward tracking substrate movement along the protein’s substrate/ion permeation pathway. Specifically, movement of residue pairs that comprise the “external gate” was followed as a function of substrate presence. The transmembrane (TM) 1 arginine-TM 10 aspartate strut formed less readily in DAT compared with LeuT, with or without substrate present. For LeuT but not DAT, the addition of substrate enhanced the chances of forming the TM 1–10 bridge. Also, movement of the fourth extracellular loop EL-4 in the presence of substrate was more pronounced for DAT, the EL-4 unwinding to a degree. The overall similarity between the LeuT and DAT molecular dynamics simulations indicated that LeuT was a legitimate model to guide DAT structure-function predictions. There were, nevertheless, differences significant enough to allow for DAT-unique insights, which may include how cocaine, methylphenidate (Ritalin, NIDA Drug Supply, Rockville, MD), and other DAT blockers are not recognized as substrates even though they can access the primary substrate binding pocket.
Keywords: bacterial transporter, channel, central nervous system, neurotransmitter, homology model, psychostimulant, molecular dynamics
INTRODUCTION
Neurotransmitter transporter proteins play a crucial role in governing temporal aspects of interneuron communication by regulating synaptic neurotransmitter levels. These integral plasma membrane proteins are conduits for relocating the neurotransmitter from synapse to presynaptic cell, quenching the message sent by this cell. The monoamine transporters (MATs) are of especial relevance regarding diseases of the central nervous system. Dopamine transporter (DAT) dysfunction has been associated with Parkinson’s disease, schizophrenia, and attention-deficit hyperactivity disorder.1 Dysfunction of the serotonin transporter (SERT) may be linked to alcoholism,2 Parkinson’s disease,3 and depression.4 Norepinephrine transporters (NETs) have been reported to be deficient in cases of affective and autonomic disorders.5 Additionally, all three transporters are substrates for amphetamines, drugs of abuse that trigger the release of monoamines from storage vesicles into the synapse.6,7 The psychostimulant cocaine is a nonsubstrate MAT blocker, allowing dopamine to pool in the synapses of the nucleus accumbens, the brain’s “pleasure center.”8 MATs are also therapeutic targets for antidepressant and anxiolytic drugs as well as medications to combat attention-deficit hyperactivity disorder.9
The plasma membrane MATs are members of the 12 transmembrane domain (TM) neurotransmitter:sodium symporter (NSS), or SLC6, family in which electrogenic transport of a neurotransmitter substrate across the cell membrane is driven by the naturally occurring neuronal Na+ gradient. Cotransport of Cl− is also required for the DAT, NET, and SERT; the SERT additionally transports a K+ ion but in an antiport fashion.10 Prior to 2005, most of what was known about MAT structure and function was provided by pharmacologic characterization of hundreds of site-directed and chimeric mutants (reviewed by Surratt et al.9). The mutagenesis was, in turn, guided by amino acid sequence alignments of NSS/SLC6 family members.11 Still, three-dimensional information on MAT structure was essentially limited to the innovative Zn2+-engineered DAT studies of Gether and colleagues that revealed juxtapositions of selected TM domains.12
Publication of a crystal structure for a NSS/SLC6 homolog, the bacterial leucine transporter LeuT,13 provided the first reasonable template for 3-D MAT analysis. LeuT was crystallized as a dimer, but the monomer is likely to fully encompass the transport function.14 Like the MATs, LeuT appears to transport two Na+ ions for every substrate molecule; unlike the MATs, LeuT has no Cl− requirement. A TM 7 glutamate residue in LeuT (replaced by serine in the MATs) plays the role of the MAT Cl− cofactor, providing the negative charge that stabilizes Na+ binding and translocation of substrate.15–17 The LeuT crystal contained a molecule of its leucine substrate tethered midway through the TM domains spanning the lipid bilayer. Docking of substrate to SERT and DAT molecular models using LeuT as a template also places the monoamine at this TM midpoint,18–22 considered the primary substrate binding pocket. A secondary (or tertiary) substrate pocket that appears to serve as a staging area for access to the primary pocket is located in the “extracellular vestibule,” several Angstroms above the primary pocket.22,23 For LeuT, this vestibule can be closed off from the primary binding pocket by an external gate comprised of a TM 1 arginine–TM 10 aspartate salt bridge and a TM 3 tyrosine–TM 8 phenylalanine aromatic interaction.13 When the gate is open, a low-affinity substrate binding site is formed by leucine itself bridging the arginine-aspartate interaction.24
Regarding nonsubstrate inhibitor binding sites, antidepressant and cocaine binding pockets have been proposed that thoroughly overlap, partially overlap, or are extracellular to the substrate pocket.19–21,25,26 LeuT crystals containing tricyclic antidepressant drugs position the inhibitor in the extracellular vestibule,27,28 although the relevance of these crystals to MAT inhibitor function has been questioned.29 By introducing DAT mutations that created intramolecular disulfide bonds or a Zn2+ binding site, cocaine and a cocaine-like analog were trapped in the primary substrate pocket; this was the first compelling structural evidence that inhibitors could access this site.26 Finally, Singh et al.24 proposed a “locked-occluded” conformation for LeuT through the binding of a noncompetitive inhibitor. The noncompetitive inhibitor binding pocket is near the extracellular vestibule.24
Comparative molecular dynamics (MD) simulations of the crystallized LeuT transporter and the homologous DAT transporter were performed in a lipid bilayer facsimile to gain insight into the overall dynamics of the proteins in a physiologically relevant environment. To assess the dynamics of the primary substrate-binding pocket and other key segments thought to have pharmacologic or physiologic relevance, and to determine the DAT homology model’s stability and reliability through the course of MD simulation, MD simulations both with and without substrate were conducted for both LeuT and DAT. MD LeuT simulations in the presence of leucine but lacking the more proximal sodium ion were also conducted to address the role of this ion in substrate binding and translocation.
METHODS
Creation and merging of transporter protein and lipid bilayer molecular models
LeuT structure
LeuT structure coordinates were obtained from Protein Data Bank entry 2A65 (www.rcsb.org; MMDB accession no. 34395), corresponding to the bacterial (Aquifex aeolicus) leucine transporter protein LeuTAa. This Protein Data Bank entry lacks the four most N- and C-terminal residues plus N133 and A134. Because the latter two residues are expected to be relevant to TM domain disposition, these residues were reintroduced using the model building module in Molecular Operating Environment 2008.10.30 The addition of hydrogen atoms and a C-terminal carboxyl group was affected with CHARMM c35b1.31,32 Afterwards, the structure was energy minimized while holding the crystal coordinates fixed using CHARMM c35b1. This allowed for the correction of any unnatural strain created by the addition of the missing atoms. A protonation state representative of free amino acids in water at a pH of 7 was used. The resulting protein had a net overall charge of +3, adjusted to +4 with the addition of the two sodium ions and one chloride ion found in the crystal structure. This positive charge was compensated for by adjusting the balance between sodium and chloride ions later added to the solvated protein and lipid bilayer, creating an overall neutral system. In the simulation with a sodium ion removed from the binding pocket, the extra charge was compensated for by replacing a solvent molecule with an additional sodium ion.
DAT structure
Construction of the DAT molecular model has been thoroughly described elsewhere.22 Briefly, the FASTA sequence of the rat DAT protein (SwissProt locus SC6A3_RAT; accession number P23977; NCBI accession number AAB21099) was used as the query for three independent sequence alignments: via the Robetta server, the 3D-JIGSAW server, and the original LeuT alignment found in the study by Yamashita et al.13 Models derived from the three distinct alignments were essentially superimposable.22 However, the one obtained from the Robetta server was used because it yielded the best docking energies for dopamine and amphetamine. DAT homology modeling using the LeuT coordinates as a template and the sequence alignment retrieved by the Robetta server with the FASTA hDAT sequence were performed using the Molecular Operating Environment 2007.0902 program.30 The resulting DAT models were free of atomic clashes and energy minimized using the AMBER99 all-atom force field.33 This field was used to add hydrogen atoms and assign partial charges to the DAT homology models. The newly added hydrogen atoms were relaxed via several cycles of energy minimization performed using a conjugated gradient/truncated Newton optimization algorithm to convergence criteria of 0.05 kcal/mol and with a dielectric constant (ϵ) of 3 using a solvation distance-dependent dielectric potential energy form. All nonhydrogen atoms were held fixed during the energy minimization. The AMBER99 all atom force field was further used for a refinement of the backbones and side chains (convergence criteria = 0.1 kcal/mol, ε = 3, with a solvation distance-dependent dielectric potential energy form). An optimal Ramachandran plot and spatial fit with the LeuT crystal structure were the selection criteria used to determine the best DAT homology model to use for experimental work.
Membrane composition
A 1-palmitoyl-2-oleoyl-sn-glycero-3-phosphoethanolamine (POPE) membrane was selected in order to model the LeuT protein in a lipid environment similar to that in which the protein was crystallized. The LeuT structure was solved through x-ray crystallography of protein expressed in Escherichia coli C41 cells.13 Biochemical analysis of E. coli lipids indicates 75% to 85% phosphatidylethanolamine, 10% to 20% phosphatidylglycerol, and 5% to 15% cardiolipid. At 37°C, the fatty acid composition is 25% to 40% palmitic, 25% to 40% palmitoleic, and 25% to 35% cis-vaccenic acid, with lauric, myristic, stearic, lactobacillic, and cis-9–10-methylene-hexadecanoic acid found at much lower concentrations.34 The fatty acid composition of the POPE lipid membrane does not precisely match that of E. coli, but palmitic acid is a major component of both. Because a POPE lipid membrane also provides a mixed fatty acid environment, this scaffold was considered to be the more reasonable choice among the lipid membranes readily available for computational study. This choice is also compatible with the phosphatidylethanolamine-predominant MAT protein milieu.
Lipid construction and protein insertion
The 110Å × 110Å POPE membrane was built using the Visual Molecular Dynamics (VMD) membrane plugin 1.1.35 The algorithm used to construct the membrane places individual lipids in two layers of two-dimensional hexagonal lattices. The distance between the two layers was set to fit the actual membrane thickness, and the lattice period was set to fit the actual surface density of lipid molecules. Each lipid was placed in a random orientation in the lipid plane, and a truncated Gaussian spread was used in the perpendicular direction. A 1-picosecond (ps) equilibration in vacuo was performed to eliminate steric collisions among the lipid atoms. A more detailed description of the algorithm used to construct the membrane can be found at http://www.ks.uiuc.edu/Research/vmd/plugins/membrane/.
The prepared LeuT structure was placed in the center of the membrane of orientation similar to that of Yamashita et al.13 The protein was oriented so that the largely hydrophobic TM residues were positioned within the lipid bilayer; hydrophilic residue stretches in the outer shell of the protein were positioned above and below the membrane. Overlapping lipids and those within 2.4Å of any nonhydrogen atom of the protein were deleted; 298 lipids remained in the simulation. In addition to the protein, the crystallographic structure contained 210 water molecules, 2 Na+ ions, 1 Cl− ion, and 5 β-octylglucoside residues (the latter omitted for the purposes of this study). Next, the system was TIP3 solvated and ions were added, beginning 3Å above and below the lipid layers and 3Å away from the outer shell of the intracellular and extracellular protein coordinates. Water residues with oxygen atoms within 2.4Å of any nonhydrogen protein atom were deleted. Additionally, 244 randomly selected water molecules were deleted. The coordinates for the oxygen atom of each of these deleted water molecules were used to seat 120 Na+ and 124 Cl− ions, creating an overall neutral system in approximately 0.2M NaCl. The ions were equally distributed above and below the lipid bilayer; the final system contained approximately 32,000 water molecules.
Simulation overview
Each of the LeuT MD simulations was performed with the LeuT structure in the membrane surrogate described previously. A cross-section of the prepared LeuT system without substrate after 14 nanoseconds of MD simulation is shown (Fig. 1). The first MD simulation was performed with no substrate but in the presence of the two sodium ions and one chloride ion found in the crystal structure. A second MD simulation was performed with the substrate in its crystallized position within the binding pocket in the presence of the crystallized ions. Finally, an MD simulation was constructed in the presence of the substrate but without the sodium ion crystallized closest to the carboxyl group of the substrate, leaving one crystallized sodium ion and one crystallized chloride ion. This scheme is depicted in Table I. To provide a direct comparison to the LeuT simulations, identical MD simulations were performed with the DAT homology model. Simulations with and without substrate were performed in the presence of binding pocket ions (Table I).
Figure 1.
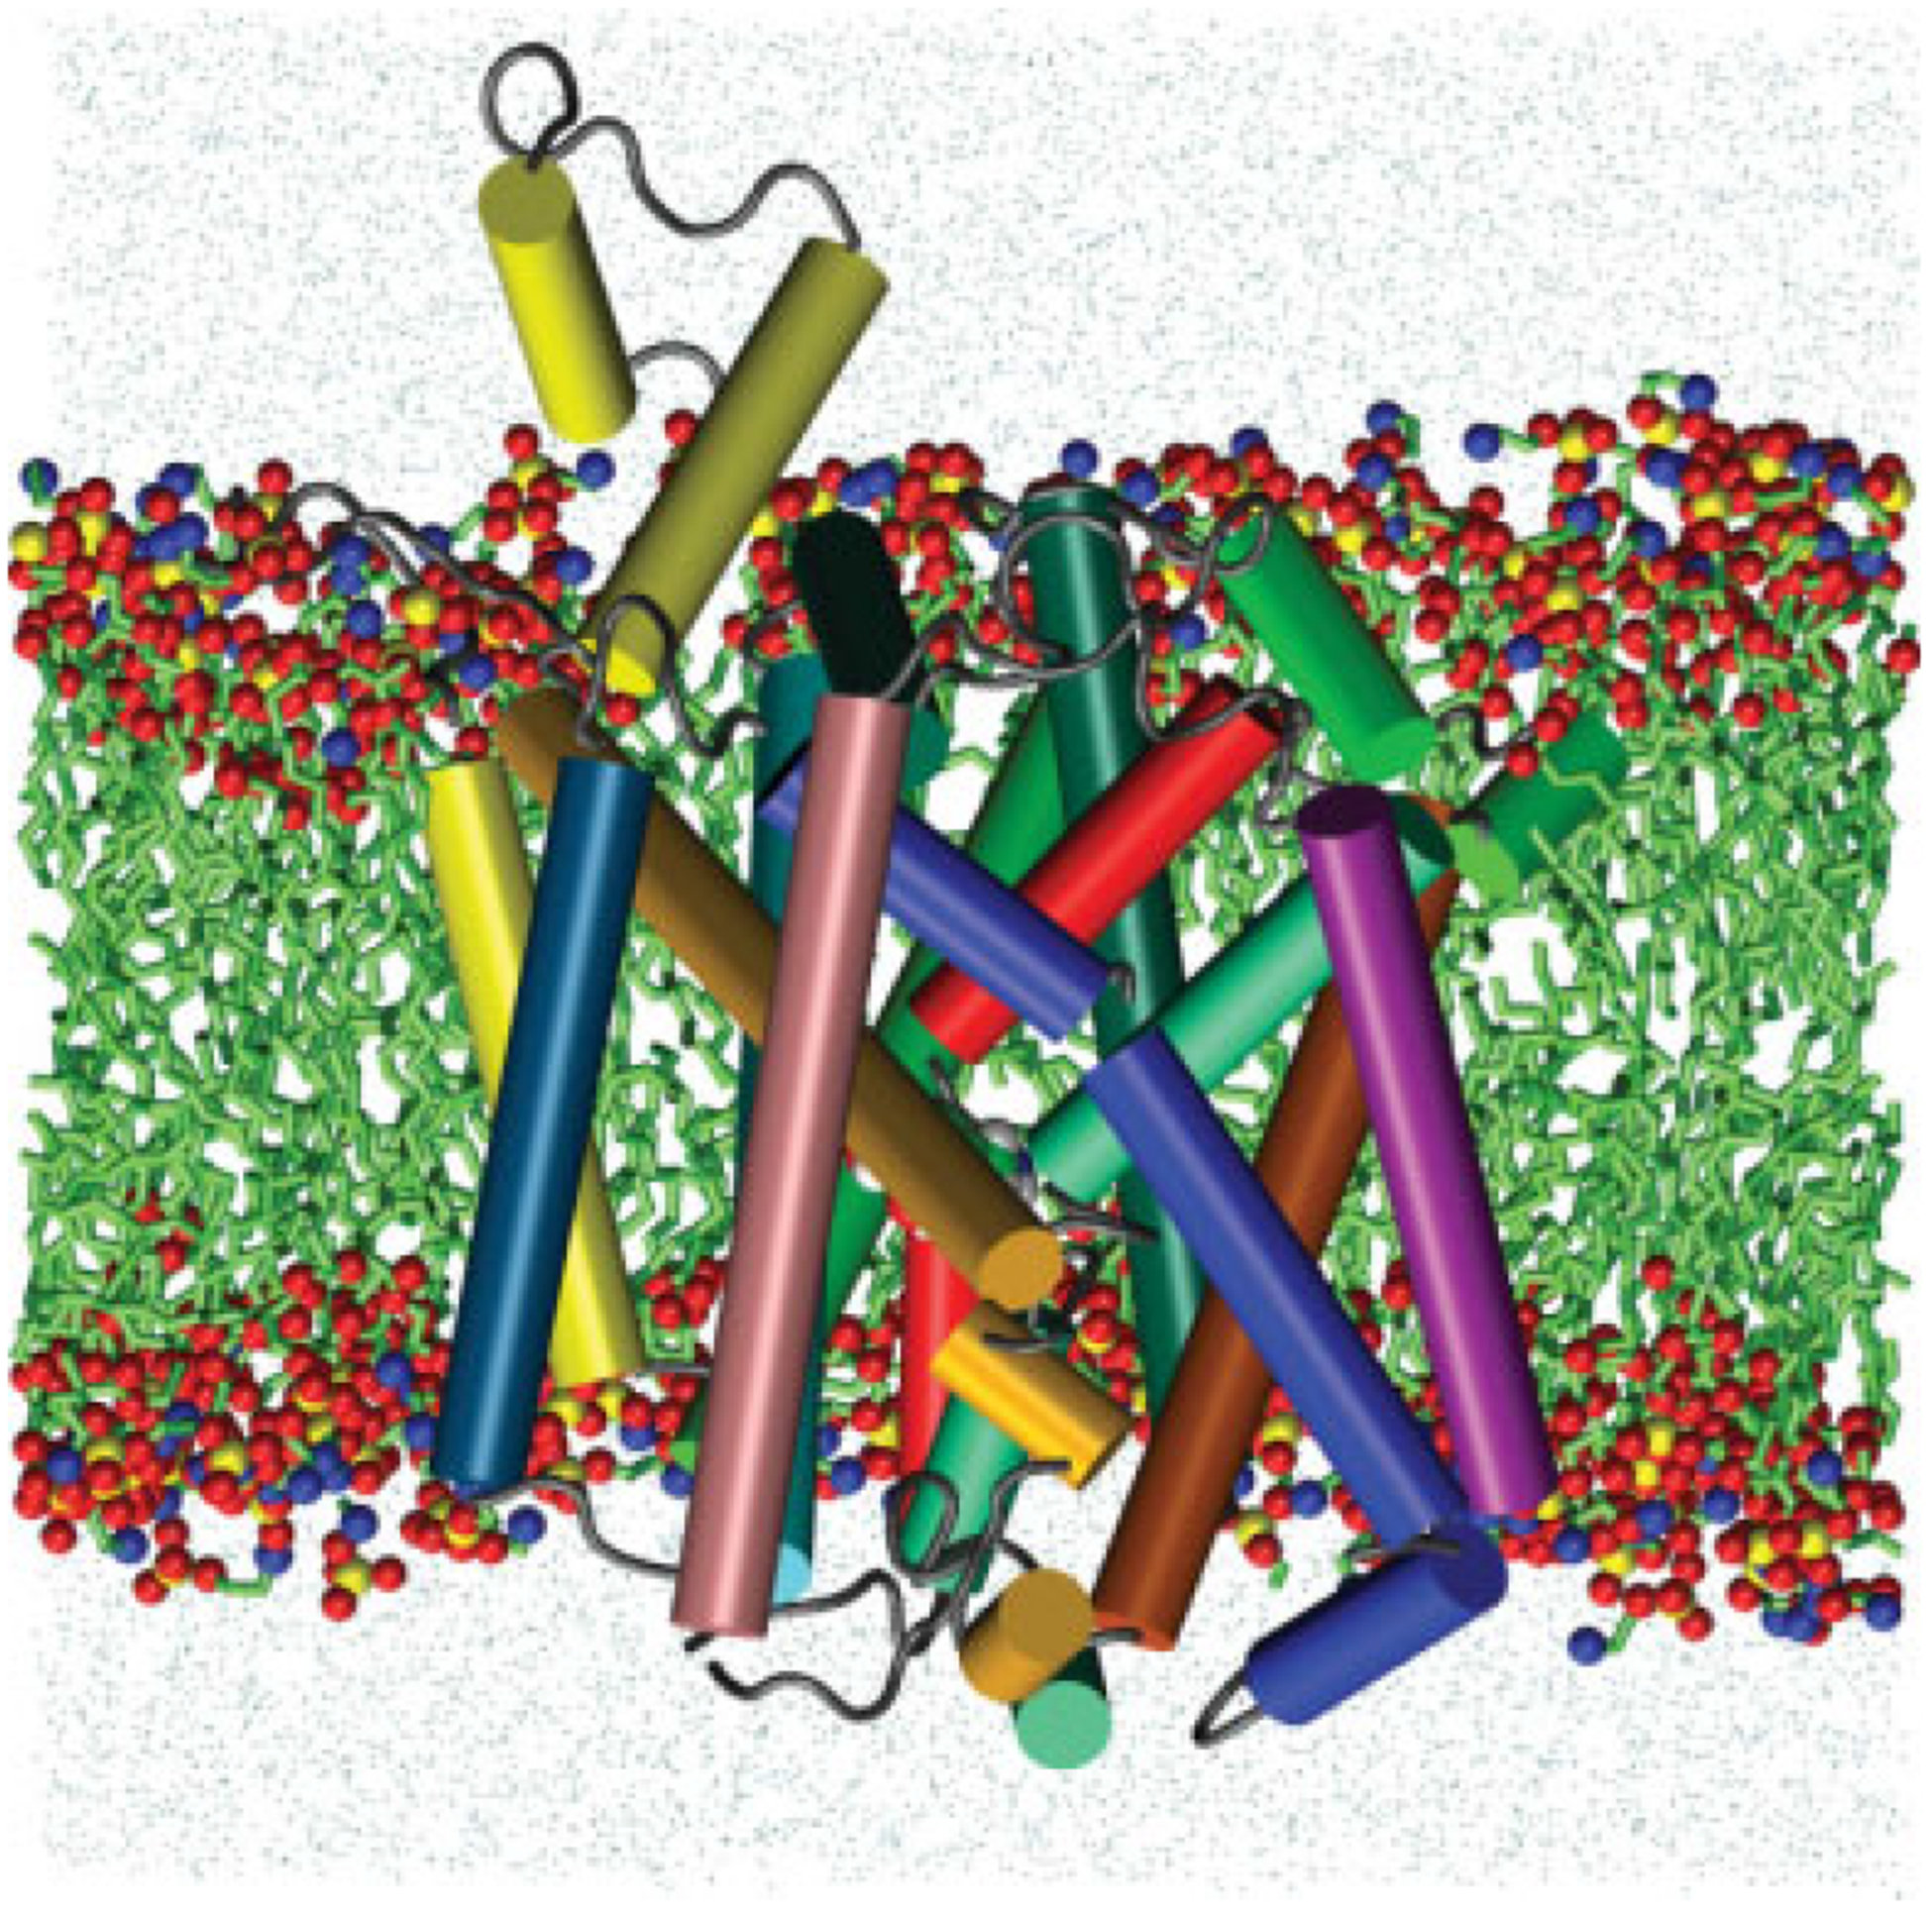
A graphic representation of the DAT/substrate system. Cross-section through the POPE membrane showing DAT protein, dopamine substrate (carbon, green; oxygen, red; nitrogen, blue; hydrogen, white) surrounding lipids (green) and water molecules (cyan) after 30 nanoseconds of MD simulation using NAMD 2.6. The 12 DAT transmembrane helices are illustrated as colored cylinders: TM1, red; TM2, dark orange; TM3, light orange; TM4, yellow; TM5, green; TM6, green-cyan; TM7, dark green; TM8, cyan; TM9, navy-blue; TM10, blue; TM11, purple; TM12, pink.
Table I.
Overview of MD Simulations Performed for LeuT and DAT
| Setup | Transporter | S1 | Na1 | Na2 | Lipid Membrane | Simulation Time |
|---|---|---|---|---|---|---|
| 1 | LeuT | + | + | + | POPE | 30 ns |
| 2 | LeuT | − | + | + | POPE | 30 ns |
| 3 | LeuT | + | − | + | POPE | 30 ns |
| 4 | DAT | + | + | + | POPE | 30 ns |
| 5 | DAT | − | + | + | POPE | 30 ns |
The presence or absence of either the substrate or sodium ions is indicated by + or −, respectively. S1, substrate; Na1, sodium ion in position 1; Na2, sodium ion in position 2.
Simulation procedure
MD simulation was performed by using NAMD 2.636 optimized for a Cray-XT3 computer (Pittsburgh Supercomputing Center). The NPT ensemble was used to perform MD calculations. Periodic boundary conditions were applied to the system in the three coordinate directions. A pressure of 1 atm was maintained using the modified Nose-Hoover method provided by NAMD. In this method, Langevin dynamics is used to control fluctuations in the barostat. The Langevin piston period was set to 200 femtoseconds (fs) with a decay period of 100 fs. Constant temperature constraints were implemented in conjunction with the Nose-Hoover pressure control in order to simulate the NPT ensemble. After warming the system with small increases in temperature, a constant temperature of 310 K was maintained. In order to warm the system, the velocity of atoms was initially assigned based on a random distribution representing an overall system temperature of 10 K. MD calculations were performed at this temperature for 20 ps, after which the temperature constraint was raised to 20 K. The temperature constraint of the system was then raised in 20-K intervals after each 20 ps of simulation time. After 20 ps of simulation at 300 K, the temperature constraint for the system was set to 310 K. Heating the system in this manner required 320 ps of simulation time. The PME technique was used to calculate electrostatic interactions. The CHARMM27 parameters for proteins and lipids were used.37,38
In order to obtain a reasonable starting point, all coordinates were initially held fixed except for the water molecules and ions above and below the lipid membrane. This allowed the water molecules and ions to fill the void above and below the lipid membrane and to more naturally solvate the LeuT protein. The water and ions were only allowed to move for a very short period of time (1ps) so that the void would begin to close without water and ions migrating into the region surrounding the protein in the bilayer. After equilibrating the water and ions surrounding the lipids, the coordinates for the lipids were released for the simulation. This allowed the lipids to fill the void surrounding the protein and to assume a more relaxed conformation. After the water molecules, ions, and lipids were sufficiently equilibrated as determined by water density, ion distribution, and membrane thickness and density, the coordinates for the protein, water molecules, and ions from the crystal structure were released, the system was heated according to the method described earlier, and the simulation time was reset to 0 fs.
RESULTS AND DISCUSSION
For each of the simulation setups (Table I), 30 nansoseconds of all-atom MD calculations were performed to comparatively study the dynamics of LeuT and DAT. Simulations 1 and 2 were designed to study the equilibrium dynamics of the crystallized structure of LeuT in the presence or absence of substrate. Overall protein dynamics, interactions between key residues of the extracellular gate, and dynamics of the EL4 loop, a segment that appears to play a crucial role in LeuT function and pharmacology (see later) were assessed. Simulation 3 further investigated the dynamics of the LeuT primary binding pocket residues by instead removing Na1, the sodium ion closest to the leucine carboxylate in the crystal structure.13 DAT MD studies were conducted largely as described earlier for the LeuT work. Simulations 4 and 5 involved the DAT in the presence or absence of the dopamine substrate, respectively.
LeuT protein stability
The starting coordinates for the LeuT protein were identical to those of the crystal structure, representative of the protein in the occluded state; the substrate is present in the primary substrate binding pocket (S1), and both the extracellular and intracellular gates are closed.13 No major conformational changes were observed in the LeuT protein backbone during the 30-nanosecond simulations; however, minor differences were observed in the RMSD of the protein backbone for each of the three simulations (Fig. 2). The average RMSD of the LeuT protein backbone was the lowest and fluctuated the least for Simulation 1 over the 10- to 30-nansecond window (1.19 ± 0.08Å). This was expected given that this scenario included the same substrate and ion combination as the crystal structure. Simulation 2 (lacking substrate) yielded a similar average and fluctuation of RMSD during the same window (1.32 ± 0.09Å). Simulation 3 (lacking Na1) produced the largest average RMSD and greatest RMSD fluctuation (1.53 ± 0.13Å). Thus, removal of the substrate-proximal Na+ atom produced more change in the protein backbone and created a less stable structure than did removal of the substrate itself, consistent with the importance of sodium ions in protein infrastructure and stability.
Figure 2.
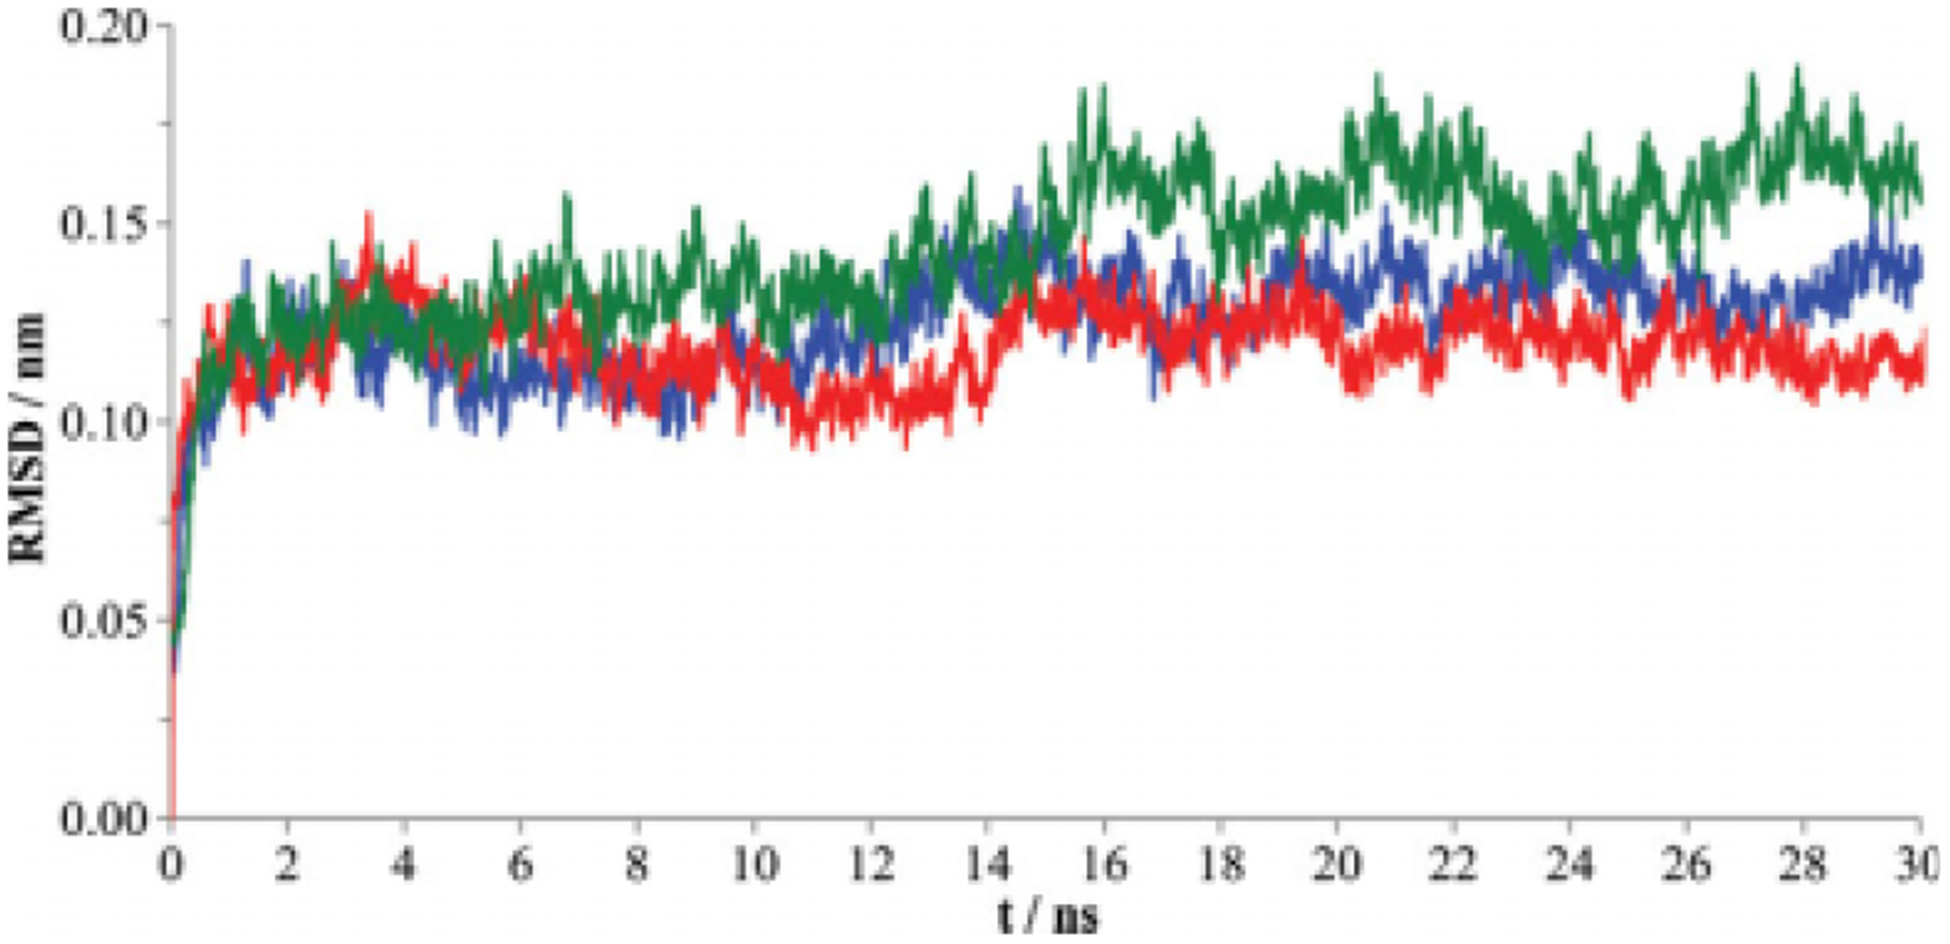
The RMSD for LeuT backbone in the absence of leucine (blue) or with the leucine substrate in the presence (red) or absence (green) of Na1. Data points represent each 0.01 nanosecond of MD simulation.
Toward elucidating the LeuT residues responsible for these RMSD shifts, the average RMSD for the C-α atom of each residue was examined for each simulation. A comparison of these average RMSD results for the three simulations reveals discrete residues sensitive to the presence of leucine or Na+ (Table II). Such an analysis indicates which residues are more likely to provide direct or indirect support to binding of substrate or Na1. Furthermore, for each of the three LeuT simulations, average root mean square fluctuation (RMSF) values for the C-α atom of each residue were assessed in the context of the experimentally obtained B factors (Fig. 3). RMSF values were calculated because this allows for a direct comparison to B factors, which are determined through crystallography in the context of RMSF. A direct relationship between the average RMSF and the experimental B factor held for most, but not all, residues, with only minor differences between the three simulations observed (Fig. 3). To highlight the more sensitive residues, B factors were scaled by a factor of 30 in order to make a better comparison to the RMSF values of the three simulations (Fig. 4). Although most residues had average C-α atom RMSF values that closely parallel the scaled B factors, readily identifiable in Figure 4 are select residues that had average C-α atom RMSF values that diverge more than 1.0 A from the scaled B factors: residues 129–137 (in the extracellular region just downstream of TM3), residues 234–240 (in the extracellular region just upstream of TM6), and residues 467–476 (in the furthest downstream third of TM-11). The presence of only minor differences between the three LeuT simulations in this regard is further shown in Figure 4.
Table II.
LeuT Residues in Which the Average RMSD of a C-α Atom During 15 to 20 Nanoseconds of MD Equilibration Differed by 1Å or Greater Between Simulations
| LeuT Residue | +S1+NA1+NA2 RMSD/Å | −S1+Na1+Na2 RMSD/Å | +S1−Na1+Na2 RMSD/Å |
|---|---|---|---|
| Leu 123 | 1.08 | 1.71 | 0.65 |
| Gly 125 | 0.90 | 2.34 | 0.71 |
| Leu 126 | 0.85 | 2.31 | 0.89 |
| Val 127 | 0.71 | 2.90 | 0.93 |
| Pro 128 | 0.68 | 1.74 | 0.68 |
| Pro 155 | 0.97 | 2.12 | 1.37 |
| Gly 157 | 1.48 | 1.90 | 2.87 |
| Asp 158 | 1.49 | 1.99 | 3.45 |
| Pro 160 | 1.17 | 1.18 | 2.23 |
| Pro 233 | 1.63 | 1.08 | 0.62 |
| Asp 234 | 1.78 | 0.98 | 0.78 |
| Glu 477 | 2.30 | 1.39 | 1.23 |
Figure 3.
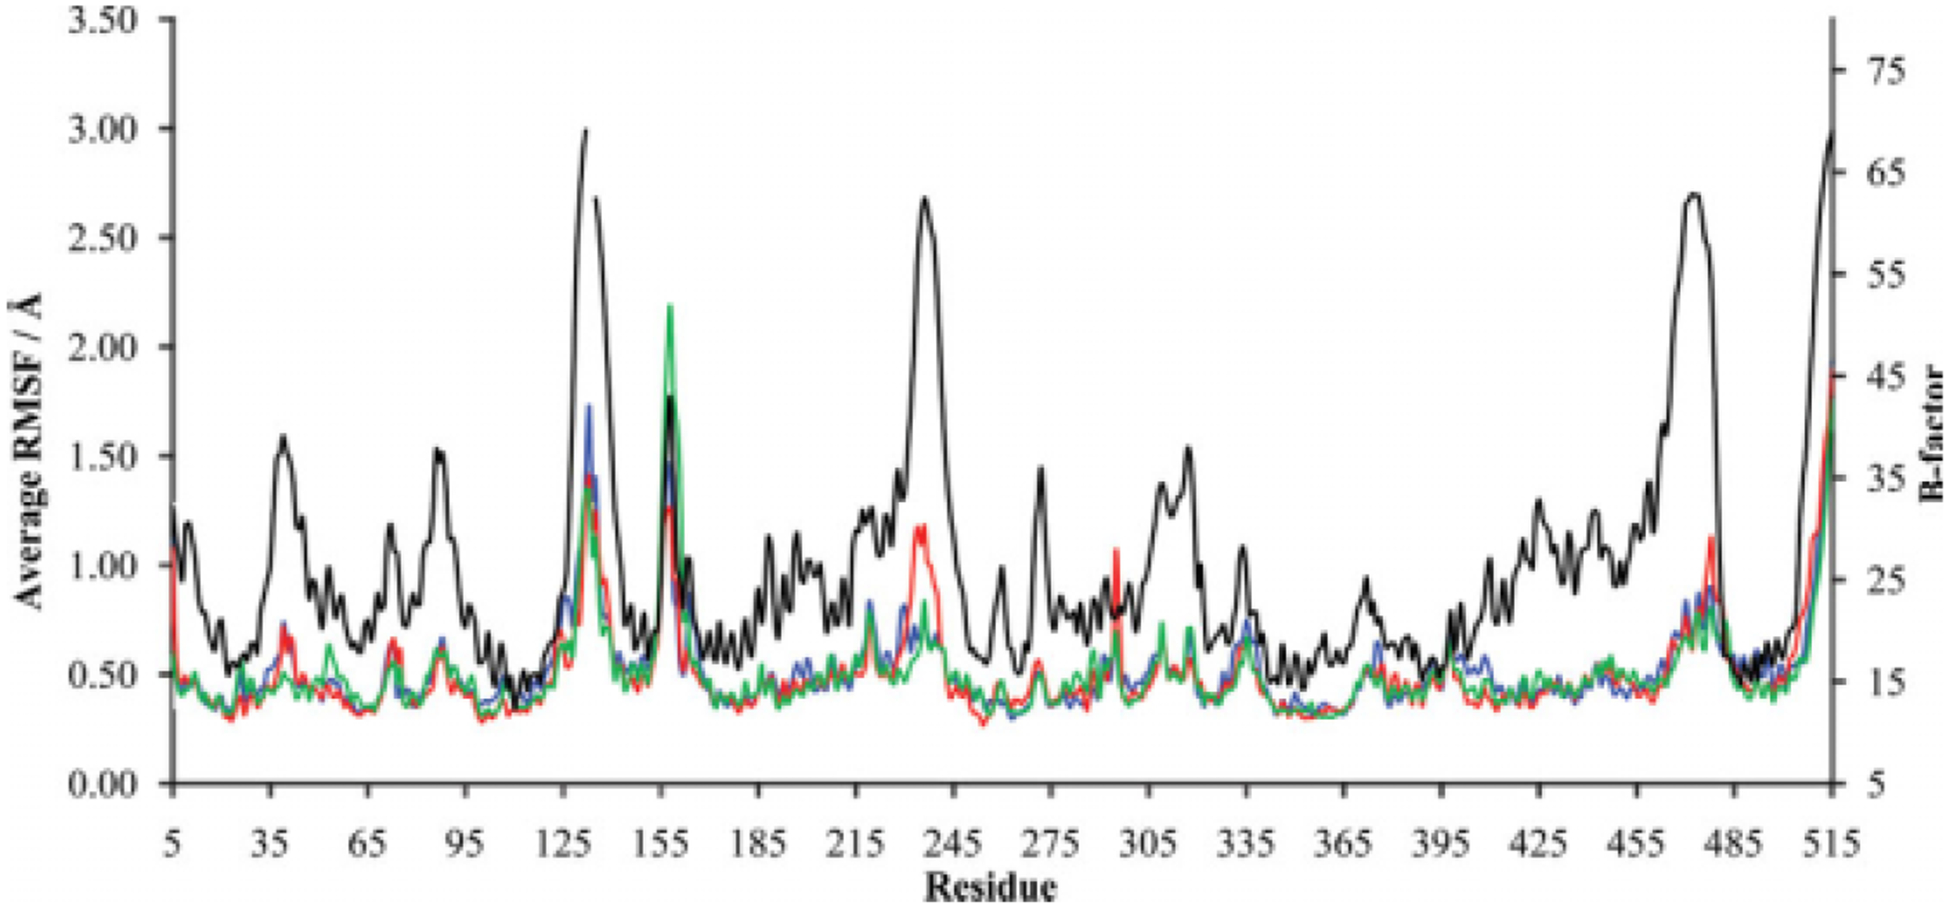
Residue-by-residue C-α RMSF of LeuT in the absence of leucine (blue) or with the leucine substrate in the presence (red) or absence (green) of Na1. The associated B factor obtained from x-ray crystallography is indicated (black; y-axis on right). The left y-axis represents an RMSF average calculated for each 0.01-nanosecond time step between the 15- and 20-nanosecond points of the MD simulation.
Figure 4.
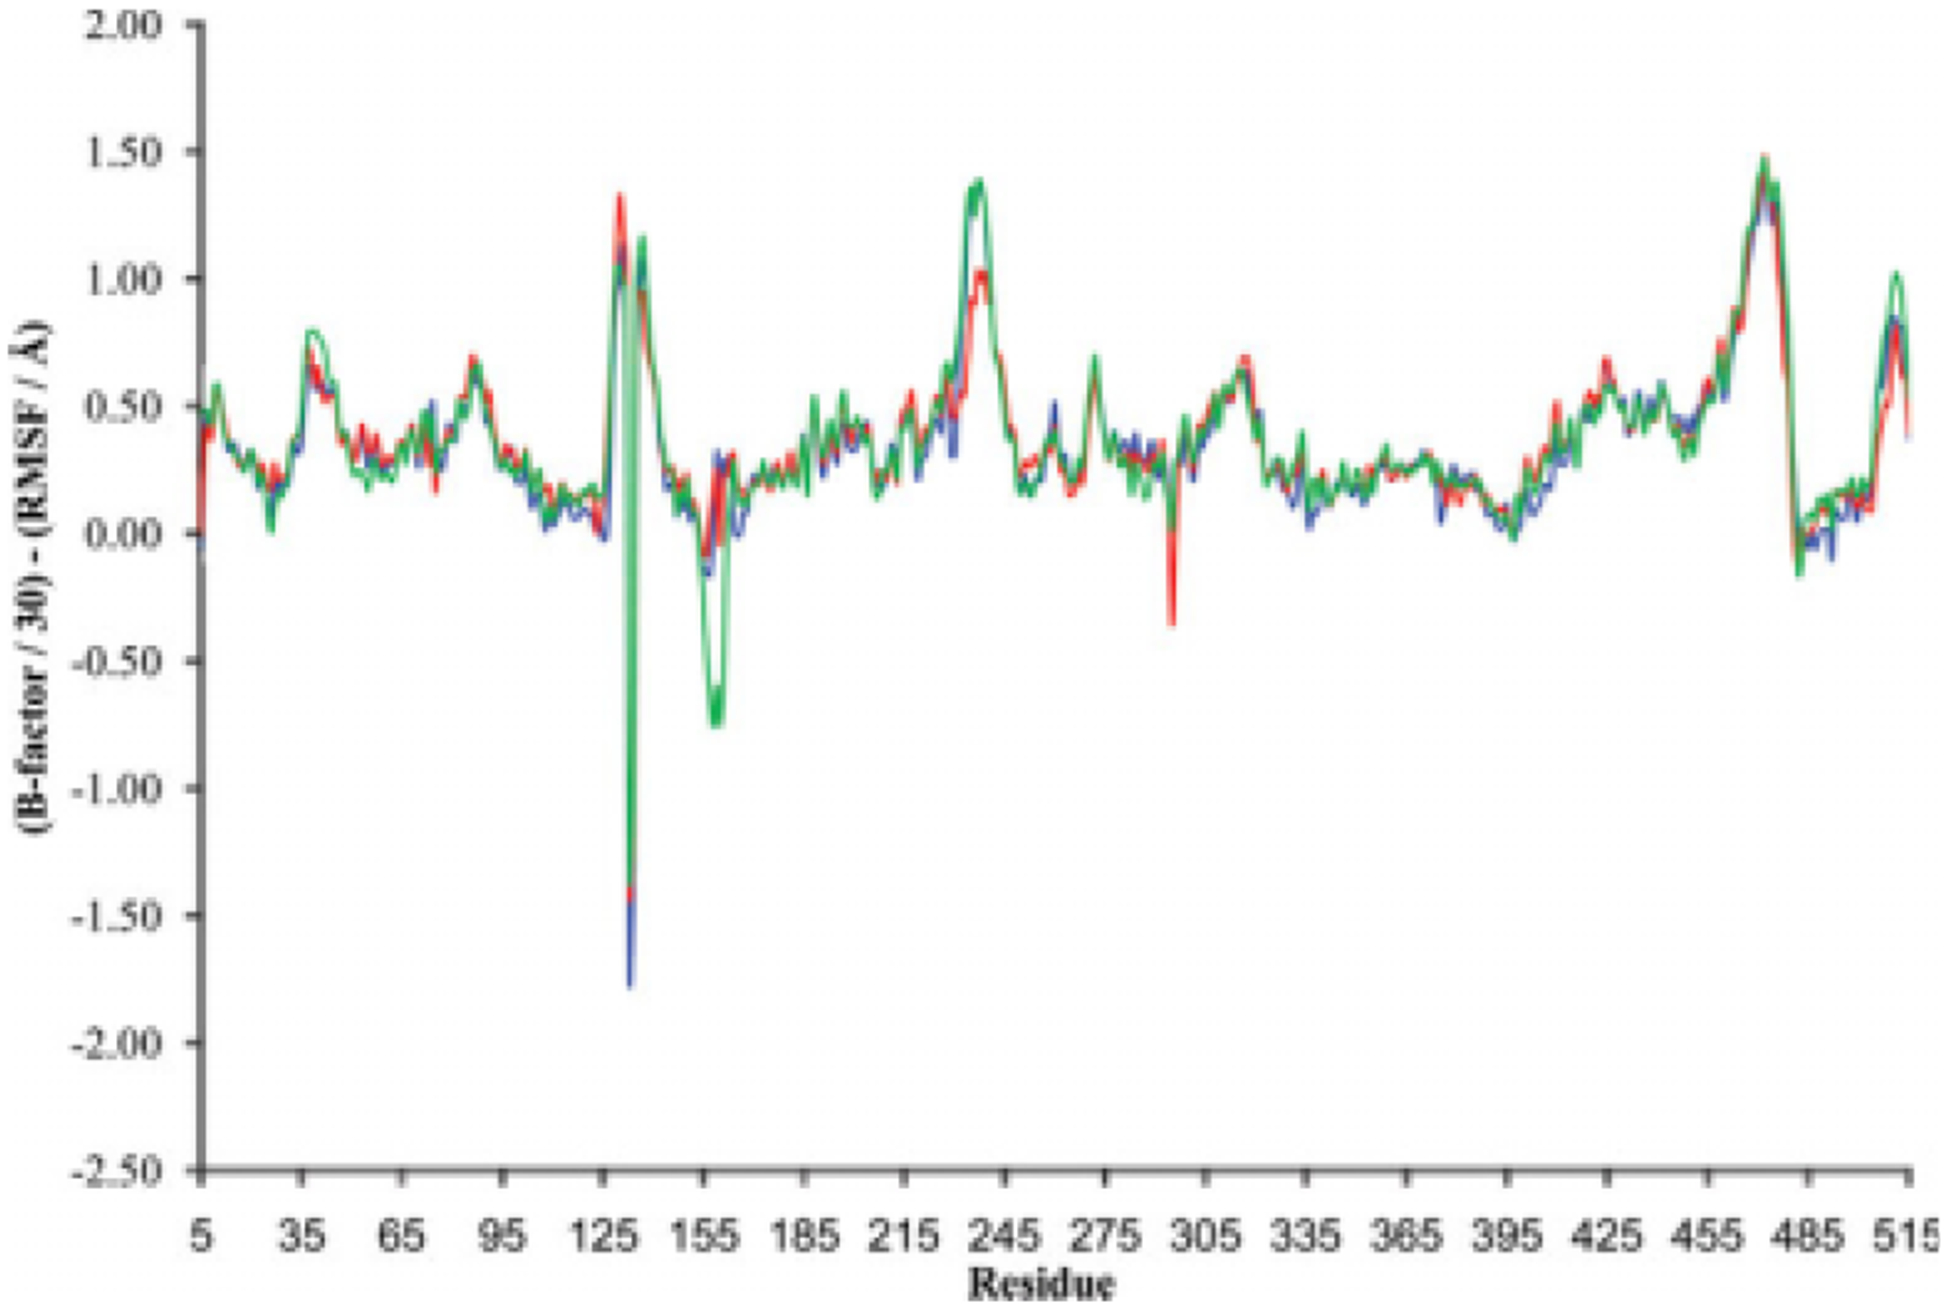
The relationship of scaled B factor and average RMSF for each LeuT residue. The average RMSF was calculated from values for each 0.01-nanosecond time step between the 15- and 20-nanosecond points of the MD simulation. LeuT was studied in the absence of leucine (blue) or with the leucine substrate in the presence (red) or absence (green) of Na1. The B factor was uniformly scaled (scale factor = 30) to detect differences between the three simulations.
Although only minor differences between the three LeuT simulations were observed when comparing average RMSF values for the C-α atom of each residue (Fig. 3), significant differences between the three LeuT simulations were observed when comparing average RMSD values for the C-α atom of each residue (Table II). Additionally, in each of the three simulations, the average RMSF values for the C-α atom of each residue closely correlated to the experimentally derived B factors determined for the LeuT crystal structure with substrate bound (Fig 4). Accordingly, although discernable changes in discrete residues were observed by altering the presence of leucine or sodium ions, these changes resulted in new stable structures with average residue fluctuations closely correlated to experimentally derived B factors.
DAT protein stability
As was the case for LeuT, no major conformational changes were observed in the DAT protein backbone during the 30-nanosecond simulations. The starting coordinates for the DAT protein were provided by a LeuT-guided three-dimensional homology model that presumably represents the occluded state of the DAT (extracellular-facing gate closed to substrate passage).22 Minor differences were observed in the RMSD of the protein backbone for Simulations 4 and 5 (Fig. 5). In accordance with other MD studies that use homology models built from crystallized proteins,39 the average RMSD values for the DAT simulations were slightly higher than those for LeuT. The average RMSD for the DAT protein backbone during Simulation 4 over the 10- to 30-nanosecond window was 4.74 ± 0.38Å. RMSD values actually decreased and fluctuated less (3.70 ± 0.28Å) during the same window in the absence of substrate (Simulation 5), a result opposite of that found with LeuT. This could be partially caused by a stabilizing role of the carboxylate portion of D79 not present in LeuT. In the latter, the carboxylate complex with sodium is achieved when the substrate is introduced. In the DAT, the carboxylate functional group is intrinsic to the protein, and, accordingly, the carboxylate complex with sodium is not substrate dependent. The pre-equilibration DAT homology model was subject to more movement during the simulation when dopamine was present. The RMSD for the C-α atom of each DAT residue was examined for each simulation, and, as seen with LeuT, the DAT pattern was altered by the presence of substrate (Fig. 6). The molecular dynamics of a handful of DAT residues were especially dependent on the presence of dopamine (Table III).
Figure 5.
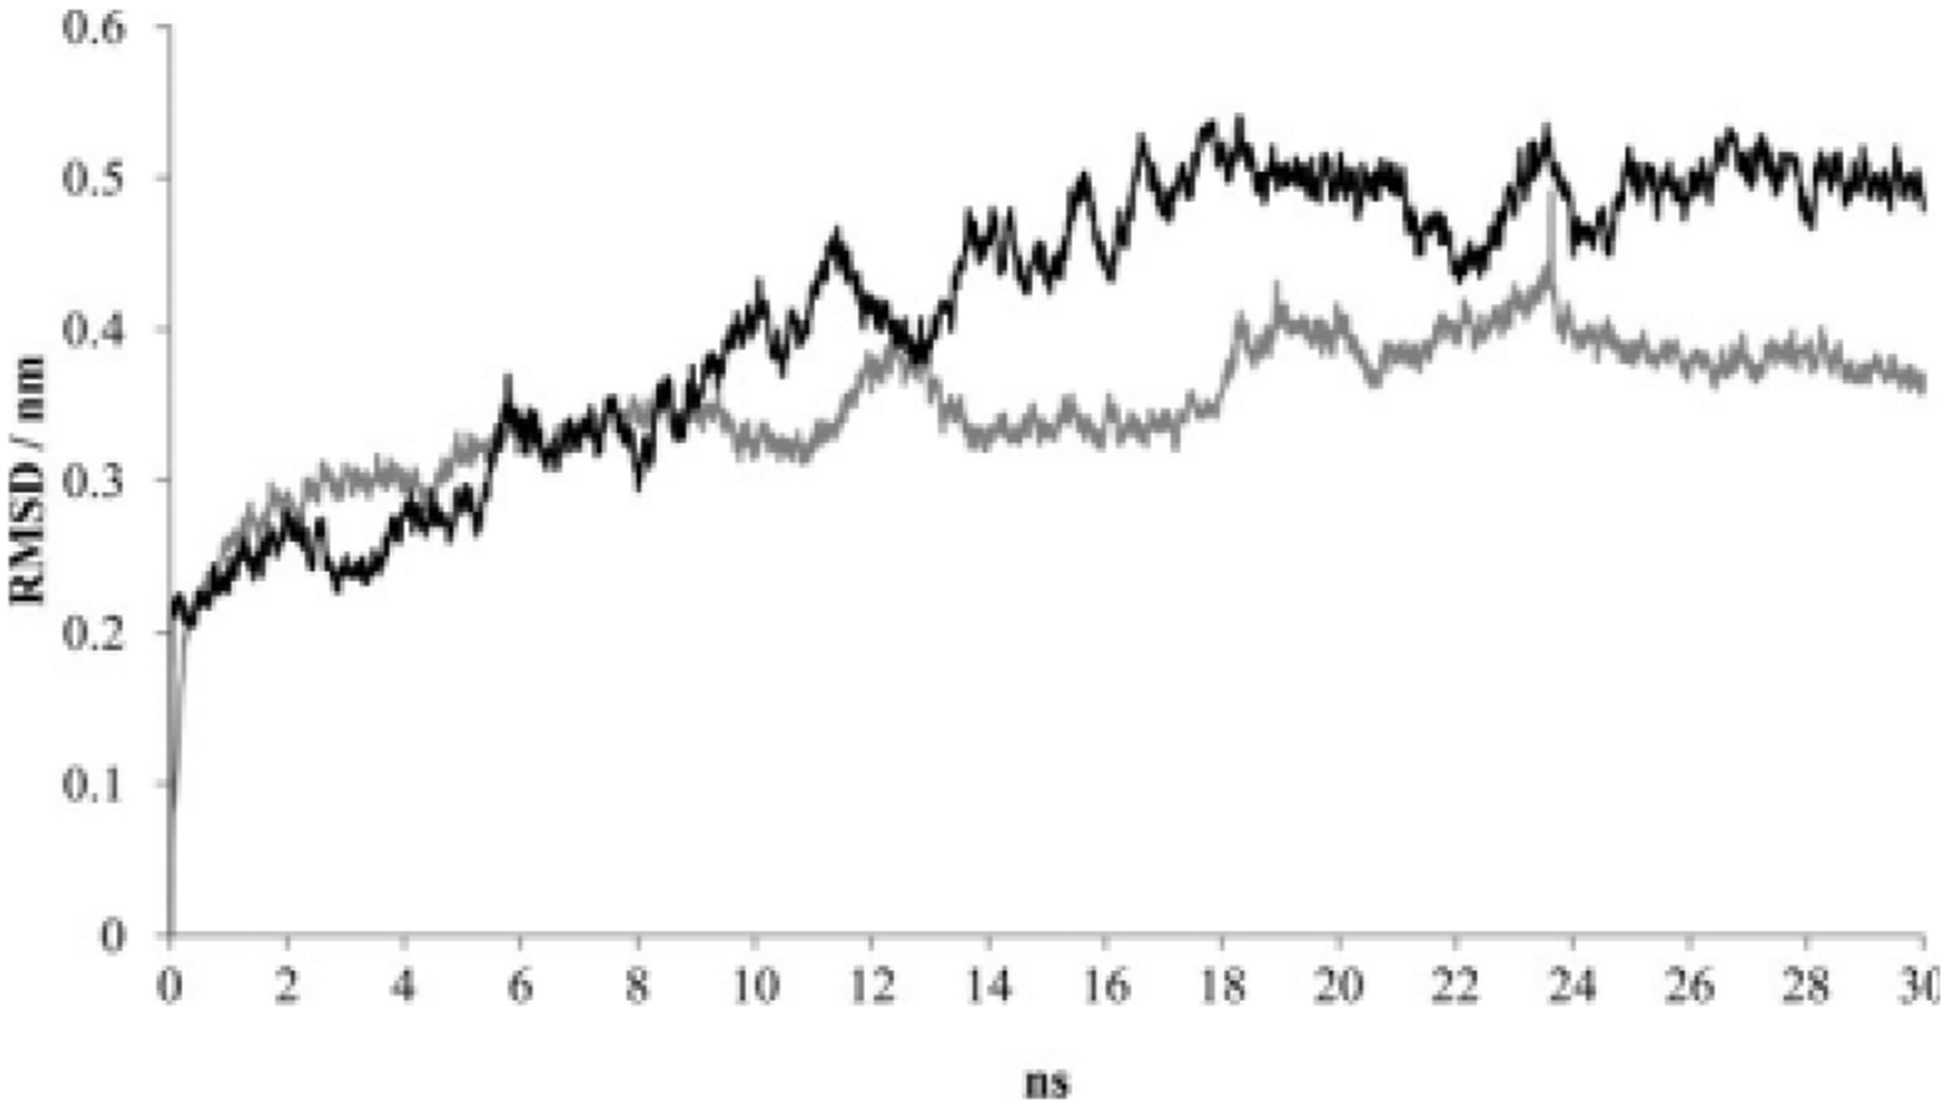
The RMSD for DAT backbone in the absence (gray) or presence (black) of dopamine. Data points represent each 0.01 nanosecond of MD simulation using NAMD 2.6.
Figure 6.
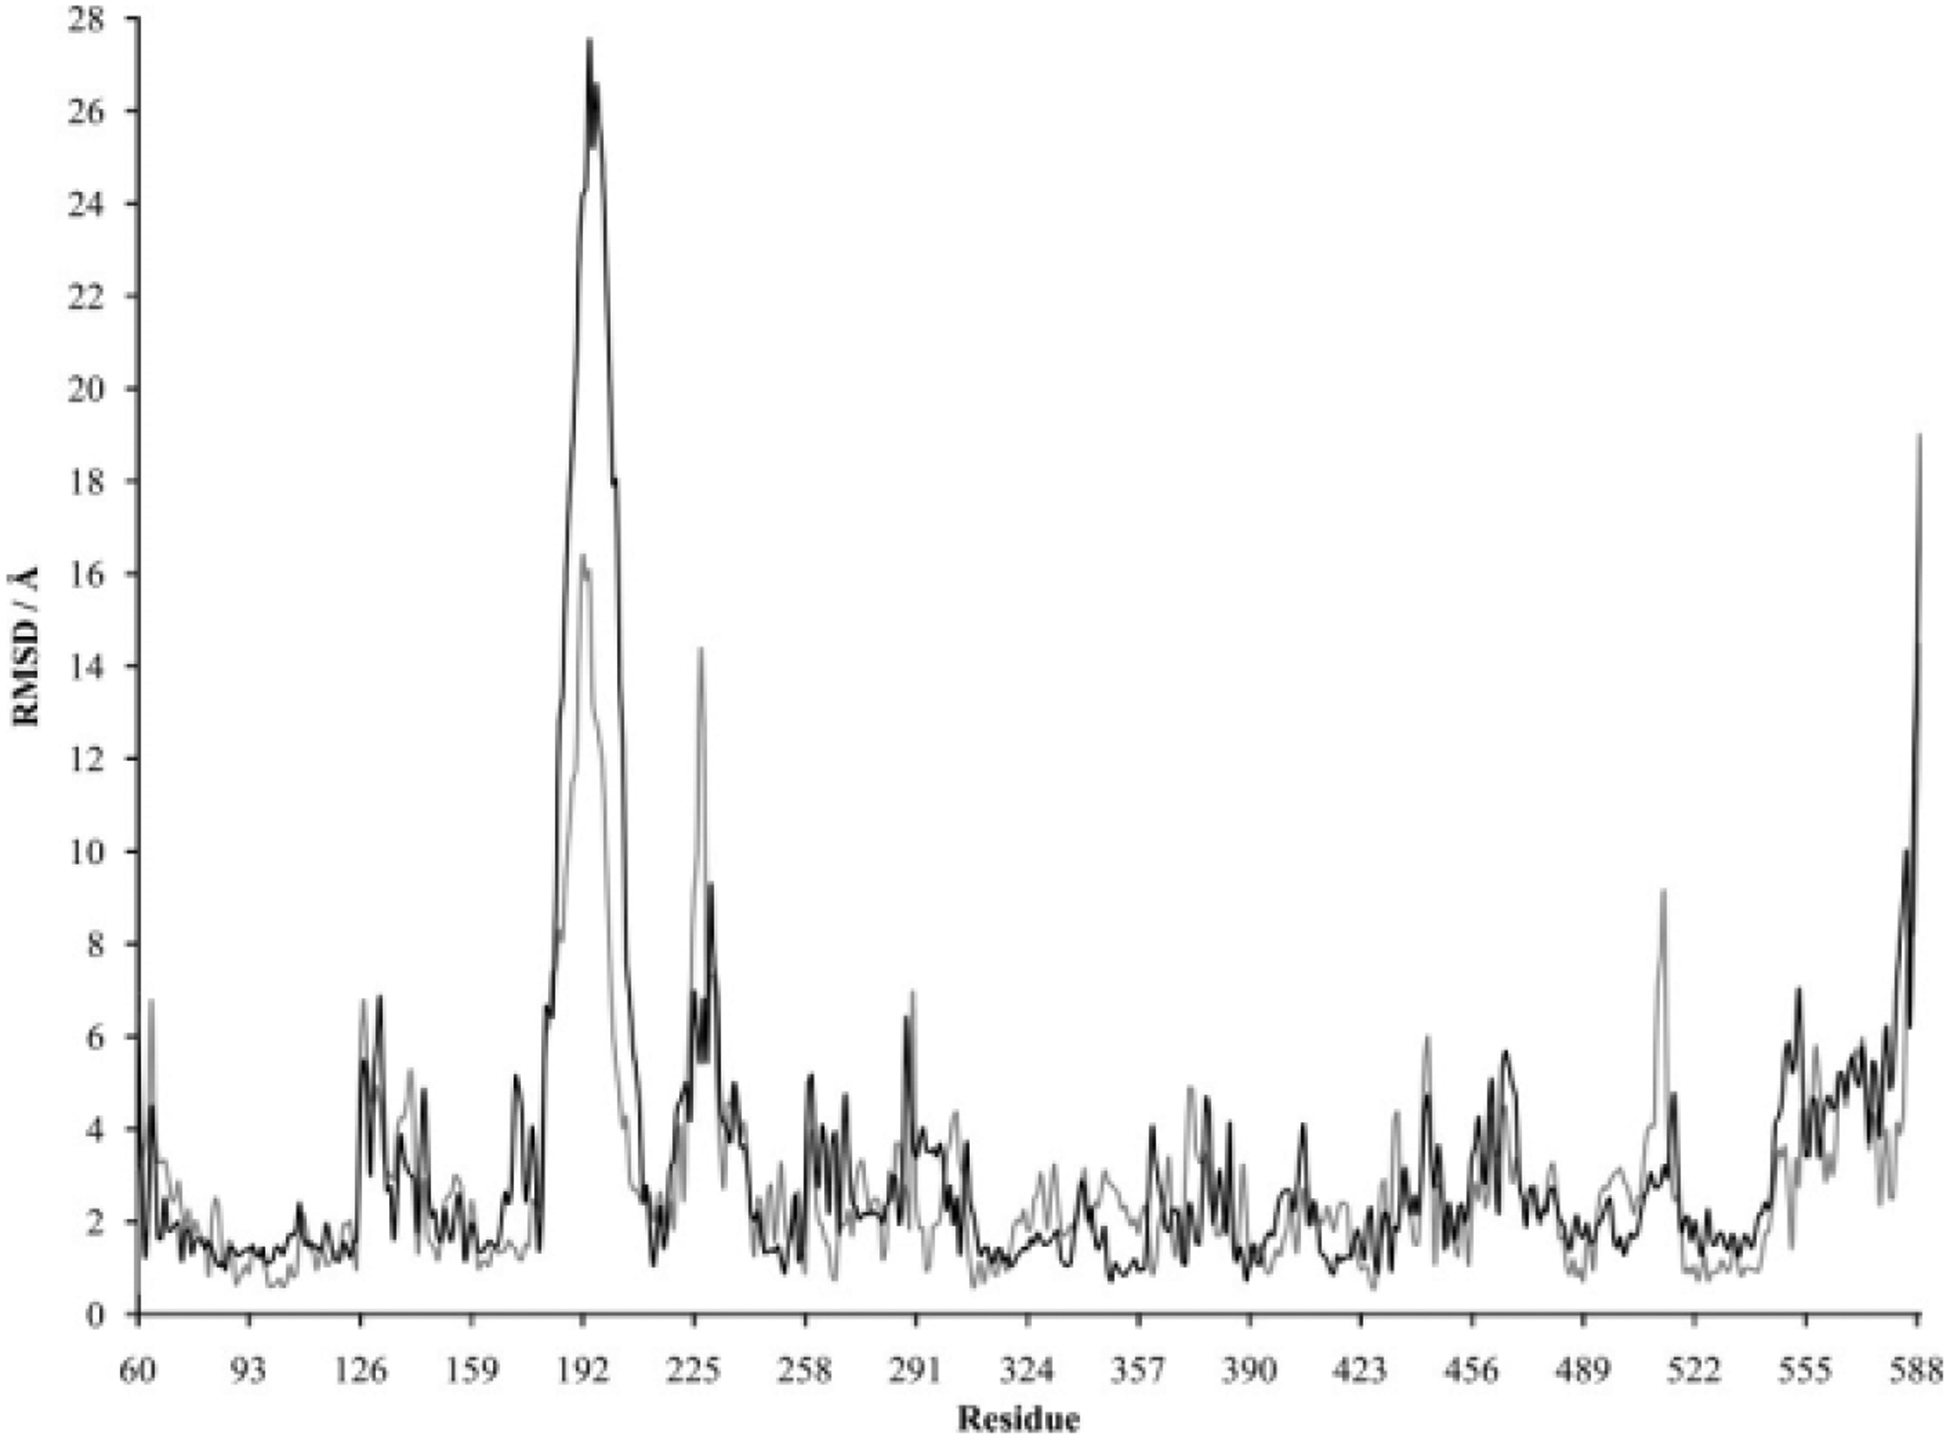
The residue-by-residue C-α RMSD for DAT in the absence (gray) or presence (black) of the substrate dopamine. The y-axis represents an RMSD average calculated for each 0.01-nanosecond time step between the 15- and 20-nanosecond points of the MD simulation. The RMSD was calculated in reference to the original DAT homology model.
Table III.
DAT Residues in Which the Average RMSD of a C-α Atom During 15 to 20 Nanoseconds of MD Equilibration Differed by 5Å or Greater Between Simulations
| DAT Residue | +S1+Na1+Na2 RMSD/Å | −S1+Na1+Na2 RMSD/Å |
|---|---|---|
| Ser 186 | 13.37 | 8.08 |
| Pro 187 | 15.91 | 9.52 |
| Asn 188 | 17.62 | 10.50 |
| Cys 189 | 18.79 | 11.52 |
| Ser 190 | 20.29 | 11.80 |
| Asp 191 | 22.95 | 14.62 |
| Ala 192 | 24.19 | 16.37 |
| His 193 | 24.37 | 15.87 |
| Ala 194 | 27.53 | 16.06 |
| Ser 195 | 25.22 | 13.20 |
| Asn 196 | 26.57 | 12.82 |
| Ser 197 | 25.67 | 12.39 |
| Ser 198 | 24.72 | 11.79 |
| Asp 199 | 20.26 | 7.78 |
| Gly 200 | 17.93 | 6.16 |
| Leu 201 | 18.03 | 5.37 |
| Gly 202 | 13.87 | 4.65 |
| Leu 203 | 12.06 | 4.03 |
| Ser 226 | 5.44 | 14.34 |
| Arg 227 | 6.82 | 12.51 |
| Gly 512 | 3.21 | 9.04 |
The “external gate” in the LeuT and DAT
The initial coordinates used for the LeuT and DAT MD equilibrations are representative of the occluded “substrate/ion-bound” state. The putative external and internal gates are closed in this conformation such that the substrate is trapped within the permeation pore, facing barriers to both intracellular and extracellular directed transport. TM 1 arginine (R30) and TM 10 aspartate (D404) residues contribute to the LeuT external gate that prohibits extracellular access to the substrate binding pocket. The LeuT crystal structure indicates that a pair of water molecules bridge these charged side chains in the presence of leucine13; interestingly, crystals that additionally contained transport inhibitor ligands revealed a direct R30-D404 salt bridge.27,28 To test the role of this residue pair during MD simulation, the distance between the residues was monitored as a function of substrate over 30 nansoseconds. Two pairs of nitrogen-oxygen atomic interactions were examined: NH1 (R30)-OD2 (D404) and NH2 (R30)-OD1 (D404). Interactions between both sets of atoms were apparent from the simulations (Fig. 7). The alternate pairs were considered in a separate calculation (not shown), and the results provided no new insights. After 10 nanoseconds of initial equilibration in the presence of leucine, the average distance of the R30 NH1–D404 OD2 interaction was 3.09Å, the standard deviation was 0.44Å, and the range varied from 2.47 to 4.38Å. More specifically, this distance alternated between an average of 3.37Å over the 10- to 14-nanosecond interval, 2.74Å over the 14- to 24-nanosecond interval, and back to 3.45Å over the 24- to 30-nanosecond interval. In the absence of substrate, however, the average distance of this interaction was an Angstrom longer (4.02Å), and the fluctuation was much larger (standard deviation of 0.95Å and 2.51–7.57Å range) [Fig. 7(A)]. Unlike the simulation with substrate, the interaction appears to form and break, possibly providing a mechanism that allows extracellular leucine to access the primary binding pocket. The substrate-induced transition is not as crisp for the R30 NH2–D404 OD1 interaction but otherwise mimics the NH1-OD2 pattern [Fig. 7(B)]. In the presence of substrate, the average distance of 3.13Å fluctuated between 2.48 and 5.25Å with a standard deviation of 0.42Å. In the absence of leucine, the average interaction distance of 3.32Å ranged from 2.45 to 6.24Å with a standard deviation of 0.76Å. For both interactions studied, in the presence of substrate, the salt bridge was formed more frequently, the average atom distance was lower, and there was less fluctuation in atom distance. These results are supportive of recent experimental work indicating that sodium binding contributes to the formation of an “outward-facing” state in which the substrate permeation pathway is exposed and that substrate binding constricts the extracellular pathway leading to the occluded state observed in the LeuT crystal structure.40
Figure 7.
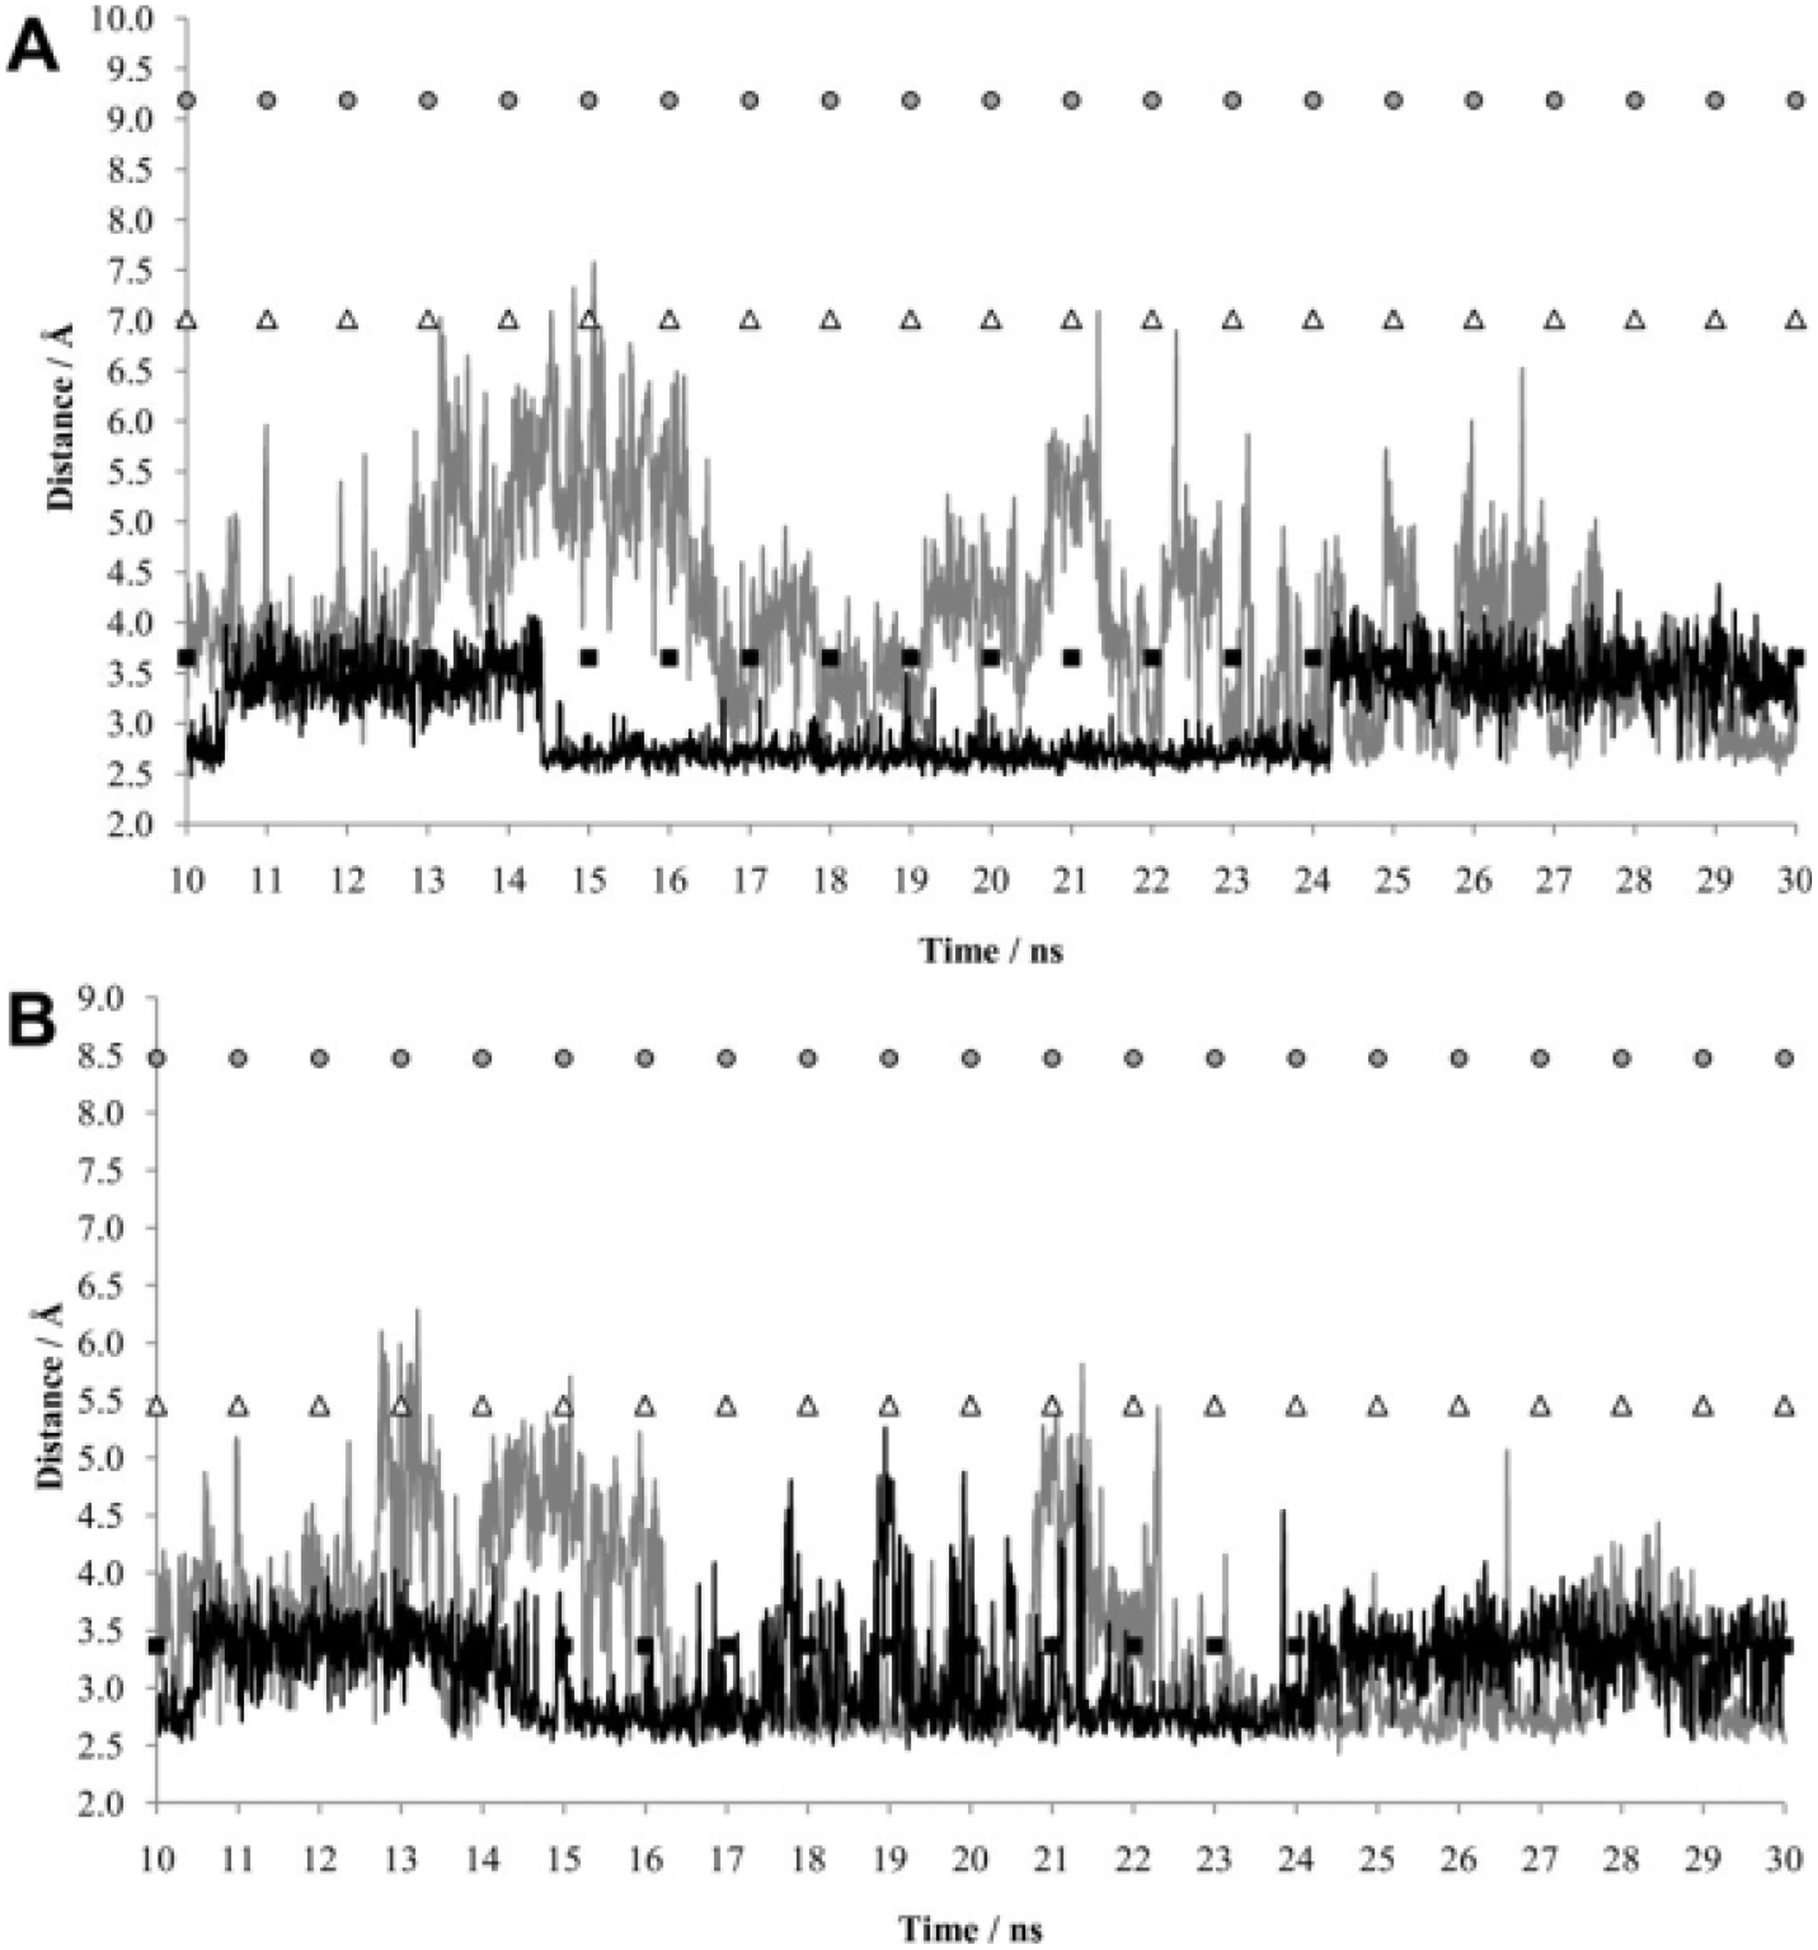
A: MD simulations as a function of LeuT R30 NH1–D404 OD2 distances in the absence (gray) or presence (black) of leucine. B: MD simulation of LeuT R30 NH2–D404 OD1 distances in the absence (gray) or presence (black) of leucine. The first 10 nanoseconds of each 30-nanosecond simulation was a pre-equilibration phase. For each panel, distances for identical atoms are also indicated for the crystal structure of LeuT with L-tryptophan and sodium (PDB entry 3F3A), representing the “locked-open” state (gray circles); for the crystal structure of LeuT with L-leucine, sodium, and desipramine (PDB entry 2QB4), representing the “locked-occluded” state (black squares); and for the crystal structure of LeuT with L-leucine and sodium (PDB entry 2A65), representing the occluded “substrate/ion-bound” state (white triangles).
In order to further elucidate the variations in distance between LeuT salt bridge–forming atoms of R30 and D404, results from the two sets of atom interactions during MD simulation were compared with the distances between the same atoms in 3 crystal structures (Fig. 7). The three crystal structures hypothetically represent the occluded “substrate/ion-bound” state (LeuT + L-leucine + sodium), the “locked-occluded” state (LeuT + sodium + the transport inhibitor desipramine), and the “locked-open” state (LeuT + sodium + the competitive inhibitor L-tryptophan).24 Despite having begun MD calculations with the crystal structure representing the occluded state, the distance between the R30-D404 salt bridge atoms for simulations with and without substrate was reduced to that seen in the locked-occluded state. In the simulation with substrate, the atom distances remained reduced at a distance equivalent to that seen in the crystal locked-occluded state. In the absence of substrate, significantly larger fluctuation in atom distances produced a trajectory in which R30-D404 salt bridge atoms alternated regularly between distances observed in the original occluded state and the locked-occluded state. This suggests that in the absence of substrate, a sampling of the two states occurs for atoms of R30-D404, whereas in the presence of substrate, atom distances are more consistently held at the distance observed in the locked-occluded structure. For both simulations, larger R30-D404 atom distances such as those for in the locked-open state were not seen, implying that this conformation was not sampled through the course of MD simulation.
In addition to R30 and D404, the LeuT extracellular gate is composed of two aromatic residues: the TM 3 tyrosine residue Y108 and the TM 8 phenylalanine residue F253. To test the dynamic opening and closing of this aromatic portion of the extracellular gate, the distance between the geometric centers of the side chain rings was examined over MD simulation time for LeuT simulations with and without substrate. Differences in distances between the centers of the Y108-F253 aromatic side chain rings as a function of substrate presence, 6.53 ± 0.26 Å with and 6.28 ± 0.31 Å without, were not statistically significant, although a trend toward greater distances in the presence of substrate was apparent (Fig. 8). Similar to that exhibited by the R30-D404 extracellular gate salt bridge, there is a trend toward greater fluctuation in distance between the centers of the Y108 and F253 aromatic side chain rings in the simulation without substrate, although the greater fluctuation is not as pronounced as that for the R30-D404 atom pairs. Significant differences between the substrate/no substrate simulations were not observed in the distance between the centers of the aromatic portion of the extracellular gate.
Figure 8.
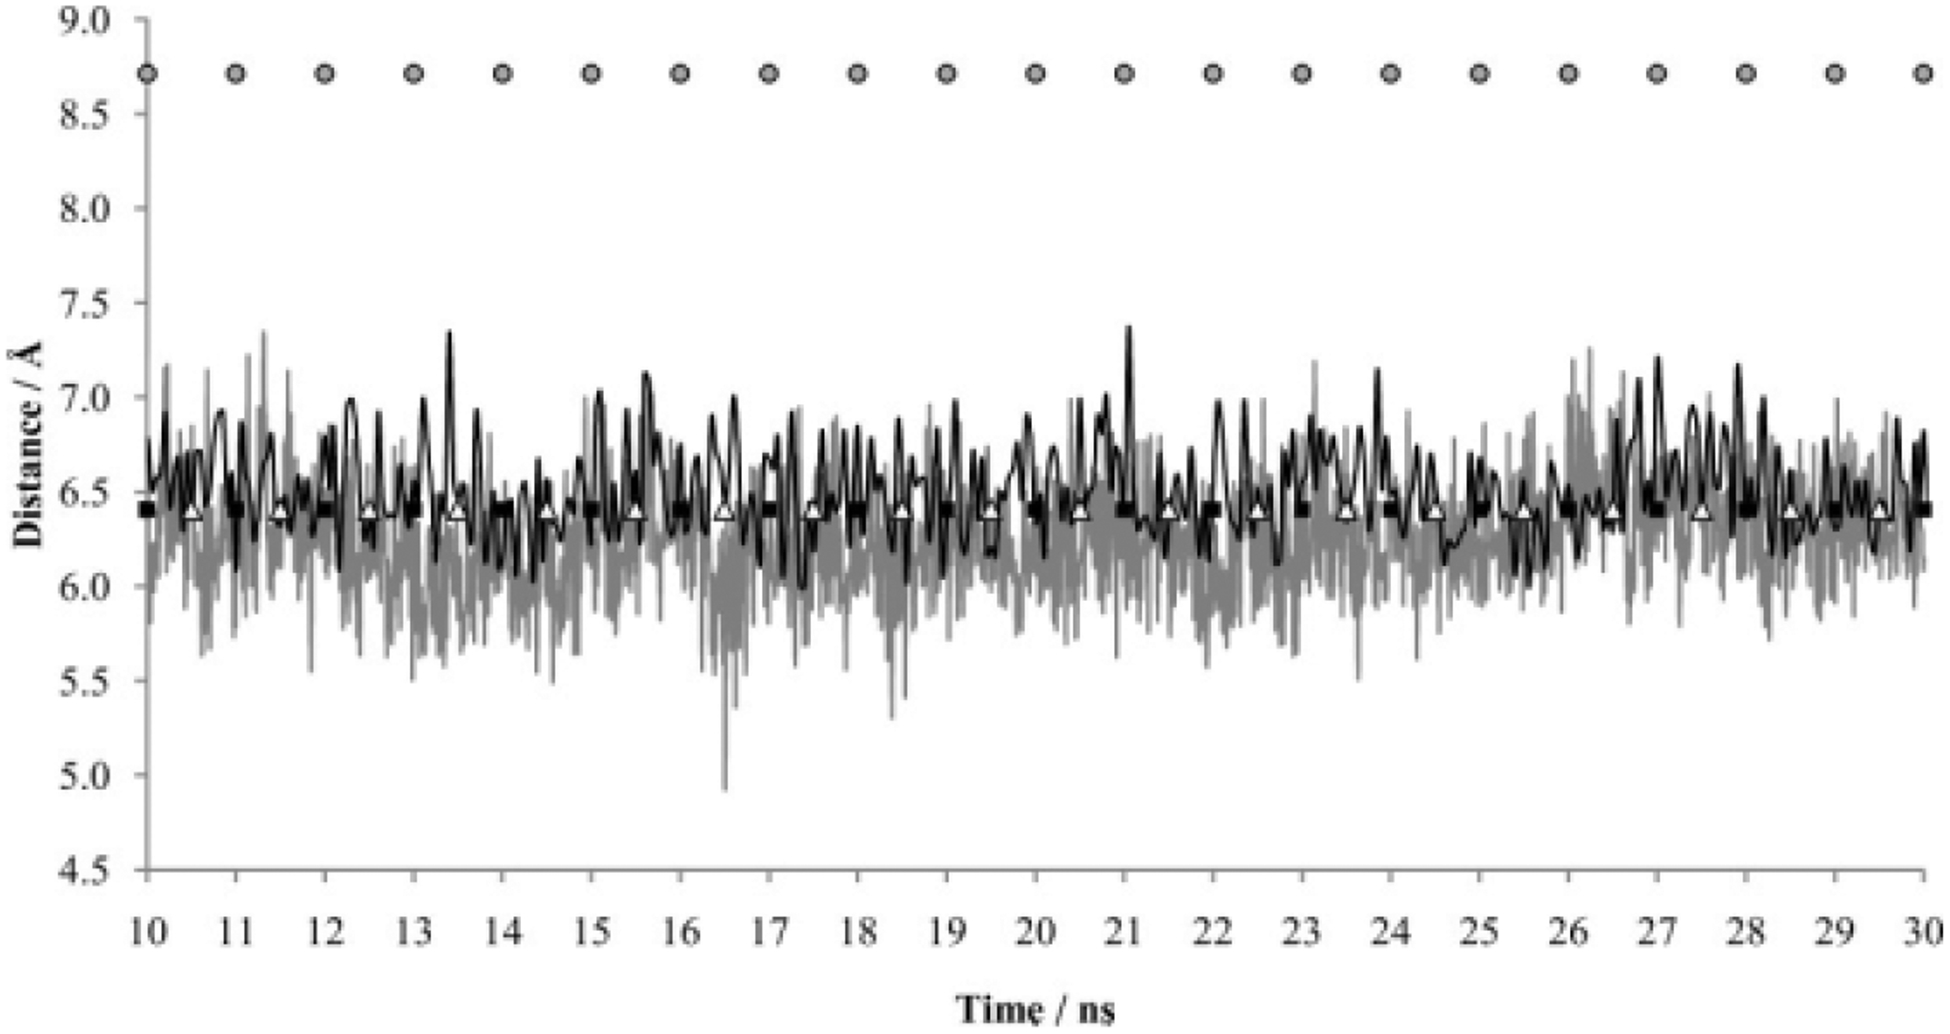
MD simulations as a function of LeuT Y108–F253 distances in the absence (gray) or presence (black) of leucine. Distances are taken from the center of each aromatic ring. The average distance between the center of the Y108 and F253 aromatic rings in the simulation with substrate was 6.53Å (standard deviation = 0.26Å). In the simulation without substrate, the average distance between the centers of the same two aromatic rings was 6.28Å (standard deviation = 0.31Å). The first 10 nanoseconds of each 30-nanosecond simulation was a pre-equilibration phase. Distances between the centers of the identical aromatic rings are also indicated for the crystal structure of LeuT with L-tryptophan and sodium (PDB entry 3F3A), representing the “locked-open” state (grey circles); for the crystal structure of LeuT with L-leucine, sodium, and desipramine (PDB entry 2QB4), representing the “locked-occluded” state (black squares); and for the crystal structure of LeuT with L-leucine and sodium (PDB entry 2A65), representing the occluded “substrate/ion-bound” state (white triangles).
Essentially identical distances between the centers of the Y108-F253 aromatic rings were obtained for the crystal structures of the occluded and locked-occluded states (6.41Å vs 6.41Å, respectively). A greater distance between these side chain ring centers was observed for the locked-open state (8.71Å) (Fig. 8). For LeuT simulations with and without substrate, distances for the two aromatic side chains fluctuated closely around the distances observed in the occluded substrate/ion-bound and locked-occluded states. For simulations with and without substrate, larger distances such as those for the locked-open state were not observed. Taken together with the previously mentioned data, it is suggested that extracellular gate conformations similar to both the occluded substrate/ion-bound and locked-occluded states are being obtained in LeuT simulations without substrate. Both salt bridge distances were obtained via large fluctuation, whereas both aromatic gate conformations were obtained via slight fluctuation around the equivalent crystal structure distances. In simulations with substrate, however, although the extracellular gate salt bridge distances are more representative of those seen in the locked-occluded state, the aromatic portion of the extracellular gate mimics the equivalent distances seen in the occluded and locked-occluded states.
To compare LeuT and DAT, we have assessed the distance between R85 and D476, the eukaryotic DAT atom pair homologous to the LeuT R30-D404 ion pair, over the course of 10- to 30-ns MD trajectories with and without the dopamine substrate (Fig. 9). In the presence of dopamine, the average distance between atom CZ of R85 and atom CG of D476 was 6.19Å, with a minimum distance of 3.91Å and a maximum distance of 7.44Å. In the simulation lacking substrate, analysis of the atom trajectory for the same time period yielded an average atom distance of 6.13Å, with a minimum distance of 3.75Å and a maximum distance of 8.32Å. Although the average atom distance was similar irrespective of substrate presence, notable differences were observed. In the DAT simulation with substrate, the atom distance was held more constant, there was a lower maximum atom distance, and atom proximity in the vicinity of distance minima was obtained less frequently (less salt bridge formation).
Figure 9.
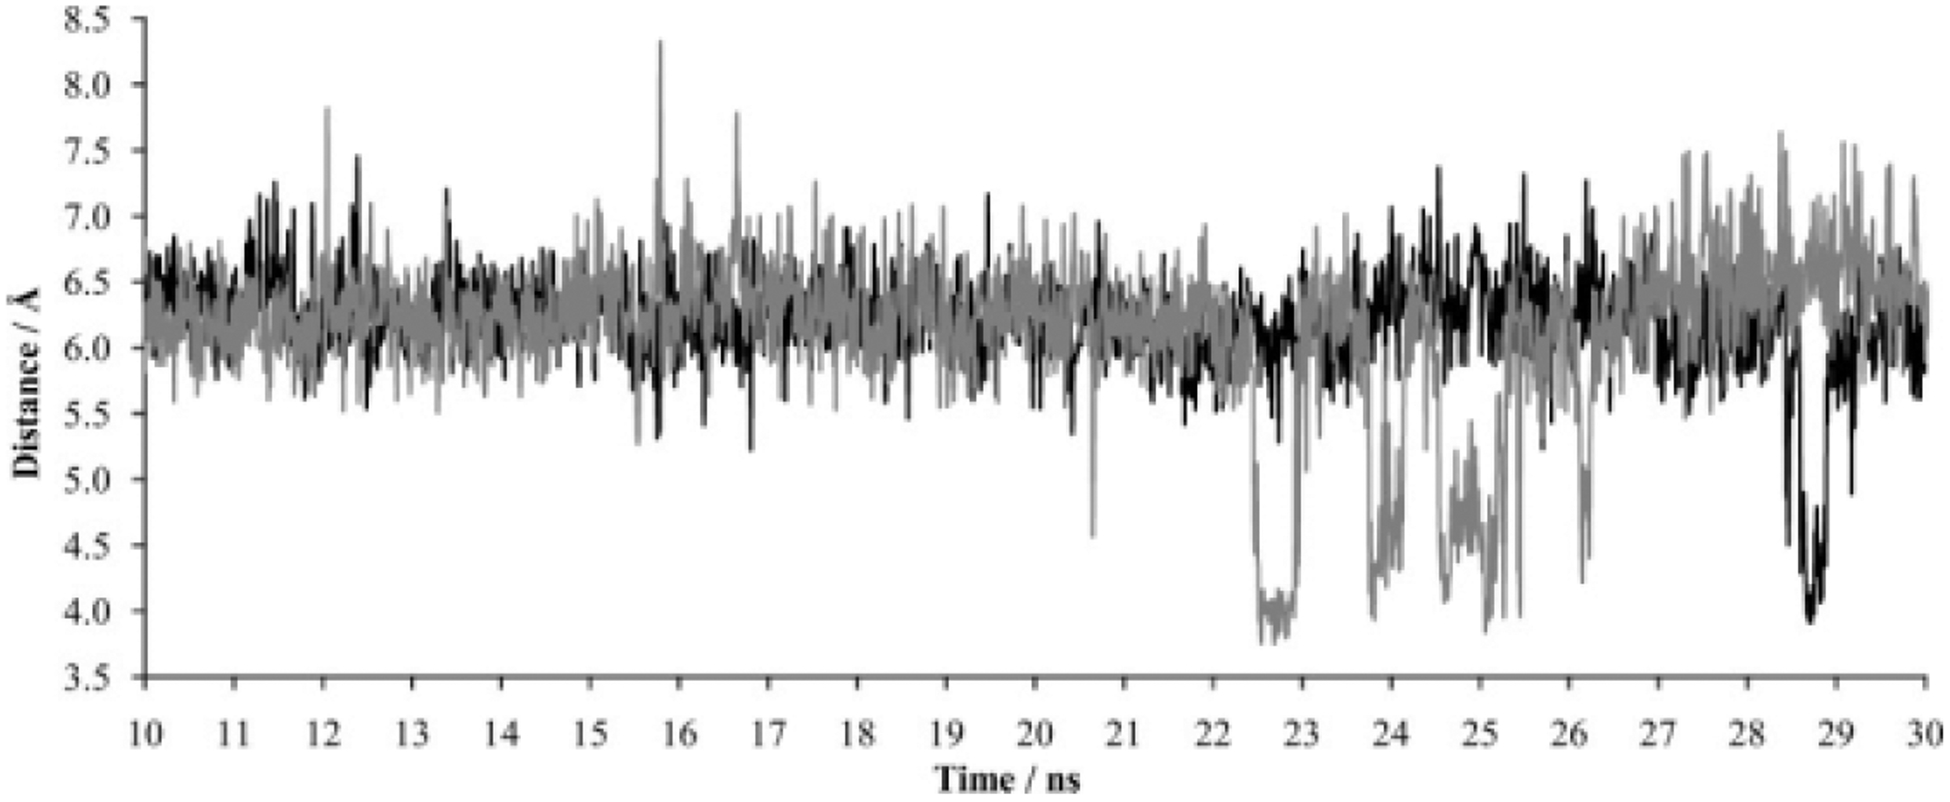
The formation of a salt bridge between DAT residues R85 and D476. The graph reflects the distance between arginine carbon atom CZ and aspartate carbon atom CG during MD simulation in the absence (gray) or presence (black) of the dopamine substrate.
The DAT differences in distance fluctuation and maximum atomic distances are reminiscent of the differences seen for LeuT calculations with and without substrate. In the absence of substrate, increased fluctuation and greater maximum atomic distances may be a conserved mechanism by which extracellular substrate is allowed access to the primary binding pocket when it is unoccupied by substrate. Unlike LeuT, understanding the increased DAT salt bridge formation in the absence of substrate is more complex. Salt bridge formation occurred less frequently in the DAT simulations. Because the atom pair does not form a salt bridge during the vast majority of the present DAT-substrate and DAT–no substrate simulations, the approximately fourfold increase in salt bridge formation in the absence of substrate may be irrelevant. This, however, highlights an important distinction between the LeuT and DAT simulations: salt bridge formation occurred much less frequently with DAT, irrespective of substrate presence in the primary binding pocket. Additional factors, such as substrate binding in the vestibular substrate binding site,23 may be necessary for proper closing of the DAT extracellular gate.
Of interest is a similar study of a LeuT-based DAT homology model that espoused a stable R85-D476 bridge only in the presence of substrate.41 Possible reasons for this discrepancy with the present results are the shorter equilibration time (2.4 nanoseconds vs the present work’s 30 nanoseconds) or differences in the homology model, among other factors. This may be especially relevant for EL2, a DAT model region in which uncertainty is relatively high; the loop is larger than its LeuT counterpart (Fig. 10). Regardless, there is agreement on a larger maximum intervening distance between the atoms with no substrate and an increased fluctuation of distance between the atoms with no substrate. Furthermore, both laboratories support that the surrounding environment mediates formation and breakage of a salt bridge between DAT residues R85 and D476, a phenomenon that can provide an obstacle to substrate entry to the primary binding pocket. The LeuT findings additionally suggest the possibility that a second molecule of dopamine may connect R85 and D476 when the gate is open.24
Figure 10.
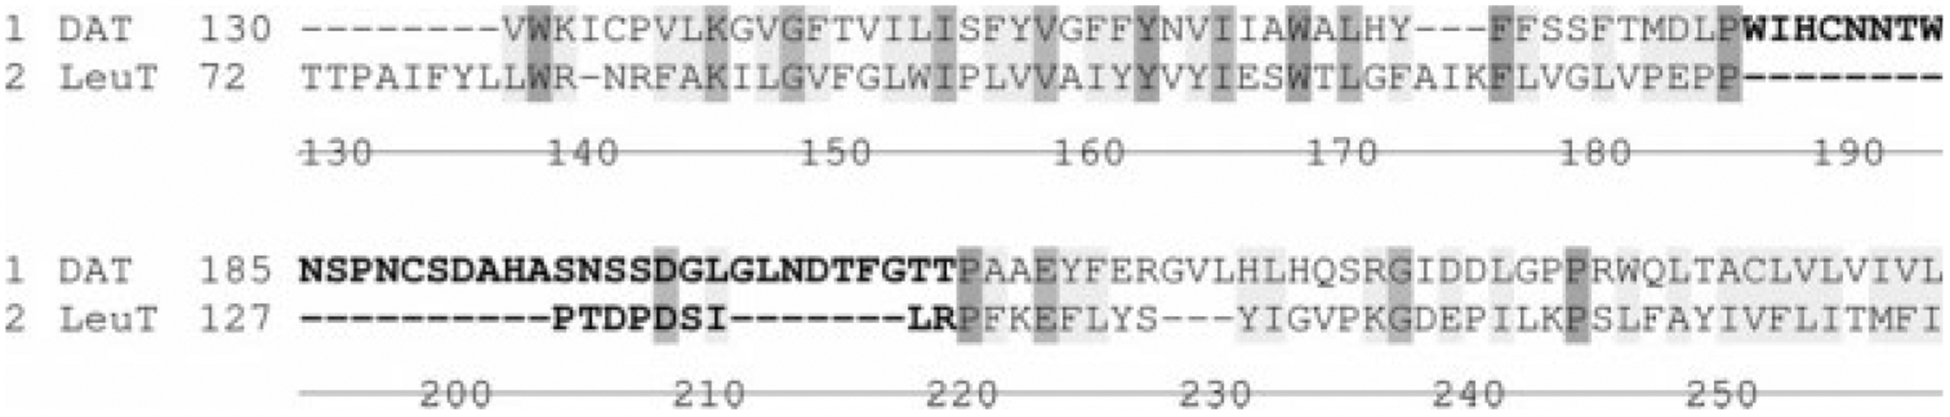
The sequence alignment of LeuT and DAT (consensus strength) highlighting the differences in EL2 for both proteins (bold letters).
DAT loop modeling
Loop modeling and prediction of native conformations represent a complex matter that can be resolved through extensive computational efforts. Comparative modeling packages usually build a starting model of the loop in an “open” conformation (in which one end of the loop is not connected to its succeeding residue) and then close the loop using various algorithms.42 This process is repeated several times using different random starting conformations for the loop. The closed loop is then evaluated by using a score or energy function. Additionally, loops are created in random orders to further evaluate them in the entire model context. For each loop, a contact energy function analyzes a list of loop candidates collected in the segment searching stage, taking into account all atoms already modeled and any atoms specified by the user as belonging to the model environment (e.g., a ligand bound to the template or structural water molecules). These energies are used to make a Boltzmann-weighted choice from the candidates, the coordinates of which are then copied to the model. Once all of the loops have been chosen, the side chains are modeled. Side chain data are assembled from an extensive rotamer library generated by systematic clustering of high-resolution PDB data. These steps render models that are geometrically and stereochemically reliable from a building standpoint (poor alignments cannot be fully overcome by these steps).
The final model selection was based on geometrical similarity between DAT and LeuT as well as Ramachandran plots and other protein health checks. However, because there is a wide region of the EL2 that cannot be modeled based on LeuT, one must rely on models that possess energetically favorable loops following the steps described earlier and that additionally are stereochemically consistent with and geometrically similar to LeuT. Overall, the relatively low average RMSD for DAT and the similarity between the average RMSDs for DAT and LeuT after MD simulation (see earlier) suggest that the DAT loops and model chosen were optimal. Still, it is possible that the equilibrated conformations achieved for both DAT and LeuT during the course of MD simulation are not true equilibria but instead conformations trapped in local energy wells. Future work will further assess this and attempt to explore the possibility of determining different equilibrated conformations following passage through high-energy barriers.
LeuT and DAT extracellular loop 4 (EL4) dynamics
In the crystal structure of LeuT, the EL4 segment consists of two short helices separated by an acute bend and is located between TM 7 and TM 8, positioned across from EL2.13 The EL4 segment has been the focus of investigation because of its location at the mouth of the substrate permeation pore and potential interaction with ligands24 (Fig. 5). In a crystal structure of the LeuT protein containing the substrate leucine and the tricyclic antidepressant (TCA) drug and transport inhibitor desipramine, residues of the EL4 segment hold the inhibitor in place, allowing for desipramine salt bridging with R30 (TM 1) and D404 (TM 10) and locking the extracellular gate.28 Cocrystal structures have shown that other TCAs bind LeuT in the same fashion, about 11Å to the extracellular side of the primary substrate pocket, again showing that interaction with EL4 is crucial for proper TCA-mediated locking of the extracellular gate.27 In DAT, the EL4 segment carries an endogenous Zn2+ binding site.43 Based on the finding that Zn2+ binding at EL4 opens an abnormal ion conductance, the EL4 segment is suggested to have a profound effect on the overall conformation of the transporter.44 Furthermore, mutagenesis studies on human DAT indicate that the EL4-desipramine–binding mechanism is conserved.28 Given the apparent importance of the EL4 region to the substrate bound state, the dynamics of the EL4 region have been assessed by using MD trajectories for both LeuT and DAT in the substrate-bound state.
In MD simulation of LeuT with substrate present, the EL4 region is relatively stable. Little change was observed for any EL4 residues when compared with the analogous residues in the crystallized substrate-bound structure (Fig. 11). Throughout 12 to 30 nanoseconds of simulation, the average RMSD of the EL4 region was 1.55Å ± 0.17Å with a maximum RMSD of 1.82Å. Furthermore, all portions of the EL4 segment (i.e., EL4a, the hairpin, and EL4b) were equally stable. In comparison to LeuT, MD simulation of DAT with substrate present yielded different results for the dynamics of the EL4 region. The average RMSD of the DAT EL4 region as a whole during the 12- to 30-nanosecond time period was 2.68Å ± 0.39Å. Although the slightly higher average RMSD for the EL4 region of the DAT homology model was expected, an analysis of the subsegments of the EL4 region reveals interesting results. The average RMSD for the EL4a, EL4b, and EL4 turn regions during the 12- to 30-nanosecond interval was 3.54Å ± 0.62Å, 1.48Å ± 0.35Å, and 1.18Å ± 0.34Å, respectively. Thus, although the EL4b region and the EL4 turn region remain close to their homology model-assigned helix-turn conformation, the EL4a helix appears to unwind during the course of MD equilibration of DAT with substrate (Fig. 12).
Figure 11.
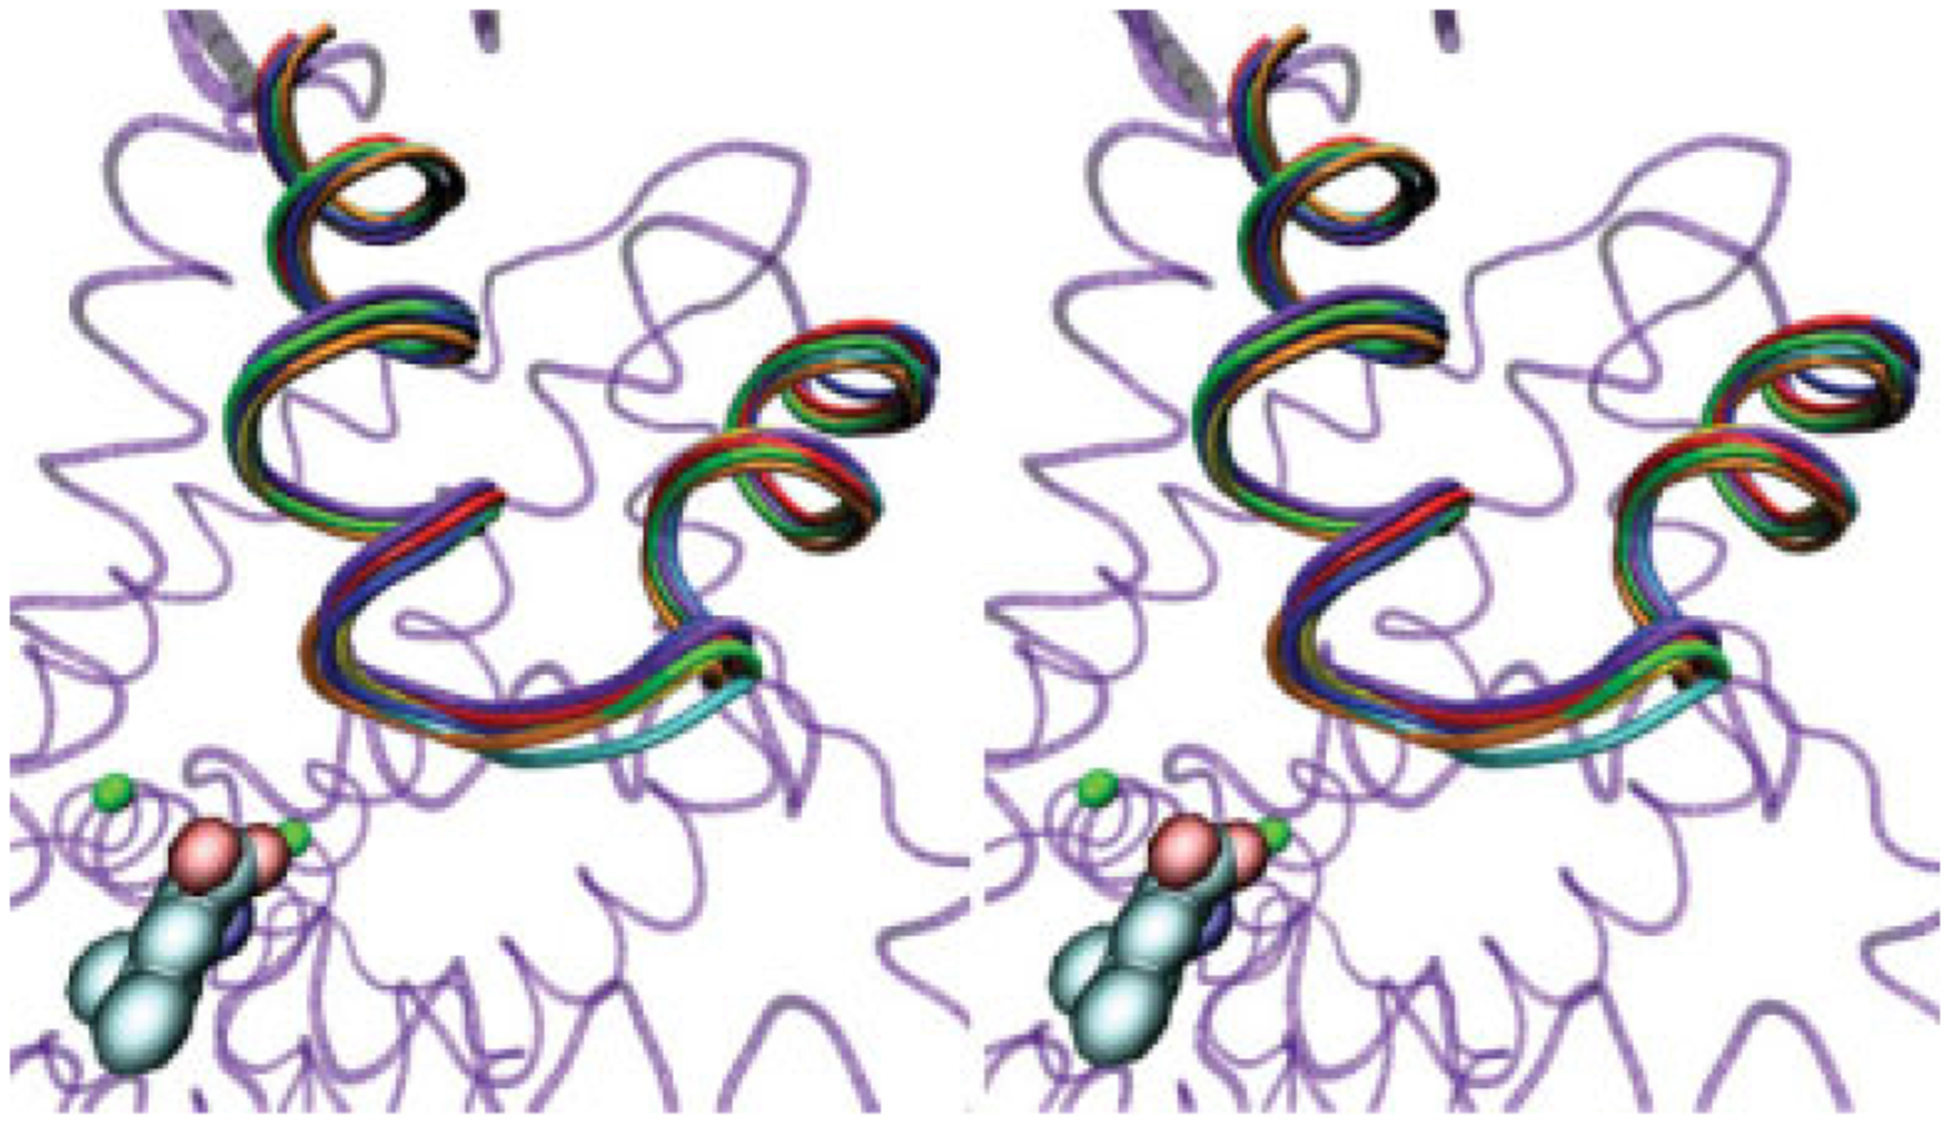
A stereo image showing overlay of the MD trajectory for the LeuT EL4 region in simulation setup with substrate. Different colors represent 3-nanosecond intervals from 12 to 30 nanoseconds (12 nanoseconds, red; 15 nanoseconds, orange; 18 nanoseconds, yellow; 21 nanoseconds, green; 24 nanoseconds, blue; 27 nanoseconds, cyan; and 30 nanoseconds, violet). The background protein (transparent purple) represents LeuT after 30 nanoseconds of equilibration. Leucine substrate (carbon, cyan; oxygen, red; nitrogen, blue) and binding pocket ion (green) are also shown.
Figure 12.
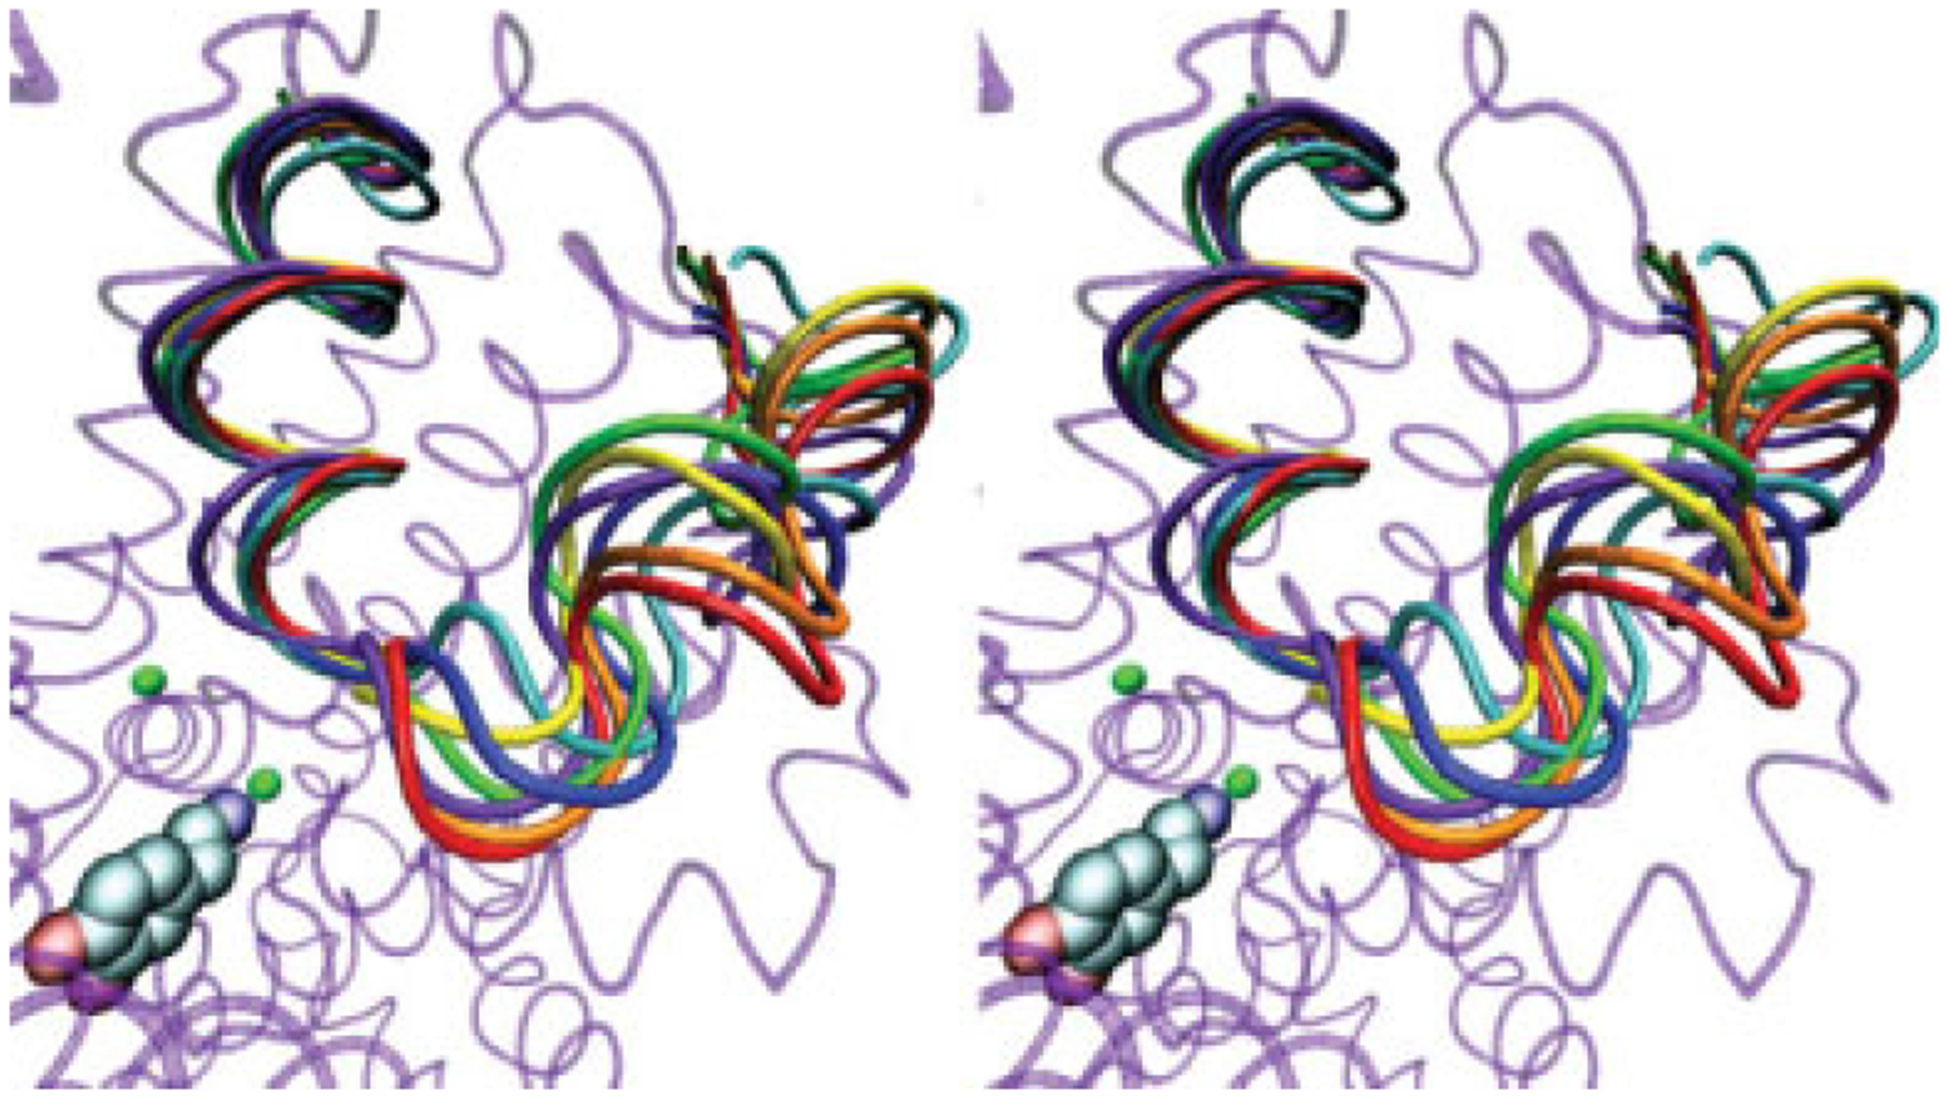
A stereo image showing overlay of the MD trajectory for the DAT EL4 region in simulation setup with substrate. Different colors represent 3-nanosecond intervals from 12 to 30 nanoseconds (12 nanoseconds, red; 15 nanoseconds, orange; 18 nanoseconds, yellow; 21 nanoseconds, green; 24 nanoseconds, blue; 27 nanoseconds, cyan; and 30 nanoseconds, violet). The background protein (transparent purple) represents DAT following 30 ns of equilibration. Dopamine substrate (carbon, cyan; oxygen, red; nitrogen, blue) and binding pocket sodium ions (green) are also shown.
In summary, 30 nanoseconds of MD simulation for LeuT with substrate showed relatively stable EL4 dynamics as compared with the crystal structure, whereas the DAT plus substrate simulation yielded relatively stable EL4b and EL4 turn dynamics but unwinding of the EL4a helix. The unwinding of the EL4a helix in DAT but not LeuT suggests that although the experimental pharmacodynamics of TCA binding to the EL4 region may appear equivalent in LeuT and DAT, the precise mechanism by which TCAs interact with LeuT and DAT may differ on the atomic level.
Dynamics of the LeuT primary binding pocket
In order to further elucidate the mechanism responsible for the transport of leucine through LeuT, comparative MD simulations of the LeuT protein have been performed. By altering the presence of the substrate leucine in the primary binding pocket and the presence of the Na+ ion crystallized closest to the carboxylate group of leucine (Na1), the effects of both substrate and ions on the dynamics of the LeuT primary binding pocket residues were examined. An initial simulation (Table I, Setup 1) contained the substrate bound in the primary binding pocket (S1) and both sodium ions bound in the primary binding pocket (Na1 and Na2) representative of the occluded state in which the transporter was crystallized.13 In order to assess the effect that leucine has on the dynamics of the primary binding pocket, a replica equilibration was designed except with leucine removed from the binding pocket (Table I, Setup 2). Next, the effect of Na1 on primary binding pocket dynamics was assessed in a third simulation in which Na1 was removed, leaving S1 and Na2 intact. The dynamics of the primary binding pocket residues were nearly identical for the three scenarios (Fig. 13). This finding is consistent with the proposed models of leucine translocation through LeuT.23 In brief, this model proposes that the binding of Na1 and Na2 in the primary binding site positions the transporter in the outward-facing state, creating a higher affinity binding site for extracellular leucine. After leucine occupies the primary binding site, the extracellular gate closes, trapping S1 and Na1 but not Na2. S1 and Na1 remain trapped as such until a second leucine molecule binds to the secondary binding pocket (S2), only then allowing for the release of S1 and Na1 to the intracellular region. The significance of S2 binding has also been shown for DAT via a steered molecular dynamics technique that has identified a potential translocation pathway for dopamine. This pathway requires S2 binding in addition to S1 and is supported by the finding that residues key to the translocation mechanism are shown experimentally to be necessary for substrate uptake or efflux.45 Similar work with SERT has likewise successfully explored the translocation pathway after S2 binding.46 The results found here (detailed later) are in accordance with the proposed mechanism of S2 binding necessary for substrate translocation.
Figure 13.
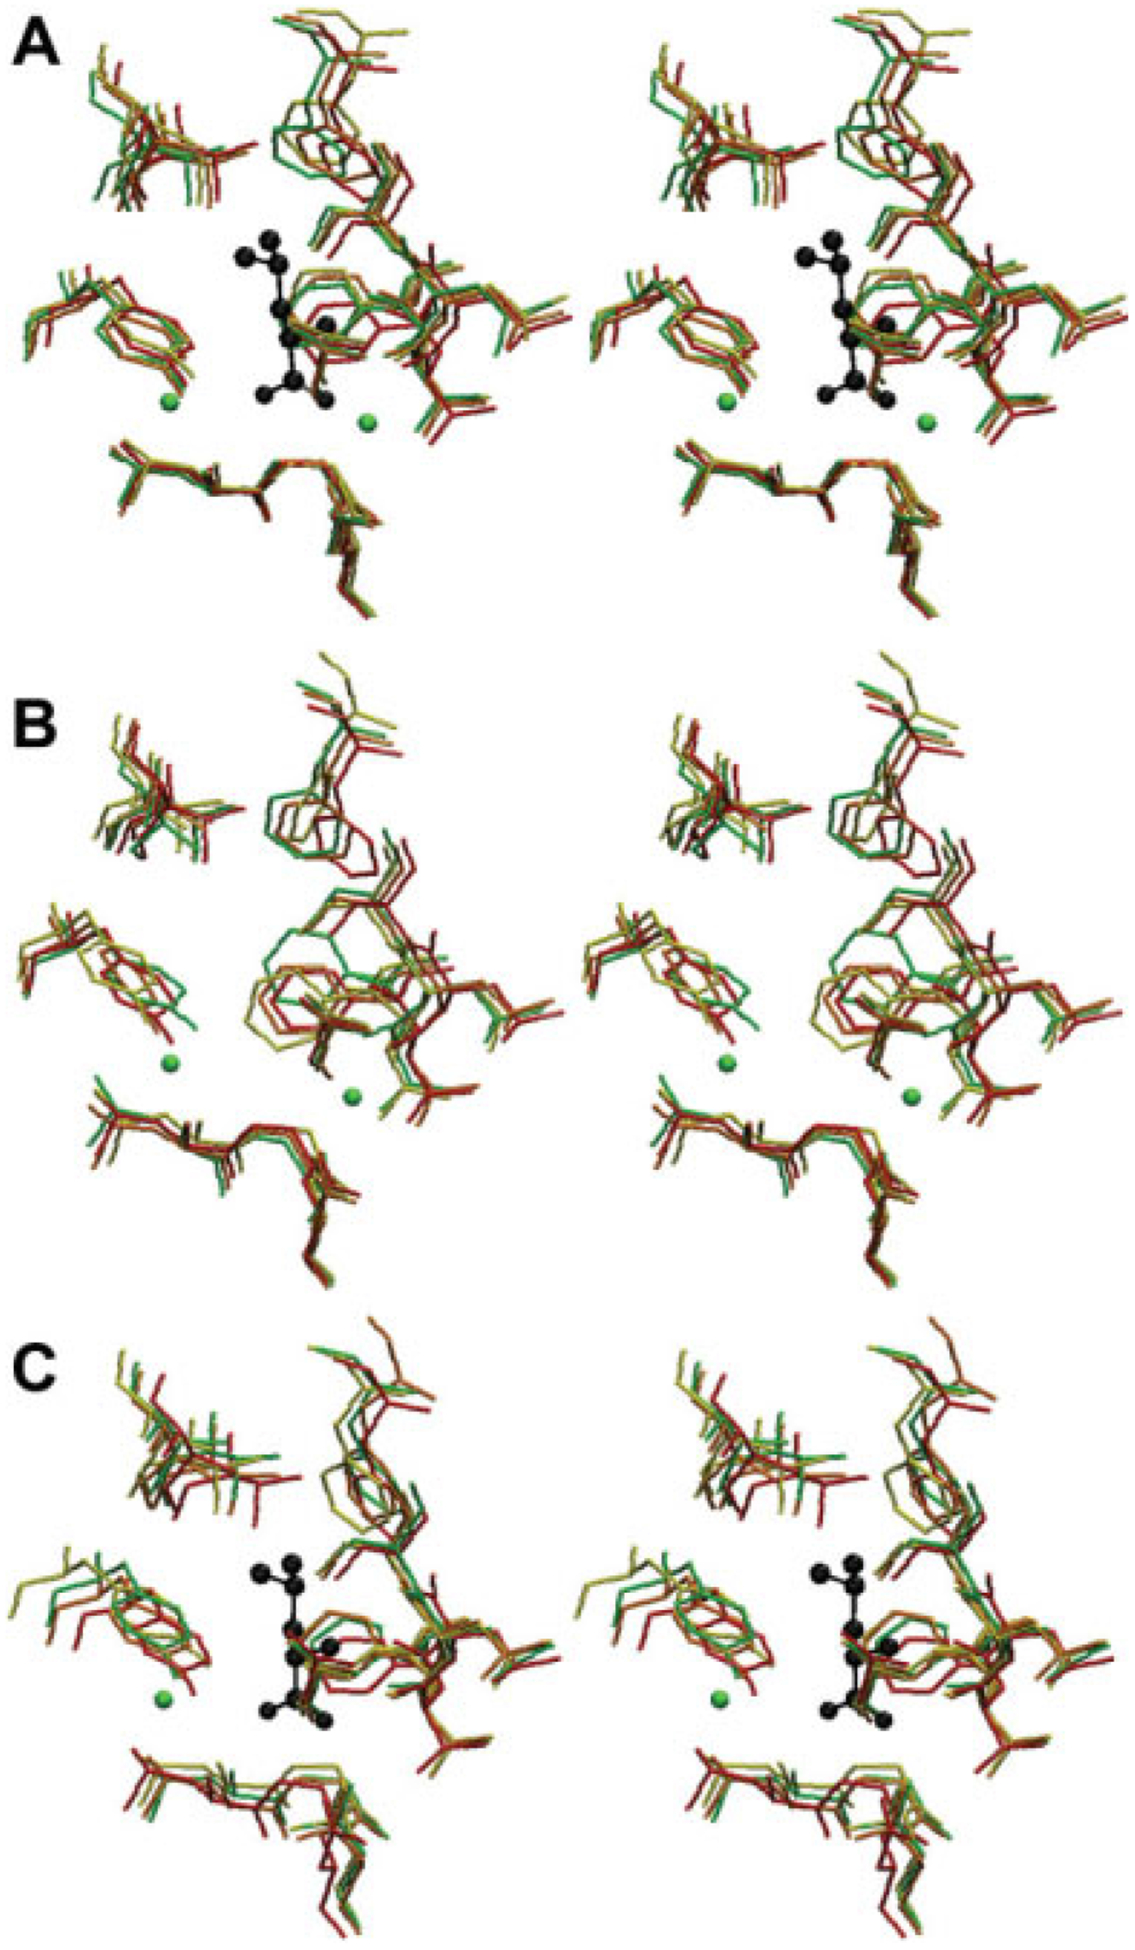
A stereo image of LeuT binding pocket at different intervals of MD simulation. Residues pictured contain at least one atom crystallized within 4.50Å of a nonhydrogen atom found in the coordinates for the crystallized leucine substrate (black). Clockwise from top, the LeuT binding pocket is defined by F259, S256, L255, T254, F253, A22, N27, G26, L25, Y108, and I359. The binding pocket is pictured at 0 (red), 10 (orange), 15 (yellow), and 20 (green) nanoseconds of simulation time. A: MD simulation in the presence of substrate. B: MD simulation in the absence of substrate. C: MD simulation in the presence of substrate but without the sodium ion crystallized closest to the carboxyl group of the substrate.
Here, the +S1+Na1+Na2 simulation shows that S1 does indeed remain trapped in the absence of S2 binding. Over the 20- to 30-nanosecond simulation interval, the leucine substrate in the S1 position has an average RMSD of only 0.46Å ± 0.15Å after a fit of LeuT to the x-ray structure. Furthermore, Na1 remains in proximity to the carboxylate group of leucine. Na2 shows greater deviation from its start position. Accordingly, the presence of Na1 in the primary binding site may allow for a nearby high-affinity binding site for leucine. However, the presence of Na1 alone is insufficient for S1 translocation. Instead, additional driving forces such as the proposed S2 binding (see earlier) are likely required. Although Na2 did not leave the primary binding pocket after 30 nanoseconds of equilibration, its relative position indicates that it is likely to have a free energy similar to that of free Na+ in water. Longer simulation time and a stronger concentration gradient would likely reveal the translocation of Na2 without Na1 or S1 translocation.
A comparison of the 30-nanosecond trajectory for the +S1+Na1+Na2 equilibration and the +S1-Na1+Na2 equilibration yielded nearly identical results for the primary binding pocket residues [Fig. 13(A,B)] but different results for the substrate. In the +S1-Na1+Na2 equilibration, the leucine position fluctuates substantially, whereas in the +S1+Na1+Na2 equilibration the substrate position remains stable (see earlier). Over the 20- to 30-nanosecond simulation interval for the +S1-Na1+Na2 system, the leucine substrate has an average RMSD of 0.72Å ± 0.18Å in the reference frame of the x-ray structure for the transporter, nearly twice that for the simulation that included Na1. This implies that the presence of Na1 is necessary in the binding pocket to ensure substrate stability. Because Na1 is necessary to stabilize the substrate in the binding pocket, it is possible that Na1 plays a role in proper substrate binding pocket entry and subsequent translocation after Na1 displacement.
Analysis of the −S1+Na1+Na2 system in comparison with the +S1+Na1+Na2 and +S1-Na1+Na2 systems again reveals similar primary binding pocket residue dynamics. This further supports the proposed role of Na1 in creating a high-affinity binding site for S1. In the +S1-Na1+Na2 simulation, the substrate itself may force maintenance of position for the primary binding pocket residue side chains. In the simulation lacking substrate, however, the binding pocket residues adopt an identical conformation to that of both simulations containing substrate. This is in accordance with the idea that Na1 supports the formation of a high-affinity binding site for leucine. The formation of this high-affinity binding site may in part be caused by ion-mediated primary binding pocket residue conformational changes as well as direct electrostatic forces between the substrate and ions.
SUMMARY
Movement of both the salt bridge portion and the aromatic portion of the “external gate” was assessed as a function of the presence of substrate and ion cofactors. For both proteins, substrate presence leads to a closure of the gap between the walls of the gate and less fluctuation in the distance between the walls of the gate. Our results for the LeuT MD simulations are in agreement with the results of Celik et al.47 who carried out comparable LeuT MD simulations for an equivalent timeframe.
In the presence of substrate, the LeuT TM 1–TM 10 salt bridge formed more frequently compared with the simulation without substrate. This may help to ensure that the extracellular gate remains closed when substrate is present in the primary binding pocket, preventing possible backflow of substrate to the extracellular region. In the absence of substrate, the formation of the salt bridge is much less regular, with larger intervening distances between the atoms when the salt bridge breaks. The more regular breakage of the salt bridge and larger distances between the atoms when the salt bridge is broken may aid in the opening of the extracellular gate and subsequent entry of substrate. In the DAT, however, salt bridge formation occurs much less frequently as compared with the LeuT and appears to occur irrespective of substrate presence. This may imply that additional factors, such as S2 binding, are necessary for full closure of the DAT extracellular gate.
The MD simulations also show that the dynamics of the aromatic portion of the extracellular gate do not depend on the presence or absence of a bound substrate. Distances between the centers of the aromatic rings were comparable in both simulations with and without substrate. Still, in the absence of substrate, there was a slightly increased fluctuation in distance. The distances between the aromatic walls of the extracellular gate are similar to those found in the “lock-occluded” and “occluded” transporter conformations identified by Singh et al.24 However, we do not see the larger distances between the gate residues as one observes in the “locked-open” conformation. The DAT simulations produced similar results to LeuT; it is anticipated that the DAT will behave similarly in the presence of TCAs as well as competitive inhibitors.
MD simulations of the LeuT transporter have provided a model that can be used effectively for comparison to MD simulations of homologous transporters. Ultimately, this assists in further validation of such homology models. Despite minor atomistic differences in the dynamics of the LeuT and DAT proteins in the present work, there is good overall agreement between the results of simulations with the two proteins, an outcome that is supportive of the validity of the results obtained for the DAT simulations. Accordingly, use of the crystallized LeuT protein to create a homology model as described above for DAT can yield in silico structures that may provide clinically significant results when analyzed and interpreted in conjunction with molecular pharmacologic studies.
REFERENCES
- 1.Mehler-Wex C, Riederer P, Gerlach M. Dopaminergic dysbalance in distinct basal ganglia neurocircuits: implications for the pathophysiology of Parkinson’s disease, schizophrenia and attention deficit hyperactivity disorder. Neurotox Res 2006;10:167–179. [DOI] [PubMed] [Google Scholar]
- 2.Storvik M, Tiihonen J, Haukijarvi T, Tupala E. Nucleus accumbens serotonin transporters in alcoholics measured by whole-hemisphere autoradiography. Alcohol 2006;40:177–184. [DOI] [PubMed] [Google Scholar]
- 3.Haapaniemi T, Ahonen A, Torniainen P, Sotaniemi K, Myllyla V. [I-123]beta-CIT SPECT demonstrates decreased brain dopamine and serotonin transporter levels in untreated parkinsonian patients. Mov Disord 2001;16:124–130. [DOI] [PubMed] [Google Scholar]
- 4.Meyer J, Wilson A, Ginovart N, et al. Occupancy of serotonin transporters by paroxetine and citalopram during treatment of depression: a [11C]DASB PET imaging study. Am J Psychiatry 2001;158:1843–1849. [DOI] [PubMed] [Google Scholar]
- 5.Schroeter S, Apparsundaram S, Wiley R, Miner L, Sesack S, Blakely R. Immunolocalization of the cocaine- and antidepressant-sensitive l-norepinephrine transporter. J Comp Neurol 2000;420:221–232. [PubMed] [Google Scholar]
- 6.Fischer JF, Cho AK. Chemical release of dopamine from striatal homogenates: evidence for an exchange diffusion model. J Pharmacol Exp Ther 1979;208:203–209. [PubMed] [Google Scholar]
- 7.Fleckenstein AE, Volz TJ, Riddle EL, Gibb JW, Hanson GR. New insights into the mechanism of action of amphetamines. Annu Rev Pharmacol Toxicol 2007;47:681–698. [DOI] [PubMed] [Google Scholar]
- 8.Ritz MC, Lamb RJ, Goldberg SR, Kuhar MJ. Cocaine receptors on dopamine transporters are related to self-administration of cocaine. Science 1987;237:1219–1223. [DOI] [PubMed] [Google Scholar]
- 9.Surratt CK, Ukairo OT, Ramanujapuram S. Recognition of psychostimulants, antidepressants, and other inhibitors of synaptic neurotransmitter uptake by the plasma membrane monoamine transporters. Am Assoc Pharmaceu Sci J 2005;7:E739–751. [DOI] [PMC free article] [PubMed] [Google Scholar]
- 10.Rudnick G. Mechanisms of biogenic amine neurotransmitter transporters In: Reith MEA, ed. Neurotransmitter transporters: structure, function, and regulation. Totowa, NJ: Humana Press; 1997. pp 73–100. [Google Scholar]
- 11.Goldberg NR, Beuming T, Soyer OS, Goldstein RA, Weinstein H, Javitch JA. Probing conformational changes in neurotransmitter transporters: a structural context. Eur J Pharmacol 2003;479:3–12. [DOI] [PubMed] [Google Scholar]
- 12.Loland CJ, Norgaard-Nielsen K, Gether U. Probing dopamine transporter structure and function by Zn 2+ -site engineering. Eur J Pharmacol 2003;479:187–197. [DOI] [PubMed] [Google Scholar]
- 13.Yamashita A, Singh S, Kawate T, Jin Y, Gouaux E. Crystal structure of a bacterial homologue of Na1/Cl2-dependent neurotransmitter transporters. Nature 2005;437:215–223. [DOI] [PubMed] [Google Scholar]
- 14.Kanner BI, Zomot E. Sodium-coupled neurotransmitter transporters. Chem Rev 2008;108:1654–1668. [DOI] [PubMed] [Google Scholar]
- 15.Amara SG. Chloride finds its place in the transport cycle. Nat Str Mol Biol 2007;14:792–794. [DOI] [PubMed] [Google Scholar]
- 16.Forrest LR, Tavoulari S, Zhang YW, Rudnick G, Honig B. Identification of a chloride ion binding site in Na+/Cl–dependent transporters. Proc Natl Acad Sci U S A 2007;14:12761–12766. [DOI] [PMC free article] [PubMed] [Google Scholar]
- 17.Zomot E, Bendahan A, Quick M, Zhao Y, Javitch JA, Kanner BI. Mechanism of chloride interaction with neurotransmitter:sodium symporters. Nature 2007;449:726–730. [DOI] [PubMed] [Google Scholar]
- 18.Beuming T, Shi L, Javitch JA, Weinstein H. A comprehensive structure-based alignment of prokaryotic and eukaryotic neurotransmitter/Na+ symporters (NSS) aids in the use of the LeuT structure to probe NSS structure and function. Mol Pharmacol 2006;70:1630–1642. [DOI] [PubMed] [Google Scholar]
- 19.Henry LK, DeFelice LJ, Blakely RD. Getting the message across: a recent transporter structure shows the way. Neuron 2006;49:791–796. [DOI] [PubMed] [Google Scholar]
- 20.Jorgensen AM, Tagmose L, Jorgensen AMM, Bogeso KP, Peters GH. Molecular dynamics simulations of Na+/Cl–dependent neurotransmitter transporters in a membrane-aqueous system. Chem Med Chem 2007;2:827–840. [DOI] [PubMed] [Google Scholar]
- 21.Celik L, Sinning S, Severinsen K, et al. Binding of serotonin to the human serotonin transporter. Molecular modeling and experimental validation. J Am Chem Soc 2008;130:3853–3865. [DOI] [PubMed] [Google Scholar]
- 22.Indarte M, Madura JD, Surratt CK. Dopamine transporter comparative molecular modeling and binding site prediction using the Leu-TAa leucine transporter as a template. Proteins 2008;70:1033–1046. [DOI] [PubMed] [Google Scholar]
- 23.Shi L, Quick M, Zhao Y, Weinstein H, Javitch JA. The mechanism of a neurotransmitter: sodium symporter - inward release of Na+ and substrate is triggered by substrate in a second binding site. Mol Cell 2008;30667–677. [DOI] [PMC free article] [PubMed] [Google Scholar]
- 24.Singh S, Piscitelli C, Yamashita A, Gouaux E. A competitive inhibitor traps LeuT in an open-to-out conformation. Science 2008;332: 1655–1661. [DOI] [PMC free article] [PubMed] [Google Scholar]
- 25.Indarte M, Madura JD, Surratt CK. Comparative molecular modeling of the dopamine transporter using the leucine transporter Leu-TAa as a template Soc Neurosci 2006;A532.5, Atlanta, GA. [Google Scholar]
- 26.Beuming T, Kniazeff J, Bergmann M, et al. The binding sites for cocaine and dopamine in the dopamine transporter overlap. Nat Neurosci 2008;11:780–789. [DOI] [PMC free article] [PubMed] [Google Scholar]
- 27.Singh SK, Yamashita A, Gouaux E. Antidepressant binding site in a bacterial homologue of neurotransmitter transporters. Nature 2007; 448:952–956. [DOI] [PubMed] [Google Scholar]
- 28.Zhou Z, Zhen J, Karpowich NK, Goetz RM, Law CJ, Reith MEA, Wang DN. LeuT-desipramine structure reveals how antidepressants block neurotransmitter reuptake. Science 2007;317:1390–1393. [DOI] [PMC free article] [PubMed] [Google Scholar]
- 29.Rudnick G. What is an antidepressant binding site doing in a bacterial transporter? ACS Chem Biol 2007;2:606–609. [DOI] [PubMed] [Google Scholar]
- 30.Chemical Computing Group. Molecular Operative Environment (MOE), 2008.10. 1255 University Street, Suite 1600, Montreal, Quebec, Canada H3B 3×3: 2008. [Google Scholar]
- 31.Brooks BR, Bruccoleri RE, Olafson DJ, States DJ, Swaminathan S, Karplus M. CHARMM: a program for macromolecular energy, minimization, and dynamics calculations. J Comput Chem 1983;4: 187–217. [Google Scholar]
- 32.MacKerel ADJ, Brooks CL III, Nilsson L, et al. CHARMM: the energy function and its parameterization with an overview of the program (vol 1) The encyclopedia of computational chemistry. Chichester: John Wiley & Sons; 1998. pp 271–7. [Google Scholar]
- 33.(a) Wang J, Cieplak P, Kollman PA. How well does a restrained electrostatic potential (RESP) model perform in calculating conformational energies of organic and biological molecules? J Comput Chem 2000;21:1049–1074. [Google Scholar]; (b) Ponder J, Case D. Force fields for protein simulations. Adv Protein Chem 2003;66:27–85. [DOI] [PubMed] [Google Scholar]
- 34.Raetz C. Enzymology. Genetics, and regulation of membrane phospholipid synthesis in Escherichia coli. Microbiol Rev 1978;42: 615–646. [DOI] [PMC free article] [PubMed] [Google Scholar]
- 35.Humphrey W, Dalke A, Schulten K. VMD-Visual Molecular Dynamics. J Mol Graph 1996;14:33–38. [DOI] [PubMed] [Google Scholar]
- 36.Phillips J, Braun R, Wang W, et al. Scalable molecular dynamics with NAMD. J Comput Chem 2005;26:1781–1802. [DOI] [PMC free article] [PubMed] [Google Scholar]
- 37.MacKerell ADJ, Bashford D, Bellott M, et al. All-atom empirical potential for molecular modeling and dynamics studies of proteins. J Phys Chem B 1998;102:3586–3616. [DOI] [PubMed] [Google Scholar]
- 38.Feller SE, MacKerell ADJ. An improved empirical potential energy function for molecular simulations of phospholipids. J Phys Chem B 2000;104:7510–7515. [Google Scholar]
- 39.Zhang Y, Sham YY, Rajamani R, Gao J, Portoghese PS. Homology modeling and molecular dynamics simulations of the mu opioid receptor in a membrane-aqueous system. Chembiochem 2005;6: 853–859. [DOI] [PubMed] [Google Scholar]
- 40.Claxton D, Quick M, Shi L, et al. Conformational cycle of a bacterial homolog of human neurotransmitter sodium symporters. Biophys J 2009;96:195a. [Google Scholar]
- 41.Huang X, Zhen CG. How dopamine transporter interacts with dopamine: insights from molecular modeling and simulation. Biophys J 2007;93:3627–3639. [DOI] [PMC free article] [PubMed] [Google Scholar]
- 42.Kolodny R, Guibas L, Levitt M, Koehl P. Inverse kinematics in biology: the protein loop closure problem. Int J Rob Res 2005;24: 151–163. [Google Scholar]
- 43.Norregaard L, Visiers I, Loland CJ, Ballesteros J, Weinstein H, Gether U. Structural probing of a microdomain in the dopamine transporter by engineering of artificial Zn2+ binding sites. Biochemistry 2000;39:15836–15846. [DOI] [PubMed] [Google Scholar]
- 44.Mitchell SM, Lee E, Garcia ML, Stephan MM. Structure and function of extracellular loop 4 of the serotonin transporter as revealed by cysteine-scanning mutagenesis. J Bio Chem 2004;27:24089–24099. [DOI] [PubMed] [Google Scholar]
- 45.Jufang S, Yvette D, Javitch AJ, Lei S, Weinstein H. The substrate translocation pathway and transport mechanism in the dopamine transporter. Biophys J 2009;96:594a. [Google Scholar]
- 46.Bhatia A, Shi L, Weinstein H. Probing the cytoplasmic substrate permeation pathway of the serotonin transporter with steered molecular dynamics simulation. Biophys J 2009;96:68a–69a. [Google Scholar]
- 47.Celik L, Schiott B, Tajkhorshid E. Substrate binding and formation of an occluded state in the leucine transporter. Biophys J 2008;94:1600–1612. [DOI] [PMC free article] [PubMed] [Google Scholar]