Abstract
Background
Undernutrition remains a major public health concern affecting both children and adolescents in Ethiopia. However, little attention has been given to the undernutrition of primary school-aged children, with their exclusion within national surveys. Therefore, this systematic review and meta-analysis was conducted to determine pooled estimate and determinant factors of undernutrition among primary school-aged children (6 to 15 years of age) in Ethiopia.
Method
We systematically retrieved available articles on the prevalence of undernutrition in primary school-aged children in Ethiopia by using a number of computerized databases, including PubMed, Scopus, Cochrane Library, Google Scholar, and Science Direct between September 1 and November 25, 2019. Two authors independently extracted relevant data using a standardized data extraction form. Heterogeneity among included studies was assessed with the Cochrane Q test statistics and Higgins I2 tests. The pooled estimates and determinant factors of school-aged undernutrition were assessed with random-effects model using Stata/se Version 14.
Result
We have retrieved 30 eligible articles with pooled sample size of 16,642 primary school- aged children to determine the prevalence of undernutrition in Ethiopia. Hence, the pooled prevalence of stunting, underweight, and wasting were found to be 21.3% (95% CI: 17.0, 25.5), 18.2% (95% CI: 14.4, 22.0) and 17.7% (95% CI, 13.5, 21.8) respectively. Heterogeneity was assessed by doing subgroup analysis for study province/region. Thus, the highest prevalence of stunting was 27.6% (95% CI, 20.7, 34.5) and underweight 22.7% (95% CI, 19.2, 26.3) in Amhara Region while, in the instance of wasting, it was 19.3%(95% CI: 5.1, 33.4) in Southern Nations, Nationalities and People’s Region. Maternal educational status (OR = 1.91, 95% CI: 1.33, 2.73), age of school-aged child (OR = 0.56, 95% CI: 0.44, 0.72) and sex of school-aged child (OR = 0.73, 95% CI: 0.62, 0.85) were found to be significantly associated with stunting. Maternal educational status (OR = 0.6, 95% CI: 0.36, 0.9) and age of school-aged child (OR = 2.74, 95% CI: 1.81, 4.14) were associated with thinness/wasting. Parasitic infection (OR = 2.02, 95% CI: 1.10, 3.73) were associated with underweight of school age children.
Conclusion
The prevalence of stunting and underweight among primary school-aged children are moderately high while acute undernutrition (wasting) is more critical than under-five national average as reported in the 2016 Ethiopian Demography and Health Survey. Therefore, this finding warrants the need to design a school-aged children nutrition survey and expand school feeding programs to improve the nutritional status of primary school-aged children in the country. In addition, emphasis should be given to female school-aged children in the early school years, creating awareness for those mothers who lack formal education, and preventing and treating/deworming parasitic infection. Moreover, researchers must conduct research in province/regions which have not yet studied school aged children’s nutritional status to date.
Keywords: Undernutrition, Primary school-aged children, Stunting, Underweight, Thinness/wasting, Ethiopia
Background
Child nutrition is an index and prerequisite for the national investment in the development of a nation’s future social capital; therefore, ensuring optimal child growth and development is important to accelerate economic development of nations [1, 2]. Undernutrition continues to be a primary cause of disease susceptibility, morbidity, and mortality among school-aged children particularly in resource limited countries which globally accounts for half of all deaths in this cohort [3, 4]. Undernutrition is caused by a lack or imbalance of nutrients in the body. It includes stunting, wasting, and underweight which is a consequence of consuming too few essential nutrients or excreting them more rapidly than they can be replaced [5].
Globally, more than 200 million school-aged children are stunted and underweight which contributes to 2.2 million deaths annually [4]. If an interventional action is not taken, the cognitive and physical impairment will increase to one billion by 2020 [6–8]. Like under-five children, school-aged children are among the most vulnerable segments of the population to undernutrition in Sub-Saharan Africa [6, 9]. Undernutrition among school-aged children results in poor cognitive development, lower school performance, reduced body size, reduced muscular strength, and depleted work capacity [8, 10–13].
Primary school-aged children who are undernourished can exhibit improvement in their growth and development if their environment improves [14–16]. Hence, special attention to proper nutritional surveys or suitable nutritional intervention programmes in a community can provide the baseline upon which to assess the occurrence of undernutrition among primary school-aged children [17]. Therefore, targeted interventions in primary school-aged children can help to complement efforts in the preschool years and can reduce the perpetuation of undernutrition and its effects on health [12].
Therefore, we conducted this systematic review and meta-analysis to bridge the data inconsistencies and gaps in the existing evidence regarding nationally representative undernutrition among primary school-aged children in Ethiopia. This finding will help decision makers and other concerned stakeholders undertake an intensified effort to design a school-centric survey and implement effective and efficient interventions to decrease undernutrition among primary school-aged children.
Methods
Source of evidence
Systematic review and meta-analysis from computerized databases and gray literatures form the evidentiary bases of this study.
Searching strategies and data selection
Preferred reporting items for systematic review and meta-analysis (PRISMA) guidelines were used to prepare and present this systematic reviews and meta-analysis [18]. To identify relevant articles, a comprehensive search between 2006 and September 3, 2019 was performed in the databases of PubMed, Science Direct, Google Scholar, and Cochrane Library. All searches were limited to articles written in English and grey literature was searched through the review of reference lists and hand searches. Moreover, to find unpublished papers, select research centers, including Addis Ababa Digital Library and Saint Mary’s University repositories were searched. Studies identified by our search strategy were retrieved and managed using Endnote X7 (Thomson Reuters, Philadelphia, PA, USA) software. The search was conducted from September 1 to November 25, 2019. During the search process the authors used the following keywords and MeSH terms: prevalence AND undernutrition OR stunting OR wasting OR underweight OR thinness AND associated factor OR determinant factor AND primary school-aged children AND Ethiopia.
Study population
Inclusion criteria
Study area
All studies conducted in Ethiopia.
Study design
All observational study designs reporting the prevalence of undernutrition.
Population
Studies involving primary school-aged children (6–15 years).
Language
Only articles reported in English language.
Publication condition
Published and unpublished articles.
Exclusion criteria
Articles, which were not fully accessible after two-email contacts, were excluded because of inability to assess the quality of articles in the absence of full text.
Data extraction
All relevant articles were screened and extracted by two authors (AA and MM) independently using a standardized data extraction format in Microsoft™ Excel tool adapted from the Joanna Briggs Institute (JBI) [19]. Name of first authors, publication year, study area, study province, study design, mean age, response rate, sample size, and 95% CI prevalence of undernutrition as (stunting, underweight and thinness/wasting) were extracted from all selected full papers.
Quality assessment
In this meta-analysis, the qualities of the included article were assessed using a modified version of the Newcastle-Ottawa Scale for cross-sectional studies adopted from Madhavan et al. [20]. This tool has three main sections. The first section, scored on the basis of one to five stars, focuses on methodological quality of each study (i.e., sample size, response rate, and sampling technique). The second section of the tool considers the comparability of the study cases with a possibility of two stars to be gained. The last section is concerned with the outcomes and statistical analysis of the original study with a possibility of three stars to be gained. In addition, quality appraisal of included studies was evaluated by two authors (MD and MM) independently and any discrepancy was resolved by a third author (MA). Articles attaining a Newcastle-Ottawa Scale (NOS) score of ≥7 stars out of 10 were considered as high quality and eligible for inclusion. In this study, all eligible studies were determined to have high quality scores.
Risk of bias assessment
Two authors (DB and MA) assessed the risk of bias for included articles independently by using the Hoy et al.’s internal and external validity tool for prevalence studies based on a review of the literature [21]. The tool consists of ten items addressing four domains of bias plus a summary risk of bias assessment [21]. Any scoring difference was resolved by discussion mediated by a third author (AM).
Data collection tool used by included studies
All included studies used a structured pre-tested questionnaire for face to face interviews and anthropometric measurement for weight was measured with minimal clothing and no shoes using an electronic beam balance in kilogram (kg) to the nearest of 0.1 kg and length was measured with standing position in centimeters (cm) to the nearest of 1 cm. Finally the anthropometric measures of weight, height, and age values were converted into Z-scores of the indices according to WHO standards [22]. Since the tools used by primary studies are pre-tested and standard measurements were used at various settings, it permits meaningful comparisons.
Outcome assessment
There were two outcomes considered for this systematic review and meta-analysis. The first outcome was to determine the pooled prevalence of undernutrition in terms of stunting, underweight and thinning/wasting among primary school-aged children in Ethiopia. Underweight is reflected when the weight for age is more than 2 standard deviations (SD) below the WHO Child Growth Standards median; stunting reported when height for age is more than 2 SD below of the WHO Child Growth Standards median; and wasting is weight for height is more than 2 SD below the WHO Child Growth Standards median [23].
The second outcome was to identify determinant factors of undernutrition in the form of the log odds ratio. For each factor, the odds ratio was calculated based on the binary outcome data reported by each study. If the factors were not reported in sufficient details across studies (less than two studies), the log odds ratios were not pooled. A narrative synthesis for the reports of systematic reviews was done for quantitative data as forest plots without pooled estimates, which were not appropriate for meta-analysis due to low number. The factors assessed for this review was educational status of mothers (illiterate versus literate), sex of the child (female versus male), age of children (5–10 years versus 10–15), family size (< 5 versus > 5), frequency of meals per day (< 3 versus > 3), infection (yes versus no), source of water (protected versus unprotected), hand washing with soap (yes versus no), and availability of latrine (yes versus no).
Data processing and analysis
A Microsoft™ Excel spreadsheet form was used to present the extracted data from the primary study and further analysis was done by STATA/se™ Version 14 statistical software. The standard error was calculated based on binomial distribution. Heterogeneity was assessed by computing p-values of Higgins’s I2 test statics and Q-statistics among reported prevalence. Higgins’s I2 statistic measures the difference between sample estimates (in percentage) which is due to heterogeneity rather than to sampling error. The pooled effect was estimated with a random effects meta-analysis model. Subgroup analysis was performed based on study province, sample size, and publication year to minimize random variations between the estimates of the primary study. In addition, univariate meta-regression was computed to identify the possible sources of heterogeneity by considering sample size, quality score, and publication year. Publication bias was assessed visually by funnel plot and statistically supported with confirmatory and/or objectivity testing with Egger’s and Begg’s test at a 5% level of significance [24]. Point prevalence, as well as 95% confidence intervals, was presented in a forest plot format. In this plot, the size of each box indicated the weight of the study, while each crossed line referred to a 95% confidence interval with the mean effect at the center. The determinant factors of undernutrition were determined by a log odds ratio at 95% level of significance.
Results
First, 564 studies reported the prevalence of undernutrition and associated factors from the computerized database search. We then excluded 291 articles due to duplication and the remaining 273 studies were assessed for eligibility. A further 146 articles were removed after reading title and abstract. Finally, 30 of 127 articles were found eligible, accessible, and were included for final meta-analysis after reading the full text studies (Fig. 1).
Fig. 1.
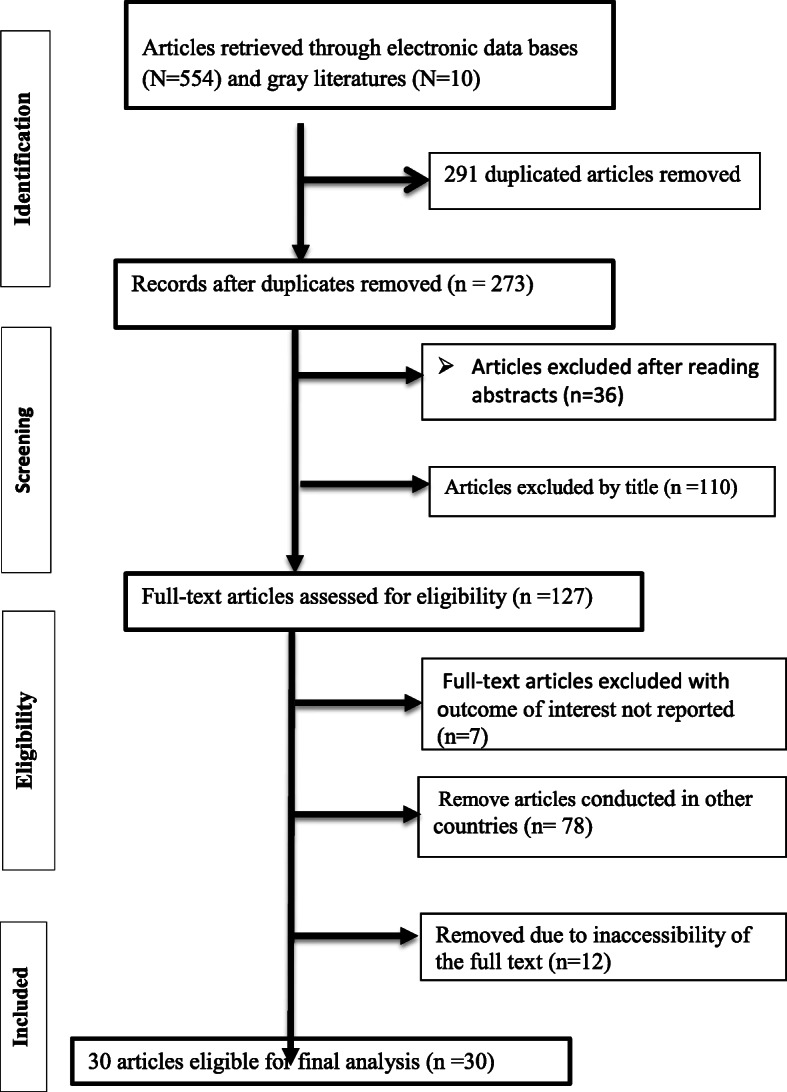
Flow chart of selecting articles for systematic review and meta-analysis to determine undernutrition among primary school-aged children in Ethiopia
Description of included primary studies
As described in Table 1, thirty cross-sectional articles published between 2006 and 2019 were including with a total sample size of 16,642 and a response rate of 97.4%. The smallest sample size was 97 in a study in Gondar, Amhara [32] while the largest sample size was 2241 in a study done at Bahir Dar and Mecha, Amhara [54].
Table 1.
Descriptive summary of 30 articles eligible in the meta-analysis of undernutrition among primary school children in Ethiopia between 2006 and September 2019
| Authors | Publication/year | Region | Study area | Sample | Response | Undernutrition (%) | ||
|---|---|---|---|---|---|---|---|---|
| Stunting | underweight | wasting | ||||||
| Zerfu et al. [25] | 2006 | Addis Ababa | Addis Ababa | 1208 | 100 | 24 | NA | NA |
| Worku et al. [26] | 2009 | Amhara | Gondar | 322 | 100 | 27 | 34.8 | 50 |
| Reji et al. [27] | 2011 | Oromia | Adama | 358 | 99.7 | 12.6 | 7.2 | NA |
| Nguyen et al. [28] | 2012 | Amhara | Angolela | 664 | 95.5 | 11 | 20.8 | 19.6 |
| Amare et al. [29] | 2012 | Amhara | Gondar | 100 | 97 | 23 | 11 | 18 |
| Amare et al. [30] | 2013 | Amhara | Gondar | 405 | 100 | 25 | 15 | 8.9 |
| Mahmud et al. [31] | 2013 | Tigray | Mekelle | 600 | 97.2 | 35 | NA | 34 |
| Kidane et al. [32] | 2014 | Tigray | Wukero | 384 | 100 | 9.4 | 15.4 | 9.9 |
| Mekonnen et al. [33] | 2014 | Oromia | Fincha | 458 | 98.9 | 11.5 | NA | 13.2 |
| Damie et al. [34] | 2015 | Oromia | Chiro | 319 | 91.2 | 7.2 | 24.4 | NA |
| Wolde M et al. [35] | 2015 | SNNP | Dale | 450 | 98.8 | 10.3 | 19 | 14 |
| Alelign et al. [36] | 2015 | Amhara | Durbet | 403 | 95.3 | 11.2 | 27.1 | NA |
| Degarege et al. [37] | 2015 | Addis Ababa | Addis Ababa | 459 | 100 | 19.6 | 15.9 | NA |
| Begna et al. [38] | 2016 | SNNP | Delo-mena | 518 | 95 | 4.5 | 13.6 | 17.1 |
| Zerdo et al. [39] | 2017 | SNNP | Chencha | 406 | 100 | 8.9 | 4.2 | NA |
| Tefera et al. [40] | 2017 | Harerie | Babile | 632 | 100 | 12.8 | NA | 18.1 |
| Birmeka et al. [41] | 2017 | SNNP | Enemorena | 641 | 100 | 39 | 11.8 | 40.9 |
| Wordofa et al. [42] | 2017 | Oromia | Sululeta | 510 | 100 | 10.8 | NA | NA |
| Molla et al. [43] | 2018 | SNNP | Yirgacheffe | 448 | 98.9 | 10.8 | 12.9 | 5.2 |
| Menber et al. [44] | 2018 | Amhara | Haik | 388 | 93.7 | 11.3 | NA | NA |
| Asmare et al. [45] | 2018 | Amhara | Markos | 436 | 98.6 | 27.5 | 20.4 | 8.5 |
| Hailegebriel et al. [46] | 2018 | Amhara | Bair Dar | 422 | 90.5 | 41.6 | 25.9 | 26.7 |
| Tariku et al. [47] | 2018 | Amhara | Arba Minch | 389 | 96 | 41.9 | NA | 8 |
| Enyew et al. [48] | 2018 | Amhara | DebreTabou | 399 | 100 | 32.4 | 24.3 | NA |
| Lisanu et al. [49] | 2018 | Amhara | Mecha | 802 | 99.8 | 37.9 | NA | NA |
| Wolde et al. [50] | 2019 | SNNP | Meskan | 408 | 93 | 16.9 | NA | NA |
| Belay et al. [51] | 2019 | Amhara | Armachiho | 848 | 97.6 | 35.5 | NA | 9.9 |
| Getaneh et al. [52] | 2019 | Amhara | Gondar | 523 | 96.5 | 46.5 | NA | 8.8 |
| Bantie et al. [53] | 2019 | Amhara | BDR | 370 | 98.6 | 15.1 | NA | NA |
| Felek et al. [54] | 2016 | Amhara | Mecha | 2372 | 94.5 | NA | 24.4 | 10.8 |
Regarding the prevalence of undernutrition, the smallest prevalence of stunting was 4.5% [38] while the largest was 46.5% [52]. The prevalence of underweight ranged from 4.2% [39] to 34.8% [26]; whereas wasting (thinness) ranged between 5.2% [43] to 50% [26].
Meta-analysis of undernutrition among primary school children in Ethiopia
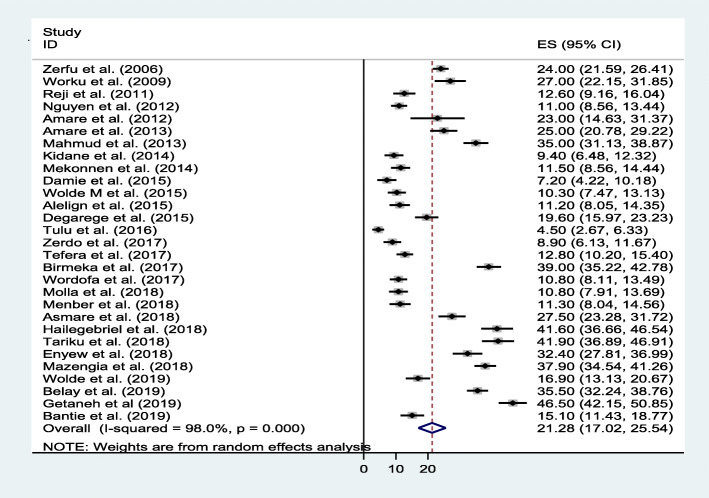
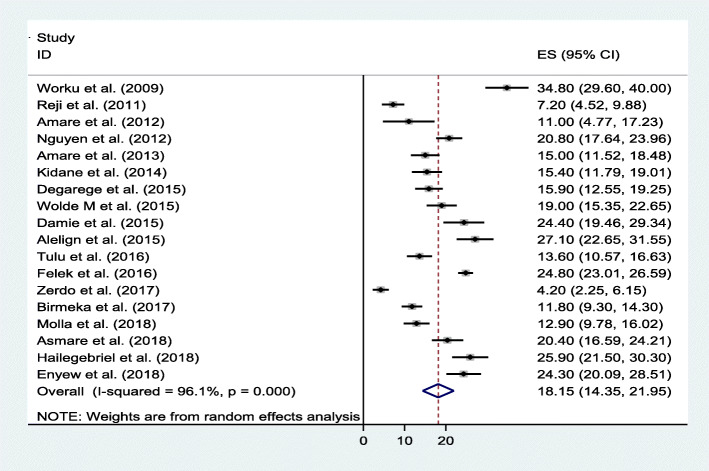
Thirty articles with a pooled sample size of 16,642 school-aged children and response rate of 97.4% were considered in this systematic review and meta-analysis. The pool prevalence of stunting, underweight, and wasting in Ethiopia were 21.3% (95% CI: 17.0, 25.5), 18.2% (95% CI: 14.4, 22.0), and 17.7% (95% CI: 13.5, 21.8) respectively (Figs. 2, 7 & 8).
Fig. 2.
Forest plot of the pooled prevalence of stunting among school-aged children in Ethiopia
Fig. 7.
Forest plot of the pooled prevalence of underweight among school-aged children in Ethiopia
Fig. 8.
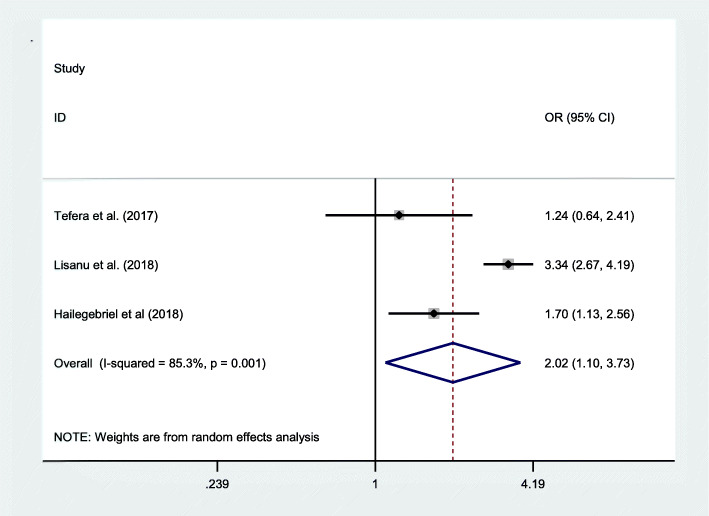
Pooled odd ratio between underweight and parasitic infection
Stunting
The estimated prevalence of stunting among school-aged children in Ethiopia from 29 articles was 21.3%. There was high heterogeneity found within the included articles as revealed in forest plot (I2 = 98%, p < 0.001) (Fig. 2).
Thus, the subgroup analysis in the study province provide the highest prevalence of stunting in Amhara region 27.6% (95% CI: 20.7, 34.5)(I2 = 97.8, p < 0.001) followed by Southern Nations, Nationalities and People’s (SNNP) Region 15.0% (95% CI: 26.5, 23.4)(I2 = 98.2, p < 0.001) and the lowest was noted in Oromia Region 10.5% (95% CI: 8.2, 12.7)(I2 = 54.8, p = 0.084) (Table 2).
Table 2.
Subgroup analysis of primary school children undernutrition (stunting, underweight and wasting) by study province/region of Ethiopia between 2006 and September 2019
| Category of undernutrition | Province/region | Study number | Sample size | Prevalence of undernutrition |
|---|---|---|---|---|
| Stunting | Amhara | 14 | 6471 | 27.6 (20.7,34.5) |
| SNNP | 6 | 2871 | 15 (6.5,23.4) | |
| Oromia | 4 | 1645 | 10.5 (8.2,12.7) | |
| Tigray | 2 | 984 | 2202 (2.9,47.3) | |
| Addis Ababa | 2 | 1667 | 22.0 (17.7,26.3) | |
| Hararie | 1 | 632 | 12.8 (10.2,15.4) | |
| Underweight | Amhara | 10 | 5523 | 22.7 (19.2,26.3) |
| SNNP | 5 | 2463 | 12.2 (7.1,17.2) | |
| Oromia | 2 | 677 | 15.7 (1.2,32.4) | |
| Tigray | 1 | 384 | 15.4 (11.8,19.0) | |
| Addis Ababa | 1 | 459 | 15.9 (12.6,19.3) | |
| Wasting | Amhara | 10 | 6481 | 16.5 (11.7,21.3) |
| SNNP | 4 | 2057 | 19.3 (5.1,33.4) | |
| Oromia | 1 | 458 | 13.2 (10.1,16.3) | |
| Hararie | 1 | 632 | 18.1 (15.121.1) |
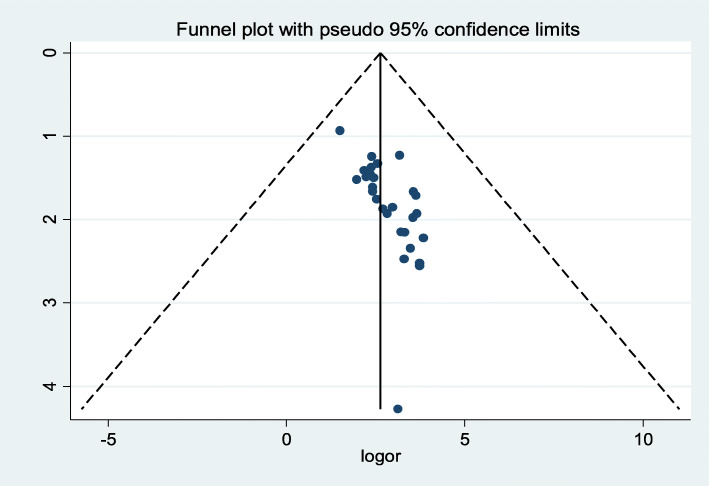
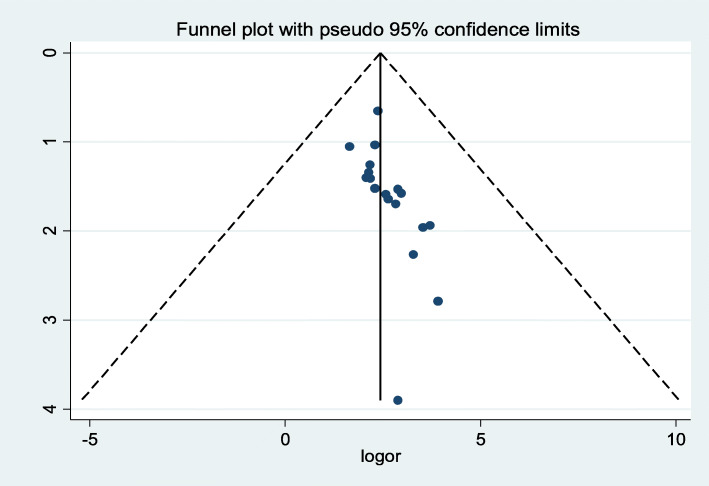
The presence of publication bias was assessed with subjectivity test of bias funnel plot visually and found substantially asymmetric and a further confirmatory test of objectivity to indicate publication bias was done with Egger’s test (p-value < 0.001) (Fig. 3). Even though the funnel plot showed substantial symmetry, the Egger’s test shows presence of bias. Thus, we performed a nonparametric trim and fill analysis to handle the observed publication bias for estimating the number of missing studies that might exist and in reducing and adjusting publication bias in meta-analysis.
Fig. 3.
Funnel plot with 95% confidence limits of the pooled prevalence of stunting among school-aged children in Ethiopia
Factors associated with stunting in Ethiopia
In this systematic review and meta-analysis of stunting in Ethiopia, the associated factors affecting stunting were frequency of meals three times per day with odd ratio of 0.45(95%CI: 0.28, 0.72) and hand washing practice with odds of 0.73(95%CI: 0.48, 1.12) were reported from a single article as a result were not able to generate the pooled estimate. Family size of below five members was reported from three studies with pooled odd ratio of 7.95(95% CI: 0.62, 15.3), which was not found statistically significant.
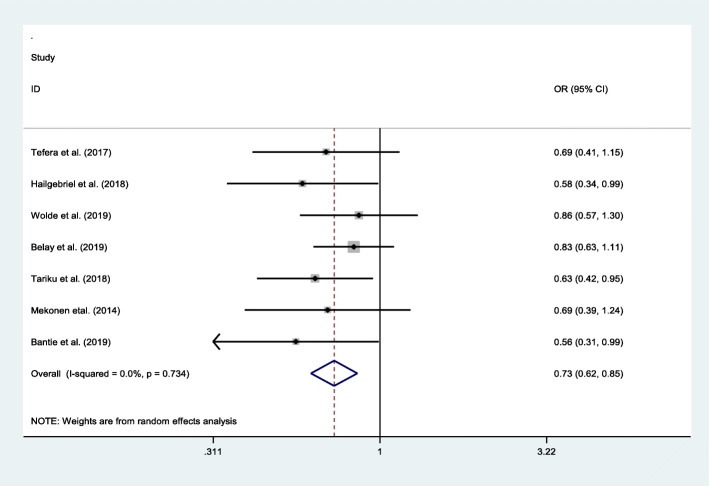
Sex with pooled odd ratio of 0.73 (95% CI: 0.62, 0.85), age of children with pooled odd ratio of 0.56 (95% CI: 0.44, 0.72), and maternal education with pooled odd ratio of 1.91(95% CI: 1.33, 2.73) were found statistically significant. As we have examined the association between sex and stunting among school-aged children from seven [7] studies; the findings showed that sex had an association with prevalence of stunting, with the odds of stunting 27% higher among males as compared to females (OR = 0.73, 95% CI: 0.62, 0.85). The results did not indicate presence of heterogeneity (I2 = 0.0% and p = 0.734) (Fig. 4).
Fig. 4.
Pooled odd ratio between stunting and sex of school-aged children
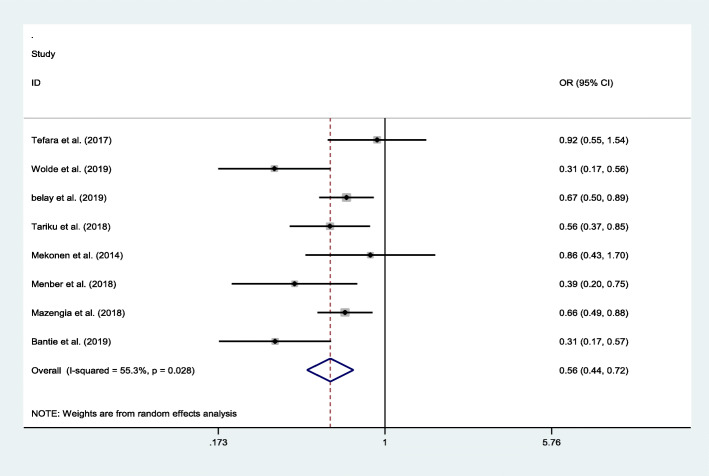
The association between age category and stunting was calculated from eight studies. Accordingly, the odds of stunting was 79% higher among school-aged children less than 10 years of age as compared to children 10–15 years old (OR = 0.56, 95% CI: 0.44, 0.72). The statistics showed moderate heterogeneity (I2 = 55.3% and p = 0.028) across the included studies (Fig. 5).
Fig. 5.
Pooled odd ratio between stunting and school-aged children
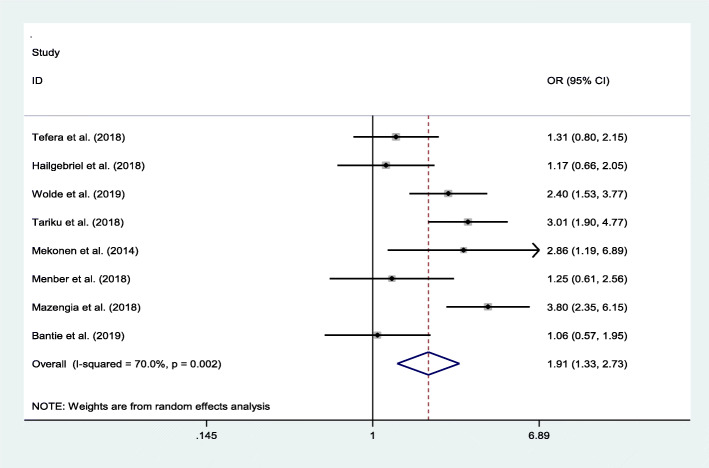
We observed the association between maternal education and stunting from eight studies. The prevalence of stunting was 1.91 times higher among school-aged children whose mothers had no formal education in comparison to the more educated cohort (OR = 1.91, 95% CI: 1.33, 2.73). The resulting statistics showed moderate heterogeneity (I2 = 70% and p = 0.002) across the included studies (Fig. 6).
Fig. 6.
Pooled odd ratio between stunting and maternal educational status
Underweight
Prevalence of underweight in school-aged children in Ethiopia from 18 studies was 18.2%. A high heterogeneity was observed across the included articles as revealed in forest plot (I2 = 96.1%, p < 0.001) (Fig. 7).
Subsequently, subgroup analysis by the study province to indicate source of heterogeneity provides the highest prevalence of underweight at 22.7% (95% CI: 19.2, 26.3) (I2 = 88.1, p < 0.001) in Amhara region followed by 12.2% (95% CI: 7.1, 17.2) (I2 = 94.1, p < 0.001) in SNNP region (Table 2).
Factors associated with underweight in Ethiopia
As we have studied the associated factors of underweight among school-aged children in Ethiopia, we had observed protected source of water and hand washing with soap were reported form only one article as associated factor with underweight with odd ratio of 1.18 (95% CI: 0.7, 1.98) and 2.62 (95% CI: 1.02, 6.72) respectively. Two factors (sex of school-aged children and educational status of mothers) were reported consistently over three different articles but both were not statistically associated with underweight (OR = 1.17, 95% CI: 0.54, 2.56) and (OR = 1.00, 95% CI: 0.44, 2.30) respectively.
The presence of parasitic infection reported from three studies with pooled odd ratio 2.02(95% CI: 1.10, 3.73) was found significantly significant. Thus, the prevalence of underweight was two times higher among those children infected with parasitic infection as compared to non-infected children (Fig. 8).
Wasting
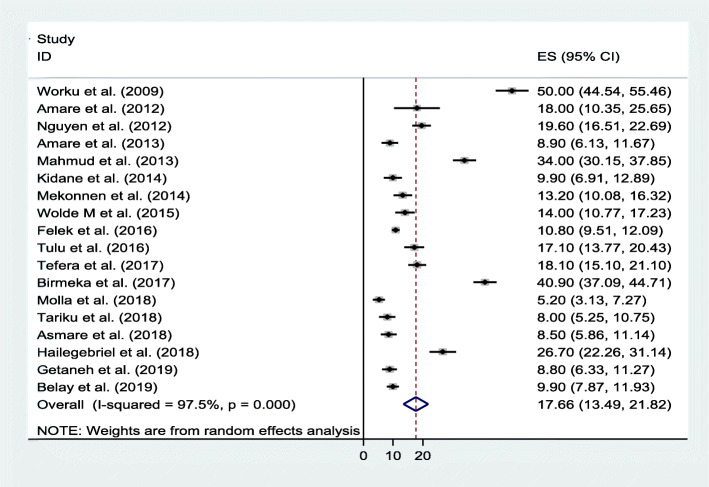
The pooled estimates of wasting in Ethiopia among school-aged children from 18 articles was 17.7% and the heterogeneity between the studies were observed across the included articles as revealed in forest plot (I2 = 97.5%, p < 0.001) (Fig. 9).
Fig. 9.
Forest plot of the pooled prevalence of wasting/thinness among school-aged children in Ethiopia
Accordingly, the subgroup analysis by study province to show source of heterogeneity of wasting among the included articles indicated the highest prevalence of wasting was observed at 19.3% (95% CI: 5.1, 33.4) (I2 = 98.9, p < 0.001) in SNNP followed by 16.5% (95% CI: 11.7, 21.3) (I2 = 96.9, p < 0.001) in Amhara region (Table 2). To determine publication bias, we performed funnel plot to show bias graphically, yielding moderate asymmetry. Further confirmation of bias was assessed with objectivity Egger’s test, the presence of publication bias was noted with (p-value =0.005) (Fig. 10). A nonparametric trim and fill analysis was conducted to handle and adjusting the observed publication bias.
Fig. 10.
Funnel plot with 95% confidence limits of the pooled prevalence of thinness among school-aged children in Ethiopia
Factors associated with wasting in Ethiopia
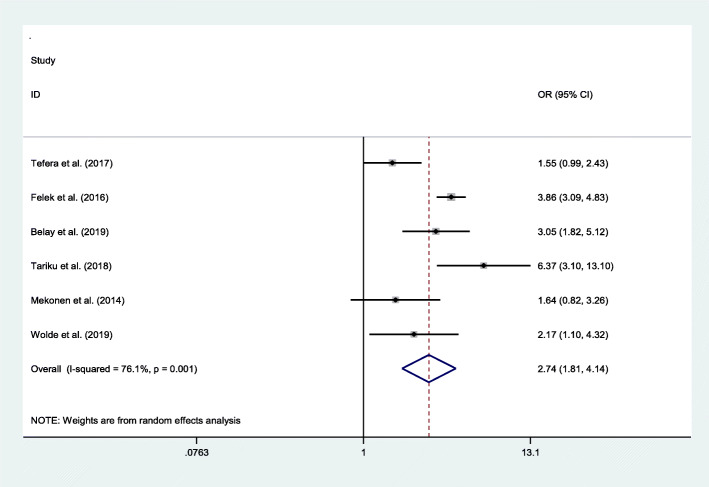
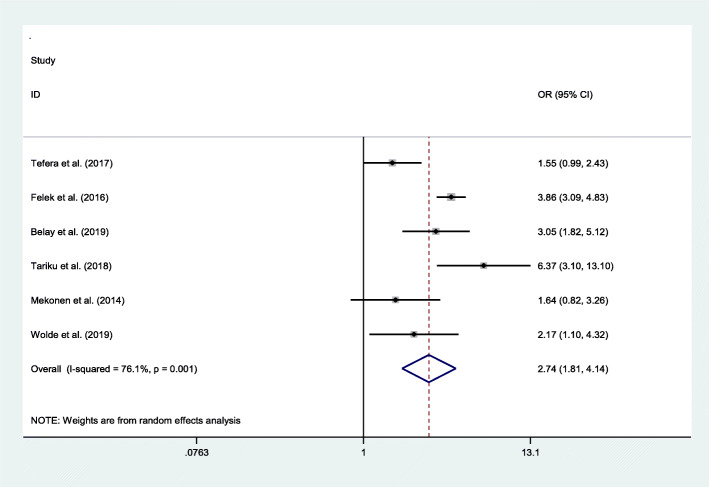
The association between age category and wasting was calculated from six studies. The prevalence of wasting was 2.74 times higher among school-aged children 5 to10 years age as compared to those aged 10 to15 years (OR = 2.74, 95% CI: 1.81, 4.14) from a random effects model. The result of the statistics showed moderate heterogeneity (I2 = 76.1% and p = 0.001) across the studies (Fig. 11).
Fig. 11.
Pooled odds ratios between thinness and maternal educational status
In addition we have calculated the log odds ratio for educational status of mothers on wasting/thinness of school-aged children, finding that the odds of wasting is 1.66 times higher among children at the age of 5 to10 years as compared to 10 to15 years of age (OR = 0.6, 95% CI: 0.36, 0.9). Moderate heterogeneity was observed over the included studies with their respective log odds ratio (I2 = 76.1%, p = 0.001) (Fig. 12).
Fig. 12.
pooled odd ratio between thinness and school-aged children
Discussion
Primary school children are amongst the most vulnerable segments of the population for undernutrition, which is one of the key indicators for improving health, academic performance, and country development. Undernutrition among school-aged children is explained with the three common anthropometric indicators includes height-for-age (stunting), weight-for-age (underweight) and weight-for-height (thinness/wasting) [25]. Hence, the effect of undernutrition on child morbidity and mortality reduction can be determined by considering all undernutrition indicators through appropriate and standard anthropometric measurements [27] making this systematic review and meta-analysis important to show what is currently known about undernutrition among primary school children at the national level.
In our study, the prevalence of stunting, underweight, and wasting/thinness in Ethiopia were found to be 21.3, 18.2 and 17.7% respectively among primary school children. The magnitude of stunting in this study is relatively congruent with the studies conducted in west Bengal 23.0% [28] and Mexico 22.3% [29]; lower than findings from China (25.6%) [30], Indonesia (28.11%) [31] and Egypt (34.2%) [33], and higher than reports from Iraq (18.7%) [34], India (17%) [35] and Nigeria (17.4%) [36]. Underweight school-aged children in Ethiopia (18.2%) in this study showed lower levels from than reports from Bangladesh (43%) [37], Yemen (46.2%) [40], and Nepal (27.4%) [41] but higher than a report from Tanzania (5.7%) [42]. The third anthropometric indicators of undernutrition is wasting (thinness) which, in our study, had higher prevalence than the studies done in the western region of Nepal (12%) [44] and Burkina Faso (13.7%) [45]. In contrast, it is lower than a study from Ghana at 19.4% [46]. The possible explanation for these variations could be attributable to the difference in the parasitic infection, livelihood of the population economy, seasonal, cultural, socio-economical, and geographical diversity.
Parasitic infection is one of the determinate factors for undernutrition as supporting by the studies conducted in different parts of the world [47, 48]. This could be due to parasitic infection competing for the nutritional intake of children resulting in impairment of the immune systems and contributing to susceptibility to many diseases that extend its impact to underweight and cognitive impairment, decreased school attendance [49, 50].
Like the studies conducted in Bangladesh and India [37, 51], the current study found that the odds of undernutrition were higher in children below 10 years as compared to older ones which reflects the nature of stunting as a chronic nutritional problem. This could be due increased risk of intestinal parasitic infection among younger age hand less habit of not washing hands before eating among and cannot protect themselves from parasitic infection sources.
Being male was found to be a higher risk factor for malnutrition similar to previous work conducted in India [51]. This could be male children are usually more mobile and undertake different playing activities that make them loss grater energy from their body. On the other hand, females are usually give more attention to their personal hygiene than males and less mobile in their behavior and stay at home, have more access to different food staff at early age [53].
In addition, maternal educational status is a significant contributing factor for undernutrition. Similar to the studies in Indonesia and Nigeria [31, 36], the odds of undernutrition for primary school children were higher among mothers who had not formal education (illiterate) as compared to the literate cohort. This finding could be explained by educated mothers having better understanding of how to maintain the health of their child and their nutrition with the available resources. They can also contribute greater effort at home and can raise productivity and contributions of the women to the families’ economic situations, bring attention to improved child nutrition, and regulate the family size. As a result, education of girls is education of all and ultimately would be the wise method of reducing undernutrition.
Limitation of the study
This systematic review and meta-analysis included only English language reports which may have restricted inclusion of some locally relevant articles. Some of the studies included in this review had small sample sizes such as 100. This meta-analysis represented only studies reported from five of nine regions (Amhara, Oromia, Tigray, Hararie and SNNP) and one of two administrative towns (Addis Ababa) of the country which could compromise the estimates of nutritional status at the national level.
Conclusion
The prevalence of undernutrition, stunting, and underweight are moderately high while thinness (wasting) is at critical state among primary school children found to be greater than the under-five age group’s national average in 2016 EDHS. Therefore, this finding warrants the design of a school-based nutrition survey and implementation of programs to improve the nutritional status of primary school children in the country. In addition, special emphasis should be given for school aged children in the early stages of school years, creating programs targeting mothers who lack formal education, as well as preventing and early treating/deworming for parasitic infections. Moreover, the researchers try to conduct research on province/regions not yet studied for their school age children nutritional status to date.
Acknowledgements
Authors of primary studies.
Abbreviations
- CI
Confidence Interval
- EDHS
Ethiopian Demography and Health Survey
- JBI
Joanna Briggs Institute
- OR
Odds Ratio
- PRISMA
Preferred Reporting Items for Systematic Review and Meta-Analysis
- SD
Standard Deviation
- SNNP
Southern Nation and Nationality and People
- WHO
World Health Organization
Authors’ contributions
MA: Conception of research protocol, study design, literature review, data extraction, data analysis, interpretation and drafting the manuscript. AA: Study design and contribute on data extraction, quality assessment, data analysis and manuscript review. DB: Literature review, data extraction, data analysis, interpretation and drafting the manuscript. AM: Contribute on data extraction, quality assessment, data analysis and manuscript review. PP: Manuscript review, quality assessment, and language editing. MD: Contribute on Literature review, data extraction, quality assessment, and manuscript review. MM: Contribute on conception, literature review, data extraction, quality assessment. All authors have read and approved the manuscript.
Funding
Not applicable.
Availability of data and materials
Minimal data can be accessed upon request from first author (MAA).
Ethics approval and consent to participate
Not applicable.
Consent for publication
Not applicable.
Competing interests
The authors declare that they have no competing interests.
Footnotes
Publisher’s Note
Springer Nature remains neutral with regard to jurisdictional claims in published maps and institutional affiliations.
References
- 1.Ethiopia free undernutrition. New National Nutrition Programme II envisions an Ethiopia free 2016. Available from: https://unicefethiopia.org/2016/12/20/new-national-nutrition-programme-ii-envisions-an-ethiopia-free-of-malnutrition/.
- 2.Bundy D, Burbano C, Grosh ME, Gelli A, Juke M, Lesley D. Rethinking school feeding: social safety nets, child development, and the education sector: the World Bank. 2009. [Google Scholar]
- 3.WHO . WHO Global database on child growth and malnutrition. 2008. [Google Scholar]
- 4.Black RE, Morris SS, Bryce J. Where and why are 10 million children dying every year? Lancet. 2003;361(9376):2226–2234. doi: 10.1016/S0140-6736(03)13779-8. [DOI] [PubMed] [Google Scholar]
- 5.Hasan I. A study of prevalence of malnutrition in government school children in the field area of Azad nagar Bangalore, India. 2010. [Google Scholar]
- 6.Appleby LJ, Tadesse G, Wuletawu Y, Dejene NG, Grimes JE, French MD, et al. Integrated delivery of school health interventions through the school platform: investing for the future. PLoS Negl Trop Dis. 2019;13(1):e0006449. doi: 10.1371/journal.pntd.0006449. [DOI] [PMC free article] [PubMed] [Google Scholar]
- 7.UNICEF W. Levels and trends in child mortality: report 2011 . Estimates developed by the UN Inter-agency Group for child mortality estimation New York: United Nation’s Children Fund. 2011. [Google Scholar]
- 8.Britto PR, Ulkuer N. Child development in developing countries: child rights and policy implications. Child Dev. 2012;83(1):92–103. doi: 10.1111/j.1467-8624.2011.01672.x. [DOI] [PubMed] [Google Scholar]
- 9.UNICEF . UNICEF The State of the World's Children. 2016. [Google Scholar]
- 10.Grantham-McGregor S, Cheung YB, Cueto S, Glewwe P, Richter L, Strupp B, et al. Developmental potential in the first 5 years for children in developing countries. Lancet. 2007;369(9555):60–70. doi: 10.1016/S0140-6736(07)60032-4. [DOI] [PMC free article] [PubMed] [Google Scholar]
- 11.UNITED NATIONS SYSTEM Standing Committee on Nutrition. Report of the Standing Committee on Nutrition at its Thirty-Third Session 2006. 19]. Available from: http://www.unscn.org/files/Annual_Sessions/33rd_SCN_Session/33rd_session_REPORT.pdf.
- 12.Engesveen K, Shrimpton R. Nutrition education in the context of the United Nations standing committee on nutrition activities and publications, 1985-2006. J Nutr Educ Behav. 2007;39(6):351–356. doi: 10.1016/j.jneb.2007.07.012. [DOI] [PubMed] [Google Scholar]
- 13.Horton S, Alderman H, Rivera JA. The challenge of hunger and malnutrition. Copenhagen Consensus. 2008:3–4.
- 14.Drake L, Maier C, Jukes M, Patrikios A, Bundy D. School-age children: their nutrition and health. SCN News. 2002;25:4–30. [Google Scholar]
- 15.Intiful FD, Ogyiri L, Asante M, Mensah A, Steele-Dadzie R, Boateng L. Nutritional status of boarding and non-boarding children in selected schools in the Accra metropolis. J Biol Agric Healthc. 2013;3(7):156–162. [Google Scholar]
- 16.Frongillo EA., Jr Symposium: causes and etiology of stunting. J Nutr. 1999;129(2S Suppl):S529–S530. doi: 10.1093/jn/129.2.529S. [DOI] [PubMed] [Google Scholar]
- 17.Sunguya B, Koola J, Atkinson S. Infection associated with severe malnutrition among hspitalised children in East Africa. Tanzan J Health Res. 2006;8(3). [DOI] [PubMed]
- 18.Liberati A, Altman DG, Tetzlaff J, Mulrow C, Gøtzsche PC, Ioannidis JP, et al. The PRISMA statement for reporting systematic reviews and meta-analyses of studies that evaluate health care interventions: explanation and elaboration. PLoS Med. 2009;6(7):e1000100. doi: 10.1371/journal.pmed.1000100. [DOI] [PMC free article] [PubMed] [Google Scholar]
- 19.Munn Z, Moola S, Riitano D, Lisy K. The development of a critical appraisal tool for use in systematic reviews addressing questions of prevalence. Int J Health Policy Manag. 2014;3(3):123–128. doi: 10.15171/ijhpm.2014.71. [DOI] [PMC free article] [PubMed] [Google Scholar]
- 20.Madhavan A, LaGorio L, Crary M, Dahl W, Carnaby G. Prevalence of and risk factors for dysphagia in the community dwelling elderly: a systematic review. J Nutr Health Aging. 2016;20(8):806–815. doi: 10.1007/s12603-016-0712-3. [DOI] [PubMed] [Google Scholar]
- 21.Hoy D, Brooks P, Woolf A, Blyth F, March L, Bain C, et al. Assessing risk of bias in prevalence studies: modification of an existing tool and evidence of interrater agreement. J Clin Epidemiol. 2012;65(9):934–939. doi: 10.1016/j.jclinepi.2011.11.014. [DOI] [PubMed] [Google Scholar]
- 22.WHO. AnthroPlus for Personal Computers manual Software for assessing growth of the world's children and adolescents 2009. Available from:https://www.who.int/growthref/tools/ who_anthroplus_manual.pdf.
- 23.World Health Organization. WHO child growth standards: length/height-for-age, weight-for-age, weight-for-length, weight-for-height and body mass index-for-age: methods and development. 2006.
- 24.Borenstein MHL, Higgins J, Rothstein HR. A basic introduction to fixed-effect and random-effects models for meta-analysis. Res Synth Methods. 2010;1(2):97–111. doi: 10.1002/jrsm.12. [DOI] [PubMed] [Google Scholar]
- 25.Wamani H, Åstrøm AN, Peterson S, Tumwine JK, Tylleskär T. Predictors of poor anthropometric status among children under 2 years of age in rural Uganda. Public Health Nutr. 2006;9(3):320–326. doi: 10.1079/phn2006854. [DOI] [PubMed] [Google Scholar]
- 26.Worku N, Erko B, Torben W, Belay M, Kasssu A, Fetene T, et al. Malnutrition and intestinal parasitic infections in school children of Gondar, north West Ethiopia. Ethiop Med J. 2009;47(1):9–16. [PubMed] [Google Scholar]
- 27.Olaf M, Michael K. Malnutrition and health in developing countries. Can Med Assoc J. 2005;2:173. doi: 10.1503/cmaj.050342. [DOI] [PMC free article] [PubMed] [Google Scholar]
- 28.Bose K, Bisai S. Prevalence of underweight and stunting among school children in West Bengal. Indian J Pediatr. 2008;75(12):1272. doi: 10.1007/s12098-008-0167-6. [DOI] [PubMed] [Google Scholar]
- 29.Monarrez-Espino J, Martinez H, Martínez V, Greiner T. Nutritional status of indigenous children at boarding schools in northern Mexico. Eur J Clin Nutr. 2004;58(3):532. doi: 10.1038/sj.ejcn.1601840. [DOI] [PubMed] [Google Scholar]
- 30.Shang Y, Tang L-H, Zhou S-S, Chen Y-D, Yang Y-C, Lin S-X. Stunting and soil-transmitted-helminth infections among school-age pupils in rural areas of southern China. Parasit Vectors. 2010;3(1):97. doi: 10.1186/1756-3305-3-97. [DOI] [PMC free article] [PubMed] [Google Scholar]
- 31.Yasmin G, Kustiyah L, Dwiriani CM. Risk factors of stunting among school-aged children from eight provinces in Indonesia. Pak J Nutr. 2014;13(10):557–566. [Google Scholar]
- 32.Kidane E, Menkir S, Kebede A, Desta M. Prevalence of intestinal parasitic infections and their associations with anthropometric measurements of school children in selected primary schools, Wukro town, eastern Tigray, Ethiopia. Int J Curr Microbiol App Sci. 2014;3(3):11–29. [Google Scholar]
- 33.Abdel Wahed WY, Hassan SK, Eldessouki R. Malnutrition and its associated factors among rural school children in Fayoum governorate, Egypt. J Environ Public Health. 2017;2017. [DOI] [PMC free article] [PubMed]
- 34.Al Saffar AJ. Stunting among primary-school children: a sample from Baghdad, Iraq. 2009. [PubMed] [Google Scholar]
- 35.Bose K, Bisai S, Mukherjee S. Anthropometric characteristics and nutritional status of rural school children. Internet J Biol Anthropol. 2008;2(1).
- 36.Senbanjo IO, Oshikoya KA, Odusanya OO, Njokanma OF Prevalence of and risk factors for stunting among school children and adolescents in Abeokuta, southwest Nigeria. J Health Popul Nutr. 2011;29(4):364. doi: 10.3329/jhpn.v29i4.8452. [DOI] [PMC free article] [PubMed] [Google Scholar]
- 37.Ahsan KZ, El Arifeen S, Al-Mamun MA, Khan SH, Chakraborty N. Effects of individual, household and community characteristics on child nutritional status in the slums of urban Bangladesh. Arch Public Health. 2017;75(1):9. doi: 10.1186/s13690-017-0176-x. [DOI] [PMC free article] [PubMed] [Google Scholar]
- 38.Begna T, Solomon T, Yohannes ZENEBEEA. Intestinal parasitic infections and nutritional status among primary school children in Delo-mena district, south eastern Ethiopia. Iran J Parasitol. 2016;11(4):549. [PMC free article] [PubMed] [Google Scholar]
- 39.Zerdo Z, Yohanes T, Tariku B, Teshome T. Association between nutritional status and soil-transmitted helminthes re-infection among school-age children in Chencha district, southern Ethiopia: a cross-sectional study. Transl Biomed. 2017;8(2):111. [Google Scholar]
- 40.Al-Sobaihi S, Nakamura K, Kizuki M. Undernutrition among children under 5 years of age in Yemen: role of adequate childcare provided by adults under conditions of food insecurity. J Rural Med. 2016;11(2):47–57. doi: 10.2185/jrm.2915. [DOI] [PMC free article] [PubMed] [Google Scholar]
- 41.Gaurav K, Poudel I, Bhattarai S, Pradhan P, Pokharel P. Malnutrition status among Under-5 children in a hill Community of Nepal. Kathmandu Univ Med J. 2014;12(4):264–268. doi: 10.3126/kumj.v12i4.13732. [DOI] [PubMed] [Google Scholar]
- 42.Juma OA, Enumah ZO, Wheatley H, Rafiq MY, Shekalaghe S, Ali A, et al. Prevalence and assessment of malnutrition among children attending the reproductive and child health clinic at Bagamoyo District hospital, Tanzania. BMC Public Health. 2016;16(1):1094. doi: 10.1186/s12889-016-3751-0. [DOI] [PMC free article] [PubMed] [Google Scholar]
- 43.Molla E, Mamo H. Soil-transmitted helminth infections, anemia and undernutrition among schoolchildren in Yirgacheffee, South Ethiopia. BMC Res Notes. 2018;11(1):585. doi: 10.1186/s13104-018-3679-9. [DOI] [PMC free article] [PubMed] [Google Scholar]
- 44.Hs J, Gupta R, Joshi M, Vipul M. Determinants of nutritional status of school children-a cross sectional study in the western region of Nepal. Njirm. 2011;2(1):1–13. [Google Scholar]
- 45.Daboné C, Delisle HF, Receveur O. Poor nutritional status of schoolchildren in urban and peri-urban areas of Ouagadougou (Burkina Faso) Nutr J. 2011;10(1):34. doi: 10.1186/1475-2891-10-34. [DOI] [PMC free article] [PubMed] [Google Scholar]
- 46.Agbozo F, Atitto P, Abubakari A. Nutritional status of pupils attending public schools with and without school feeding programme in Hohoe municipality GHANA. 2017. [Google Scholar]
- 47.Nokes C, Bundy DA. Does helminth infection affect mental processing and educational achievement? Parasitol Today (Personal ed) 1994;10(1):14–18. doi: 10.1016/0169-4758(94)90348-4. [DOI] [PubMed] [Google Scholar]
- 48.Nokes C, Grantham-McGregor S, Sawyer A, Cooper E, Bundy D. Parasitic helminth infection and cognitive function in school children. Proc R Soc Lond Ser B Biol Sci. 1992;247(1319):77–81. doi: 10.1098/rspb.1992.0011. [DOI] [PubMed] [Google Scholar]
- 49.Nyaruhucha C, Mamiro P, Kerengi A, Shayo N. Nutritional status of underfive children in a pastoral community in Simanjiro District, Tanzania. Tanzan J Health Res. 2006;8(1):32–36. doi: 10.4314/thrb.v8i1.14268. [DOI] [PubMed] [Google Scholar]
- 50.Hadidjaja P, Bonang E, Suyardi MA, Abidin SA, Ismid IS, Margono SS. The effect of intervention methods on nutritional status and cognitive function of primary school children infected with Ascaris lumbricoides. Am J Trop Med Hyg. 1998;59(5):791–795. doi: 10.4269/ajtmh.1998.59.791. [DOI] [PubMed] [Google Scholar]
- 51.Sonkaria L, Zafer A, Gaur KL, Manohar RK. Maternal factors associated with nutritional status of 1–5 years children residing in field practice area of rural health training Centre Naila, Jaipur (Rajasthan) India. Natl J Community Med. 2014;5(3):283–287. [Google Scholar]
- 52.Getaneh Z, Enawgaw B, Engidaye G, Seyoum M, Berhane M, Abebe Z, et al. Prevalence of anemia and associated factors among school children in Gondar town public primary schools, Northwest Ethiopia: a school-based cross-sectional study. PLoS One. 2017;12(12):e0190151. doi: 10.1371/journal.pone.0190151. [DOI] [PMC free article] [PubMed] [Google Scholar]
- 53.Alelign T, Degarege A, Erko B. Prevalence and factors associated with undernutrition and anaemia among school children in Durbete town, Northwest Ethiopia. Arch Public Health. 2015;73(1):34. doi: 10.1186/s13690-015-0084-x. [DOI] [PMC free article] [PubMed] [Google Scholar]
- 54.Feleke BE. Nutritional status and intestinal parasite in school age children: a comparative cross-sectional study. Int J Pediatr. 2016;2016. [DOI] [PMC free article] [PubMed]
Associated Data
This section collects any data citations, data availability statements, or supplementary materials included in this article.
Data Availability Statement
Minimal data can be accessed upon request from first author (MAA).


