

Abstract
The ground (S0) and excited triplet (T1) electronic states and corresponding optical spectra of a series of cationic complexes [RuH(CO)L(PPh3)2]+ (L=2,2´-bipyridyl) (Rubpy), 4,4´-dicarboxylic-2,2´-bipyridyl (Rudcbpy), bis-4,4’-(N-methylamide)-2,2´-bipyridyl (Rudamidebpy), bis-4,4’-(methyl)-2,2´-bipyridyl (RudMebpy), [Ru(CO)2dcbpy(PPh3)2]2+ (Ru(2CO)dcbpy), and [Ru(H)2dcbpy(PPh3)2] (Ru(2H)dcbpy) have been studied by combined Density Functional/Time-Dependent Density Functional (DFT/TDDFT) techniques using different combinations of DFT exchange-correlation functionals and basis sets. PBE0/LANL2DZ provided more accurate geometries to describe S0 whereas B3LYP/LANL2DZ predicted spectral energies that correlated better with the available experiment data. The Ru (II) complexes with different substituents emit photons ranging from 560–610 nm in the series RudMebpy, Rubpy, Rudamidebpy, Rudcbpy. The calculations predicted a maximum emission at about 540 nm for the complex constructed from two carbonyl π-acceptors ligands trans to the dcbpy, while an emission in the far infrared region is calculated when two H σ-donor ligands trans to the dcbpy. Our calculation results show correlations between HOMO-LUMO energy gap, Stokes shift, and T1 distortion, which reflect the different effects of electron-withdrawing and donating groups. We proposed that these correlations can be used to predict the photophysical properties for new complexes.
Keywords: Ru mono-diimine complexes, Triplet excited state, Stokes shift, HOMO-LUMO energy gap, trans influence, Density Functional Theory
Graphical abstract
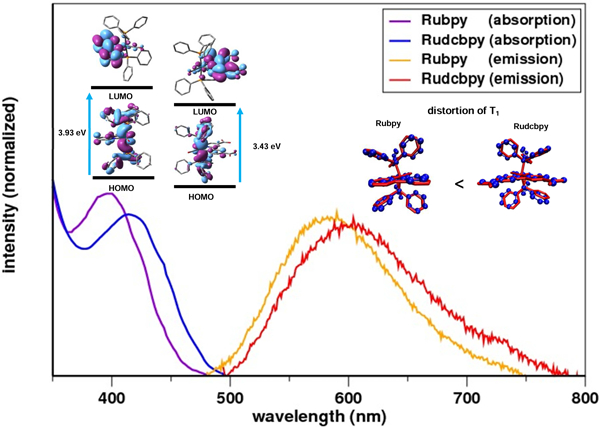
The correlation between HOMO-LUMO energy gap, absorption and emission energies, Stokes shift, and the geometric distortion in the triplet excited state (T1) as a result of introducing electron-withdrawing substituent (-COOH) (Rudcbpy) in [RuH(CO)bpy(PPh3)2]+ (Rubpy).
1. Introduction
Ruthenium (II) poly-diimine complexes have received significant attention in recent years [1–4], particularly in applications such as dye-sensitized solar cells, artificial photocatalysis, DNA diagnostics, and as potential agents for the detection of different biological analytes of clinical and environmental interest [1, 5–12]. Additionally, ruthenium diimine (2,2´-bipyridyl) complexes containing hydride, carbonyl and triphenylphosphine (PPh3) ligands have been used as catalysts for hydrogenation of unsaturated organic compounds [13–17]. The importance of these complexes comes from their unique photophysical and photochemical properties.
The push-pull from ruthenium as a strong oxidant that donates an electron from the t2g orbital to the bpy low-lying π* molecular orbital, results in a singlet ground-state (S0) to singlet metal-to-ligand charge-transfer (1MLCT) transitions. The emission after excitation of the 1MLCT band has a large Stokes shift, typically on the order of 150 nm or 6,000 cm−1 in the visible-to-near IR region of the spectrum, and has a long decay time, ranging from 100 ns to 10 µs; the Stokes shift and long-lived intensity decay are characteristic of triplet state (3MLCT) emissions [1–4]. Additionally, ruthenium complexes exhibit reversible redox behavior with adjustable potentials [18–20].
Tuning the emission wavelength of the transition metals complexes over the visible range is desirable for applications such as organic light-emitting devices (OLEDs) [21], luminescence-based sensors [22], and photocatalysis [23]. Therefore, several modification strategies have been applied to control the HOMO-LUMO energy gap: taking advantage of the substituent effects on the ligand parent by changing the ligand parent entirely or by varying the ligands trans to the ligand parent [21–27]. For example, tuning molecular orbital energies with a variety of substituents has been reported for Ir (III), Pt (II), and dyes for dye-sensitized solar cells [25–27].
Density functional theory (DFT) combined with the time-dependent DFT (TD-DFT) calculations have been employed to study the photophysical properties of different transition metal systems, and the calculated excitation energies agree well with the experimental data [25, 28–29]. This agreement between theory and experiment demonstrates the power of these calculations to provide reliable predictions about the nature of the molecular orbitals, electronic transitions, and conformational changes that can occur upon excitation. Most previous computational studies have been limited to the description of the trans-influence, the extent to which a ligand weakens the bond trans to itself in the equilibrium ground state of a complex [30], and most have been more concerned with square planar rather than octahedral complexes [31–35].
The purpose of our study is to extend the previous computational studies to include octahedral Ru (II) complexes, and thereby establish, qualitatively, a broader screening protocol for evaluating the correlation between the HOMO-LUMO energy gap and the Stokes shift in transition metal complexes. Here, we are investigating the spectroscopic effects of i) different ligands trans to bpy (hydride as a good σ-donor in comparison to carbonyl as a good π-acceptor), and ii) introducing different electron-withdrawing or electron-donating substituents in derivatives of the Ru(bpy)(PPh3)2 moiety.
Our laboratory has been interested in using the photophysical properties of Ru hydride complexes to study dynamics in biological membranes and for applications as catalysts and sensors [36–37]. Here, we report computational results for the photophysical, and photochemical properties of Ru (II) complexes of bpy, carbonyl and PPh3 and their derivatives, which previously have been shown to display long excited-state lifetimes with high quantum yields [36–37]. We also report a different synthesis procedure for [RuH(CO)bpy(PPh3)2]PF6 (Rubpy) and [RuH(CO)dcbpy(PPh3)2]PF6 (Rudcbpy) complexes, both of which have been studied previously in our laboratory [36–37], as well as synthesis of the new complex [RuH(CO)bis-4, 4’-(methyl)bpy(PPh3)2]Cl (RudMebpy) (including spectral data).
The good agreement between the experimental data for the former Ru(II) complexes and these calculations, encouraged us to extend the study to include theoretical predictions of three other Ru(II) complexes of interest: [RuH(CO)bis-4, 4’-(N-methylamide)bpy(PPh3)2]+ (Rudamidebpy), [Ru(H)2dcbpy(PPh3)2] (Ru(2H)dcbpy), and [Ru(CO)2dcbpy(PPh3)2]2+ (Ru(2CO)dcbpy) (see Fig. 1).
Figure 1.

Optimized molecular structures of Rubpy and Rudcbpy complexes. Hydrogen atoms are omitted for clarity.
2. Experimental section
2.1. Preparation of complexes
It was found that the previously synthesized Rubpy and Rudcbpy complexes could be made in one step from Ru(PPh3)3(H)(CO)Cl and the appropriate ligand by following the method of Malecki and Maroń [38]. Essentially as previously described [36], each complex was combined with the appropriate ligand in equimolar amounts followed by reflux in methanol for 2h followed by addition of NH4PF6 (1.0 g/10 mL solution). The final compounds, Rubpy and Rudcbpy, were isolated as the PF6 salts, which after recrystallization gave pale-yellow crystals. The IR, 1H and 31P NMR data were in agreement with previously published data [36]. This same method, except without addition of NH4PF6, was then applied to the synthesis of RudMebpy. This new complex was isolated as the chloride salt, which after recrystallization gave brown crystals. 1H and 31P NMR spectra for RudMebpy were obtained on a Varian VNNMRS 500 MHz NMR or a Varian VNNMRS 600 MHz NMR spectrometer. Infrared spectra were obtained on a Nicolet 100 FT-IR spectrometer. The details are provided in the supplemental materials.
2.2. Crystal structure analysis for RudMebpy
X-ray diffraction data for [RuH(CO)bis-4, 4’-(methyl)bpy(PPh3)2]Cl (Cambridge Crystallographic Data Center Code CCDC 1845877) were collected at 100 K on a Bruker D8 Venture using MoΚα-radiation (λ=0.71073 Å). Data have been corrected for absorption using SADABS1 area detector absorption correction program. Using Olex22, the structure was solved with the SHELXT3 structure solution program using Direct Methods and refined with the SHELXL4 refinement package using least squares minimization. All non-hydrogen atoms were refined with anisotropic thermal parameters. Hydrogen atoms attached to heteroatoms were found from the residual density maps, placed, and refined with isotropic thermal parameters. All other hydrogen atoms in the investigated structure were located from difference Fourier maps but finally their positions were placed in geometrically calculated positions, and refined using a riding model. Isotropic thermal parameters of the placed hydrogen atoms were fixed to 1.2 times the U value of the atoms they are linked to (1.5 times for methyl groups). The structure was found to contain indistinguishable solvent molecules voids within the lattice. Attempts at modeling this solvent were not able to produce a suitable model. The SQUEEZE5 routine within PLATON6 was utilized to account for the residual, diffuse electron density and the model is refined against these data. A total of 185 electrons per unit cell were corrected. This corresponds to roughly 10 methanol molecules per unit cell (180 electrons). All calculations and refinements were carried out using APEX27, SHELXTL8, Olex2, and PLATON, (Fig. 2) [39–46]. A comparison between selected experimental and calculated parameters is listed in Table 1.
Figure 2.

Solid state structure of [RuH(CO)bis-4, 4’-(methyl)bpy(PPh3)2]Cl, showing the 50% probability thermal ellipsoid and the hydride position, hydrogen atoms omitted for clarity.
Table 1.
Selected bond lengths (Å), bond angles (º), and torsion angles (º) optimized for RudMebpy in S0 using B3LYP/LANL2DZ and PBE0/LANL2DZ compared to X-ray data.
| Experimental | B3LYP | PBE0 | |
|---|---|---|---|
| Ru-P1 | 2.353 | 2.448 | 2.391 |
| Ru-P2 | 2.359 | 2.449 | 2.392 |
| Ru-N1 | 2.116 | 2.173 | 2.137 |
| Ru-N2 | 2.179 | 2.246 | 2.198 |
| Ru-H | 1.563 | 1.613 | 1.613 |
| Ru-C | 1.843 | 1.862 | 1.852 |
| N1-Ru-N2 | 75.688 | 74.544 | 75.413 |
| P1-Ru-P2 | 165.209 | 170.099 | 169.164 |
| N1-C-C-N2 | 2.032 | 1.854 | 1.002 |
2.3. Spectroscopy
Absorption, excitation and emission spectra for Rubpy, Rudcbpy, and RudMebpy (solution in ethanol) were recorded on a Molecular Devices Spectra Max M2 (Fig. 3 and 4). It should be noted that the absorption and emission spectra of Rudcbpy reported here are a correction of those previously reported by our laboratory [36].
Figure 3.

Experimental absorption spectra of Rubpy (black), Rudcbpy (red), and RudMebpy (blue) in ethanol. The intensity is normalized for the comparison.
Figure 4.

Experimental emission spectra of Rubpy in black (the maximum of emission is at 593 nm), Rudcbpy in red (the maximum of emission is at 609 nm), and RudMebpy in blue (the maximum of emission is at 563 nm) in ethanol. The intensity is normalized for the comparison.
2.4. Computational Methods
2.4.1. DFT/TDDFT
To select the appropriate functional for describing the photophysical properties for all complexes, we employed DFT using six different exchange-correlation potentials: B3LYP [47], PBE0 [48], CAM-B3LYP [49], M06 [50], B2PLYP coupled with D3 dispersion correction [51] and hybrid meta-GGA with functional wB97XD [52]. All calculations were performed with the Gaussian 09 suite of programs [53] to determine the equilibrium structure of Rudcbpy in the S0 state. M06, B2PLYP, and wB97XD were included for better description of noncovalent interactions. To compare the basis sets, we employed two commonly used effective core potentials (ECPs) for Ru: the Los Alamos pseudopotential (LANL2DZ) [54] and the Stuttgart-Dresden pseudopotential (SDD) [55]. The former are shape-consistent, have no adjustable parameters, and are derived by calculation of the spatial distributions of the valence orbital of the isolated atom. The latter are energy-consistent and include empirical parameters derived from observable data for a single atom, such as ionization energy. For all other atoms, we used the 6–31G* basis set. In addition, to improve the angular description of the valance orbitals of the central atoms, a one-set-f-polarization functions (exponent: 1.235) and a one-set-d-polarization functions (exponent: 0.371) [56] were added to Ru and to P [57], respectively. All geometries were optimized, as described below, starting from the crystal structure of Rubpy (Cambridge Crystallographic Data Center Code CCDC 704327) [36], neglecting the PF6- counterion in the model. The carboxylic groups were added to the 4 and 4’ positions of the bpy group. The most stable conformation of the carboxyl groups in S0 state was determined by scanning the potential energy surfaces (PES) as a function of -COOH torsion angle and optimizing the remaining non-scanned coordinates (relaxed PES scan). We found that the most stable ground state conformation has both -COOH groups coplanar with bpy, Ru, carbonyl, and the hydride (Fig. S1).
To assess the performance of the computations, we used several statistical measures [58]: the mean error , the standard deviation in the errors ∆std, the mean absolute error , and the maximum absolute error ∆max, where the experimental values used for comparison were taken from the crystal structure of Rubpy.† A total of six Ru-ligand and six P-C bond-lengths, and 15 ligand-Ru-ligand, six C-P-C, and six C-P-Ru angles were considered. Solvation effects were modeled by using the “Polarizable Continuum Model” (PCM) [59–60] and the Onsager reaction-field model [61]. Normal-mode analysis confirmed that all optimized geometries were in minima. From the optimized S0, the lowest 22 singlet-singlet transitions, and their corresponding oscillator strengths were determined using TDDFT in combination with B3LYP/LANL2DZ, B3LYP/LANL2Z with inclusion of f,d-polarization functions to Ru and P, and M06/LANL2DZ [62]. B3LYP and M06 generated similar excitation and absorption spectra that correlated well with the experimental data. We determined the nature of each band by calculating the orbital energies and the composition in terms of atom contributions using electron density difference maps (EDDMs) implemented in GaussSum 2.2 [63]. A half-width at half-maximum was assigned to the default value in gaussian (0.4 eV).
The lowest energy T1 states were optimized starting from the S0 geometry using two approaches: the linear-response TDDFT and the difference in the self-consistent field (SCF) energies of the S0 and T1 spin states (∆SCF) [64–65]. The later was used to ensure the stability of the calculated T1 states by TDDFT. For both methods, the spin-unrestricted Kohn-Sham (UKS) orbitals were used. The analytic gradients and frequencies were calculated for T1 optimized to its minimum energy configuration via TDDFT using Gaussian 16 [66]. T1 was modeled using seven different combinations of methods and basis sets as explained in the discussion. The emission energies were calculated as the energy difference between S0 and T1with the zero-point (ZP) vibrational energy correction included. For this, the emission energy was determined as the difference of the ZP of S0 and the ZP of T1 calculated using ∆SCF and TDDFT approaches.
The data suggested that B3LYP/LANL2DZ/6–31G* is sufficient for describing the Ru monodiimine system and its photophysical properties. Therefore, at lower computational cost, we used this level of theory to describe the other systems. To model RudMebpy and Rudamidebpy, the -COOH groups were substituted by -CH3 and -CONHCH3, respectively. The Ru(2CO)dcbpy and Ru(2H)dcbpy complexes were modeled starting from the optimized Rudcbpy ground-state geometry. Energy minima were then obtained by optimizing all the geometrical parameters.
2.4.2. QTAIM/NBO
To rationalize the effects of the trans influence and substituent groups, we determined the atomic charges of the optimized structures in the S0 and T1 states using two different approaches: NBO analysis implemented in Gaussian 09 and the quantum theory of atoms in molecules (QTAIM) implemented in the AIMAll program package [67–69]. The wave functions were generated first by a single-point calculation on the optimized structures of the complexes in S0 and T1 using the UKS orbitals. Both methods provided similar trends for the atomic charge changes between S0 and T1, (Table S1).
3. Results and Discussion
3.1. Photophysical properties of RudMebpy
The UV–Vis absorption spectra were measured at room temperature in ethanol solution (Fig. 3 and Table 2). Similar to other octahedral Ru-diimine complexes, a weak and wide absorption band around 350–500 nm is observed due to 1MLCT. However, it is blue shifted when compared to that of other complexes (Rubpy and Rudcbpy) (Fig. 3). The calculations reveal the characterizations of the strong absorption bands below 350 nm due to several electronic transitions as we explained latter. The same blue shift was observed in the emission spectra of RudMebpy at room temperature (Fig. 4). This is most likely due to the less distortion in the excited-state of RudMebpy because of the electron-donating feature of the methyl groups.
Table 2.
Computed absorption, excitation and electronic transitions for complexes using B3LYP/LANL2DZ.
| complex | λabsa (nm) | λabsb (nm) | λexit. (nm) | f | major contribution | % composition | character |
|---|---|---|---|---|---|---|---|
| Rubpy | 400 | 394.9 | 387.7 | 0.06 | H → L (95%) | H: Ru 47%, (PPh3)2 46% | Ru,(PPh3)2 → bpy |
| L: bpy 96% | |||||||
| 277c | 287.0 | 288.9 | 0.36 | H-1→ L+2 (46%) | H-1: Ru 50%, (PPh3)2 45% | Ru → (PPh3)2 | |
| 257 | L+2: Ru 21%, (PPh3)2 75% | ||||||
| 285.9 | 0.19 | H-1→ L+3 (34%) | L+3: (PPh3)2 13%, bpy 85% | Ru,(PPh3)2 → bpy | |||
| 286.7 | 0.14 | H →L+3 (60%) | Ru,(PPh3)2 → bpy | ||||
| 300c | 326.1c | 0.13 | H →L+2 (57%) | Ru → (PPh3)2 | |||
| 323.8c | 0.06 | H →L+3 (57%) | Ru,(PPh3)2 → bpy | ||||
| H-1 →L+3 (20%) | Ru,(PPh3)2 → bpy | ||||||
| Rudcbpy | 422 | 455.3 | 446.1 | 0.09 | H→ L (94%) | H: Ru 42%; (PPh3)2 52% | Ru,(PPh3)2 → dcbpy |
| L: bpy 80%, (COOH)2 14% | |||||||
| 310 | 320.3 | 309.5 | 0.29 | H-15 → L (82%) | H-15: bpy 81%; (PPh3)2 18% | bpy,(PPh3)2 → (COOH)2 | |
| 270c | 322.5 | 0.13 | H → L+3 (55%) | L+3: Ru 22%, (PPh3)2 73% | Ru → (PPh3)2 | ||
| H-1 → L+3(19%) | H-1: Ru 54%; (PPh3)2 43% | Ru → (PPh3)2 | |||||
| 349.6 | 0.08 | H-3 → L (53%) | H-3: (PPh3)2 83%, Ru 12% | Ru, (PPh3)2 → dcbpy | |||
| 328.5 | 0.08 | H-9 → L (68%) | H-9: bpy 14%; (PPh3)2 85% | (PPh3)2 → dcbpy | |||
| H-1 →L+3 (20%) | Ru,(PPh3)2 → bpy | ||||||
| RudMebpy | 390 | 390.6 | 382.7 | 0.07 | H→ L (96%) | H: Ru 50%, (PPh3)2 42% | Ru, (PPh3)2 → dMebpy |
| L: bpy 94%, (CH3)2 2% | |||||||
| 290c | 286.4 | 290.1 | 0.30 | H-1→ L+1 (46%) | H-1: (PPh3)246%, Ru 48%, bpy 8% | Ru → (PPh3)2 | |
| L+1: Ru 20%, (PPh3)2 75% | |||||||
| 295.5 | 0.24 | H-6→ L (61%) | H-6: (PPh3)2 34%, bpy 55%, Ru 9% | Ru, (PPh3)2 → dMebpy | |||
| 287.1 | 0.17 | H-1→ L+2(36%) | L+2: bpy 88%, (CH3)2 1% | Ru, (PPh3)2 → dMebpy | |||
| 310c | 328.3c | 0.13 | H→ L+1 (64%) | Ru → (PPh3)2 | |||
| 325.9c | 0.06 | H →L+2 (61%) | Ru, (PPh3)2 → dMebpy | ||||
| H-1 →L+2 (17%) |
Experimental data for Rudcbpy, Rubpy, and RudMebpy from this work.
calculated absorption.
excitation observed at the shoulder.
3.2. The optimized S0 geometry of Rudcbpy and performance of functionals
Table 3 compares selected bond distances and angles from the experimental data for Rubpy (Cambridge Crystallographic Data Center Code CCDC 704327) [36] with the calculated values obtained using B3LYP/LANL2DZ/PCM in ethanol as solvent. The comparison with the X-ray data could be appropriate because the presence in the crystal structure of polarizable PF6─counter ions creates an environment that is far different from a “non-polarizable” one, as in the gas phase, and better described by some polar media. The calculations predicted a deviation in the range of 1.20–11.15 pm in the bond length for the different Ru-ligand and a total mean error of 7.07 pm. The table also shows the calculated parameters of Rudcbpy using the same level of theory. Introducing -COOH into the bpy ligand did not significantly affect the core coordination of the parent complex (Table S2–S5). For example, the total mean error associated with the calculated Ru-ligand bond-lengths of Rudcbpy is 7.14 pm. Additionally, the total mean error for the calculated P-C bond-lengths for Rudcbpy compared to Rubpy differs by 0.09 pm. In the following, we compare the performance of the different combinations of density functional/basis set/PCM in terms of the calculated Ru and P bond-lengths and bond-angles that describe the Rudcbpy S0 geometry (Fig. 5, Table S2–S5).
Table 3.
Selected bond lengths (Å), bond angles (º), and torsion angles (º) optimized for complexes in S0 and T1 using TDDFT in ethanol except for Ru(2H)dcbpy where ∆SCF data are reported.
| Rubpy | Rudcbpy | Rudamidebpy | RudMebpy | Ru(2H)dcbpy | Ru(2CO)dcbpy | ||||
|---|---|---|---|---|---|---|---|---|---|
| S0 | a | B3LYP | PBE0 | B3LYP | B3LYP | B3LYP | PBE0 | B3LYP | B3LYP |
| Ru-P1 | 2.351 | 2.448 | 2.392 | 2.454 | 2.451 | 2.448 | 2.391 | 2.364 | 2.561 |
| Ru-P2 | 2.349 | 2.449 | 2.394 | 2.453 | 2.450 | 2.449 | 2.392 | 2.364 | 2.560 |
| Ru-N1 | 2.091 | 2.174 | 2.139 | 2.168 | 2.169 | 2.173 | 2.137 | 2.152 | 2.160 |
| Ru-N2 | 2.135 | 2.246 | 2.196 | 2.244 | 2.246 | 2.246 | 2.198 | 2.186 | 2.161 |
| Ru-H | 1.623 | 1.613 | 1.613 | 1.610 | 1.611 | 1.613 | 1.613 | 1.635, 1.652 | |
| Ru-C | 1.816 | 1.861 | 1.852 | 1.865 | 1.864 | 1.862 | 1.852 | 1.918, 1.919 | |
| P1-Ru-P2 | 174.701 | 170.034 | 168.952 | 168.954 | 169.194 | 170.099 | 169.164 | 160.234 | 176.817 |
| N1-Ru-N2 | 75.040 | 74.733 | 75.579 | 74.858 | 74.772 | 74.544 | 75.413 | 75.801 | 76.650 |
| N1-C-C-N2 | −2.869 | 0.181 | 0.616 | -0.122 | 0.201 | 1.100 | 1.002 | 0.172 | −0.112 |
| T1 | |||||||||
| Ru-P1 | 2.414 | 2.445 | 2.440 | 2.408 | 2.406 | 2.556 | |||
| Ru-P2 | 2.402 | 2.518 | 2.521 | 2.404 | 2.406 | 2.557 | |||
| Ru-N1 | 2.102 | 2.140 | 2.137 | 2.101 | 2.219 | 2.144 | |||
| Ru-N2 | 2.097 | 2.161 | 2.153 | 2.089 | 2.218 | 2.149 | |||
| Ru-H | 1.635 | 1.627 | 1.628 | 1.636 | 1.604, | ||||
| 1.630 | |||||||||
| Ru-C | 1.884 | 1.896 | 1.895 | 1.883 | 1.920, | ||||
| 1.923 | |||||||||
| P1-Ru-P2 | 142.144 | 143.280 | 143.788 | 143.024 | 169.175 | 178.093 | |||
| N1-Ru-N2 | 78.876 | 77.377 | 77.590 | 78.864 | 74.716 | 77.505 | |||
| N1-C-C-N2 | −2.769 | 4.195 | 3.189 | −2.046 | 0.114 | −0.874 | |||
N1 is trans to CO and N2 is trans to H.
Experimental data taken from ref. [36]
Figure 5.

Mean errors relative to experiment in the calculated Ru bond distances (pm) of Rudcbpy.
The total mean errors of the bond lengths were, on average, larger for Ru-ligand than for P-C bonds. We noted that in all methods the maximum error was associated with Ru-N bonds. As expected, the functionals that were constructed to account for dispersion (M06, B2PLYPD3, and wB79xD) yielded geometric parameters that were closest to the crystal structure parameters. The performance of the different DFT methods followed the ‘Jacobs ladder’ classification scheme with total mean errors of the bond lengths decreasing in the series double-hybrid (B2PLYPD3) < meta-hybrid (M06) < hybrid-GGA (wB79xD) [70]. The methods, however, show no trend in evaluation of bond-angles. With all methods, the Ru bond-angles were smaller (0.01–0.20°) than in the crystal structure of the parent complex Rubpy; the P bond-angles varied over a range of +0.02/−0.04°. It should be noted that the PBE0/LANL2DZ performance was superior to B3LYP/LANL2DZ. Both functionals use a fraction of exact exchange energy, but B3LYP includes empirical parameters determined from the correlation energy of the He atom [71]. Additionally, PBE0 performance was comparable to that of the functionals that include dispersion. Including the long-range corrected exchange correlation functional (CAM-B3LYP) provided a better description compared to that obtained with B3LYP alone.
We found that increasing the basis set size did not provide significant improvement in the geometric parameters. For instance, adding f,d-polarization functions slightly decreased the mean error of the bond-lengths of Ru-ligand, but not of P-C. The performance of the basis sets that include ECPs is tested with B3LYP and M06 level of theory (Fig. 5, Table S2–S5). The results show better improvements in the determination of Ru-ligand bond-lengths using SDD with both B3LYP and M06 functionals (total mean errors are 5.4 pm and 4.1 pm, respectively) compared to LANL2DZ (7.1 pm and 5.5 pm, respectively). However, LANL2DZ provides a better description of the bond angles, see Table S4 and S5.
To determine the S0 geometry of Rudcbpy, we initially used functionals that did not include dispersion (i.e., B3LYP, PBE0, and CAM-B3LYP). The calculations were performed first without symmetry constraints and then applied the constraints. In all cases, there was lack of symmetry in the calculated structure (i.e., C1). However, using functionals that include dispersion (i.e., B2PLYPD3, M06, and wB79xD), S0 for Rudcbpy was fully optimized with Cs symmetry (i.e., the bpy rings were coplanar with Ru, CO, and H), without any constraints and it was true minimum.
To assess solvent effects, we optimized the structure using B3LYP first in vacuum and then applying the Onsager model [61]. This procedure produced a minimum geometry with Cs symmetry. The lower symmetry obtained when using the hybrid functionals B3LYP, PBE0 and CAM-B3LYP, as described above, is due to the integral equation approach formalism model (PCM) not accounting accurately for the solute-solvent interaction [72]. In addition, the absence of the dispersion correction in these methods affects the conformation and stability of the system, particularly, the interaction between the phenyl rings.
Regardless of the inability of B3LYP/PCM to adequately describe the geometry of Rudcbpy, it reproduced the experimentally observed absorption and emission energies at a relatively low computational cost compared to other methods. Moreover, it has been reported that the functionals that provide the most precise geometries, M06–2X, underestimated the triplet gaps of Ru(II) complexes [73]. With these considerations, we chose B3LYP/LANL2DZ/6–31G*/PCM to evaluate the conformational changes and photophysical properties computed for the other compounds.
3.3. Ru coordination geometry and molecular orbital energies
3.3.1. Substituent effects
In general, the deviations of the Ru-ligand bond lengths upon introducing substituents in Rubpy are not significant (< 1.00 pm, see Table 3). The significant changes are in the electronic distributions and orbital energies. The negative charges over the bpy and phenyl rings decreased as the donor strength of the substituents decreased and the positive charge on the Ru atom increased (Table 4). It should be noted that the charges on the P atoms did not correlate well with the expected trends of the substituents, (i.e., larger positive charge with electron-withdrawing substituents and larger negative charge with electron-donating substituents). The positive charge over the P atoms increased in the series: 1.71 e, 1.78 e, and 1.80 e for Rudcbpy, Rubpy, RudMebpy, respectively.
Table 4.
The change in the electron density distribution between optimized S0 and T1 estimated by calculating the partial atomic charges e using QTAIM using B3LYP/LANL2DZ for Rudcbpy, Rudamidebpy, Ru(2H)dcbpy, and Ru(2CO)dcbpy, and PBE0/LANL2DZ for Rubpy and RudMebpy.
| Complex | S0 | T1 | ||||||||
|---|---|---|---|---|---|---|---|---|---|---|
| Ru | bpy | Xbpy* | 2P | Ph | Ru | bpy | Xbpy* | 2P | Ph* | |
| Rubpy | 0.639 | 0.064 | - | 3.549 | −2.906 | 0.795 | −0.561 | - | 3.733 | −2.722 |
| Rudcbpy | 0.669 | 0.301 | −0.386 | 3.412 | −2.764 | 0.838 | −0.197 | −0.989 | 3.581 | −2.558 |
| Rudamidebpy | 0.669 | 0.119 | 0.661 | 3.411 | −2.777 | 0.845 | −0.386 | 0.081 | 3.574 | −2.583 |
| RudMebpy | 0.626 | −0.011 | 0.289 | 3.601 | −2.969 | 0.806 | −0.573 | −0.353 | 3.763 | −2.782 |
| Ru(2H)dcbpy | 0.474 | 0.123 | −0.275 | 3.339 | −3.075 | 0.625 | −0.257 | −0.399 | 3.408 | −2.972 |
| Ru(2CO)dcbpy | 0.869 | 0.365 | −0.020 | 3.461 | −2.418 | 0.885 | 0.255 | −0.067 | 3.486 | −2.287 |
X is the substituent and (Ph) is the phenyl rings for both ligands.
In general, the atomic contributions to the molecular orbitals are similar for Ru complexes with different substituents (Table 2 and 4, Fig. 6). In all complexes, more than 90% of the electron density of the HOMO and HOMO-1 is delocalized between the Ru atom and the (PPh3)2 groups. HOMO and HOMO-1 can be described as a combination of the Ru dyz orbitals and the bonding π orbitals of the phenyl rings; one phenyl ring from each PPh3 ligand does not contribute to the HOMO (Fig. 5). HOMO-2 is Ru dxy with no contribution from the phenyl rings, while HOMO-3 is a combination of Ru dyz, π bpy, and π (PPh3). The calculations showed that more than 80% of the electron density of the LUMO in all ions has π* character and is localized on the bpy rings bearing the substituent with a fractional contribution from the Ru dxz orbital (Fig. 6).
Figure 6.
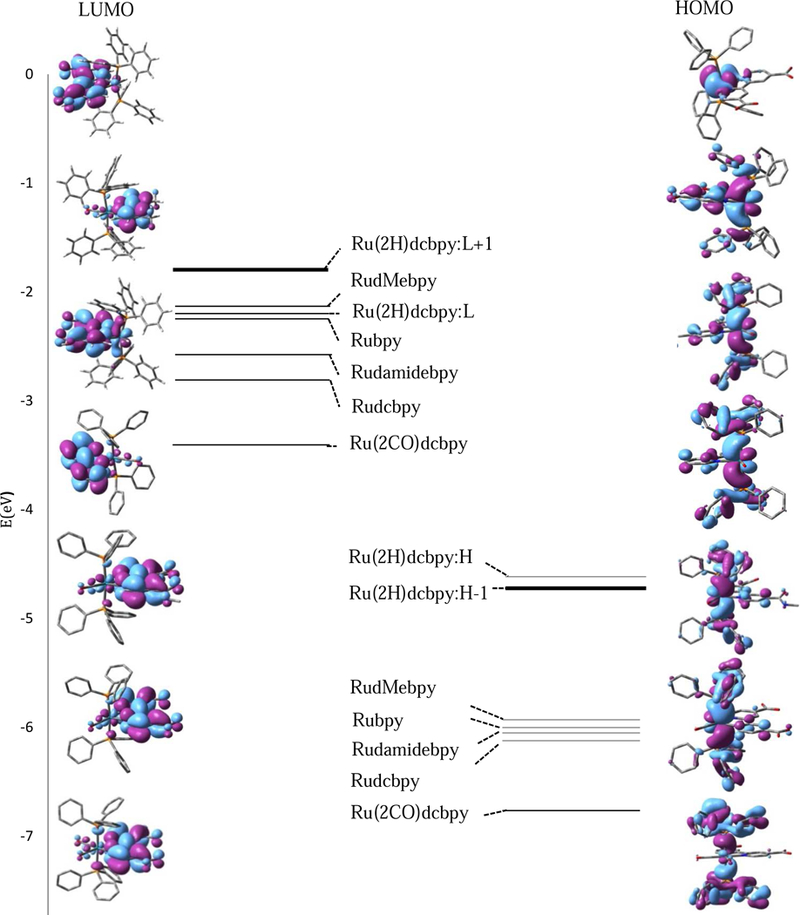
HOMO and LUMO representations of the optimized ground states of the complexes calculated using B3LYP/LANL2DZ. Left: isodensity plots of the frontier orbitals of LUMO of the complexes arranged as the energies increase along with schematic representation of LUMOs energies. Right: isodensity plots of the frontier orbitals of HOMO of the complexes arranged as the energies increase along with schematic representation of HOMOs energies.
The changes in the relative energies of the frontier molecular orbitals are based on the different mesomeric effects of the substituents and are plotted in Fig. 6. Introducing the electron withdrawing substituents (-COOH), decreased the electron density and stabilized the LUMO level; the energy is lower by 0.58 eV compared to that of Rubpy. The weaker negative mesomeric behavior for (-CONHCH3)2 groups also stabilized the LUMO but by 0.35 eV compared to Rubpy. However, the electron releasing groups (-CH3) destabilized the LUMO level by only 0.09 eV.
3.3.2. Trans influence
The following comparisons are made relative to Rudcbpy. Replacing the carbonyl by hydride increased the σ donation strength along x and y axes reducing the partial positive charge over Ru (Table 4). Thus, the increase of the electron density increases the electrostatic repulsion between Ru dx2-y2 orbitals and the two hydride ions. The Ru-H bond lengths showed the largest increase (~ 2.59 pm) compared to the other complexes. The HOMO orbital is destabilized by 1.54 eV and is 95% Ru dxy. On the other hand, the Ru-N and Ru-P bond lengths decreased by ~5.76 and ~9.02 pm, respectively, suggesting that introducing a σ donor ligand will push more electron density toward Ru, thereby increasing back-bonding from Ru toward other ligands. Additionally, we found that the MLCT band originates from the HOMO-1-HOMO-2 orbitals, which have been both destabilized by ~1.82 eV. The HOMO-1 and HOMO-2 orbitals have Ru dxz and dyz contributions (57%, and 83% respectively) with less π bonding from the phenyl rings. In addition, the HOMO-1orbital has 17% π bonding from dcbpy. The three lowest LUMOs, lying 2.53 eV above the HOMO, are largely localized on the dcbpy, and have minor Ru dxz and dyz character. Introducing hydride destabilized the LUMO by 0.64 eV and the charge on the bpy is more negative, −0.052 e compared to the Rudcbpy.
Replacing the two hydride ions by two CO π-acceptors resulted in depopulation of the orbitals between the x and y axes (dxz and dyz), which stabilized the HOMO and LUMO by 0.65 and 0.63 eV, respectively. Consequently, the contributions of the Ru dxz and dyz to the HOMO orbital are significantly reduced and become smaller (<10%). The major contribution to the HOMO up to HOMO-3 comes from the bonding π orbitals of the phenyl rings (89%). Introducing the π-acceptors and due to the dicationic nature of the Ru(2CO)dcbpy complex, the positive partial charges on the Ru and both P atoms increased, thereby reducing the back-bonding from Ru toward P atoms, and the Ru-P bond length increased by ~10.0 pm compared to Rudcbpy. The LUMO and LUMO+1 are mainly localized on the dcbpy with a contribution from the antibonding π* CO, while LUMO+2 has antibonding contribution from Ru dz2, π* phenyl rings, and π* CO.
3.4. Calculated absorption spectra
TDDFT/B3LYP/LANL2DZ/PCM calculations were employed to calculate the 22 lowest singlet-singlet transitions starting from the S0 geometry, optimized in ethanol. In all complexes, two maxima are observed in the calculated absorption spectra (Fig. 3, 7). The results reveal that the lowest energy band ( ≥ 390 nm) is due to electronic transition from HOMO state to the LUMO state for all complexes (see Table 2 and 5). Thus, this band, which is in the visible region of the spectrum, is the MLCT transition with a contribution from (PPh3)2 that varies from 25% (Ru(2H)dcbpy) to 89% (Ru(2CO)dcbpy) (see Table 5). Most notably, our calculations predicted a forbidden HOMO →LUMO transition in Ru(2H)dcbpy. The MLCT band for this complex is due to transitions from lower HOMOs (HOMO-1 to HOMO-3) to the lower LUMOs (LUMO to LUMO+3).
Figure 7.

The absorption spectra for the complexes calculated using B3LYP/LANL2DZ. The intensities are optimized to the highest intensity for each complex.
Table 5.
Computed absorption, excitation and electronic transitions for theoretical complexes using B3LYP/LANL2DZ.
| complex | λabs (nm) | λexit. (nm) | f | major contribution | % composition | character |
|---|---|---|---|---|---|---|
| Rudamidebpy | 428.1 | 420.8 | 0.09 | H → L (95%) | H: Ru 45%; (PPh3)2 49% | Ru, (PPh3)2 → damidebpy |
| L: bpy 86%; (CONHCH3)2 9% | ||||||
| 320.1 | 297.2 | 0.19 | H-17 → L (31%) | H-17:(PPh3)2 46%; bpy 42%; (CONHCH3)2 12% | (PPh3)2,(CONHCH3)2 → bpy | |
| 324.3 | 0.13 | H-1 → L+3 (17%) | L+3: (PPh3)2 74%; Ru 21% | Ru → (PPh3)2 | ||
| H → L+3 (57%) | H-1:Ru 52%; (PPh3)2 44% | Ru → (PPh3)2 | ||||
| 316.9 | 0.07 | H-8→ L (27%) | H-8: (PPh3)2 89% | (PPh3)2 →damidebpy | ||
| H → L+2 (37%) | L+2: damidebpy 96% | Ru, (PPh3)2 → damidebpy | ||||
| 310.5 | 0.07 | H-13 → L (19%) | H-13: (CONHCH3)2 41%; (PPh3)2 55% | (PPh3)2,(CONHCH3)2 → bpy | ||
| H-9 → L (25%) | H-9: (PPh3)2 62%; bpy 19%; (CONHCH3)2 17% | (PPh3)2,(CONHCH3)2 → bpy | ||||
| 326.8 | 0.06 | H→ L+1 (76%) | Ru, (PPh3)2 → damidebpy | |||
| Ru(2H)dcbpy | 454.6 | 502.6 | 0.20 | H-1 →L+1 (97%) | H-1: (PPh3)225%, Ru 57%, bpy 17% | Ru,(PPh3)2→ dcbpy |
| 444.0 | 0.14 | H-1 →L+2 (77%) | L+1: bpy 82%, (COOH)2 16% | Ru,(PPh3)2→ dcbpy | ||
| 457.5 | 0.11 | H-2 →L+1 (75%) | L+2: bpy 93%, (COOH)2 4% | Ru,(PPh3)2→ dcbpy | ||
| H-2: (PPh3)211%, Ru 83% | ||||||
| 576.3 | 0.18 | H-1 →L (67%) | L+1: bpy 78%, (COOH)2 8% | Ru,(PPh3)2→ dcbpy | ||
| 357.1 | 360.8 | 0.23 | H-1 →L+3 (83%) | L+3: (PPh3)291%, Ru 8% | Ru → (PPh3)2 | |
| 355.2 | 0.12 | H-1 →L+3 (83%) | ||||
| Ru(2CO)dcbpy | 436.0 | 428.5 | 0.34 | H→ L (99%) | H: Ru 10%, (PPh3)2 89% | Ru,(PPh3)2→ dcbpy |
| L: bpy 87%, (COOH)2 7% | ||||||
| 332.8 | 341.5 | 0.99 | H→ L+2 (91%) | L+2: Ru 36%, (PPh3)2 55% | (PPh3)2→ (2CO), Ru | |
| 331.9 | 0.58 | H→ L+2 (92%) | (2CO) 5% | |||
The next higher energy absorption maximum observed in the near-UV region of the experimental spectra is composed of several overlapping bands that are not well resolved (Fig. 3). The calculations show that these are the intra-ligand π-π* and n-π* electronic transitions of PPh3 and bpy with the substituents that occur in the same region. This band is due to excitation either from lower HOMOs to LUMO or from HOMO to higher LUMOs (Table 2 and 5). Moreover, the calculations reveal that the low-energy side of this band, which ranges from 300 to 330 nm (Table 2 and 5), includes MLCT transitions from Ru to both PPh3 and bpy for all complexes except Ru(2H)dcbpy and Ru(2CO)dcbpy. The appearance of an additional near-UV MLCT band (300–350 nm) has also been observed for other Ru (II) systems [74]. To confirm the theoretical findings, excitation spectra were measured over the range 300–500 nm, and electronic transitions that correspond to the predicted MLCT transitions were observed. The molecular orbital contributions and maxima of the computed absorption spectra and electronic transitions compared with the corresponding experimental data are listed in Tables 2 and 5. The computational results agree well with the overall features of the experimentally determined absorption spectra of Rubpy and RudMebpy (Fig. 3, 7).
The calculated MLCT band of Rudcbpy is red shifted by ~28 nm compared with the experimental absorption spectrum which has a maximum at 422 nm. It should be noted that the calculation does not take into account the possibility of hydrogen bond formation with solvent molecules. However, we anticipated that hydrogen bonding will affect the molecular orbital energies in the Rudcbpy compared to Rubpy and RudMebpy because of the solvent interaction with the carboxylic groups. To test this hypothesis, we modeled a system with four explicit methanol molecules with their hydroxyl groups interacting with the carboxylic groups of Rudcbpy. This interaction elongated the O-H bond length of the -COOH groups by 3.70 pm and rotated the –COOH by ~15° with respect to the plane of the bpy ring. In addition, the LUMO orbital was destabilized by 0.10 eV, which blue shifted the MLCT band ~9 nm. We then explored the possible effect of the counterion on the computational results by including PF6- with the methanol molecules, and the MLCT band was further blue shifted by another 13 nm (Fig. S2). The calculated shift suggests the role of the solvent and counterion in controlling the HOMO-LUMO energy gap which can be studied further by applying combined quantum mechanics/molecular mechanics (QM/MM) methods.
We also computed the UV/Visible absorption spectra for Rudcbpy using M06/LANL2DZ and CAM-B3LYP/LANL2DZ (Fig. S3). Overall, all methods predicted similar shapes for the optical spectra, and the atomic orbital contributions involved in the excitations. B3LYP and M06 provided comparable excitation energies. However, a large blue-shift is observed with TDDFT/CAM-B3LYP (>100 nm). This overestimate of the HOMO-LUMO energy gap when using CAM-B3LYP combined with PCM has been observed for other Ru(II) systems [75]
3.4.1. Substituent effects
The shift in the MLCT bands correlated well with the changes in the conformational and MO energies described above. In the experimental data, the MLCT band of Rudcbpy was red shifted by 22 nm when compared to Rubpy, whereas the MLCT band of RudMebpy was blue shifted by 14 nm (Fig. 3). The computations using the continuum model predicted the same trends but different magnitudes for the shifts. The MLCT band of the Rudcbpy was red shifted by 60 nm when compared to Rubpy. Converting -COOH to -CONHCH3 resulted in a smaller red shift of 33 nm, whereas the MLCT band of RudMebpy was blue shifted by 4 nm (Fig. 7).
3.4.2. Trans influence
Calculations show that the carbonyl groups in the Ru(2CO)dcbpy stabilize both HOMO and LUMO, but the overall energy gap increases resulting in a 19 nm blue shift of the MLCT band when compared to Rudcbpy. In addition, in Ru(2CO)dcbpy, the intra-dcbpy π-π* transitions are weak while strong electronic excitations from PPh3 to Ru and CO are observed in the higher energy bands. Replacing the two carbonyls with hydrides destabilizes all occupied orbitals and morover decreases the energy gap causing a red shift in the MLCT. Interestingly, this band has greater intensity and is much broader than the MLCT bands of the other complexes. This is because it is characterized by a larger (97%) weight from a transition involving HOMO-1 and LUMO+1with a significant contribution of orbitals both localized on the bpy ligand (17% and 82%, respectively). This composition enhances the transition dipole and also causes a large bathochromic shift in excitation when compared to the excitation of the other complexes. Notably, it has a high intensity peak at 455 nm and shoulder at 576 nm.
3.5. Triplet excited-state geometries
The T1 state geometry was optimized for Rudcbpy using TDDFT/B3LYP and UKS/B3LYP (∆SCF) with combinations of LANL2DZ, LANL2DZ(f), and LANL2DZ(f,d), CAM-B3LYP/LANL2DZ, M06/LANL2DZ, and M06/SDD (Table S6). The corresponding TDDFT and ∆SCF calculations characterized the optimized geometry as a 3MLCT state. Furthermore, the analysis of the T1 molecular orbital showed that the highest singly occupied molecular orbital (HSOMO) centered on the bpy (Fig. 8). To quantify the geometric changes, we calculated the root-mean-square deviation (RMSD) of T1 compared to S0 using the method of Kabsch as implemented in the Visual Molecular Dynamics (VMD) program [76] (Table S6). All methods yielded similar pattern of geometric parameter changes in T1 using both ∆SCF and TDDFT. For example, the difference in the RMSD between ∆SCF and TDDFT is in the range 0.001–0.239; CAM-B3LYP gave the higher deviation.
Figure 8.

HSOMO representation of the T1 for Rudcbpy derivatives.
Upon excitation, the symmetry and planarity between Ru and the other ligands are broken and the bpy rings are twisted. The most significant change is reduction in the bend observed in the P1-Ru-P2 angle for all complexes (24.66–32.25°). This reduction is asymmetric and is accompanied by an increase in the distance between the phenyl rings and bpy, which likely reduces the steric crowding that could arise from an increase in the π*-LUMO orbital population on bpy. N1 is trans to CO and N2 is trans to H. Both Ru-N bonds lengths decrease, but because of the trans influence, Ru-N2 decreases the most. The increase of the Ru-P bond length in the 3MLCT state, which is observed when using ∆SCF with all levels of theory, is due to the depopulation of the HOMO orbitals and reduction of the bond strength. However, the optimized T1 by TDDFT/B3LYP and TDDFT/CAM-B3LYP predicted an increase of only one Ru-P bond length. Regardless of the method used, accompanying the electron migration from Ru and PPh3 to the bpy, there is an overall reduction in CPRu angles and increase in CPC angles. The changes in the phenyl ring twist angles (Fig. 9) are presumably due to decreased repulsion between rings that occurs upon electron migration. The largest twist (30.05°) is observed for the phenyl rings that do not contribute to the HOMO.
Figure 9.

Overlaying S0 and T1 calculated using B3LYB/UB3LYP, respectively, for Rudcbpy (left) and Ru(2CO)dcbpy (right).
The T1 geometries for Rudamidebpy and Ru(2CO)dcbpy were minimized successfully using TDDFT/B3LYP and UKS/B3LYP. However, different approaches were required to minimize T1 geometries of the other complexes. For example, when optimizing Ru(2H)dcbpy T1 state, TDDFT/B3LYP produced oscillatory minima. This is due to a small HOMO-LUMO gap that caused the states to cross during the optimization. By using UKS/B3LYP, optimization was achieved. However, this approach was inadequate for Rubpy and RudMebpy. Minimization of these complexes was achieved using the PBE0 level of theory with ∆SCF and TDDFT. The calculated RMSD for all minimized geometries correlated well with HOMO-LUMO gap — the larger energy gap in S0 is accompanied by less distortion and smaller RMSD in T1. The changes between the S0 and optimized T1 geometries, due to the substituent effects and the trans influence, were evaluated comparing ∆SCF with TDDFT (Table 3). A comparison of selected parameters, emission energies, and RMSD using ∆SCF and TDDFT for all complexes is in Fig. 10 and Table S7.
Figure 10.
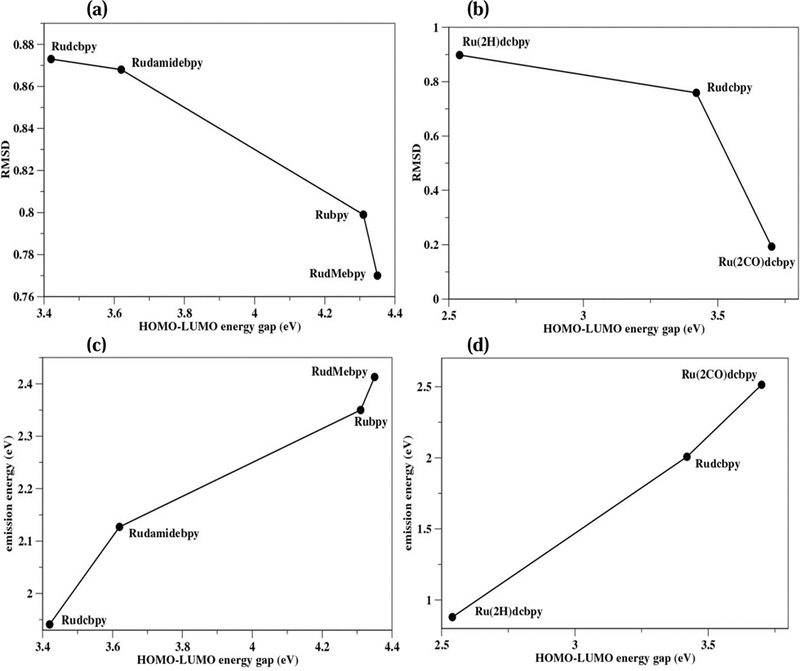
The calculated RMSD of T1 compared to the HOMO-LUMO energy gap for the complexes with respect to the substitutions using TDDFT (a), and trans influence using ∆SCF (b). The calculated emission energies using TDDFT compared to the HOMO-LUMO energy gap for the complexes with respect to the substitutions (c), and trans influence using ∆SCF (d).
3.5.1. Substituent effects
The T1 of RudMebpy, which has the largest energy gap, showed the smaller RMSD while Rudcbpy had the larger RMSD (Fig. 10). As explained above for Rudcbpy, the changes in the Ru-ligand bond lengths for the different substituents show similar trends. Specifically, increases in the Ru-P bond lengths were observed for all complexes except for one Ru-P bond in Rudamidebpy, and Ru-N bond lengths decreased with RudMebpy having the shortest Ru-N bond lengths. This reduction in the Ru-N bond is associated with greater localization of the electron density on the N atoms compared to other complexes for which the electron density is distributed over the entire bpy ring. On the other hand, Ru-H and Ru-CO bonds lengths in all complexes increased. Moreover, as a result of the electron migration, the Ru and PPh3 charges became more positive. The positive charge on Ru increased the most in the RudMebpy complex, indicating that more electron density moves toward bpy. This unexpected trend of increased positive charge on Ru in T1 when in the presence of an electron-donating group has been noted previously in platinum(II) biphenyl 2,2’-bipyridine complexes, where Pt was found to have the largest positive charge upon binding the strongest electron-donating group (-NH2) [25]. Finally, in T1, the same change in the relative rotation of the phenyl rings was observed for all complexes, the largest twist being ~ 41° in RudMebpy.
3.5.2. Trans influence
The Ru(2H)dcbpy has the smallest S1 ← S0 energy gap and its T1 shows the largest distortion. By contrast, Ru(2CO)dcbpy has the largest S1 ← S0 energy gap and its T1 shows the smallest distortion (Fig. 10). The variations in the Ru-ligand bond lengths in T1 with respect to S0 of the two complexes had opposite trends. While the Ru-P and Ru-N bond lengths increased in Ru(2H)dcbpy, both bond types decreased in Ru(2CO)dcbpy. In addition, the Ru-CO bond increased in Ru(2CO)dcbpy while the Ru-H bond length decreased in Ru(2H)dcbpy (Table 3). There was no change in either the P-Ru-P bond angle or phenyl ring twist angles in Ru(2CO)dcbpy, while the P-Ru-P bond angle increased by 9° and the phenyl ring twist angle changed by 18° in Ru(2H)dcbpy.
3.6. Excitation and Emission Energies
The ∆SCF approach (∆E = E (T1) - E (S0)) was used to calculate the emission energies, as explained previously. To assess the quality of the DFT models of the T1 for Rudcbpy, we compared the experimental and calculated emission energies using different methods, as explained above. In general, including the zero-point energy vibrational correction yielded emission energies that agreed well with experiment. We further noted that the emission energies obtained by TDDFT are comparable to those from ∆SCF, and both B3LYP and M06 provided similar emission energies (Fig. 11). In addition, CAM-B3LYP overestimated the emission energy (2.36 eV or 525 nm) when compared to B3LYP (1.94 eV or 639 nm), the latter which predicted an energy more similar to the experimental value of 2.04 eV (609 nm). On this basis, we concluded that B3LYP/LANL2DZ predicted a reasonable T1. Moreover, increasing the basis set size by adding f and then f,d-polarization functions neither improved the description of S0, as explained earlier, nor the prediction of the T1 emission energy (Fig. 11).
Figure 11.

The calculated energy of the optimized T1 and S0 at T1 using different methods for Rudcbpy.
The calculated emission energies for Rubpy and RudMebpy using TDDFT/PBE0/LANL2DZ were also overestimated (2.35 eV (528 nm,) and 2.41 eV (514 nm), respectively) compared to the experimental values (2.09 eV (593 nm) and 2.20 eV (563 nm), respectively). Nevertheless, all complexes showed the expected shift that correlated with the HOMO-LUMO gap (Fig. 10). The trend in the Stokes shifts calculated for the two complexes reproduced their relative order (including the parent compound), but not the absolute energies observed experimentally (Fig. 3), where the maximum of RudMebpy emission is at 563 nm while that of Rudcbpy is at 609 nm.
Experimentally, the observed Stokes shift is largely determined by the Coulomb energy difference between S1 and T1 as well as contributions from radiationless processes such as vibrational relaxation with higher quantum yield. Theoretically, we are relating the radiationless processes to the amount of distortion of the T1 (RMSD). The system that undergoes minimal conformational reorganization between the two states will emit higher energy photons. Our calculations estimated Stokes shifts that agreed well with the calculated energy gap and RMSD (Fig. 10). To estimate the Stokes shift, the molecular orbital energies of each complex were calculated using the same level of theory at which the emission energy has been calculated. Because Ru(2H)dcbpy has the smallest HOMO-LUMO gap compared to Rudcbpy and Ru(2CO)dcbpy, its emission spectra was shifted to the far infrared (0.88 eV or 1,409 nm). Comparing complexes with different substituents, the emission energy was increasingly red shifted with decreasing the electron-donor strength: RudMebpy (2.41 eV or 514 nm), Rubpy (2.35 eV or 528 nm), Rudamidebpy (2.13 eV or 582 nm), and Rudcbpy (1.94 eV or 639 nm) (Fig. 10). The shifts observed in the emission spectra of other Ru systems constructed from imidazole, phenanthroline, and other derivatives with various ligands, are in accord with our calculations [25–27, 77–78]. Furthermore, based on the energy gap law, the rate of the radiationless decay of T1 will increase as the energy gap between the two states decreases [79]. Consequently, we predict that Ru(2H)dcbpy should exhibit the shorter triplet decay time.
4. Conclusion
The structural, HOMO-LUMO gap, and spectroscopic properties of the ground-state singlet and lowest lying triplet excited states of derivatives of Ru(bpy)(PPh3)2 with different electron-withdrawing and donor substituents and σ-donor and π-acceptor ligands trans to the bpy have been investigated by combined DFT/TDDFT calculations. The statistical measurements of the performance of ten combinations DFT/basis sets used to describe S0 geometry for [(H)Ru(CO)(PPh3)2(dcbpy)]+, followed the ‘Jacobs ladder’ classification scheme and decreased in the series double-hybrid (B2PLYPD3) > meta-hybrid (M06) > hybrid-GGA (PBE0, B3LYP, CAM-B3LYP, wB79xD) [70]. The PBE0/LANL2DZ performance was superior compared to that of B3LYP/LANL2DZ. To accurately assess the symmetry of these systems, it is essential to use methods that include the dispersion correction. Although B3LYP did not produce the most accurate geometry for the ground state, it reproduced well the experimental singlet absorption and triplet emission energies, which suggests that it will likely yield reliable predictions for the spectroscopy of other complexes. Also, we have shown with Rudcbpy that when solvent and counterions are included, the calculated excitation energies are closer to those observed in the experimental spectra.
The calculations showed that introducing electron-withdrawing groups stabilizes the bpy π* LUMOs, shifts the absorption and emission spectra to lower energies, and increases the distortion in the T1 geometry. The opposite was observed with electron-donating substituents. The bpy π* LUMOs were destabilized, the absorption and emission spectra shifted to higher energies, and there was less distortion in the T1 geometry. In addition, when the two ligands trans to bpy are strong σ-donors, the calculated T1 is much closer to S0, which predicts an unusually red-shifted luminescence and potentially lower quantum yield. This suggests that to generate complexes with less red-shifted emission and higher quantum yields, it is desirable to use weaker electron donors such as halogens or better π acceptors.
In this computational study, we have examined relationships between the HOMO-LUMO energy gap and the photophysical properties for three synthesized and three proposed Ru (II) complexes. In all cases, we observed a general trend: increased HOMO-LUMO energy gaps correlate with a blue shift in both the excitation and emission energies and less geometric distortion in T1. This correlation and the computational approach outlined here can be used to design complexes rationally and screen other organometallic candidates that may have desirable excited-state properties.
Supplementary Material
Highlights.
Combined DFT/TDDFT calculations reproduced successfully the spectroscopic data of several Ru(bpy)(PPh3)2 derivatives and the approaches outlined can be used to predict the spectroscopic properties of other complexes.
Evidence of the trans influence and the substituents effects to control the HOMO-LUMO energy gap and Stokes shift.
Small HOMO-LUMO energy gap is associated with large geometric distortion in the triplet excited state and large Stokes shift.
Acknowledgements
This work used the Extreme Science and Engineering Discovery Environment (XSEDE) resource Comet, at the San Diego Supercomputer Center (SDSC) through allocation TG-CHE160010 [80], supported by the National Science Foundation (ACI-1548562). Support was also provided by the Molecular Computational Core Facility, the Macromolecular X-ray Diffraction Core Facility, and the BioSpectroscopy Core Research Laboratory at the University of Montana, which all are operated with funds from National Institutes of Health Centers of Biomedical Research Excellence (CoBRE) Award P20GM103546 to the Center for Biomolecular Structure and Dynamics and from the University of Montana Vice President for Research and Creative Scholarship. We also acknowledge support from National Science Foundation award (NSF)-MRI CHE-1337908. S. A. acknowledges financial support from Imam Abdulrahman Bin Faisal University, Saudi Arabia. Finally, we appreciate that one of the reviewers pointed out a discrepancy between the electronic spectra of Rudcbpy previously reported [36] and those we report, which we addressed in the revision.
Footnotes
Publisher's Disclaimer: This is a PDF file of an unedited manuscript that has been accepted for publication. As a service to our customers we are providing this early version of the manuscript. The manuscript will undergo copyediting, typesetting, and review of the resulting proof before it is published in its final citable form. Please note that during the production process errors may be discovered which could affect the content, and all legal disclaimers that apply to the journal pertain.
The details of the statistical methods can be found in the supplemented material
References
- [1].Lakowicz JR, Principles of Fluorescence Spectroscopy, 3rd ed.; Springer, New York, 2006. [Google Scholar]
- [2].Shan B-Z, Zhao Q, Goswami N, Eichorn DM, Rillema DP, Coord. Chem. Rev 211 (2001) 117. [Google Scholar]
- [3].Stufkens DJ, Vleek A, Coord. Chem. Rev 177 (1998) 127. [Google Scholar]
- [4].Terpetschnig E, Szmacinski HM, Lakowicz JR, Biophys 68 (1995) 342. [DOI] [PMC free article] [PubMed] [Google Scholar]
- [5].Hagfeldt A, Gratzel M, Acc. Chem. Res 33 (2000) 269. [DOI] [PubMed] [Google Scholar]
- [6].Doherty AP, Stanley MA, Leech D, Vos JG, Anal. Chim. Acta 319 (1996) 111. [Google Scholar]
- [7].Demas JN, DeGraff BA, J. Chem. Edu 74 (1997) 690. [Google Scholar]
- [8].Barton JK, Danishefsky AT, Goldberg JM, J. Am. Chem. Soc 106 (1984) 2172. [Google Scholar]
- [9].Balzani V, Alberto C, Venturi M, Nano Today 2 (2007) 18. [Google Scholar]
- [10].Grätzel M, Nature 414 (2001) 338. [DOI] [PubMed] [Google Scholar]
- [11].Nazeeruddin Md.K., Pechy P, Renouard T, Zakeeruddin SM, Humphry-Baker R, Comte P, Liska P, Cevey L, Costa E, Shklover V, Spiccia L, Deacon GB, Bignozzi CA, Grätzel M, J. Am. Chem. Soc 123 (2001) 1613. [DOI] [PubMed] [Google Scholar]
- [12].Zakeeruddin SM, Nazeeruddin Md.K., Humphry-Baker R, Péchy P, Quagliotto P, Barolo C, Viscardi G, Grätzel M, Langmuir, 18 (2002) 952. [Google Scholar]
- [13].Salvi L, Salvini A, Micoli F, Bianchini C, Oberhauser WJ, Organomet. Chem 692 (2007) 1442. [Google Scholar]
- [14].Po LC, Man NS, Jia G, Lin Z, Coord. Chem. Rev 251 (2007) 2223. [Google Scholar]
- [15].Jun YC, Liu Y, J He R, Mol Catal A: Chem 259 (2006) 17. [Google Scholar]
- [16].Haque NF, Lough AJ, Morris RH, Inorg. Chim. Acta 361 (2008) 3149. [Google Scholar]
- [17].Buskens P, Giunta D, Leitner W, Inorg. Chim. Acta 357 (2004) 1969. [Google Scholar]
- [18].Juris A, Balzani V, Barigelletti F, Campagna S, Belser P, Zelewsky AV, Coord. Chem. Rev 84 (1988) 85. [Google Scholar]
- [19].Haga MA, Ali MM, Koseki S, Fujimoto K, Yoshimura A, Nozaki K, Ohno T, Nakajima K, Stufkens DJ, Inorg. Chem 35 (1996) 3335. [DOI] [PubMed] [Google Scholar]
- [20].Gobetto R, Caputo G, Garino C, Ghiani S, Nervi C, Salassa L, Rosenberg E, Ross JBA, Viscardi G, Martra G, Miletto I, Milanesio M, Eur. J. Inorg. Chem (2006) 2839. [Google Scholar]
- [21].Xia H, Zhang C, Liu X, Qiu S, Lu P, Shen F, Zhang J, Ma I, J. Phys. Chem. B 108 (2004) 3185. [Google Scholar]
- [22].Zhang Y, Liu Z, Yang K, Zhang Y, Xu Y, Li H, Wang C, Lu A, Sun S, Sci Rep (2015) 5. [DOI] [PMC free article] [PubMed] [Google Scholar]
- [23].Teegardin K, Day JI, Chan J, Weaver J, Org. Process Res. Dev 20 (2016) 1156. [DOI] [PMC free article] [PubMed] [Google Scholar]
- [24].Chou P-T, Chi Y, Chung M-W, Lin C-C, Coord. Chem. Reviews 255 (2011) 2653. [Google Scholar]
- [25].Rillema DP, Stoyanov SR, Cruz AJ, Nguyen H, Moore C, Huang W, Siam K, Jehan A, KomReddy V, Dalton Trans 44 (2015) 17075. [DOI] [PubMed] [Google Scholar]
- [26].Frey J, Curchod BFE, Scopelliti R, Tavernelli I, Rothlisberger U, Nazeeruddin MK, Baranoff E, Dalton Trans 43 (2014) 5667. [DOI] [PubMed] [Google Scholar]
- [27].Zarate X, Schott E, Gomez T, Arratia-Perez RJ, Phys. Chem. A 117 (2013) 430. [DOI] [PubMed] [Google Scholar]
- [28].Barolo C, Nazeeruddin MK, Fantacci S, Censo DD, Comte P, Liska P, Viscard G, Quagliotto P, Angelis FD, Ito S, Grältzel M, Inorg. Chem 45 (2006) 4642. [DOI] [PubMed] [Google Scholar]
- [29].Ronca E, Angelis FD, Fantacci S, J. Phys. Chem. C 118 (2014) 17067. [Google Scholar]
- [30].Pidcock A, Richards RE, Venanzi LM, J. Chem. Soc. A (1966) 1707. [Google Scholar]
- [31].Sajith PK, Suresh CH, Dalton Trans 39 (2010) 815. [DOI] [PubMed] [Google Scholar]
- [32].Anastasi AE, Deeth RJ, Chem. Theory Comput 5 (2009) 2339. [DOI] [PubMed] [Google Scholar]
- [33].Kapoor PN, Kakkar R, Theor. Chem 679 (2004) 149. [Google Scholar]
- [34].Kuta J, Wuerges J, Randaccio L, Kozlowski PM, J. Phys. Chem 113 (2009) 11604. [DOI] [PubMed] [Google Scholar]
- [35].Rigamonti L, Forni A, Manassero M, Manassero C, Pasini A, Inorg. Chem 49 (2010) 123. [DOI] [PubMed] [Google Scholar]
- [36].Sharmin A, Darlington RC, Hardcastle KI, Ravera M, Rosenberg E, Ross JBA, J. Organomet. Chem 694 (2009) 988. [DOI] [PMC free article] [PubMed] [Google Scholar]
- [37].Sharmin A, Salassa L, Rosenberg E, Ross JBA, Abbott JA, Black L Terwilliger M, Brooks R, Inorg. Chem 52 (2013) 10835. [DOI] [PMC free article] [PubMed] [Google Scholar]
- [38].Malecki JG, Maroń A, Trans. Met. Chem 37 (2012) 727. [Google Scholar]
- [39].Sheldrick GM, G. M. (1996). SADABS: Area Detector Absorption Correction; University of Göttingen, Germany. [Google Scholar]
- [40].Dolomanov OV, Bourhis LJ, Gildea RJ, Howard JAK, Puschmann H, J. Appl. Cryst 42 (2009) 339. [DOI] [PMC free article] [PubMed] [Google Scholar]
- [41].Sheldrick GM, Acta Cryst. A71, (2015) 3. [DOI] [PMC free article] [PubMed] [Google Scholar]
- [42].Sheldrick GM, Acta Cryst. C71, (2015) 3. [DOI] [PMC free article] [PubMed] [Google Scholar]
- [43].Spek AL, Acta Cryst. C71, (2015) 9. [DOI] [PubMed] [Google Scholar]
- [44].Spek AL, Acta Cryst. D65, (2009) 148. [DOI] [PMC free article] [PubMed] [Google Scholar]
- [45].Bruker (2007). APEX2 Bruker AXS Inc., Madison, Wisconsin, USA. [Google Scholar]
- [46].Sheldrick GM, Acta Cryst. A64, (2008) 112. [DOI] [PubMed] [Google Scholar]
- [47].Lee C, Yang W, Parr RG, Phys. Rev. B 37 (1988) 785. [DOI] [PubMed] [Google Scholar]
- [48].Perdew JP, Burke K, Ernzerhof M, Phys. Rev. Lett 77 (1996) 3865. [DOI] [PubMed] [Google Scholar]
- [49].Yanai T, Tew DP, Handy NC, Chem. Phys. Lett 393 (2004) 57. [Google Scholar]
- [50].Zhao Y, Truhlar DG, Theor. Chem. Account 120 (2008) 215. [Google Scholar]
- [51].Zhanga Y, Xua X, Goddard WA, Proc. Natl. Acad. Sci USA 106 (2009) 4963. [DOI] [PMC free article] [PubMed] [Google Scholar]
- [52].Minenkov Y, Singstad A Occhipinti G Jensen VR, Dalton Trans 41 (2012) 5526. [DOI] [PubMed] [Google Scholar]
- [53].Frisch MJ, Trucks GW, Schlegel HB, E Scuseria G, Robb MA, Cheeseman JR, Scalmani G, Barone V, Mennucci B, Petersson GA, Nakatsuji H, Caricato M, Li X, Hratchian HP, Izmaylov AF, Bloino J, Zheng G, Sonnenberg JL, Hada M, Ehara M, Toyota K, Fukuda R, Hasegawa J, Ishida M, Nakajima T, Honda Y, Kitao O, Nakai H, Vreven T, Montgomery JA, E Peralta J, Ogliaro F, Bearpark M, Heyd JJ, Brothers E, Kudin KN, Staroverov VN, Kobayashi R, Normand J, Raghavachari K, Rendell A, Burant JC, Iyengar SS, Tomasi J, Cossi M, Rega N, Millam JM, Klene M, Knox JE, Cross JB, Bakken V, Adamo C, Jaramillo J, Gomperts R, Stratmann RE, Yazyev O, Austin AJ, Cammi R, Pomelli C, Ochterski JW, Martin RL, Morokuma K, Zakrzewski VG, Voth GA, Salvador P, Dannenberg JJ, Dapprich S, Daniels AD, Farkas O, Foresman JB, Ortiz JV, Cioslowski J, Fox DJ. Gaussian 09, Revision D. 01, Gaussian, Inc., Wallingford CT, 2013. [Google Scholar]
- [54].Hay PJ, Wadt WRJ, Chem. Phys 82 (1985) 299. [Google Scholar]
- [55].Andrae D, Haussermann U, Dolg M, Stoll H, Preuss H, Theor. Chim. Acta 77 (1990) 123. [Google Scholar]
- [56].Ehlers AW, Bohme M, Dapprich S, Gobbi A, Hollwarth A, Jonas V, Kohler FK, Stegmann R, Veldkamp A, Frenking G, Chem. Phys. Lett 208 (1993) 111. [Google Scholar]
- [57].Check CE, Faust TO, Bailey JM, Wright BJ, Gilbert TM, Sunderlin LSL, Phys. Chem. A 105 (2001) 8111. [Google Scholar]
- [58].Swart M, Snijders JG, Theor. Chem. Acc 110 (2003) 34. [Google Scholar]
- [59].Miertuš S, Scrocco E, Tomasi J, Chem. Phys 55 (1981) 117. [Google Scholar]
- [60].Scalmani G and Frisch MJ, J. Chem. Phys 132 (2010) 114110. [DOI] [PubMed] [Google Scholar]
- [61].Onsager L, J. Am. Chem. Soc 58 (1936) 1486. [Google Scholar]
- [62].Runge E, Gross EKU, Phys. Rev. Lett 52 (1984) 997. [Google Scholar]
- [63].O’Boyle NM, Tenderholt AL, Langner KM, J. Comp. Chem 29 (2008) 839. [DOI] [PubMed] [Google Scholar]
- [64].Ziegler T, Rauk A, Baerends E, Theor. Chim. Acta 43 (1977) 261. [Google Scholar]
- [65].Daul C, Int. J. Quantum Chem 52 (1994) 867. [Google Scholar]
- [66].Frisch MJ, Trucks GW, Schlegel HB, E Scuseria G, Robb MA, Cheeseman JR, Scalmani G, Barone V, Petersson GA, Nakatsuji H, Li X, Caricato M, Marenich AV, Bloino J, Janesko BG, Gomperts R, Mennucci B, Hratchian HP, Ortiz JV, Izmaylov AF, Sonnenberg JL, Williams-Young D, Ding F, Lipparini F, Egidi F, Goings J, Peng B, Petrone A, Henderson T, Ranasinghe D, Zakrzewski VG, Gao J, Rega N, Zheng G, Liang W, Hada M, Ehara M, Toyota K, Fukuda R, Hasegawa J, Ishida M, Nakajima T, Honda Y, Kitao O, Nakai H, Vreven T, Throssell K, Montgomery JA Jr., Peralta JE, Ogliaro F, Bearpark MJ, Heyd JJ, Brothers EN, Kudin KN, Staroverov VN, Keith TA, Kobayashi R, Normand J, Raghavachari K, Rendell AP, Burant JC, Iyengar SS, Tomasi J, Cossi M, Millam J, Klene M, Adamo C, Cammi R, Ochterski JW, Martin RL, Morokuma K, Farkas O, Foresman JB, Fox DJ, Gaussian 16, Revision A.03, Gaussian, Inc., Wallingford CT, 2016. [Google Scholar]
- [67].Reed AE, Curtiss LA, Weinhold F, Chem. Rev 88 (1988) 899. [Google Scholar]
- [68].Bader RFW, Atoms in molecules—A Quantum Theory, Oxford University Press, Oxford, UK, 1990. [Google Scholar]
- [69].AIMAll (Version 16.01.09), Todd A Keith TK Gristmill Software, Overland Park KS, USA, 2016. (aim.tkgristmill.com). [Google Scholar]
- [70].Perdew JP, Schmidt K in Density Functional Theory and Its Application to Materials, edited by Van Doren V, Van Alsenoy C, and Geerlings P, AIP, Melville, NY, 2001. [Google Scholar]
- [71].Coskun D, Jerome SV, Friesner RA, J. Chem. Theory Comput 12 (2016) 1121. [DOI] [PubMed] [Google Scholar]
- [72].Cancès E, Mennucci BJ, Math. Chem 23 (1998) 309. [Google Scholar]
- [73].Atkins AJ, Talotta F, Freitag L, Boggio-Pasqua M, González L, J. Chem. Theory Comput 13 (2017) 4123. [DOI] [PubMed] [Google Scholar]
- [74].Thompson DW, Ito A, Meyer TJ, Pure Appl. Chem 85 (2013) 1257. [Google Scholar]
- [75].Freeman GR, Williams JAG, Density Functional Theory in the Design of Organometallics for Energy Conversion. in: Wong WY. (eds) Organometallics and Related Molecules for Energy Conversion Green Chemistry and Sustainable Technology; Springer, Berlin, Heidelberg, 2015. [Google Scholar]
- [76].Humphrey W, Dalke A, Schulten KJ, Molec. Graphics 4 (1996) 33. [DOI] [PubMed] [Google Scholar]
- [77].Islam A, Sugihara H, Singh LP, Hara K, Katoh R, Nagawa Y, Yanagida M, Takahashi Y, Murata S, Arakawa H, Inorg. Chim. Acta 322 (2001) 7. [DOI] [PubMed] [Google Scholar]
- [78].Datta P, Sardar D, Saha R, Mondal TK, Sinha C, Polyhedron 53 (2013) 193. [Google Scholar]
- [79].Englman R, Jortner J, Mol. Phys 18 (1970) 145. [Google Scholar]
- [80].Towns John, Cockerill Timothy, Dahan Maytal, Foster Ian, Gaither Kelly, Grimshaw Andrew, Hazlewood Victor, Lathrop Scott, Lifka Dave, Peterson Gregory D., Roskies Ralph, Ray Scott J, Wilkins-Diehr Nancy, “XSEDE: Accelerating Scientific Discovery”, Computing in Science & Engineering, vol.16, no. 5, pp. 62–74, Sept.-Oct. 2014, doi: 10.1109/MCSE.2014.80 [DOI] [Google Scholar]
Associated Data
This section collects any data citations, data availability statements, or supplementary materials included in this article.