Graphical Abstract:
Introduction
Polymeric oral controlled dosage development is considered to be an economical and immediate method of drug consumption for reducing the inconvenience caused by the frequent dosing of conventional tablets, and can improve the patients’ quality of life (QOL) [1]. Moreover, the increased use of additive manufacturing (AM), also as known as three-dimensional (3D) printing technology, has provided a practical solution to the individual and complex consumption of oral controlled drug delivery systems (DDS’). 3D printing is the layer-by-layer production of 3D objects from digital blueprints [2]. This technology is more efficient and economical compared to the development of new active pharmaceutical ingredients or excipients, new manufacturing processes, or protocols. Additionally, 3D printing technology provides an alternative approach toward engineering release profiles by controlling the spatial distribution within a given polymer composition instead of creating a new host material [3].
In the pharmaceutical industry, solid dispersions represent a promising formulation approach toward overcoming the current major challenge of developing a bioavailable solid dosage form for more than 50% of drug candidates that are poorly soluble in water [4, 5, 6]. Processing technologies such as spray drying (SD), hot-melt extrusion (HME), KinetiSol® dispersing (KSD), freeze-drying (FD), rotary evaporation (RE), co-precipitation (CP), centrifuge vacuum drying (CVD), and microwave technology [7], can be used to prepare the solid dispersions. The Hot-melt extrusion (HME) is the preferred option in pharmaceutical solid dispersion development because of the favorable powder properties, absence of organic solvents in processing, small carbon footprint of the equipment, ease of increasing the batch size, scalability from a pilot to an industrial setting, and suitability to continuous processing. [8][9] HME is a term used in the pharmaceutical industry to differentiate the abovementioned method from traditional oral dosage manufacturing techniques, such as direct compression and tableting [10]. HME involves the use of single-rotor or, mostly, twin-rotor, extruders for processing typically water-soluble polymeric excipients. This is achieved by mixing these excipients with active pharmaceutical ingredients (APIs) while they are molten, so as to affect the partial or total dissolution of the API. Additionally, the homogeneous mixture is pumped through a die to form an extrudate, when the API exists in a totally or partially dissolved but (in both cases) stable, form [11][12].
HME was first used in the plastics and rubber industry in the 1930s. The pharmaceutical hot melt extrusion (HME) is currently investigated both by the industry and academia as a method of increasing the release rate of poorly water-soluble APIs to potentially enhance their bioavailability by melt-mixing them with hydrophilic, water-soluble polymers [13]. HME helps in overcoming the poor bioavailability of APIs, and in creating new modified-release drug systems. Additionally, it can serve as a unit operation to taste-mask the bitterness of a tablet. Moreover, an increasing body of literature is actively concerned with the production of controlled release dosages by melt-mixing readily water-soluble APIs with rate-controlling polymers [11].
In comparison with traditional pharmaceutical product manufacturing processes, the combination of HME and 3D printing technology as a continuous process highlights their respective advantages as follows: 1) increases the solubility and bioavailability of poorly water-soluble drugs; 2) produces more complex structured dosages and personalized drug products. Moreover, the combination of these two technologies reduces the downstream process and thus renders it more efficient and economical. In particular, in the U.S.A, the Food and Drug Administration has encouraged drug-makers to produce solid oral dosages that can meet the increasing demands of oral drug delivery, with regard to the bioavailability of APIs and drug release characteristics, in a continuous and controlled process [14].
Among the AM techniques, filament-based fused depositional modeling (FDM) is the most widely used and commercialized in the pharmaceutical industry[15][16]. Because of the worldwide enthusiasm of individualized dosage development, more AM research and applications are expected in the next few years. Even though several biodegradable polymers have been investigated, such as polyethylene oxide/polycyclooctene [17], ethyl cellulose (EC), hydroxypropyl methylcellulose (HPMC) E5[18], polyvinylpyrrolidone K30 [19], and Eudragit® L100 [20], to print pharmaceutical dosage forms, researchers have rarely focused on characterizing filaments and evaluating whether they are suitable for 3D printing. The objectives of the current investigation are to gain a general understanding of different polymer matrices and their impact on in vitro drug release performance. In addition, characterization of the physiochemical and mechanical properties of HME filaments by a novel Repka-Zhang method were employed. Polymer matrices will be screened for 3D printing and a preliminary standard will be established to guide the following investigations for future 3D printed filament development.
2. Materials and Methods
2.1. Materials
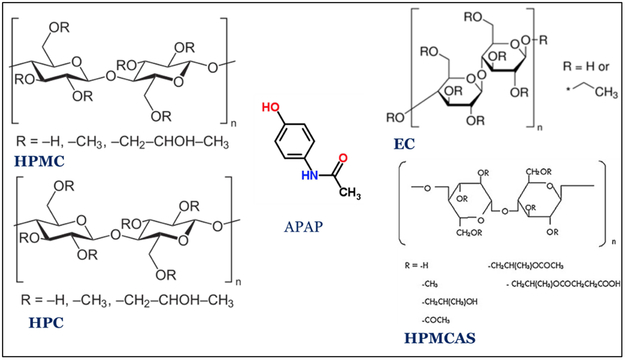
Acetaminophen (APAP) (Spectrum Chemicals, Gardena CA) was chosen as the API model. APAP is a crystalline BCS I drug with a melting point of 169-170 °C. AquaSolve™ hypromellose acetate succinate (HPMCAS) LG and HG, Benecel™ hydroxypropyl methylcellulose (HPMC) E5 and K100M, Klucel™ Hydroxypropyl cellulose (HPC) EF and HF, and Aqualon™ ethylcellulose EC N14 were donated by Ashland®. The chemical structure were shown in figure 1. Diluted water was used for all formulations and solutions. All other reagents were either HPLC or analytical grade.
Figure 1.
2D chemical structures of cellulose polymers tested and the model API.
2.2. Formulation
In this study, various formulations were investigated and separated into two different stages. First, seven different types and grades of pure polymer, without a drug-loaded polymer, were extruded. Then, seven formulations of single polymer with 30% w/w drug loading were tested. Polylactic acid (PLA) without drug loading was used as reference (Table 1). To obtain the physical mixtures, raw materials were prepared and mixed using Maxiblend™ (GlobePharma, New Brunswick, NJ, USA) at 25 RPM for 20 min, after having passed through a US#30 mesh screen to remove any formed aggregates.
Table 1.
Operational parameters and process trends for the 7 different formulations during HME process.
| T (°C) | Torque (N*m) | Pressure (bar) | ||||
|---|---|---|---|---|---|---|
| without drug | PM | without drug | PM | without drug | PM | |
| HPC EF | 140 | 140 | 12 | 2.4 | 100 | 7 |
| HPC HF | 170 | 150 | 5.55 | 2 | 28.5 | 11.5 |
| HPMC E5 | 190 | 150 | 8.4 | 4.26 | 47 | 23.5 |
| HPMC K100M | N/A | 190 | N/A | 6.7 | N/A | 77.5 |
| HPMCAS LG | 200 | 150 | 6.6 | 2.16 | 19 | 9 |
| HPMCAS HG | 200 | 150 | 4.6 | 4.32 | 6 | 10 |
| EC N14 | 150 | 150 | 7.2 | 4 | 45 | 20 |
2.3. Pre-formulation Analysis
2.3.1. Thermogravimetric analysis (TGA)
All samples were prepared with open aluminum pans. A thermogravimetric analyzer (TGA 1-Pyris, PerkinElmer, Inc., USA) was used to heat the samples from 30 °C to 500 °C at a rate of 20 °C/min. Ultra-purified nitrogen was used as a purge gas with a flow rate of 25 ml/min. Data collection and analysis were performed using the PerkinElmer Pyris™ software, and the per cent mass loss and/or onset temperature were calculated.
2.3.2. Differential scanning calorimetry (DSC)
All samples were prepared with TA aluminum pans and lids (Tzero) with an average sample mass of 5-10 mg. Measurements were made using a differential scanning calorimeter (Discovery DSC 25, TA Instruments, USA) at a heating rate of 10 °C/min. A heat-cool-heat cycle was used for the conventional physical mixtures. In all experiments, ultra-purified nitrogen was used as a purge gas with a flow rate of 50 ml/min. Data were collected and analyzed using the Trios software (TA Instruments). All melting temperatures are reported as extrapolated onset, unless otherwise noted.
2.3.3. Polarized light microscopy (PLM)
Polarized light microscopy observations were made using a polarizing microscope (DM 2500 P, LEICA) equipped with a video camera and a hot thermostated stage (TMS 94, Linkam Scientific Instruments, Ltd.) connected to the temperature programmer. All samples were heated from 25 °C to 220 °C at 10 °C/min, and videos were recorded from the start until cooling to room temperature.
2.4. Preparation of 3D printable filaments
The Process 11 Parallel Twin-Screw Extruder (Thermo Fisher Scientific, MA, USA) with a standard screw design, and the Antaris II FT-NIR Analyzer (Thermo Fisher Scientific, MA, USA) inserted as a process analytical technology (PAT) tool, were used to prepare the 3D printable filaments. All physical mixtures were extruded at 50 RPM. The temperature settings for the different formulations are listed in Table 2. An extrusion die with a 2 mm round shape outlet was used to manufacture the 3D filaments. A conveyor belt was used to cool and straighten the filaments before loading them into the 3D printer.
Table 2.
Geometry study of the tablets. (n = 10, arithmetic mean±SD).
| Diameter (mm) |
Thickness (mm) |
Weight (mg) | Weight variation % |
Hardness (kp) |
Fail per 10 prints |
|
|---|---|---|---|---|---|---|
| HPMC E5 | 11.22±0.07 | 4.46±0.05 | 395.58±18.72 | 4.73 | OV* | 0 |
| HPMC K100M | 10.51±0.24 | 4.22±0.21 | 377.91±24.73 | 6.54 | OV* | 8 |
| HPMCAS LG | 10.33±0.28 | 4.40±0.22 | 366.93±26.12 | 7.11 | 32.8±5.6 | 6 |
| HPMCAS HG | 10.91±0.30 | 4.29±0.19 | 352.04±24.94 | 7.08 | 32.2±5.3 | 6 |
| EC N14 | 10.47±0.16 | 4.42±0.05 | 354.19±16.92 | 4.77 | 23.8±6.5 | 5 |
OV=over the limit.
2.5. Characterization and evaluation of filaments
2.5.1. Repka-Zhang test of the mechanical properties of filaments
The flexibility, brittleness, and stiffness are critical properties that determine whether the filaments are suitable for 3D printing (fused deposition modelling). The mechanical property evaluation methods were developed by specific methodologies herein referred to as the Repka-Zhang test[18].
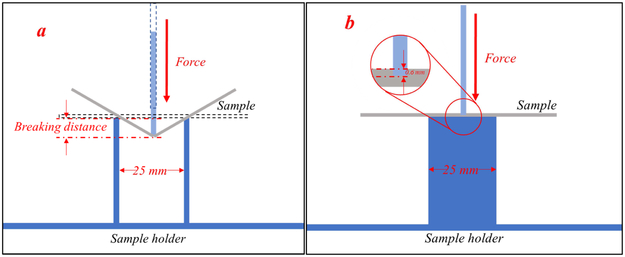
For the flexibility and brittleness evaluation, a TA-XT2 analyzer (Texture Technologies Corp, New York, NY, USA) and the TA-95N probe set with a 25 mm supporting gap were used for the flexibility and brittleness tests. The extruded filament samples were collected and cut into rods with a length of 5 cm, then placed on the sample holder as shown in Figure 2a. The blades moved with a speed of 10 mm/s until reaching a maximum distance of 15 mm below the supported sample. Testing for each single filament formulation was repeated 15 times. The breaking distance and load force/stress data were recorded and analyzed using the Exponents software (Texture Technologies Corp. and Stable Micro Systems, Ltd., Hamilton, MA, USA).
Figure 2.
Experimental set-up for Repka-Zhang test of the a) flexibility and brittleness; and b) stiffness of the filaments.
For stiffness analysis, the experimental set up was similar as the abovementioned test. However, the sample holder was a solid flat metal surface. These filament samples were collected and cut into a length of 5 mm, then placed on the flat surface of the sample holder as shown in Figure 2b. The blade penetrated the sample with a 35% change in shape/deformation (0.6 mm), and breaking stress/force data were collected. Again, each single filament formulation was repeated 15 times and analyzed using the Exponents software.
2.5.2. Fourier-transform infrared spectroscopy (FTIR)
All of the extruded samples were milled using a home-style coffee grinder and then sieved using a 40 mesh, then were investigated using a Varian 600 series FTIR spectrophotometer (Agilent, Waltham, MA, USA) equipped with an ATR unit. Samples were positioned onto the face of the diamond crystal of the ATR unit, and the tip of the micrometre clamp was compressed onto the particles to allow the adequate contact to get a characteristic spectrum. Backgrounds were collected using 32 scans for each 4 hr during the FTIR measurements, while the samples spectrum were by scanning the specimens 32 times over a 750–4000 cm−1 range at a resolution of 4 cm−1 per sample.
2.5.3. Powder X-ray diffraction (PXRD)
PXRD analyses were performed on a Bruker D8 Focus™ diffractometer with Cu radiation. The diffracted radiation was detected using the LynxEye™ Position Sensitive Detector. The X-ray generator power was set to 40 kV and 40 mA. A silicon standard was analyzed to check the instrument alignment. Then, the specimen was analyzed with a continuous scan from 4° to 40° 2θ. The sample was packed onto a 25 mm poly(methyl methacrylate) (PMMA) holder to form a disc-shaped specimen.
2.5.4. Rheology analysis
Raw materials and milled extrudates were prepared for rheology analysis. A DSR 502 dynamic shear rheometer (Anton Paar, Ashland, VA, USA) was used to conduct a frequency sweep investigation. For all samples, the rheometer run at 170 °C in the range of 1-100 rad/s, and a temperature sweep was conducted at 1 rad/s in the range of 100 °C to 180 °C.
2.6. 3D printing
The tablets were designed using the Microsoft 3D Builder (Microsoft, Redmond, WA, USA) and converted to the .gcode file format using the CURA software (v. 15.04; Ultimaker, Geldermalsen, The Netherlands). The tablet dimensions (diameter of 10 mm; thickness of 4.5 mm) were determined based on the drug load. The tablets were fabricated with the extruded filaments using a commercial fused deposition modelling (FDM) 3D printer (Prusa i3 3D desktop printer, Prusa Research, Prague, Czech Republic) with an extruder that has an E3D V6 hot end and a 0.4-mm nozzle. The following printer settings produced the best tablets: a standard resolution with the raft option activated and an extrusion temperature of 200 °C. The other settings were as follows: bed temperature of 50 °C; printing speed of 50 mm/s; nozzle traveling speed of 50 mm/s; layer height of 0.10 mm; outside shell thickness of 0.4 mm. The infill percentage was set to 100%, so as to allow the printing of tablets with optimum characteristics. Then, the dimensions and weights of the 3D printed tablets were measured.
2.7. Assessment of tablet morphology
A digital caliper (VWR1, PA, U.S.A) was used to determine the diameter and thickness of the tablets, and a camera (Canon 60D, Canon, Tokyo, Japan) was used to capture images of the tablets. Cross-sectional images of the 3D printed tablets, extrudate tablets, and directly compressed tablets were captured using electron scanning microscopy (SEM).
2.8. Determination of tablet strength
A standard tablet hardness tester (VK200; Agilent Technologies, Santa Clara, CA, USA) with a maximum force of 35 kp was used to measure the tablets’ hardness. Six tablets from each tablet group were tested.
2.9. In vitro drug release investigation
The drug release from the 3DP tablets was determined using a U. S. Pharmacopeia-II (USP-II) standard dissolution apparatus (Hanson SR8-plusTM; Hanson Research, Chatsworth, CA, USA). Dissolution tests were conducted according to the USP standards by using the Simulated Intestinal Fluid TS (without pancreatin; pH 6.8), which adequately represents the small intestinal fluid of humans. Each experiment was carried out in triplicate using 900 mL of dissolution medium at 37±0.5 °C for 24 h. The paddle speed was set to 50 rpm. Samples were taken at 0.5, 1, 2, 4, 6, 8, 10, 12, and 24 h, and subjected to analysis. The amount of released APAP was determined using HPLC equipment (Waters Corp., Milford, MA, USA) at 246 nm, and analyzed using the Empower software (v. 2, Waters Corp.).
3. Results and discussion
3.1. Thermal stability of materials
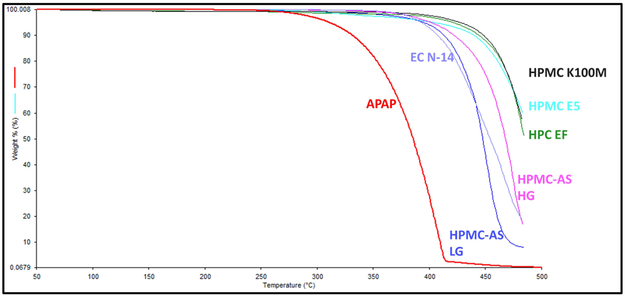
The thermal behavior of pure APAP and each polymer matrix was investigated by conducting TGA. The APAP exhibited a mass loss step starting at approximately 260 °C, which is attributed to the decomposition of its chemical structure. The mass loss recorded during the applied thermal protocol was continuous, and the final residue was 3.8%. All of the polymer excipients exhibited better thermal stability compared to the API, which did not degrade until the heat exceeded 360 °C (Figure 3). As mentioned in Section 2.3 and presented in Table 1, the process temperature was below 200 °C, which means that the API or the polymers will not be degraded under the processing temperatures.
Figure 3.
Thermal degradation graph of the APAP and polymer excipients.
3.2. PLM
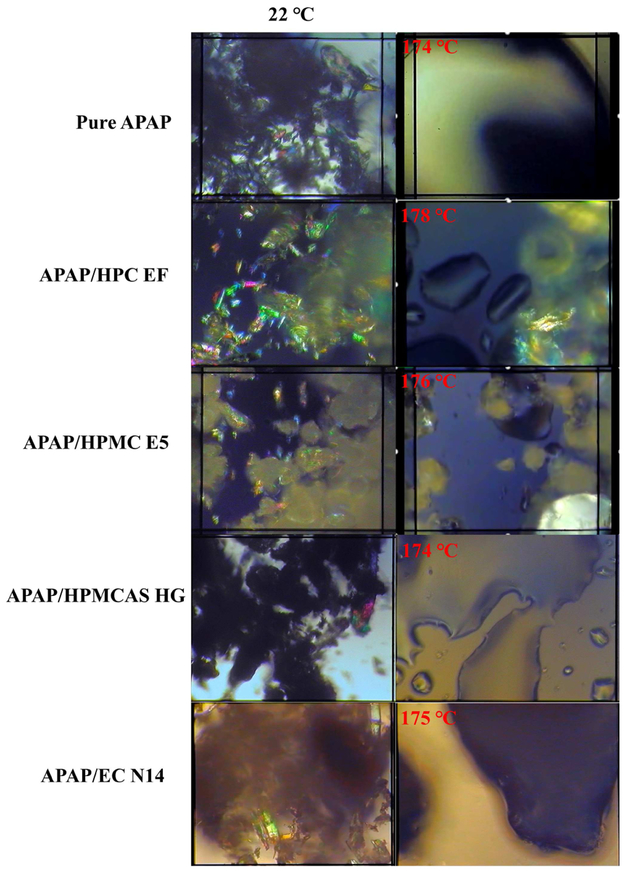
PLM has been widely used to determine the melting behavior and crystalline transformation of all raw materials and physical mixtures [21]. Owing to space limitations, only one grade of each polymer matrix is shown in Figure 4. The needle-shaped pure APAP had crystalline structure at room temperature. This structure melted above 174 °C and completely transformed to amorphous states. For the HPC formulations, the HPC matrix also exhibited crystalline structures at room temperature. However, owing to the particle size and crystalline shape, we can easily distinguish the difference between the APAP and the HPC particles. Once heated above the melting point, the APAP lost its crystalline structure, although various HPC particles retaining a semi-crystalline shape were still present. This suggests that the HPC matrix may have an issue with regard to forming an amorphous solid dispersion with the APAP. For the HPMC formulations, the polymer particles did not exhibit crystalline structures, although they included various non-melted polymers after heating. To possess the amorphous solid dispersions (ASD), mixing zones (kneading blocks) are required to help the mixtures transition from crystalline to amorphous. The HPMCAS particles did not exhibit a crystalline structure. Additionally, the physical mixture was completely molten, while the APAP dissolved and dispersed into the polymer matrix. For the EC formulation, owing to the thick and opaque molten mixtures, it was difficult to visually confirm whether the APAP dispersed into the polymer matrix. DSC and PXRD investigations were conducted to confirm the transformation and miscibility of the APAP with the polymer matrix.
Figure 4.
The melting behaviors and crystalline transformation under PLM.
3.3. Extrusion
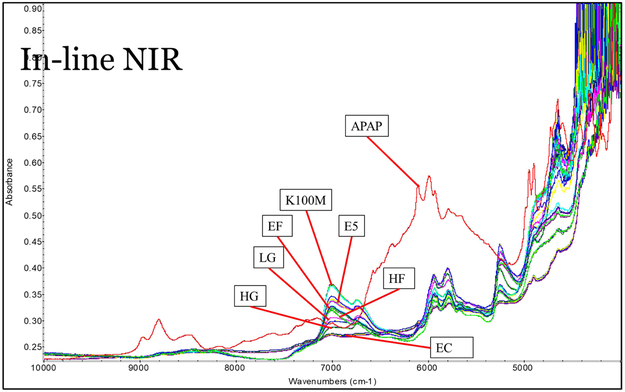
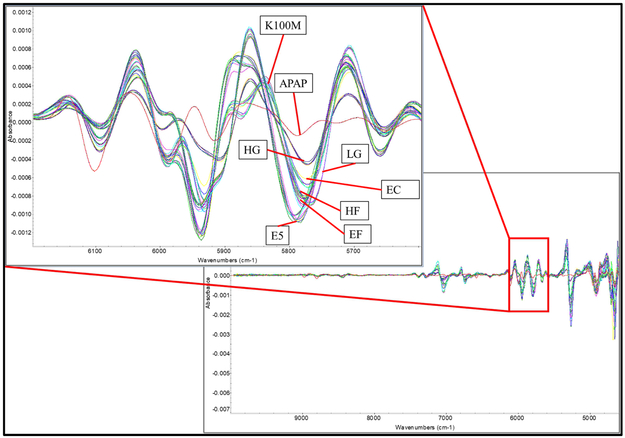
Polymer without drug loading was extruded for reference purposes. However, owing to the large molecular weight, HPMC K100M could not be extruded below 220 °C with a standard screw design at 50 rpm. For the extrusion of drug-loaded filaments, multiple in-line NIR spectra were collected continuously to monitor the extrusion process. As can be seen in Figure 5, the multiple spectra of each formulation, with the exception of the HPMC K100M grades, overlapped perfectly. This suggests the homogeneity of the filaments and the high reproducibility of the extrusion process. Owing to the massive molecular weight and high melt viscosity, the HPMC K100M grade formulation was still hard to extrude, as was also confirmed by the high torque and die pressure during the extrusion process. Comparing the raw NIR spectrum with those of the pure API and polymers, it was found that the peak area of approximately 6,000 cm−1 could be used to both qualify and quantify the APAP in the extrudates. The raw spectrum of the extrudates indicates that the signal at this range decreased, while the 2nd derivative of the spectrum indicates that peaks slightly shifted to the lower energy side. This suggests an interaction between the APAP and the polymer matrix. The APAP may have acted as a plasticizer forming hydrogen bonds, and thus lowering the energy of the system during the extrusion process (see fig 6).
Figure 5.
The raw inline NIR spectrum collected during the extrusion process.
Figure 6.
The 2nd derivative of the collected inline NIR spectrum during the extrusion process.
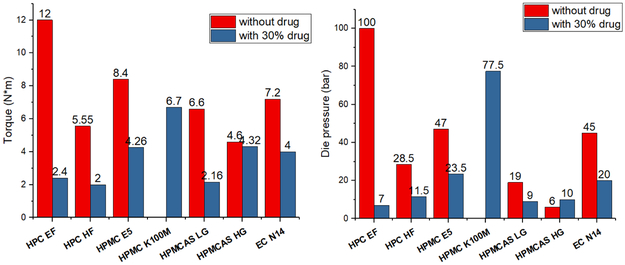
The extrusion parameters were also recorded and are presented in Figure 7. The torque, die pressure, and the lowest extrudable temperature decreased when 30% w/w of APAP was added into the formulation. This suggests that the drug loaded physical mixtures had good extrudability compared to that of the polymers without drug loading. As was observed through the mechanical characterization of filaments, the extrudability and mechanical properties were correlated. The higher the extrusion torque and die pressure were, the stronger and stiffer were the obtained filaments.
Figure 7.
a) Process torque and b) die pressure of polymer without drug loading and with 30% APAP loaded formulations during HME processing.
3.4. Filament evaluation
The primary objective of this study was to manufacture a drug-loaded filament that can be widely used by a variety of FDM 3D printers. Several physical and chemical characterizations were conducted to determine the appropriate properties of the filaments to be printed. In this study, PLA was used as a reference for comparing the differences between commercially available filaments and extruded filaments.
3.4.1. Crystallinity
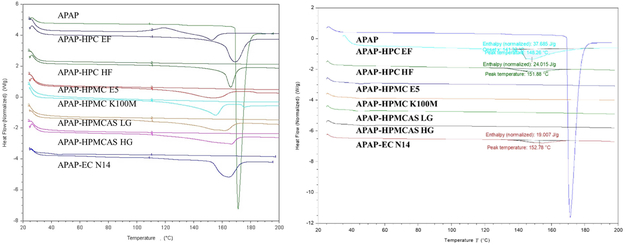
DSC investigations were conducted to determine the crystallinity transformation during the thermal process. All physical mixtures were heated and cooled, and subsequently reheated. Hence, a melting peak was clearly observed during the first heating ramp, which indicates the initial crystalline structures of the API. During the 2nd heating ramp, the melting peaks disappeared, with the exception of the HPC EF formulation, which exhibited an attenuated melting peak (Figure 8a)). This indicates that the API completely or partially dissolved, or dispersed into the polymer matrix. All extruded filaments were milled and also subjected to DSC analysis. As can be seen in Figure 8b), the analysis results were similar to those of the physical mixtures (PM) 2nd heating ramp. The HPC EF, HF, and EC formulations still exhibited enthalpy of melting, which suggests that they still consisted of crystalline APAP, although it was attenuated compared to the melting enthalpy of their physical mixtures. In summary, the HME process allows for the conversion of the API to an amorphous form, or the dispersion of API at the molecular level, which can result in enhanced bioavailability.
Figure 8.
DSC results of the a) physical mixtures and b) milled extruded filaments.
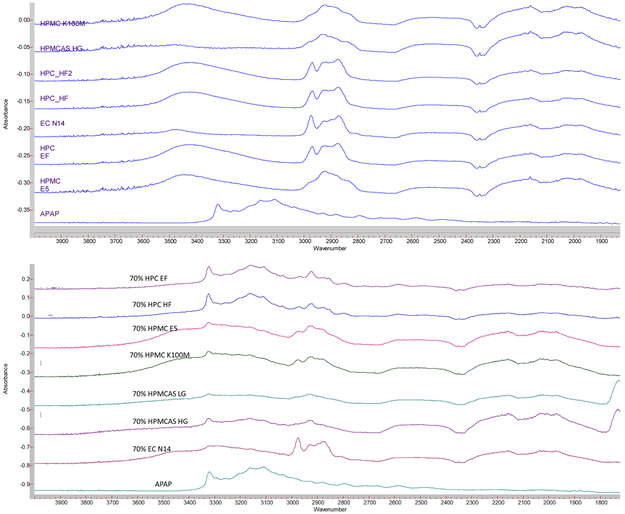
FTIR techniques have been widely used in the field of analytical chemistry, and particularly for the analysis of organic compounds and polymers [22]. Moreover APAP has alcohol and amide functional groups, whose absorption peak is approximately 3,350 cm−1 and 3,200 cm−1, whereas polymers do not have nitrogen functional groups (Figure 9(a)). From the APAP spectrum shown in in Figure 9(b), it is obvious that alcohol and amide groups existed. However, in the extrudates, HPC formulation still exhibited an -OH peak, which indicates that the APAP only mixed with the polymer. In the other formulations both the -OH and -NH peaks either decreased or disappeared, possibly owing to the molecular level mixing or formation of the hydrogen bonds during the HME process.
Figure 9.
FTIR spectrum of the a) raw materials and b) milled extruded filaments.
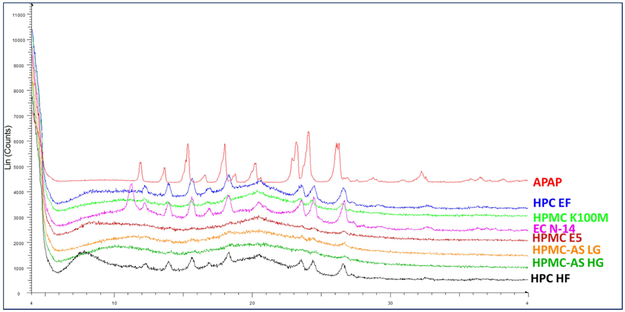
X-ray powder diffraction (XRD) has been used for the phase identification of crystallinity, and can provide information at the unit cell level [23]. The extrudates were finely ground and homogenized. As can be seen in Figure 10, the HPC EF, HF, and EC N14 formulations still exhibited crystalline APAP structures, which indicates the poor miscibility of the APAP with these two matrices. The XRD, FTIR, and DSC data cross-verified the crystalline transformation of the APAP during the HME process. Additionally, the APAP could easily dissolve or disperse into the HPMC and HPMCAS polymer matrix and form amorphous solid dispersions. Moreover, APAP had difficulty in forming an amorphous solid dispersion with an HPC or EC matrix, even when it was assisted by high temperature and the mechanical force from the HME process.
Figure 10.
PXRD curve of the APAP and milled extruded filaments.
3.4.2. Mechanical properties of filaments
One of the primary objectives of this study was to produce filaments with adequate mechanical and rheological properties, and to print tablets with predicted drug release profiles. The printability of different formulations depends on the mechanical and rheological properties of the extruded filaments. The FDM based 3D printing was developed by the plastics industry, and PLA is one of the most widespread commercially available materials. In this study, a PLA plastic material was selected as the reference material to evaluate the mechanical and rheological properties of the drug-loaded extruded materials. During the 3D printing process, fifteen batches of each filament were tested to ensure that they could be successfully fed into the hot end of the printer and printed without failing more than six times. The filaments that passed this test were considered as adequate for 3D printing.
The three-point bend test is a classic experiment in mechanics and is used to measure the Young’s modulus of a material in the shape of a strip, bar, or stick, for example. The material with length L rests on two supports and is subject to a concentrated load at its center [24]. In this work, specified method set-up for evaluation of the printability of the filaments were developed and collectively coined as Repka-Zhang methods, which included the (1) flexibility and brittleness/toughness test and (2) the stiffness test.
Flexibility and brittleness are two of the most critical parameters for determining the mechanical properties to assess whether a filament can be successfully fed into a 3D printer. In this study, flexibility can be defined as the tolerance of the filament to bending without breaking. Moreover, good toughness/brittleness can be defined as the breaking of the filament without significant plastic deformation, when the filament is subjected to loading. Toughness is a term used to describe a structure with high ductility [25]. From the experimental setup and observation, the following performance of the filaments under the Repka-Zhang test were observed:
Filaments were brittle and breaks into two segments. The recorded force increases after contacting the sample and reached a peak at the break point of the filament.
Filaments were flexible and did not break during the test. As observed, the recorded force increases after contacting the sample and reached a peak, which is the nonelastic strain for the filaments.
Filaments were too soft and moved with the blade. The force continues to be low until the end of the test.
In this work, the distance of the applied force from the start to a peak point were defined as the breaking distance, which was used to determine the flexibility of the filaments. In general, the greater breaking distance indicated better flexibility of the filaments. The peak force or the stress was defined as the breaking force/stress which were used to determine the toughness/brittleness of the filaments. The greater force/stress indicates tough filament. It was observed that the HPC EF and HF filaments were too soft, not strong enough as described in (iii) section to push the molten material out of the nozzle when fed in to 3D printer. The HPMC filaments showed adequate flexibility and toughness as described in (ii), the E5 filaments can be printed without fail. Whereas, HPMCAS HG, LG grade, and EC N14 formulations break into two segments during the test, and are not as flexible as the HPMC filaments, but can be successfully printed with rare failure.
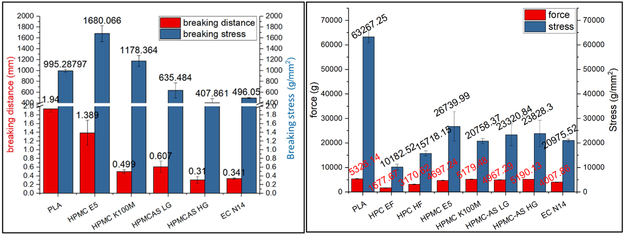
The filaments in Figure 11(a) exhibited poor flexibility compared to that of the reference PLA material. The HPMC E5 filaments exhibited good flexibility (breaking distance=1.389 mm) and toughness (breaking stress > 995.3 g/mm2). The HPMC K100M filaments exhibited good mechanical properties and could be fed into the printer. However, the printing was difficult because of their rough surface and high viscosities at 200 °C. The EC filaments were neither flexible nor robust (small breaking distance=0.341 mm) and were easily fractured by the feeding gear. Both HPMCAS grades were more tough compared to the EC formulation, but exhibited poor flexibility. Additionally, these two filaments were easily fractured during the feeding process.
Figure 11.
a) Repka-Zhang test of the breaking distance and stress and b) stiffness test results of breaking stress and force of extruded filaments.
Stiffness is another critical property for determining the printability of filaments and is used to describe the mechanical properties of a structure, such as the load required to achieve a certain deformation. This relationship is expressed as follows:
There are different varieties of possible load configurations (force, stress, and arbitrary groups of forces) acting on a structure. Additionally, an infinite number of possible points exists in a structure, where the deformation (displacement, angle, radius, and curvature, for example) can be measured [26]. In this work, the deformation was set at the blade to penetrate 0.6 mm into the filament, thus the stiffness is directly proportional to force. A stiff filament requires a high breaking force; therefore, the stress (ratio of force to cross-sectional area) was considered to represent the actual stiffness of a filament.
As can be seen in Figure 11(b), the PLA plastic has excellent stiffness, while the extruded filaments doesnot have similar stiffness as the reference material. This means that they can be easily fractured during the feeding process. As was observed during the printing process, the HPC filaments were soft and plastic deformation occurred during the printing process. The EC formulation was very brittle and was easily fractured by the feeding gear. The HPMC and HPMCAS exhibited good stiffness, and there was approximately no plastic deformation or surface cracking observed during the printing process.
According to the above observations, the filaments are intended for widespread use in a variety of 3D printers, if they have adequate flexibility (breaking distance > 0.61 mm), toughness (breaking stress > 635.5 g/mm2), and stiffness (20,758.3 g/mm2). Alternatively, another option is to adjust the force of the feeding system smaller than 400.7 g to ensure conveying of filament.
3.4.3. Rheological characterization of filaments
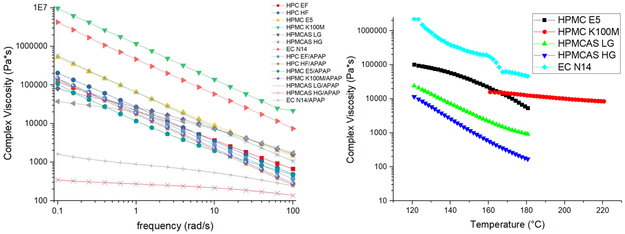
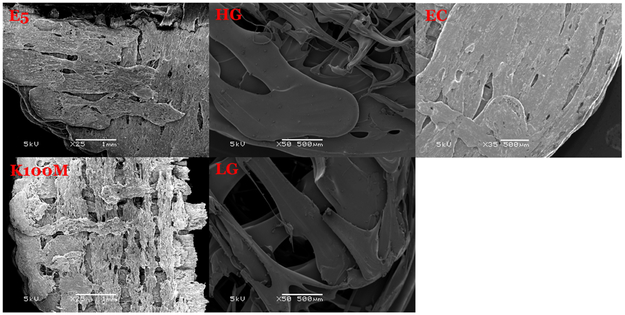
The roughness and rheological properties of the filaments can influence the printing process. High-melting viscosity can affect both the extrusion and 3D printing process. This can result in the production of filaments with rough surfaces, which can block the nozzle or disrupt the extrusion during the printing process. Therefore, the matrices were subjected to rheology testing to evaluate the melt viscosity in the molten state to assess extrudability and 3D printing. As can be seen in Figure 12(a), the APAP exhibited the plasticizer effect during the extrusion process, which resulted in the attenuation of the system’s viscosity when 30% w/w APAP was added. Generally, a higher viscosity results in a rough surface and increases the difficulty of extrusion and printing. In this study, the drug-loaded EC N14 filaments had higher viscosity. However, the surface of these filaments was smooth. Based on the observation and SEM image of each printed tablet, the HPMCAS tablets had a fine appearance, possibly owing to the low viscosity of the formulation. Both HPMC tablets exhibited rough printing paths owing to the relatively high viscosity compare to those of the HPMCAS formulations. However, although the EC formulation had a higher melt viscosity, the printed tablets still had a relatively fine appearance compared to that of the HPMC formulations.
Figure 12.
a) Frequency sweep of the raw materials and drug-loaded extrudates; b) temperature sweep of the milled printable filaments.
3.5. 3D printing
The printability of the different formulations can be predicted based on the characterization of the filaments’ physical-chemical properties. As expected, HPMC may be the perfect choice for FDM-based pharmaceutical 3D printing because it can be smoothly printed without failure. Conversely, the HPMC K100M grades cannot be printed, owing to their larger molecular weights which result in high melting viscosity. Both HPC filaments were too flexible and soft to be printed. Additionally, it was observed that the filaments were pushed aside by the feeding gear, and were not sufficiently stiff to push the molten materials out of the nozzle. Both the HPMCAS HG and LG formulations were somewhat brittle and lacked flexibility. This resulted in fracturing during their feeding into the hot end by the feeding gear. The HPMCAS filaments could occasionally be printed, with an average of six failures per 10 prints. The EC filaments were also very brittle, but could occasionally be printed with an average of five failures per 10 prints. However, once the tablets were successfully printed, they exhibited a smooth and homogeneous surface.
The appearance of the tablets was primarily affected by the rheological properties of the materials. The printed EC tablets exhibited a very smooth and homogeneous surface compared to that of the other tablets. Conjugation and adhesion were observed for the HPMCAS tablets, owing to the high melting viscosity. The HPMC E5 tablets exhibited proper appearance and a smooth surface (Figure 13).
Figure 13.
SEM pictures of the cross section of the 3D printed tablets.
All printed tablets were wider and shorter than their designed dimensions, which may have resulted from the cooling and solidification of the materials. Additionally, the cooling and solidification lasted longer, and this resulted in the increase in pressure from the just printed layer to the previous unsolidified layer. Therefore, the bottom part was slightly wider, and the height of the tablets was shorter compared to the designed height. Hence, the printing speed and cooling time must be further optimized to achieve good quality for the 3D printed tablets. Each formulation of the printed tablets had a different weight between 4.5-7.2% w/w. The weight variation could have resulted from the rheological properties. As presented in Table 2, lower viscosity resulted in smaller variation (4.73% for the EC and 4.77% for the HPMC E5 tablets). Conversely, the higher melt viscosity resulted in considerable variation (6.54% for K100M, 7.11% for the HG and 7.08% for the LG tablets). Therefore, further investigation into optimizing the formulations is needed for pharmaceutical dosage development.
3.6. In vitro drug release
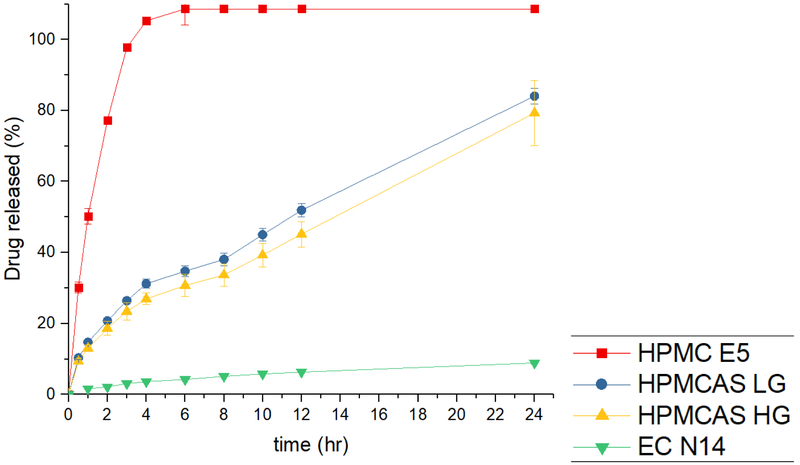
Dissolution tests were conducted using the USP Simulated Intestinal FluidTS (without pancreatin; pH 6.8), which adequately represents the human small intestinal fluid. Obviously, as shown in fig. 14, the dissolution profiles exhibited different behaviors. A poorly water-soluble API can disperse or dissolve into the polymer matrix and form a solid dispersion or solution through the HME process, owing to the mixing of the molten drug with polymers [27]. As expected, all HPMC E5 tablets exhibited a faster drug release rate because the HPMC matrix could form hydrogel rapidly and release the drug. A release of 80% was observed after 2 h, and reached 100% within 4 h. The drug was released from the matrix, and the polymer matrix also dissolved. Therefore, finally, the tablet dissolved entirely after 4 h.
Figure 14.
The in vitro drug release profiles of 3D printed tablets in SIF.
The AquaSolve™ HPMCAS LG and HG tablets exhibited similar drug release profiles, and the LG grade exhibited faster drug release rates owing to the high contents of the succinic groups (14-18%) compared to those of the HG grades (4-8%). Both the LG and HG tablets could release APAP over an extended period (51% and 45% drug release after 12 h, respectively). The HPMCAS matrix also interacted with water and formed a hydrogel. However, unlike the HPMC matrix, the drug could be released from the matrix. However, the polymer only absorbed the water, and could not completely dissolve over 24 h. Therefore, the drug release rates were controlled by the swelling speed and matrix. As can be seen in the drug release profiles, the drug released from the HPMCAS matrix was more steady compared to the drug released from the HPMC matrix. Therefore, the HPMCAS matrix is a better choice for the development of controlled release dosage.
Aqualon EC is soluble in a wide variety of solvents but is hardly soluble in water. This means that the EC formulation may not cause erosion or swelling in the dissolution media. The EC tablets released only 8.9% APAP by the end of the 24 h dissolution period. As mentioned previously, most of the APAP had dissolved or dispersed into the EC polymer matrix and formed a solid dispersion. Thus, the polymer matrix stopped the APAP release from the polymer matrix to the dissolution media. Additionally, the drug was released from the undissolved APAP, which was not entrapped into the polymer lattice or on the surface of the tablets. Thus, the tablets could not disintegrate, and APAP was hardly released from the matrix.
Conclusion
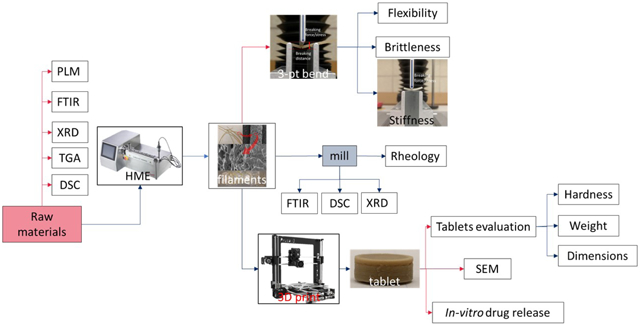
In this study, polymer matrices were tested for the manufacturing of feasible drug-loaded and 3D printed filaments. These cellulose based polymers were miscible with the model API studied, which modified in vitro drug release performance. Additionally, the physical and chemical characterization revealed that APAP could dissolve or disperse into the HPMC and HPMCAS matrix and form amorphous solid dispersions, whereas the drug only partially dispersed into the EC and HPC matrix. The Repka-Zhang test of the extruded filaments revealed that the HPMC E5 grade was suitable for 3D printing due to its good flexibility, toughness, and stiffness. Both HPC EF and HF filaments were soft (both failed flexibility testing) and could not be fed into the 3D printer. The EC filaments were very brittle (low breaking distance during the toughness test) and easily fractured by the feeding gear. Moreover, although these filaments could be printed, caution had to be exercised during their printing process. Both HPMCAS LG and HG filaments could also be printed, although not as successfully as the HPMC filaments. As predicted, the printed HPMC tablets exhibited fast drug release profiles. The HPMCAS tablets controlled the drug release rates. Moreover, the EC formulation may be suitable for extended drug release dosage forms because it exhibited a meager drug release compared to that of the other formulations. In summary, this study successfully manufactured drug-loaded filaments by using the pharmaceutical HME process. Additionally, the physical and chemical properties of the filaments were characterized for the purpose of screening filaments suitable for FDM based 3D printing. HPMC E5 was determined a better choice for new 3D printed dosage development.
Further, this study demonstrated the possibility of combining HME and 3D printing technology as a potential continuous process for personalized dosage development. Also, a general understanding of the impact of a polymer matrix on the drug release profiles was achieved. In addition, this study provides insights for the future development of 3D printable filaments.
Acknowledgement
This study was supported by Grant Number P20GM104932 from the National Institute of General Medical Sciences and the Biopharmaceutics-Clinical and Translational Core E of the COBRE, a component of the National Institutes of Health (NIH).
Footnotes
Conflict of interest
The authors declared that they do not have any commercial or associative interest that represents a conflict of interest in connection with the work.
Publisher's Disclaimer: This is a PDF file of an unedited manuscript that has been accepted for publication. As a service to our customers we are providing this early version of the manuscript. The manuscript will undergo copyediting, typesetting, and review of the resulting proof before it is published in its final citable form. Please note that during the production process errors may be discovered which could affect the content, and all legal disclaimers that apply to the journal pertain.
References
- 1.Kojima H, Yoshihara K, Sawada T, Kondo H, Sako K. Extended release of a large amount of highly water-soluble diltiazem hydrochloride by utilizing counter polymer in polyethylene oxides (PEO)/polyethylene glycol (PEG) matrix tablets Eur. J. Pharm. Biopharm Elsevier; 2008;70:556–62. [DOI] [PubMed] [Google Scholar]
- 2.Gross BC, Erkal JL, Lockwood SY, Chen C, Spence DM. Evaluation of 3D printing and its potential impact on biotechnology and the chemical sciences. ACS Publications; 2014. [DOI] [PubMed] [Google Scholar]
- 3.Moulton SE, Wallace GG. 3-dimensional (3D) fabricated polymer based drug delivery systems J. Control. Release Elsevier; 2014;193:27–34. [DOI] [PubMed] [Google Scholar]
- 4.Verweij JP, Moin DA, Mensink G, Nijkamp P, Wismeijer D, van Merkesteyn JPR. Autotransplantation of Premolars With a 3-Dimensional Printed Titanium Replica of the Donor Tooth Functioning as a Surgical Guide: Proof of Concept. J. Oral Maxillofac. Surg . 2016;74:1114–9. Available from: http://www.sciencedirect.com/science/article/pii/S0278239116001221 [DOI] [PubMed] [Google Scholar]
- 5.Vasconcelos T, Sarmento B, Costa P. Solid dispersions as strategy to improve oral bioavailability of poor water soluble drugs Drug Discov. Today. Elsevier; 2007;12:1068–75. [DOI] [PubMed] [Google Scholar]
- 6.Baghel S, Cathcart H, O’Reilly NJ. Polymeric Amorphous Solid Dispersions: A Review of Amorphization, Crystallization, Stabilization, Solid-State Characterization, and Aqueous Solubilization of Biopharmaceutical Classification System Class II Drugs . J. Pharm. Sci 2016. p. 2527–44. Available from: http://www.ncbi.nlm.nih.gov/pubmed/26886314 [DOI] [PubMed] [Google Scholar]
- 7.Janssens S, Van den Mooter G. Review: physical chemistry of solid dispersions. J. Pharm. Pharmacol. . 2009. ;61:1571–86. Available from: http://www.ncbi.nlm.nih.gov/pubmed/19958579 [DOI] [PubMed] [Google Scholar]
- 8.Sareen S, Joseph L, Mathew G. Improvement in solubility of poor water-soluble drugs by solid dispersion. Int. J. Pharm. Investig . 2012. ;2:12 Available from: http://www.ncbi.nlm.nih.gov/pubmed/23071955 [DOI] [PMC free article] [PubMed] [Google Scholar]
- 9.Thiry J, Krier F, Evrard B. A review of pharmaceutical extrusion: Critical process parameters and scaling-up . Int. J. Pharm 2015. . p. 227–40. Available from: http://www.ncbi.nlm.nih.gov/pubmed/25541517 [DOI] [PubMed] [Google Scholar]
- 10.Sarode AL, Sandhu H, Shah N, Malick W, Zia H. Hot melt extrusion (HME) for amorphous solid dispersions: predictive tools for processing and impact of drug–polymer interactions on supersaturation Eur. J. Pharm. Sci Elsevier; 2013;48:371–84. [DOI] [PubMed] [Google Scholar]
- 11.Islam MT, Scoutaris N, Maniruzzaman M, Moradiya HG, Halsey SA, Bradley MSA, et al. Implementation of transmission NIR as a PAT tool for monitoring drug transformation during HME processing Eur. J. Pharm. Biopharm Elsevier; 2015;96:106–16. [DOI] [PubMed] [Google Scholar]
- 12.Stanković M, Frijlink HW, Hinrichs WLJ. Polymeric formulations for drug release prepared by hot melt extrusion: application and characterization Drug Discov. Today. Elsevier; 2015;20:812–23. [DOI] [PubMed] [Google Scholar]
- 13.Repka MA, Langley N, DiNunzio J. Melt extrusion Mater. Technol. Drug Prod. Des. Springer; 2013;4:5. [Google Scholar]
- 14.OConnor T, Lee S. Emerging technology for modernizing pharmaceutical production: Continuous manufacturing. Dev. Solid Oral Dos. Forms Pharm. Theory Pract. Second Ed. 2016. p. 1031–46. [Google Scholar]
- 15.Peng W, Datta P, Ayan B, Ozbolat V, Sosnoski D, Ozbolat IT. 3D bioprinting for drug discovery and development in pharmaceutics . Acta Biomater. Elsevier; 2017. p. 26–46. Available from: http://www.sciencedirect.com/science/article/pii/S1742706117303069 [DOI] [PubMed] [Google Scholar]
- 16.3D Hubs Releases Digital Manufacturing Trend Report for Q4 2018 ∣ All3DP . Available from: https://all3dp.com/4/3d-hubs-releases-digital-manufacturing-trend-report-q4-2018/
- 17.Wu BM, Borland SW, Giordano RA, Cima LG, Sachs EM, Cima MJ. Solid free-form fabrication of drug delivery devices. J. Control. Release . 1996;40:77–87. Available from: https://dmse.mit.edu/publications/solid-free-form-fabrication-drug-delivery-devices [Google Scholar]
- 18.Zhang J, Feng X, Patil H, Tiwari RV., Repka MA. Coupling 3D printing with hot-melt extrusion to produce controlled-release tablets. Int. J. Pharm 2017;519:186–97. [DOI] [PubMed] [Google Scholar]
- 19.Yu DG, Yang XL, Huang WD, Liu J, Wang YG, Xu H. Tablets with material gradients fabricated by three-dimensional printing J. Pharm. Sci Elsevier; 2007;96:2446–56. [DOI] [PubMed] [Google Scholar]
- 20.Rathbone MJ, Hadgraft J, Roberts MS, Lane ME. Modified-Release Drug Delivery Technology, Volume 1, 2nd edition. 2008. [Google Scholar]
- 21.Moanţǎ A, Ionescu C, Rotaru P, Socaciu M, Hǎrǎbor A. Structural characterization, thermal investigation, and liquid crystalline behavior of 4-[(4-chlorobenzyl)oxy]-3,4′-dichloroazobenzene J. Therm. Anal. Calorim . Springer Netherlands; 2010. ;102:1079–86. Available from: http://link.springer.com/10.1007/s10973-010-0899-1 [Google Scholar]
- 22.Ewing A V, Biggart GD, Hale CR, Clarke GS, Kazarian SG. Comparison of pharmaceutical formulations: ATR-FTIR spectroscopic imaging to study drug-carrier interactions Int. J. Pharm Elsevier; 2015. ;495:112–21. Available from: https://www-sciencedirect-com.umiss.idm.oclc.org/science/article/pii/S0378517315301654 [DOI] [PubMed] [Google Scholar]
- 23.Huskić I, Christopherson J-C, Užarević K, Friščić T. In situ monitoring of vapour-induced assembly of pharmaceutical cocrystals using a benchtop powder X-ray diffractometer. Chem. Commun. . The Royal Society of Chemistry; 2016. ;52:5120–3. Available from: http://xlink.rsc.org/?DOI=C6CC01583B [DOI] [PubMed] [Google Scholar]
- 24.Lu K, Meshii T. Three-dimensional T-stresses for three-point-bend specimens with large thickness variation. Eng. Fract. Mech . Pergamon; 2014. ;116:197–203. Available from: https://www-sciencedirect-com.umiss.idm.oclc.org/science/article/pii/S0013794413004050?_rdoc=1&_fmt=high&_origin=gateway&_docanchor=&md5=b8429449ccfc9c30159a5f9aeaa92ffb&ccp=y [Google Scholar]
- 25.Rösler J, Harders H, Baeker M. Mechanical behaviour of engineering materials: metals, ceramics, polymers, and composites. Springer Science & Business Media; 2007. [Google Scholar]
- 26.Baumgart F Graphical statics a forgotten tool for solving plane mechanical problems. Injury. Elsevier; 2000;31:24–85. [DOI] [PubMed] [Google Scholar]
- 27.Serajuddin ATM. Salt formation to improve drug solubility Adv. Drug Deliv. Rev. Elsevier; 2007;59:603–16. [DOI] [PubMed] [Google Scholar]


