

Coronavirus disease 2019 (COVID-19) leads to inflammatory cytokine release, which can downregulate the expression of metabolizing enzymes. This cascade affects drug concentrations in the plasma. We investigated the association between lopinavir (LPV) and hydroxychloroquine (HCQ) plasma concentrations and the levels of the acute-phase inflammation marker C-reactive protein (CRP). LPV plasma concentrations in 92 patients hospitalized at our institution were prospectively collected. Lopinavir-ritonavir was administered every 12 hours, 800/200 mg on day 1 and 400/100 mg on day 2 until day 5 or 7.
KEYWORDS: COVID-19, lopinavir-ritonavir, levels, hydroxychloroquine, inflammation
ABSTRACT
Coronavirus disease 2019 (COVID-19) leads to inflammatory cytokine release, which can downregulate the expression of metabolizing enzymes. This cascade affects drug concentrations in the plasma. We investigated the association between lopinavir (LPV) and hydroxychloroquine (HCQ) plasma concentrations and the levels of the acute-phase inflammation marker C-reactive protein (CRP). LPV plasma concentrations in 92 patients hospitalized at our institution were prospectively collected. Lopinavir-ritonavir was administered every 12 hours, 800/200 mg on day 1 and 400/100 mg on day 2 until day 5 or 7. HCQ was given at 800 mg, followed by 400 mg after 6, 24, and 48 h. Hematological, liver, kidney, and inflammation laboratory values were analyzed on the day of drug level determination. The median age of study participants was 59 (range, 24 to 85) years, and 71% were male. The median durations from symptom onset to hospitalization and treatment initiation were 7 days (interquartile range [IQR], 4 to 10) and 8 days (IQR, 5 to 10), respectively. The median LPV trough concentration on day 3 of treatment was 26.5 μg/ml (IQR, 18.9 to 31.5). LPV plasma concentrations positively correlated with CRP values (r = 0.37, P < 0.001) and were significantly lower when tocilizumab was preadministered. No correlation was found between HCQ concentrations and CRP values. High LPV plasma concentrations were observed in COVID-19 patients. The ratio of calculated unbound drug fraction to published SARS-CoV-2 50% effective concentrations (EC50) indicated insufficient LPV concentrations in the lung. CRP values significantly correlated with LPV but not HCQ plasma concentrations, implying inhibition of cytochrome P450 3A4 (CYP3A4) metabolism by inflammation.
TEXT
Clinical trials have been launched to find effective treatment against the novel coronavirus, severe acute respiratory syndrome coronavirus 2 (SARS-CoV-2), the cause of the respiratory illness termed coronavirus disease 2019 (COVID-19) (1, 2). Approximately 15% of COVID-19 patients develop severe pneumonia (3). Cytokine release syndrome is an important factor for disease progression. Thus, treatment rationales for COVID-19 have focused on both antiviral activity and control of the infection-induced cytokine storm (4). Direct interaction between the 2 modalities must be evaluated, however, because infectious and inflammatory diseases have an impact on drug metabolism (5, 6).
The release of inflammatory cytokines such as interleukin-6 (IL-6) activates intracellular signaling cascades, leading to the downregulation of cytochrome P450 enzymes (CYPs) (7). The decrease in expression and activity of CYPs is explained by transcriptional suppression of CYP mRNA, triggering a decrease in enzyme synthesis (5, 6). Systemic inflammation affects CYPs differently, with a more pronounced decrease in CYP3A4 expression, followed by CYP2B6, CYP2C19, CYP2C9, CYP2D6, and CYP1A2 (5, 6, 8). Correlations have been reported between elevated C-reactive protein (CRP) levels and high plasma levels of antipsychotic drugs (9) and voriconazole (10). CRP production is triggered by IL-6, and conversely, IL-6 suppression can be monitored with plasma CRP levels (11).
The HIV drug lopinavir-ritonavir (LPV/r) has been repurposed for the treatment of SARS-CoV-2 (2). Recent brief reports on 8 (12), 12 (13), and 21 (14) COVID-19 patients noted considerably higher LPV plasma concentrations than those observed in HIV patients (15). Considering the inhibition of drug metabolism by cytokine release and the administration of LPV/r (which is metabolized by CYP3A4), we had the rationale to prospectively monitor LPV plasma concentrations in our cohort of COVID-19 patients.
The objective of this study was to investigate the association between CRP values and LPV plasma concentrations in COVID-19 patients. With this approach, we aimed to underscore the hypothesis that high levels of inflammatory markers in the blood correlate with high LPV plasma concentrations. For comparison, we measured hydroxychloroquine (HCQ) concentrations, because HCQ is characterized by a different metabolism (16). We also performed an age-stratified analysis to explore the combined effect of aging and inflammation on drug plasma levels. Finally, we discuss our LPV plasma trough concentration results in the context of calculated concentrations of unbound drug in the lung compartment and published 50% effective concentrations (EC50) for SARS-CoV-2.
RESULTS
Of 170 COVID-19 patients hospitalized in our institution within the study time frame, 92 reverse transcriptase PCR (RT-PCR)-confirmed positive cases with available LPV plasma concentrations were included in the study. The median age of study participants was 59 (interquartile range [IQR], 48 to 70; range, 24 to 85) years, and the majority were males (71%). The median time from onset of symptoms to hospitalization was 7 (IQR, 4 to 10) days, and that from onset of symptoms to initiation of LPV/r and HCQ treatment was 8 (IQR, 5 to 10) days. Twenty-seven (29%) individuals were transferred to the intensive care unit (ICU) during the hospitalization. Overall, 35 (38%) patients received tocilizumab (TCZ), 19 (54%) prior to LPV plasma concentration measurement and 16 (46%) afterward. The median CRP values at the day of LPV plasma measurements in these TCZ groups were 88.9 (IQR, 48.2 to 153.2) mg/liter, 79.9 (IQR, 48.2 to 129.6) mg/liter, and 105.4 (IQR, 51.9 to 153.7) mg/liter, respectively. In 3 individuals who received TCZ before measurement of LPV plasma concentrations, the time interval between the two time points was ≤12 h. For analysis purposes, the LPV plasma levels in these 3 patients were assigned to the group who received TCZ after drug level measurement. The CRP values in these individuals were 44.2, 124.8, and 165.8 mg/liter.
Patients admitted to the ICU tended to have a higher body weight, lower albumin and hemoglobin levels, and higher creatine kinase and CRP values than did patients who were not treated in the ICU (Table 1). Twenty (22%) patients presented with moderate or severe renal impairment. Table 1 shows the demographic and clinical characteristics of the patients.
TABLE 1.
Demographic, clinical, and laboratory characteristics of the study population on the day of LPV plasma concentration measurementa
| Parameter | Value for: |
||
|---|---|---|---|
| All patients (n = 92) | No ICU (n = 65) | ICU (n = 27) | |
| Male sex, n (%) | 65 (71) | 44 (68) | 21 (78) |
| Age, years, median (range) | 59 (24–85) | 59 (24–85) | 60 (32–85) |
| Weight, kg (IQR) (n = 83) | 84 (70–94) | 81 (70–92) | 90 (84–100) |
| Time from symptom onset to hospitalization, days | 7 (4–10) | 7 (4–9) | 8 (5–11) |
| Time from symptom onset to LPV/r + HCQ treatment, days | 8 (5–10) | 8 (5–10) | 8 (6–11) |
| Time from hospitalization to LPV/r + HCQ treatment, days | 0 (0–1) | 1 (0–1) | 0 (0–1) |
| Albumin, g/liter (n = 84) | 28 (24–31) | 29 (26–32) | 24 (21–28) |
| Hemoglobin, g/liter (n = 90) | 130 (116–142) | 132 (120–146) | 121 (111–133) |
| Leukocytes, 109/liter (n = 91) | 5.3 (4.3–7.2) | 5.3 (4.3–7.2) | 5.4 (4.2–7.6) |
| Thrombocytes, 109/liter (n = 86) | 238 (184–312) | 238 (185–321) | 238 (186–278) |
| ASAT, U/liter (n = 90) | 43 (28–57) | 36 (26–54) | 51 (43–69) |
| ALAT, U/liter (n = 90) | 37 (23–52) | 37 (21–53) | 37 (30–48) |
| Alkaline phosphatase, IU/liter (n = 87) | 61 (48–74) | 62 (49–74) | 57 (44–76) |
| GGT, U/liter (n = 87) | 55 (34–94) | 54 (32–92) | 63 (38–121) |
| Bilirubin, μmol/liter (n = 87) | 17 (12–22) | 17 (13–22) | 16 (11–21) |
| Pancreatic amylase, U/liter (n = 83) | 38 (29–55) | 35 (27–48) | 45 (36–108) |
| eGFR, ml/min/1.73 m2 (n = 92) | 81 (64–97) | 81 (65–97) | 84 (57–98) |
| Creatine kinase, U/liter (n = 84) | 106 (57–226) | 88 (54–154) | 209 (78–547) |
| CRP, mg/liter (n = 92) | 65 (36–113) | 53 (28–102) | 89 (57–139) |
| Systolic blood pressure, mm Hg (n = 91) | 112 (99–121) | 114 (105–124) | 93 (84–118) |
| Pulse, beats/min (n = 91) | 66 (60–73) | 67 (61–73) | 62 (55–69) |
| Body temp, °C (n = 76) | 36.8 (36.5–37.1) | 36.8 (36.5–37.0) | 37.1 (36.5–37.5) |
| Pulse oximetry, % (n = 91) | 92 (90–94) | 92 (90–94) | 90 (87–92) |
Values are medians and interquartile ranges (IQR) unless stated otherwise. Laboratory values were not available for all patients. The number of patients with measurements is indicated for each separate laboratory parameter. ASAT, aspartate aminotransferase; ALAT, alanine aminotransferase; CRP, C-reactive protein; eGFR, estimated glomerular filtration rate (calculated using the CKD-EPI [Chronic Kidney Disease Epidemiology Collaboration] formula); GGT, gamma-glutamyl transferase; HCQ, hydroxychloroquine; ICU, intensive care unit; LPV/r, lopinavir-ritonavir.
LPV levels and impact of inflammation.
LPV trough levels (12 h ± 3 h after the last drug intake) ranged from 7.7 to 42.3 μg/ml, with a median value of 26.5 (IQR, 18.9 to 31.5) μg/ml (Fig. 1). LPV plasma concentrations were measured after a median time of 3 (IQR, 3 to 4) days and correlated positively with CRP values (r = 0.37; P < 0.001; 92 observations) and leukocytes (r = 0.32; P = 0.002; 91 observations). When stratifying patients by predefined CRP level, we observed significantly higher LPV concentrations in patients with CRP levels of ≥75 mg/liter than in those with <75 mg/liter (median levels, 30.7 versus 20.9 μg/ml; P < 0.001) (Fig. 2A). The group receiving TCZ administration >12 h prior to LPV measurement demonstrated significantly lower LPV plasma concentrations (median, 18.7 μg/ml) than did the comparison group (i.e., no TCZ administration or TCZ administration ≤12 h prior to LPV measurement) (median, 28.8 μg/ml; P < 0.001) (Fig. 3). No other significant correlations were found with any other parameters listed in Table 1.
FIG 1.
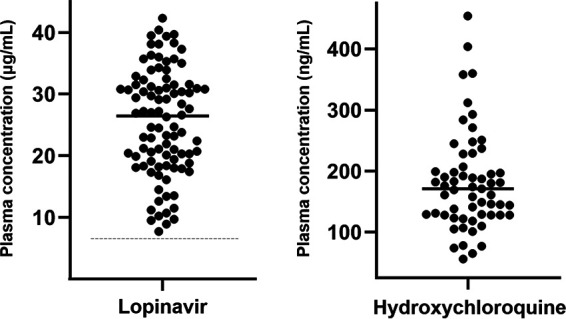
Lopinavir (n = 92) and hydroxychloroquine (n = 59) plasma concentrations in COVID-19 patients. The medial lopinavir plasma concentration was 26.5 (IQR, 18.9 to 31.5) μg/ml. The median hydroxychloroquine plasma concentration was 171 (IQR, 128 to 207) ng/ml. The dashed line represents the historical lopinavir trough level observed in HIV-infected individuals treated with lopinavir-ritonavir at 400/100 mg twice daily (i.e., 7.1 μg/ml) (15).
FIG 2.

Box plots (showing the 5th, 25th, 50th, 75th, and 95th percentiles) of lopinavir trough concentrations by CRP values in all patients and by age group (A) and box plots of hydroxychloroquine concentrations by CRP values for COVID-19 patients with trough levels (B). CRP, C-reactive protein. The dashed line represents the historical lopinavir trough level observed in HIV-infected individuals treated with lopinavir-ritonavir at 400/100 mg twice daily (i.e., 7.1 μg/ml) (15).
FIG 3.
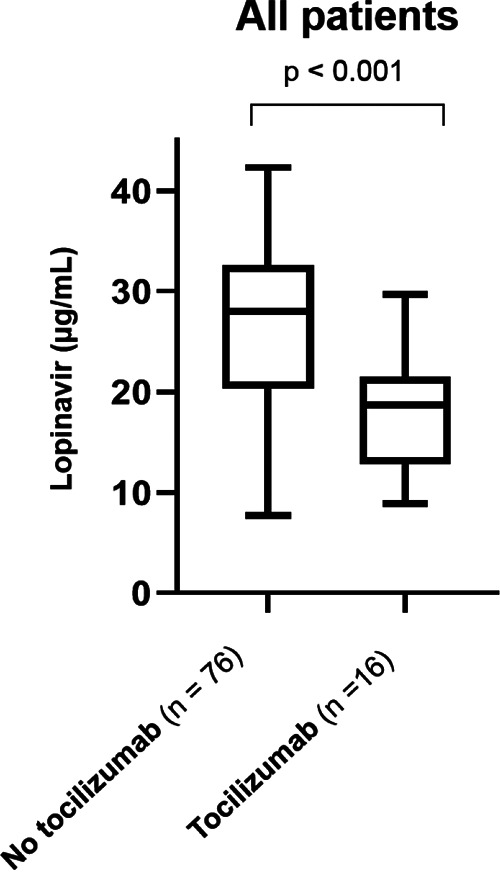
Box plots (showing the 5th, 25th, 50th, 75th, and 95th percentiles) of lopinavir plasma trough concentrations in COVID-19 patients by administration of tocilizumab. The left box depicts LPV plasma levels in COVID-19 patients with no TCZ administration (n = 57) or TCZ administration <12 h prior to LPV measurement (n = 19) (median, 28.8 μg/ml). The right box represents LPV samples from COVID-19 patients with TCZ administration >12 h prior to LPV measurement (median, 18.7 μg/ml).
Combined effect of age and inflammation on LPV concentrations.
Median LPV plasma trough levels were insignificantly higher in patients who were ≥65 years old (26.9 μg/ml; n = 33) than in those who were <65 years old (24.5 μg/ml; n = 59) (Fig. 2A). Similarly, median LPV concentrations were not different in patients with CRP values of ≥75 mg/liter who were ≥65 versus <65 years old (median levels, 31.0 versus 30.6 μg/ml; P = 0.825) or in patients with CRP values of <75 mg/liter who were ≥65 versus <65 years old (median levels, 24.7 versus 20.2 μg/ml; P = 0.362) (Fig. 2A).
HCQ concentrations.
HCQ concentrations were measured in 59 patients from available plasma samples and ranged from 56 to 454 ng/ml, with a median value of 171 (IQR, 128 to 207) ng/ml (Fig. 1). For 51 plasma samples, the median time interval since the last drug intake was 22 (range, 12 to 31; IQR, 14 to 23) hours, and the values showed no correlation with CRP values (r = 0.044; P = 0.76) or any other laboratory parameter listed in Table 1. HCQ plasma concentrations were not statistically different in patients with CRP values of <75 or ≥75 mg/liter (median levels, 149 versus 148 ng/ml; P = 0.959) (Fig. 2B). There was no correlation between LPV and HCQ plasma concentrations (r = 0.197; P = 0.166; n = 51).
DISCUSSION
Median LPV trough concentrations were an unexpected 3.5-fold higher in patients infected with SARS-CoV-2 than those reported historically in HIV-infected patients (i.e., 7.1 μg/ml) (15). Our prospective analysis of LPV plasma concentrations in 92 patients is in line with recent observations in small series that reported LPV plasma concentrations from 13 to 18 μg/ml in COVID-19 patients (12–14). The even higher trough concentrations in our study (i.e., median 26.5 μg/ml) might be explained by the double LPV/r dose (800/200 mg) at day 1 and the differences in the severity of COVID-19 between the studies. The median CRP values available in two of the aforementioned brief reports were 13.6 mg/liter (12) and 48.9 mg/liter (13), versus 65 mg/liter in our study.
We investigated possible reasons for high LPV plasma concentrations in COVID-19 patients. HCQ-mediated inhibition of the hepatic organic anion transporting polypeptide 1A2 (OATP1A2) (17) and interference with liver entry and subsequent metabolic elimination are, in our view, not plausible. OATP1A2 is expressed on the apical membrane of cholangiocytes, where it reabsorbs drugs excreted into the bile (18). Inhibition of this transporter would likely facilitate LPV/r biliary elimination. Virus-induced liver damage may cause impaired drug metabolism and high LPV plasma concentrations. However, the vast majority of individuals in our study population had only mildly elevated liver enzyme levels (Table 1). The effect of the double dose within the first 24 h on LPV plasma trough concentrations measured after a median time of 3 (IQR, 3 to 4) days is difficult to assess. Single-dose pharmacokinetic studies of LPV/r at 800/200 mg reported concentrations of <12 μg/ml (19) or <14 μg/ml (20), 12 h after intake. In a study with healthy HIV-negative volunteers, LPV trough levels ranged from 8.3 to 13.8 μg/ml at day 2 of treatment with 800/200 mg twice daily (21). In our study population, 81 (88%) samples had LPV plasma levels of >14 μg/ml, 66 (72%) had levels of >20 μg/ml, and 35 (38%) had levels of >30 μg/ml. These data together with the LPV pharmacokinetics data in the literature (19–21) strongly suggest that the elevated LPV trough concentrations observed in COVID-19 patients cannot be explained only by the effect of the initial double dose. Our findings support the hypothesis that the systemic inflammatory response in COVID-19 patients inhibits drug metabolism, leading to elevated LPV plasma concentrations. Conversely, blocking inflammation with TCZ was associated with lower LPV plasma concentrations. This is possibly explained by the fact that TCZ inhibition of inflammatory cytokines leads to a normalization of CYP metabolism.
Aging is associated with physiological changes and decline of the immune function, which together can impact drug pharmacokinetics (22). However, LPV plasma trough concentrations were not significantly different in patients who were ≥65 years old than in those who were <65 years old in our study.
Inflammation has been shown to have the greatest impact on CYP3A4 expression (7). This increase may, in turn, impact the magnitude of drug-drug interactions (DDIs), because LPV/r inhibits CYP3A4 in a concentration-dependent manner (23). Coadministered CYP3A4 substrates can also be affected by inflammation and can further increase the magnitude of DDIs. This interaction is illustrated by a case series of 12 patients who were followed up for direct oral anticoagulant treatment (DOAC) before and after being infected with SARS-CoV-2. LPV/r was started while DOAC was maintained at the same dose. DOAC levels after initiation of LPV/r treatment showed an average 6-fold increase (24). The coadministration of the strong CYP3A4 inhibitor ritonavir has been shown to increase rivaroxaban levels 2.5-fold in healthy volunteers (25), whereas rivaroxaban plasma concentrations were increased 7- to 31-fold in COVID-19 patients treated with LPV/r (24). Notably, the disappearance of the inhibitory effect on CYP3A4 may take up to 5 days after LPV/r is stopped (26).
The high LPV plasma concentrations observed in COVID-19 patients inevitably raise the question about the LPV levels that can be achieved in the lung. LPV/r is thought to act by inhibiting the enzyme 3-chymotrypsin-like protease (3CLpro) of SARS-CoV-2, thereby disrupting the cleavage of the viral protein and release from the host cell (27). Coronavirus proteases, including 3CLpro, do not contain a C2-symmetric pocket, resulting in an unspecific inhibition (28). Recently, Choy et al. (29) investigated the EC50 of LPV in inhibiting SARS-CoV-2 replication in Vero E6 cells. The cells were treated with the compound for 1 h prior to the infection by the virus at a multiplicity of infection of 0.02. The authors reported EC50 of 26.63 and 26.10 μM, measuring infectious virus and viral RNA, respectively. These values correspond to in vitro concentrations of 16.7 and 16.4 μg/ml, respectively (29). The antiviral activity in vivo is estimated by calculating the ratio of unbound drug concentrations achieved in the lung at the administered dose to the in vitro EC50 (RLTEC) (30). LPV plasma measurements in 12 COVID-19 patients showed median total and unbound trough concentrations of 18.0 μg/ml and 0.16 μg/ml, respectively, resulting in an unbound fraction of 0.88% (13). This fraction is consistent with the results from a previous study (31). The simultaneous determination of LPV in epithelial lining fluid (ELF) and plasma indicated an ELF/plasma ratio of 1.77 (32). Considering our total observed LPV trough plasma concentrations, the extrapolated unbound LPV trough level is 0.23 μg/ml. This value corresponds to an unbound LPV level in ELF of 0.41 μg/ml, which gives an RLTEC of 0.025. Even though the majority of the observed total LPV plasma concentrations in COVID-19 patients were above the published EC50 for SARS-CoV-2 (29), boosted LPV is unlikely to attain sufficient effective levels in the lung to inhibit the virus. In line with these arguments, current available clinical data do not demonstrate evidence for the efficacy of LPV/r for COVID-19 (33, 34).
HCQ has historically been used for malaria and immune diseases. Its ability to inhibit SARS-CoV-2 is thought to be due to an increase in endosomal pH, thereby impairing the entry of the virus into the cell. HCQ also interferes with the glycosylation of cellular receptors for SARS-CoV-2, resulting in reduced virus-cell binding. Finally, HCQ has immunomodulatory activity that may suppress the cytokine storm (16).
The median HCQ concentrations observed in our study (i.e., 171 ng/ml; IQR, 128 to 207) are comparable to those reported in another study with COVID-19 patients (220 ± 110 ng/ml) (35) and to steady-state trough levels observed in patients with systemic lupus erythematosus (i.e., 103 to 130 ng/ml) (36). Thus, the HCQ plasma concentrations in COVID-19 patients, in contrast to reported LPV plasma concentrations, were not higher than those previously observed in studies with other indications. Furthermore, no correlation with CRP values was observed. This difference may possibly be explained by the different metabolic pathways of HCQ and LPV/r, as inflammation affects CYPs differently (7). Furthermore, HCQ is known to have higher concentrations in tissue than in plasma (approximately 200- to 700-fold higher), resulting in a large distribution volume and a long half-life (30). Therefore, HCQ plasma concentrations in COVID-19 patients might not reflect the effect of inflammation, given that HCQ does not achieve steady-state concentrations during the short treatment course. Similar to LPV/r, HCQ was shown to have a low RLTEC (i.e., 0.11 to 0.34), indicating that HCQ levels achieved in vivo do not result in adequate clinical activity against SARS-CoV-2 (30). These calculations are supported by studies failing to demonstrate a benefit of HCQ both in hospitalized patients with COVID-19 (37) and as prophylaxis after SARS-CoV-2 exposure (38).
Some limitations of this study should be acknowledged. We did not consider IL-6 measurement as a routine diagnostic value within our COVID-19 cohort and hence in the study. IL-6 is a central mediator of the acute-phase response and a primary determinant of hepatic production of CRP. IL-6 has many other pathophysiologic roles in humans (39), and its diagnostic value for COVID-19, in particular for nonsevere cases, is unknown. The selection of cutoff of 12 h in the case of TCZ administration prior to measurement of LPV plasma concentrations was clinically reasonable but arbitrary. However, this limitation applied to only 3 patients and had no statistical influence on the results.
In conclusion, high LPV trough plasma concentrations were observed in COVID-19 patients. However, the calculated concentrations of unbound drug in the lung indicate insufficient levels to inhibit SARS-CoV-2 replication. LPV levels correlated positively with CRP values and negatively with the preadministration of TCZ, indicating that COVID-19-related cytokine release significantly inhibits CYP3A4. Caution is advised when CYP3A4 substrates with a narrow therapeutic index are being prescribed to COVID-19 patients because of the risk of elevated drug levels and related toxicities.
MATERIALS AND METHODS
All adults (≥18 years) hospitalized at the University Hospital in Basel between 25 February and 30 April 2020 for a COVID-19 infection (confirmed by real-time reverse transcriptase PCR [RT-PCR] from nasopharyngeal swab specimens) were screened for study eligibility. The study was part of a COVID-19 cohort consortium investigation and approved by the Ethics Committee of Northwestern and Central Switzerland (EKNZ 2020-00769).
Study population.
COVID-19 patients were eligible if they were treated with LPV/r. Patients were excluded if LPV drug concentrations were not measured. Prior to administration of LPV/r and HCQ, all concomitant drugs were reviewed for potential drug-drug interactions (DDIs) via a website included in our institutional treatment recommendations (40). Concomitant intake of CYP3A4 inhibitors or inducers was stopped or switched to another compound with similar therapeutic effect. Corticosteroids were not administered, except in 3 individuals in whom a low-dose long-term treatment with prednisone was continued (5 mg/day in 2 patients and 10 mg/day in 1 patient). Other drugs affecting inflammation were not administered, with the exception of tocilizumab (TCZ).
Treatment concepts for COVID-19 and dosing rationale.
Our institutional treatment recommendations include the administration of LPV/r and HCQ for hospitalized patients. To rapidly achieve high LPV/r plasma concentrations, we administered a double dose in the first 24 h. This approach in the early treatment phase was presumed necessary to suppress the high SARS-CoV-2 viral load in the early stage of disease (“hit early and hit hard”). The LPV/r treatment schedule included 800/200 mg twice on day 1, followed by a maintenance dose of 400/100 mg every 12 h for another 4 to 6 days. LPV/r treatment was combined with HCQ for 2 days (i.e., an 800-mg loading dose followed by 400 mg at 6 h, 24 h, and 48 h). In patients with clinical signs and findings suggestive of COVID-19-induced hyperinflammation, the use of TCZ was considered at the discretion of the treating COVID-19 care team. Parameters for consideration were defined in the institutional diagnostic recommendations for COVID-19. They included clinical signs (respiratory rate of ≥30 breaths per min, O2 saturation of <93%), laboratory results (CRP of ≥75 mg/liter), and the extent of radiological findings in the computed tomography scan of the lung (typical ground-glass opacities, infiltrates in ≥4 lobes, or considerable progression of infiltrates within 24 to 48 h). TCZ was administered intravenously at a dose of 8 mg/kg body weight, with a single dose or 2 doses within 24 h.
Quantification of LPV and HCQ plasma concentrations.
The institutional diagnostic recommendations for COVID-19 suggest obtaining LPV plasma trough levels on day 2 or 3 of treatment. LPV levels were quantified by using commercial calibrators and controls for liquid chromatography mass spectrometry methods (Recipe Chemicals + Instruments, Munich, Germany). The lower limit of quantification was 0.1 μg/ml.
HCQ levels were measured from available plasma material obtained for LPV trough determination. HCQ was quantified with a validated liquid chromatography-mass spectrometry method developed by the clinical chemistry laboratory at the University Hospital in Zurich, Switzerland. The lower limit of quantification was 10 ng/ml.
Data management, variable categorization, and statistical analysis.
Patient demographics, laboratory data, vital parameters, and medication records were extracted from the electronic medical reports and the institutional clinical data warehouse.
Information on the time interval between onset of symptoms consistent with COVID-19 and (i) hospitalization and (ii) initiation of antiviral treatment was investigated prospectively. Laboratory results obtained on the day of drug level measurement were used for this analysis.
Because age-related physiological changes can affect drug pharmacokinetics (22), we categorized patients as <65 or ≥ 65 years old. As indicated earlier, we used a tentative CRP cutoff value of 75 mg/liter to aid decision-making for the administration of TCZ. This CRP level was used as a marker for inflammation for the analysis in the study (i.e., <75 versus ≥75 mg/liter).
In patients receiving TCZ prior to the measurement of LPV or HCQ plasma concentrations, a time interval cutoff of 12 h for inflammation inhibition and consecutive effect on drug metabolism was predefined. This value was chosen after consideration of various parameters (i.e., presumed time to clinical resolution of cytokine release syndrome after TCZ administration [41], dynamics of CRP levels in infections [42], and drug administration schedule). Hence, in the case of TCZ administration at ≤12 h prior to the measurement of LPV trough levels, the interval between the two time points was considered too short to have had an effect on LPV plasma concentrations.
Absolute numbers, percentages, medians, and interquartile ranges (IQRs) were used to report demographic characteristics and laboratory results. The Mann-Whitney U test was used to compare continuous data, and the Spearman correlation coefficient was used to explore associations of interest. All statistical analyses were performed with GraphPad Prism and SPSS.
ACKNOWLEDGMENTS
We thank all the health care professionals and personnel in our institution who are involved in organizational processes and patient care during the COVID-19 pandemic. We are indebted to Katharina Rentsch, Laboratory Medicine, University Hospital Basel, for her valuable role in acquiring plasma drug levels.
C.M. was supported by the Adolf and Mary Mil Foundation. F.S. was supported by a grant from the Swiss National foundation (grant number 324730_188504). C.E.G. was supported by a grant from the Swiss National foundation (grant number 31CA30 196140).
All authors report no potential conflict of interest.
REFERENCES
- 1.Fajgenbaum DC, Khor JS, Gorzewski A, Tamakloe MA, Powers V, Kakkis JJ, Repasky M, Taylor A, Beschloss A, Hernandez-Miyares L, Go B, Nimgaonkar V, McCarthy MS, Kim CJ, Pai RL, Frankl S, Angelides P, Jiang J, Rasheed R, Napier E, Mackay D, Pierson SK. 2020. Treatments administered to the first 9152 reported cases of COVID-19: a systematic review. Infect Dis Ther doi: 10.1007/s40121-020-00303-8 Epub ahead of print. [DOI] [PMC free article] [PubMed] [Google Scholar]
- 2.WHO. 2020. “Solidarity” clinical trial for COVID-19 treatments. https://www.who.int/emergencies/diseases/novel-coronavirus-2019/global-research-on-novel-coronavirus-2019-ncov/solidarity-clinical-trial-for-covid-19-treatments.
- 3.Wu Z, McGoogan JM. 2020. Characteristics of and important lessons from the coronavirus disease 2019 (COVID-19) outbreak in China: summary of a report of 72 314 cases from the Chinese Center for Disease Control and Prevention. JAMA 323:1239. doi: 10.1001/jama.2020.2648. [DOI] [PubMed] [Google Scholar]
- 4.Zhang S, Li L, Shen A, Chen Y, Qi Z. 2020. Rational use of tocilizumab in the treatment of novel coronavirus pneumonia. Clin Drug Invest 40:511–518. doi: 10.1007/s40261-020-00917-3. [DOI] [PMC free article] [PubMed] [Google Scholar]
- 5.Renton KW. 2005. Regulation of drug metabolism and disposition during inflammation and infection. Expert Opin Drug Metab Toxicol 1:629–640. doi: 10.1517/17425255.1.4.629. [DOI] [PubMed] [Google Scholar]
- 6.Morgan ET. 2009. Impact of infectious and inflammatory disease on cytochrome P450-mediated drug metabolism and pharmacokinetics. Clin Pharmacol Ther 85:434–438. doi: 10.1038/clpt.2008.302. [DOI] [PMC free article] [PubMed] [Google Scholar]
- 7.Dickmann LJ, Patel SK, Rock DA, Wienkers LC, Slatter JG. 2011. Effects of interleukin-6 (IL-6) and an anti-IL-6 monoclonal antibody on drug-metabolizing enzymes in human hepatocyte culture. Drug Metab Dispos 39:1415–1422. doi: 10.1124/dmd.111.038679. [DOI] [PubMed] [Google Scholar]
- 8.Morgan ET, Goralski KB, Piquette-Miller M, Renton KW, Robertson GR, Chaluvadi MR, Charles KA, Clarke SJ, Kacevska M, Liddle C, Richardson TA, Sharma R, Sinal CJ. 2008. Regulation of drug-metabolizing enzymes and transporters in infection, inflammation, and cancer. Drug Metab Dispos 36:205–216. doi: 10.1124/dmd.107.018747. [DOI] [PubMed] [Google Scholar]
- 9.Hefner G, Shams ME, Unterecker S, Falter T, Hiemke C. 2016. Inflammation and psychotropic drugs: the relationship between C-reactive protein and antipsychotic drug levels. Psychopharmacology (Berlin) 233:1695–1705. doi: 10.1007/s00213-015-3976-0. [DOI] [PubMed] [Google Scholar]
- 10.Vreugdenhil B, van der Velden WJFM, Feuth T, Kox M, Pickkers P, van de Veerdonk FL, Blijlevens NMA, Brüggemann RJM. 2018. Moderate correlation between systemic IL-6 responses and CRP with trough concentrations of voriconazole. Br J Clin Pharmacol 84:1980–1988. doi: 10.1111/bcp.13627. [DOI] [PMC free article] [PubMed] [Google Scholar]
- 11.Kojima T, Yabe Y, Kaneko A, Hirano Y, Ishikawa H, Hayashi M, Miyake H, Takagi H, Kato T, Terabe K, Wanatabe T, Tsuchiya H, Kida D, Shioura T, Funahashi K, Kato D, Matsubara H, Takahashi N, Hattori Y, Asai N, Ishiguro N. 2013. Monitoring C-reactive protein levels to predict favourable clinical outcomes from tocilizumab treatment in patients with rheumatoid arthritis. Mod Rheumatol 23:977–985. doi: 10.1007/s10165-012-0782-y. [DOI] [PubMed] [Google Scholar]
- 12.Schoergenhofer C, Jilma B, Stimpfl T, Karolyi M, Zoufaly A. 2020. Pharmacokinetics of lopinavir and ritonavir in patients hospitalized with coronavirus disease 2019 (COVID-19). Ann Intern Med doi: 10.7326/m20-1550 Epub ahead of print. [DOI] [PMC free article] [PubMed] [Google Scholar]
- 13.Gregoire M, Le Turnier P, Gaborit BJ, Veyrac G, Lecomte R, Boutoille D, Canet E, Imbert BM, Bellouard R, Raffi F. 2020. Lopinavir pharmacokinetics in COVID-19 patients. J Antimicrob Chemother doi: 10.1093/jac/dkaa195 Epub ahead of print. [DOI] [PMC free article] [PubMed] [Google Scholar]
- 14.Baldelli S, Corbellino M, Clementi E, Cattaneo D, Gervasoni C. 2020. Lopinavir/ritonavir in COVID-19 patients: maybe yes, but at what dose? J Antimicrob Chemother doi: 10.1093/jac/dkaa190 Epub ahead of print. [DOI] [PMC free article] [PubMed] [Google Scholar]
- 15.Croxtall JD, Perry CM. 2010. Lopinavir/ritonavir: a review of its use in the management of HIV-1 infection. Drugs 70:1885–1915. doi: 10.2165/11204950-000000000-00000. [DOI] [PubMed] [Google Scholar]
- 16.Tripathy S, Dassarma B, Roy S, Chabalala H, Matsabisa MG. 2020. A review on possible modes of actions of chloroquine/hydroxychloroquine: repurposing against SAR-COV-2 (COVID 19) pandemic. Int J Antimicrob Agents doi: 10.1016/j.ijantimicag.2020.106028 Epub ahead of print. [DOI] [PMC free article] [PubMed] [Google Scholar]
- 17.Xu C, Zhu L, Chan T, Lu X, Shen W, Madigan MC, Gillies MC, Zhou F. 2016. Chloroquine and hydroxychloroquine are novel inhibitors of human organic anion transporting polypeptide 1A2. J Pharm Sci 105:884–890. doi: 10.1002/jps.24663. [DOI] [PubMed] [Google Scholar]
- 18.Lee W, Glaeser H, Smith LH, Roberts RL, Moeckel GW, Gervasini G, Leake BF, Kim RB. 2005. Polymorphisms in human organic anion-transporting polypeptide 1A2 (OATP1A2): implications for altered drug disposition and central nervous system drug entry. J Biol Chem 280:9610–9617. doi: 10.1074/jbc.M411092200. [DOI] [PubMed] [Google Scholar]
- 19.Ofotokun I, Chuck SK, Binongo JN, Palau M, Lennox JL, Acosta EP. 2007. Lopinavir/ritonavir pharmacokinetic profile: impact of sex and other covariates following a change from twice-daily to once-daily therapy. J Clin Pharmacol 47:970–977. doi: 10.1177/0091270007302564. [DOI] [PMC free article] [PubMed] [Google Scholar]
- 20.Eron JJ, Feinberg J, Kessler HA, Horowitz HW, Witt MD, Carpio FF, Wheeler DA, Ruane P, Mildvan D, Yangco BG, Bertz R, Bernstein B, King MS, Sun E. 2004. Once-daily versus twice-daily lopinavir/ritonavir in antiretroviral-naive HIV-positive patients: a 48-week randomized clinical trial. J Infect Dis 189:265–272. doi: 10.1086/380799. [DOI] [PubMed] [Google Scholar]
- 21.Nijland HM, L'Homme RF, Rongen GA, van Uden P, van Crevel R, Boeree MJ, Aarnoutse RE, Koopmans PP, Burger DM. 2008. High incidence of adverse events in healthy volunteers receiving rifampicin and adjusted doses of lopinavir/ritonavir tablets. AIDS 22:931–935. doi: 10.1097/QAD.0b013e3282faa71e. [DOI] [PubMed] [Google Scholar]
- 22.Stader F, Kinvig H, Penny MA, Battegay M, Siccardi M, Marzolini C. 2020. Physiologically based pharmacokinetic modelling to identify pharmacokinetic parameters driving drug exposure changes in the elderly. Clin Pharmacokinet 59:383–401. doi: 10.1007/s40262-019-00822-9. [DOI] [PubMed] [Google Scholar]
- 23.Eichbaum C, Cortese M, Blank A, Burhenne J, Mikus G. 2013. Concentration effect relationship of CYP3A inhibition by ritonavir in humans. Eur J Clin Pharmacol 69:1795–1800. doi: 10.1007/s00228-013-1530-8. [DOI] [PubMed] [Google Scholar]
- 24.Testa S, Prandoni P, Paoletti O, Morandini R, Tala M, Dellanoce C, Giorgi-Pierfranceschi M, Betti M, Battista Danzi G, Pan A, Palareti G. 2020. Direct oral anticoagulant plasma levels' striking increase in severe COVID-19 respiratory syndrome patients treated with antiviral agents: the Cremona experience. J Thromb Haemost 18:1320–1323. doi: 10.1111/jth.14871. [DOI] [PMC free article] [PubMed] [Google Scholar]
- 25.Mueck W, Kubitza D, Becka M. 2013. Co-administration of rivaroxaban with drugs that share its elimination pathways: pharmacokinetic effects in healthy subjects. Br J Clin Pharmacol 76:455–466. doi: 10.1111/bcp.12075. [DOI] [PMC free article] [PubMed] [Google Scholar]
- 26.Stader F, Khoo S, Stoeckle M, Back D, Hirsch HH, Battegay M, Marzolini C. 2020. Stopping lopinavir/ritonavir in COVID-19 patients: duration of the drug interaction effect. J Antmicrob Chemother doi: 10.1093/jac/dkaa253 Epub ahead of print. [DOI] [PMC free article] [PubMed] [Google Scholar]
- 27.Zhang L, Lin D, Sun X, Curth U, Drosten C, Sauerhering L, Becker S, Rox K, Hilgenfeld R. 2020. Crystal structure of SARS-CoV-2 main protease provides a basis for design of improved α-ketoamide inhibitors. Science 368:409–412. doi: 10.1126/science.abb3405. [DOI] [PMC free article] [PubMed] [Google Scholar]
- 28.Sheahan TP, Sims AC, Leist SR, Schäfer A, Won J, Brown AJ, Montgomery SA, Hogg A, Babusis D, Clarke MO, Spahn JE, Bauer L, Sellers S, Porter D, Feng JY, Cihlar T, Jordan R, Denison MR, Baric RS. 2020. Comparative therapeutic efficacy of remdesivir and combination lopinavir, ritonavir, and interferon beta against MERS-CoV. Nat Commun 11:222. doi: 10.1038/s41467-019-13940-6. [DOI] [PMC free article] [PubMed] [Google Scholar]
- 29.Choy KT, Wong AY, Kaewpreedee P, Sia SF, Chen D, Hui KPY, Chu DKW, Chan MCW, Cheung PP, Huang X, Peiris M, Yen HL. 2020. Remdesivir, lopinavir, emetine, and homoharringtonine inhibit SARS-CoV-2 replication in vitro. Antiviral Res 178:104786. doi: 10.1016/j.antiviral.2020.104786. [DOI] [PMC free article] [PubMed] [Google Scholar]
- 30.Fan J, Zhang X, Liu J, Yang Y, Zheng N, Liu Q, Bergman K, Reynolds K, Huang SM, Zhu H, Wang Y. 2020. Connecting hydroxychloroquine in vitro antiviral activity to in vivo concentration for prediction of antiviral effect: a critical step in treating COVID-19 patients. Clin Infect Dis doi: 10.1093/cid/ciaa623 Epub ahead of print. [DOI] [PMC free article] [PubMed] [Google Scholar]
- 31.Dumond JB, Rigdon J, Mollan K, Tierney C, Kashuba AD, Aweeka F, Collier AC. 2015. Brief report: significant decreases in both total and unbound lopinavir and amprenavir exposures during coadministration: ACTG Protocol A5143/A5147s results. J Acquir Immune Defic Syndr 70:510–514. doi: 10.1097/QAI.0000000000000777. [DOI] [PMC free article] [PubMed] [Google Scholar]
- 32.Atzori C, Villani P, Regazzi M, Maruzzi M, Cargnel A. 2003. Detection of intrapulmonary concentration of lopinavir in an HIV-infected patient. AIDS 17:1710–1711. doi: 10.1097/00002030-200307250-00022. [DOI] [PubMed] [Google Scholar]
- 33.Ford N, Vitoria M, Rangaraj A, Norris SL, Calmy A, Doherty M. 2020. Systematic review of the efficacy and safety of antiretroviral drugs against SARS, MERS or COVID-19: initial assessment. J Int AIDS Soc 23:e25489. doi: 10.1002/jia2.25489. [DOI] [PMC free article] [PubMed] [Google Scholar]
- 34.Cao B, Wang Y, Wen D, Liu W, Wang J, Fan G, Ruan L, Song B, Cai Y, Wei M, Li X, Xia J, Chen N, Xiang J, Yu T, Bai T, Xie X, Zhang L, Li C, Yuan Y, Chen H, Li H, Huang H, Tu S, Gong F, Liu Y, Wei Y, Dong C, Zhou F, Gu X, Xu J, Liu Z, Zhang Y, Li H, Shang L, Wang K, Li K, Zhou X, Dong X, Qu Z, Lu S, Hu X, Ruan S, Luo S, Wu J, Peng L, Cheng F, Pan L, Zou J, Jia C, Wang J, Liu X, Wang S, Wu X, Ge Q, He J, Zhan H, Qiu F, Guo L, Huang C, Jaki T, Hayden FG, Horby PW, Zhang D, Wang C. 2020. A trial of lopinavir-ritonavir in adults hospitalized with severe Covid-19. N Engl J Med 382:1787–1799. doi: 10.1056/NEJMoa2001282. [DOI] [PMC free article] [PubMed] [Google Scholar]
- 35.Martin-Blondel G, Ruiz S, Murris M, Faguer S, Duhalde V, Eyvrard F, Izopet J, Mansuy JM, Rolland Y, Delavigne K, Guimbaud R, Pugnet G, Conil JM, Georges B, Delobel P, Minville V, Silva Sifontes S, Concordet D, Gandia P. 2020. Hydroxychloroquine in COVID-19 patients: what still needs to be known about the kinetics. Clin Infect Dis doi: 10.1093/cid/ciaa558 Epub ahead of print. [DOI] [PMC free article] [PubMed] [Google Scholar]
- 36.Morita S, Takahashi T, Yoshida Y, Yokota N. 2016. Population pharmacokinetics of hydroxychloroquine in Japanese patients with cutaneous or systemic lupus erythematosus. Ther Drug Monit 38:259–267. doi: 10.1097/FTD.0000000000000261. [DOI] [PubMed] [Google Scholar]
- 37.Geleris J, Sun Y, Platt J, Zucker J, Baldwin M, Hripcsak G, Labella A, Manson D, Kubin C, Barr RG, Sobieszczyk ME, Schluger NW. 2020. Observational study of hydroxychloroquine in hospitalized patients with Covid-19. N Engl J Med 382:2411–2418. doi: 10.1056/NEJMoa2012410. [DOI] [PMC free article] [PubMed] [Google Scholar]
- 38.Boulware DR, Pullen MF, Bangdiwala AS, Pastick KA, Lofgren SM, Okafor EC, Skipper CP, Nascene AA, Nicol MR, Abassi M, Engen NW, Cheng MP, LaBar D, Lother SA, MacKenzie LJ, Drobot G, Marten N, Zarychanski R, Kelly LE, Schwartz IS, McDonald EG, Rajasingham R, Lee TC, Hullsiek KH. 2020. A randomized trial of hydroxychloroquine as postexposure prophylaxis for Covid-19. N Engl J Med doi: 10.1056/NEJMoa2016638 Epub ahead of print. [DOI] [PMC free article] [PubMed] [Google Scholar]
- 39.Papanicolaou DA, Vgontzas AN. 2000. Interleukin-6: the endocrine cytokine. J Clin Endocrinol Metab 85:1331–1333. doi: 10.1210/jcem.85.3.6582. [DOI] [PubMed] [Google Scholar]
- 40.University of Liverpool. 2020. Interaction checker; COVID-19 drug interactions. https://www.covid19-druginteractions.org/.
- 41.Le RQ, Li L, Yuan W, Shord SS, Nie L, Habtemariam BA, Przepiorka D, Farrell AT, Pazdur R. 2018. FDA approval summary: tocilizumab for treatment of chimeric antigen receptor T cell-induced severe or life-threatening cytokine release syndrome. Oncologist 23:943–947. doi: 10.1634/theoncologist.2018-0028. [DOI] [PMC free article] [PubMed] [Google Scholar]
- 42.Markanday A. 2015. Acute phase reactants in infections: evidence-based review and a guide for clinicians. Open Forum Infect Dis 2:ofv098. doi: 10.1093/ofid/ofv098. [DOI] [PMC free article] [PubMed] [Google Scholar]