Abstract
T follicular helper (TFH) cells are a distinct type of CD4+ T cells that are essential for most antibody and B lymphocyte responses. TFH cell regulation and dysregulation is involved in a range of diseases. Bcl-6 is the lineage defining transcription factor of TFH cells and its activity is essential for TFH cell differentiation and function. However, how Bcl-6 controls TFH biology has largely remained unclear, at least in part due to intrinsic challenges of connecting repressors to gene upregulation in complex cell types with multiple possible differentiation fates. Multiple competing models were tested here by a series of experimental approaches to determine that Bcl-6 exhibited negative autoregulation and controlled pleiotropic attributes of TFH differentiation and function, including migration, costimulation, inhibitory receptors, and cytokines, via multiple repressor-of-repressor gene circuits.
INTRODUCTION
The formation of germinal centers (GCs) is essential for the development of high-affinity memory B cells and antibody secreting long-lived plasma cells in response to pathogen infections or vaccinations1. Follicular helper T cells (TFH) provide key signals to antigen-specific B cells for the development of germinal center B (BGC) cells1,2. CD4+ T cells receiving TFH inductive signals upregulate Bcl-6, the lineage defining transcription factor (TF) of TFH cells3–5. Upregulation of Bcl-6 is associated with expression of the chemokine receptor CXCR5 and reduction of CCR7 and PSGL1, among other molecules, allowing for migration to the T-B border and GCs1, the sites where TFH and then GC-TFH cells interact with antigen-specific B cells. TFH and GC-TFH cells express many surface and secreted molecules that serve as positive markers and contribute to the differentiation (ICOS, IL-6Rα, PD-1), migration (CXCR5, CD69), and function (IL-21, IL-4, CXCL13, SAP, ICOS, PD-1, CD200, CD40L) of TFH and GC-TFH cells. GC-TFH cells provide IL-21, IL-4, and CD40L that are required for BGC cell survival, proliferation, and somatic hypermutation1,2,6.
Bcl-6 function is critical in TFH differentiation3–5. Multiple TFs in addition to Bcl-6 have been identified that regulate TFH differentiation2,7–18. Inhibition of Blimp-1 (encoded by Prdm1) by Bcl-6 is required for TFH differentiation3. Tcf-1 and Lef-1 are involved in early induction of Bcl-6 and repression of Blimp-119–21. Downregulation of Id2 is important for CXCR5 expression by releasing E protein TFs such as E2A and Ascl222,23. While the importance of Bcl-6 in TFH cell development is clear, it is still unclear how Bcl-6 controls TFH cell biology. Two studies using Bcl-6 ChIP-seq in human GC-TFH cells and murine TFH cells provided insights into Bcl-6–bound genes24,25, but functional roles have remained largely untested, and there is no consensus on a mechanistic model of how Bcl-6 regulates TFH cell biology. Bcl-6 and Blimp-1 are reciprocal antagonistic regulators of each other’s genetic loci3. That interaction provides a powerful mechanism for a genetic switch in cell differentiation, as co-expression of Bcl-6 and Blimp-1 is a metastable state26. However, from an experimentalist perspective, their mutual antagonism confounds experimental designs to probe Bcl-6 (and Blimp-1) functions in CD4+ T cells. Additionally, the putative nature of Bcl-6 as a repressor in CD4+ T cells adds an extra layer of complexity for understanding gene regulation, as many signature TFH genes are upregulated in the presence of Bcl-6. In the present study, we took a first principles based approach to defining and testing hypothetical models of how Bcl-6 may control TFH biology.
RESULTS
TFH differentiation is not a default pathway
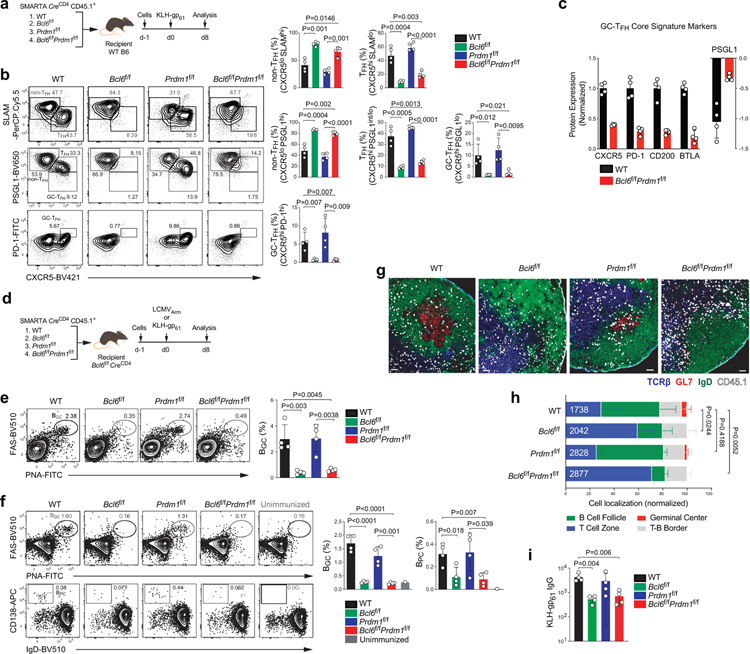
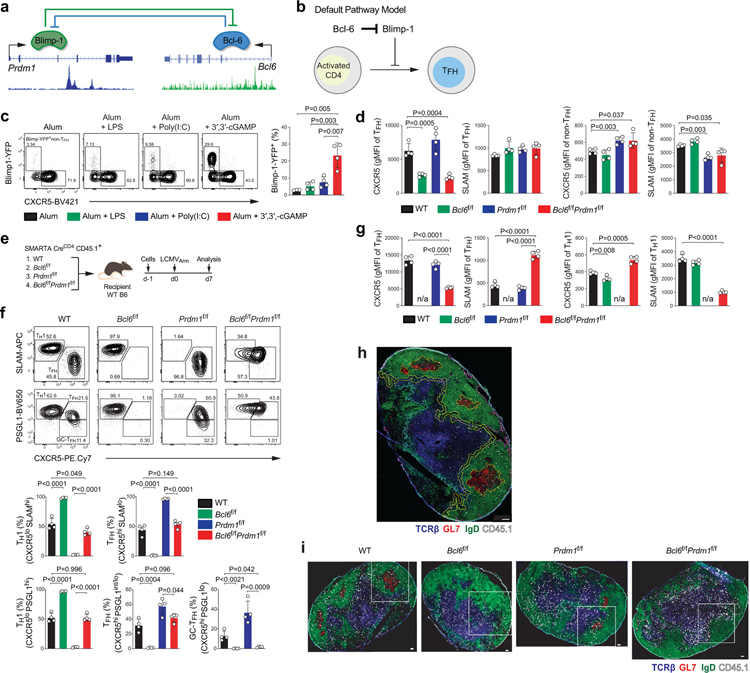
One proposed model of TFH differentiation is that TFH differentiation is the default pathway for naive CD4+ T cells activated by antigen presenting cells. In this model, the primary role of Bcl-6 would be to inhibit Blimp-1 to allow activated CD4+ T cells to undergo a default TFH differentiation pathway27 (Extended Data Fig.1a–b). We tested this model by utilizing Bcl6f/fPrdm1f/fCreCD4 mice. If TFH differentiation is a default setting in activated CD4+ T cells, then when Blimp-1 is absent Bcl-6 would not be required. Bcl6f/fPrdm1f/fCreCD4 CD45.1+ SMARTA cells were transferred into C57BL/6 mice, as were wild-type (WT), Bcl6f/fCreCD4, or Prdm1f/fCreCD4 SMARTA cells. Host mice were immunized with KLH-gp61 in alum + cGAMP adjuvant (Fig.1a and Extended Data Fig.1c–d). Wild-type SMARTA cells differentiated into non-TFH (CXCR5loSLAMhi), TFH (CXCR5+SLAMlo or CXCR5+PSGL1int/lo), and GC-TFH cells (CXCR5hiPSGL1lo or CXCR5hiPD-1hi) after KLH-gp61 immunization (Fig.1b). Prdm1f/fCreCD4 SMARTA cells predominantly differentiated into TFH and GC-TFH cells. Bcl6f/fCreCD4 CD4+ T cells did not differentiate into TFH cells3,28. Notably, Bcl6f/fPrdm1f/fCreCD4 CD4+ T cells failed to differentiate into TFH and GC-TFH cells. Similar results were observed in the context of an acute viral infection (see Supplementary Note; Extended Data Fig.1e–g). Adoptive transfer of Bcl6f/fPrdm1f/fCreCD4 SMARTA cells demonstrated that the TFH differentiation defect was antigen-specific and CD4+ T cell-intrinsic29. Signature TFH surface markers were examined to determine whether Bcl6f/fPrdm1f/fCreCD4 CD4+ T cells became bona fide TFH cells in response to acute LCMV infection. Expression of TFH signature surface proteins was dysregulated (Fig.1c), indicating that Bcl-6 has important functions in gene regulation beyond repression of Blimp-1 that are necessary for TFH differentiation in both immunization and viral infection contexts.
Figure 1. TFH differentiation is not the default pathway.
a, Schematic of the SMARTA cell transfer system used for KLH-gp61 immunization. wild-type, Bcl6f/f, Prdm1f/f, and Bcl6f/fPrdm1f/f CreCD4 SMARTA CD4+ T cells were transferred to C57BL/6 host mice, followed by immunization of the host mice with KLH-gp61 in alum + cGAMP adjuvant, and analyzed 8 days later. See Fig. 1b and Extended Data Fig.1c–d.
b, Representative flow cytometry of GC-TFH, TFH and non-TFH SMARTA cell subsets from draining LNs (dLNs) of KLH-gp61 immunized mice. Three independent experiments were performed; each dot represents one mouse (n = 4). Data are mean ± s.d., unpaired two-tailed Student’s t-test.
c, wild-type, Bcl6f/f, Prdm1f/f, and Bcl6f/fPrdm1f/f CreCD4 SMARTA CD4+ T cells were transferred to C57BL/6 host mice, followed by infection of the host mice with LCMVArm, and analyzed 7 days later. Relative protein expression of GC-TFH core signature markers, gated on CXCR5+ TFH cells. gMFI value of each gene was normalized to wild-type. Three independent experiments were performed; each dot represents one mouse (n = 4). Data are mean ± s.d., unpaired two-tailed Student’s t-test. See Extended Data Fig.1e.
d, Schematic of the SMARTA cell transfer system used for LCMVArm infection or KLH-gp61 immunization. Wild-type, Bcl6f/f, Prdm1f/f, and Bcl6f/fPrdm1f/f CreCD4 SMARTA CD4+ T cells were transferred to Bcl6f/fPrdm1f/f CreCD4 host mice, followed by infection or immunization of the host mice with LCMVArm or KLH-gp61 in alum + cGAMP adjuvant, and analyzed 8 days later. See Fig.1e–i and Extended Data Fig.1h–i.
e, Representative flow cytometry gate of BGC cells from spleens of LCMVArm infected mice. Three independent experiments performed; each dot represents one mouse (n = 4). Data are mean ± s.d., unpaired two-tailed Student’s t-test.
f, Representative flow cytometry of BGC cells and BPC from dLNs of KLH-gp61 immunized mice. Two independent experiments were performed; each dot represents one mouse (n = 4). Data are mean ± s.d., unpaired two-tailed Student’s t-test.
g, Histology of dLNs at d8 after KLH-gp61 immunization in Fig.1f. Magnified images from Extended Data Fig.1g are shown. Blue, TCRβ; red, GL7; green, IgD; white, CD45.1 SMARTA. SMARTA cells were presented with large dots for clarity. Scale bar, 200 μm.
h, Quantification of results in Fig. 1i. Total counted number of SMARTA cells were indicated.
i, Serum antigen-specific IgG endpoint titers at d8 after KLH-gp61 immunization in Fig.1f. Two independent experiments were performed; each dot represents one mouse (n = 4). Data are mean ± s.d., unpaired two-tailed Student’s t-test.
To assess the migration and function of Bcl6f/fPrdm1f/fCreCD4 SMARTA cells, we transferred SMARTA cells into Bcl6f/fCreCD4 mice, followed by infection of the host mice with LCMVArm (Fig.1d). Bcl6f/fCreCD4 mice were used as recipient mice to eliminate endogenous TFH help to B cells. Bcl6f/fCreCD4 mice receiving Bcl6f/fCreCD4 SMARTA cells did not generate BGC cells (FAS+PNA+) in response to LCMVArm infection. Notably, mice receiving Bcl6f/fPrdm1f/fCreCD4 SMARTA cells failed to generate BGC cells, in contrast to mice receiving wild-type or Prdm1f/fCreCD4 SMARTA cells (Fig.1e). Similarly, BGC and plasma cell (BPC; IgDloCD138hi) responses were negligible in mice receiving either Bcl6f/fPrdm1f/fCreCD4 or Bcl6f/fCreCD4 SMARTA cells in response to KLH-gp61 immunization (Fig.1d,f). ~50% of wild-type SMARTA cells migrated into B cell follicles and GCs (Fig.1g–h and Extended Data Fig.1h–i). Bcl6f/fCreCD4 SMARTA cells were mostly excluded from the B cell follicle3. Bcl6f/fPrdm1f/fCreCD4 SMARTA cells did not generate any histologically observable GCs and exhibited a migration pattern indistinguishable from Bcl6f/fCreCD4 SMARTA cells. IgG titers were significantly decreased in mice receiving Bcl6f/fPrdm1f/fCreCD4 or Bcl6f/fCreCD4 SMARTA cells (Fig.1i). Altogether, we conclude that differentiation into TFH cells is not the default pathway of activated CD4+ T cells, and Bcl-6 has important activities beyond inhibition of Prdm1 for instructing functional GC-TFH and GC development.
Bcl-6 is an autoregulatory repressor in CD4+ T cells
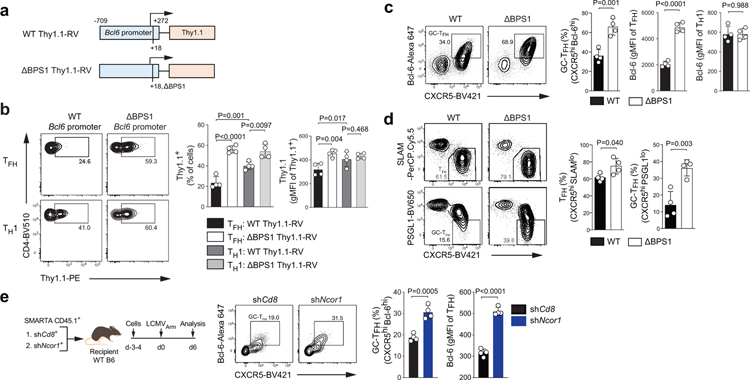
In B cells, Bcl-6 is generally considered an obligate repressor of transcription, but Bcl-6 mechanisms of action have been controversial in CD4+ T cells. While Bcl-6 expression positively correlates with expression of many genes in TFH cells, including genes with Bcl-6 binding sites24,25, a mechanistic connection between Bcl-6 binding and gene regulation has been lacking. One example target gene of interest is Bcl6 itself. Bcl-6 binds to its own promoter in human and mouse GC-TFH cells24,25. This Bcl-6 binding site (Bcl6 Promoter Site 1; BPS1) sequence is conserved among mammals (Extended Data Fig.2a). Given that Bcl-6 expression positively correlates with TFH differentiation, Bcl-6 has been considered a plausible candidate for positive regulation by Bcl-6. In contrast, there is evidence in B cell tumor lines that BCL-6 exhibits negative autoregulation30. To test whether Bcl-6 acts as a repressor or an activator of its own expression in CD4+ T cells, we first utilized a self-inactivating (SIN) retroviral vector (RV) to measure Bcl6 promoter activity (Fig.2a and Extended Data Fig.2b). SMARTA cells were transduced with the wild-type Thy1.1-RV (an RV construct containing the proximal Bcl6 promoter upstream of a Thy1.1 reporter) or ΔBPS1 Thy1.1-RV (a mutated Bcl6 promoter construct with an 8-nt deletion mutation), transferred to recipient mice, and Bcl6 promoter activity was analyzed in TFH and TH1 cells after acute LCMV infection (Extended Data Fig.2c–d). Wild-type Bcl6 promoter activity (Thy1.1 expression) was reduced in TFH cells compared to TH1 cells. ΔBPS1 Bcl6 promoter activity was increased in TFH cells in comparison to the wild-type Bcl6 promoter (Fig.2b). Thus, Bcl-6 appears to repress Bcl6 promoter activity in TFH cells by binding of Bcl-6 to the BPS1 locus.
Figure 2. Bcl-6 exhibits direct negative autoregulatory feedback.
a, Schematic diagram of Bcl6 promoter RV plasmid. Wild-type or ΔBPS1 Bcl6 promoter Thy1.1-RV were generated based on pQdT SIN vector.
b, Representative flow cytometry and quantification of flow cytometry gate of Thy1.1 reporter positive cells, gated on CXCR5+ TFH or CXCR5lo TH1 cells from spleens of C57BL/6 host mice given SMARTA CD4+ T cells transduced with wild-type-RV or ΔBPS1-RV, followed by infection of the host mice with LCMVArm, and analyzed 7 days after infection. Three independent experiments were performed; each dot represents one mouse (n = 4). Data are mean ± s.d., unpaired two-tailed Student’s t-test. See Extended Data Fig.2c–d.
c,d, Phenotyping of wild-type and ΔBPS1 SMARTA cells from C57BL/6 host mice given wild-type or ΔBPS1 SMARTA CD4+ T cells, followed by infection of the host mice with LCMVArm, and analyzed 7 days after infection. Representative flow cytometry of TFH and GC-TFH SMARTA cell subsets from spleens of LCMVArm infected mice. Two independent experiments were performed; each dot represents one mouse (n = 4). Data are mean ± s.d., unpaired two-tailed Student’s t-test. See Extended Data Fig.2 for experimental scheme (g) and quantification of gene expression level (h).
e, SMARTA CD4+ T cells transduced with shCd8-RV or shNcor1-RV were transferred to C57BL/6 host mice, followed by infection of the host mice with LCMVArm, and analyzed 7 days after infection. Representative flow cytometry of GC-TFH RV+ SMARTA cell subsets from spleens of LCMVArm infected mice. Two independent experiments were performed; each dot represents one mouse (n = 4). Data are mean ± s.d., unpaired two-tailed Student’s t-test.
To test whether Bcl-6 binding to the endogenous Bcl6 promoter affects Bcl-6 expression in vivo, we generated a new CRISPR mouse line possessing the 8-nt ΔBPS1 mutation. ΔBPS1 or littermate control (WT) SMARTA cells were transferred into C57BL/6 mice and then host mice were infected with LCMVArm (Extended Data Fig.2e–f). ΔBPS1 SMARTA cells had highly increased Bcl-6 expression only in TFH cells, not in TH1 cells, indicating that BPS1 acts as a cis-regulatory element of Bcl6 expression only when cells express elevated Bcl-6. Deletion of BPS1 increased the frequency of TFH cells (CXCR5hiSLAMlo) and GC-TFH cells (CXCR5hiPSGL1lo or CXCR5hiBcl-6hi; Fig.2c–d). Changes in TFH-associated proteins were observed specifically in TFH cells (see Supplementary Note; Extended Data Fig.2g).
Ncor1 is a Bcl-6 corepressor31. BCL-6 binding at the BCL6 promoter locus overlapped with NCOR binding in a human B cell line (Extended Data Fig.2h). To determine whether the Bcl-6 autoregulation in CD4+ T cells involved Ncor1, we transferred SMARTA cells expressing an shRNAmir targeting Ncor1 (shNcor1-RV) or a negative control shCd8 into B6 mice followed by an acute LCMVArm infection. shNcor1+ SMARTA cells exhibited enhanced GC-TFH cell development and Bcl-6 expression (Fig.2e). In sum, these data indicate that Bcl-6 represses its own expression in CD4+ T cells, mediated in conjunction with co-repressor Ncor1, in a negative autoregulatory feedback loop at the Bcl6 promoter, dampening TFH and GC-TFH cell accumulation.
Simple circuitry repressor-of-repressors model of Bcl-6
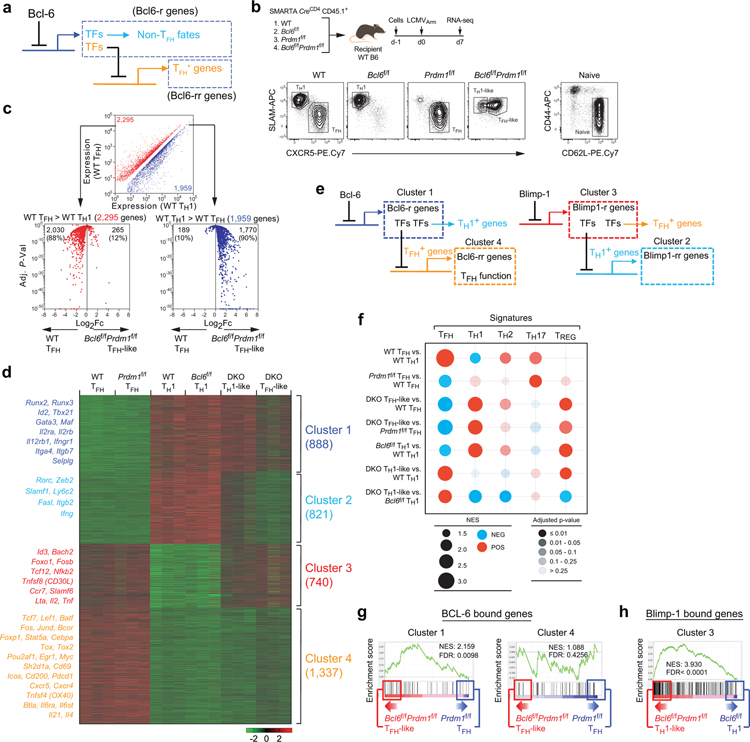
The findings above excluded the simplest model of Bcl-6 regulation of TFH differentiation. A logical model for how Bcl-6 functions as the lineage defining TF of TFH biology is that Bcl-6 instructs positive TFH gene expression by a repressor-of-repressors mechanism. A simple circuitry model can be proposed (Fig.3a) wherein Bcl-6 inhibits a set of repressor TFs (“Bcl6-r” TFs, directly inhibited by Bcl-6) that in turn repress genes positively associated with TFH biology (“Bcl6-rr” genes, genes inhibited by repressor TFs targeted by Bcl-6). Alternative cell fates (i.e., non-TFH or TH1/TH2/TH17/iTREG) and genes downregulated as part of TFH cell migration or function (e.g., Selplg, encoding PSGL1) may be downregulated by Bcl-6 directly in this simple gene circuitry model. Testing this model is difficult because of the mutually antagonistic relationship of Bcl-6 and Blimp-1. We reasoned that CD4+ T cells deficient in both Bcl-6 and Blimp-1 would be needed to gain insights into TFs directly regulated by Bcl-6.
Figure 3. A testable simple circuitry model of TFH differentiation.
a, A hypothetical model of Bcl-6 on the regulation of non-TFH and TFH genes. Bcl6-r, genes repressed by Bcl-6. Bcl6-rr, genes repressed by repressors that are repressed by Bcl-6.
b, Schematic of the SMARTA cell transfer system used for RNA-seq analysis. TH1 (CXCR5loSLAMhi) populations from wild-type and Bcl6f/f CreCD4 SMARTA cells, TFH (CXCR5hiSLAMlo) populations from wild-type and Prdm1f/f CreCD4 SMARTA cells, TH1-like (CXCR5loSLAMint) and TFH-like (CXCR5+SLAMint) populations from Bcl6f/fPrdm1f/f CreCD4 SMARTA cells were sorted from spleens of C57BL/6 host mice given wild-type, Bcl6f/f, Prdm1f/f, and Bcl6f/fPrdm1f/f CreCD4 SMARTA CD4+ T cells, followed by infection of the host mice with LCMVArm, and analyzed 7 days later. Naive SMARTA cells were isolated as CD44loCD62LhiCD45.1+ from uninfected mice. Representative flow cytometry of TFH, TH1, TFH-like, and TH1-like subsets from three independent experiments.
c, Upper, scatter plot of genes upregulated (red) or downregulated (blue) in TFH cells relative to their expression in TH1 cells (1.4-fold cut off, Adj. P <0.05). Lower, volcano plots of gene expression changes between wild-type TFH cells and Bcl6f/fPrdm1f/f TFH-like cells (horizontal axis) against Adj. P-value (vertical axis). Numbers indicate total and percent of those genes upregulated in wild-type TFH cells (top left) or Bcl6f/fPrdm1f/f TFH-like cells (top right). TH1 cell-associated genes, upregulated in wild-type TH1 cells versus wild-type TFH cells (WT TH1 > WT TFH); TFH cell-associated genes, upregulated in wild-type TFH cells versus wild-type TH1 cells (WT TFH > WT TH1). Adj. P-values for multiple test correction were determined using Benjamini-Hochberg algorithm.
d, Gene expression changes were clustered by MAP-DP analysis. Scale, row z-score. DKO, Bcl6f/fPrdm1f/f CreCD4.
e, Left, a hypothetical model of Bcl-6 regulation of Bcl6-rr TFH+ genes in Cluster 4 by inhibition of Bcl6-r TFs in Cluster 1. Right, a hypothetical model of Blimp-1 regulation of Blimp-1-rr TH1+ genes in Cluster 2 by inhibition of Blimp-1-r TFs in Cluster 3.
f, Multiple gene set enrichment analyses (GSEA) for identifying and comparing gene signatures in CD4+ T cells between subpopulations. Blue indicates a negative association, and red indicates a positive association. Circle size is proportional to NES (scale: 1.5–3.0). Tint indicates adjusted P-value that were corrected using Benjamini-Hochberg algorithm.
g, GSEA of BCL-6 bound genes from human tonsillar GC-TFH24 compared to Cluster 1 genes (left) or Cluster 4 genes (right) differentially expressed between Bcl6f/fPrdm1f/f TFH-like cells and Prdm1f/f TFH cells. The ticks below the line correspond to the rank of each gene that is defined by p-value of gene expression change between Bcl6f/fPrdm1f/f TFH-like and Prdm1f/f TFH. NES, normalized enrichment score; FDR, false discovery rate.
h, GSEA of Blimp-1 bound genes from activated CD8 T cells54 in comparison of Cluster 3 genes differentially expressed between Bcl6f/fPrdm1f/f TH1-like cells and Bcl6f/f TH1 cells.
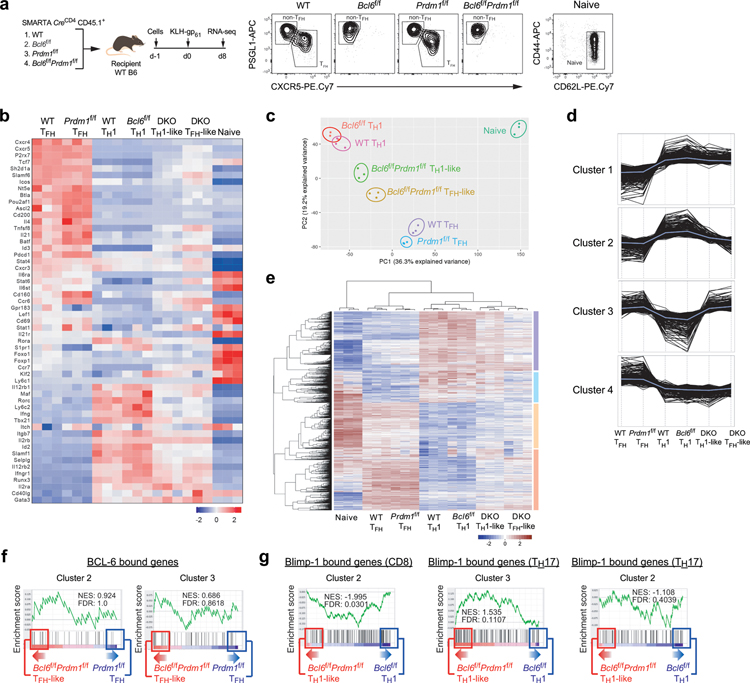
To identify the putative set of Bcl6-r TFs, we conducted RNA-seq gene expression profiling of Bcl6f/fPrdm1f/fCreCD4, Bcl6f/fCreCD4, Prdm1f/fCreCD4, and wild-type SMARTA TFH and TH1 cells generated in response to acute LCMVArm infection or KLH-gp61 immunization (Fig.3b and Extended Data Fig.3a). As a first analysis the effect of Bcl6/Prdm1 double-deficiency on the TFH biology, we assessed expression of a broad curated set19,22,25 of TFH-associated genes across all samples from RNA-seq gene expression profiling. Bcl6f/fPrdm1f/fCreCD4 TFH-like cells lost expression of positively TFH-associated genes in comparison to wild-type TFH cells or Prdm1f/fCreCD4 TFH cells. Conversely, Bcl6f/fPrdm1f/fCreCD4 TH1-like cells had a gene expression profile different from wild-type TH1 or Bcl6f/fCreCD4 TH1 cells (Extended Data Fig.3b). Principal component analysis provided similar findings (Extended Data Fig.3c), supporting the overall hypothesis that TFH is not a default differentiation pathway of CD4+ T cells and Bcl-6 has important activities beyond inhibition of Prdm1. We next characterized the effect of Bcl6/Prdm1 double-deficiency on the expression of all TFH- and TH1-associated genes (Extended Data Fig.3b–c). Bcl6f/fPrdm1f/fCreCD4 TFH-like cells had reduced expression of ~88% of genes upregulated in wild-type TFH cells (Fig.3c). These data indicate that the vast majority of genes upregulated in TFH cells required Bcl-6 for proper induction. Furthermore, Bcl6f/fPrdm1f/fCreCD4 TFH-like cells had increased expression of ~90% of genes upregulated in wild-type TH1 cells, suggesting that Bcl-6 was required to properly repress most TH1-associated genes. Taken together, Bcl-6 is broadly important for both induction of TFH genes and repression of non-TFH genes, consistent with, and expanding upon, previous observations3–5,24,29.
To identify genes likely to be directly repressed by Bcl-6, we analyzed patterns of gene expression changes between the six different TFH and TH1 populations and naive CD4+ T cells. K-means analysis (K=10) and hierarchical clustering bioinformatic approaches both readily separated four distinct major gene expression patterns (Extended Data Fig. 3d–e). To obtain gene lists associated with those four major cluster patterns, MAP-DP clustering was performed (Fig.3d). We then attempted to apply our simple circuitry model of Bcl-6 function to the MAP-DP clustering outcomes. Given that the data sets also include modulation of Blimp-1 expression, and that Blimp-1 has major effects on TH1 versus TFH differentiation, we posited that a similar circuitry model of Blimp-1–mediated gene regulation may need to be included (Fig.3e). We therefore assessed whether the four major gene expression patterns regulated in TFH and TH1 cells could be largely accounted for by this simple circuitry model of Bcl-6 and Blimp-1 functioning as repressors. The model predicts that TFH upregulated genes (Bcl6-rr) are upregulated via a Bcl-6 repressor-of-repressors mechanism (Fig.3e). If the model was accurate, these Bcl6-rr genes would correspond to Cluster 4, as expression of such genes would be reduced in Bcl6f/fPrdm1f/fCreCD4 TFH-like cells compared to Prdm1f/fCreCD4 TFH cells (Fig.3d–e). Indeed, many genes upregulated in wild-type TFH cells and important for the differentiation and function of TFH cells were observed in Cluster 4, including Cxcr5, Icos, Cd200, Pdcd1, Sh2d1a, Tcf7, Lef1, Tox, Tox2, Il6ra, IL4, and Il21.
The model predicts that genes directly repressed by Bcl-6 (Bcl6-r) would fall into Cluster 1 (Fig.3e). Genes associated with alternative cell fates directly repressed by Bcl-6 would also group in Cluster 1. Important genes associated with non-TFH fates do indeed group in Cluster 123 (Fig.3d). Bcl6f/fPrdm1f/fCreCD4 TFH-like cells had increased TH1, TH2, and TREG signature genes expression (Fig.3f). Thus, multiple analytical approaches identified major gene networks and expression changes consistent with the proposed Bcl-6 repressor-of-repressors model.
If the Bcl-6 repressor-of-repressor model was accurate, a substantial proportion of Cluster 1 genes should represent genes directly repressed by Bcl-6 binding (Bcl6-r), while Cluster 4 genes should largely represent genes not directly bound by Bcl-6 (Bcl6-rr). To test this, we used the gene set of BCL-6-bound genes in human GC-TFH cells identified by BCL-6 ChIP-Seq24 and performed GSEA against Clusters 1 & 4 (see Supplementary Note). BCL-6–bound genes were highly enriched in Cluster 1 (Fig. 3g). In contrast, BCL-6-bound genes were not enriched in Cluster 4 (Fig.3g). Similarly, BCL-6-bound genes also were not enriched in Cluster 2 & 3 (Extended Data Fig.3f). Our model predicted that Cluster 2 & 3 would contain genes regulated by Blimp-1 (Blimp1-rr and Blimp1-r), with Cluster 3 genes directly targeted by Blimp-1 (Fig.3e). GSEA using Blimp-1-bound gene sets showed that Cluster 3 genes were highly enriched for Blimp-1-bound genes (Fig.3h and Extended Data Fig.3g), consistent with the model proposed. While the analyses do not exclude the possibility of some activity of Bcl-6 as an activator (see Supplementary Note), taken together, the data support the proposed model that Bcl-6 primarily acts as a repressor in regulating TFH biology.
Bcl-6, Blimp-1, and Id2 relationships regulate Cxcr5
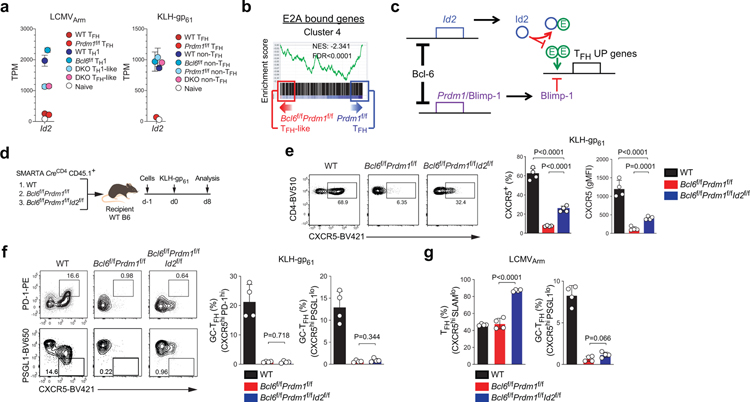
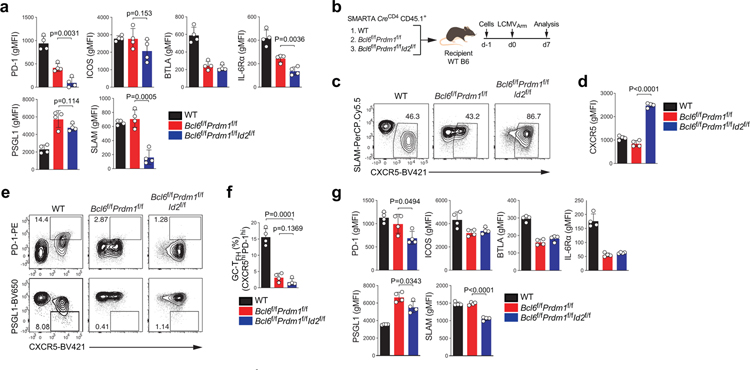
Among genes directly repressed by Bcl-6, TFs were of particular interest. Id2 was identified in the clustering analysis as a Bcl6-r TF (Fig.4a). We previously demonstrated that Id2 is an important regulator of TFH differentiation22. Bcl-6 directly represses Id2, and Id2 inhibits CXCR5 expression via complexing with E proteins22,23. GSEA showed that E2A-bound genes were enriched in Cluster 4 (Fig.4b). Therefore, a minimalist TFH differentiation model would be that Bcl-6 initiates and controls TFH biology primarily via repression of two inhibitory TFs: Blimp-1 and Id2 (Fig.4c). To test the model, we generated Bcl6f/fPrdm1f/fId2f/fCreCD4 SMARTA mice. Bcl6f/fPrdm1f/fId2f/fCreCD4 CD4+ T cells exhibited substantial increases in CXCR5 expression in comparison to Bcl6f/fPrdm1f/fCreCD4 CD4+ T cells (Fig.4d–e). However, GC-TFH differentiation by Bcl6f/fPrdm1f/fId2f/fCreCD4 CD4+ T cells remained extremely defective (Fig.4f–g and Extended Data Fig. 4a–g). These data indicated that Bcl-6 likely represses multiple TFs in addition to Blimp-1 and Id2 to control TFH biology.
Figure 4. Bcl-6 drives CXCR5 expression via repression of Id2-E2A pathway.
a, Gene expression of Id2 from RNA-seq data of LCMVArm infected mice or KLH-gp61 immunized mice. Each data point was collected from three (LCMVArm) or four (KLH-gp61) independent experiments.
b, GSEA of E2A bound genes from thymocytes22,55 in comparison to Cluster 4 genes between Bcl6f/fPrdm1f/f TFH-like cells and Prdm1f/f TFH cells.
c, A hypothetical model of Bcl-6 regulation of TFH genes primarily via inhibition of Id2 and Prdm1/Blimp-1.
d, Schematic of the SMARTA cell transfer system used for KLH-gp61 immunization. Wild-type, Bcl6f/fPrdm1f/f, or Bcl6f/fPrdm1f/fId2f/f CreCD4 SMARTA CD4+ T were transferred to C57BL/6 host mice, followed by immunization of the host mice with KLH-gp61 in alum + cGAMP, and analyzed 8 days later. See Fig. 4e,f and Extended Data Fig.4a.
e,f, Representative flow cytometry of CXCR5hi TFH, CXCR5hiPD-1hi and CXCR5hiPSGL1lo GC-TFH SMARTA cell subsets from dLNs of KLH-gp61 immunized mice in Fig.4d. Two independent experiments were performed; each dot represents one mouse (n = 4). Data are mean ± s.d., unpaired two-tailed Student’s t-test.
g, Quantification of CXCR5hiSLAMlo TFH and CXCR5hiPSGL1lo GC-TFH cells, gated on SMARTA cells from spleens of LCMVArm infected mice. Two independent experiments were performed; each dot represents one mouse (n = 4). Data are mean ± s.d., unpaired two-tailed Student’s t-test. See Extended Data Fig.4b–g.
Identification of Bcl-6 target TF candidates
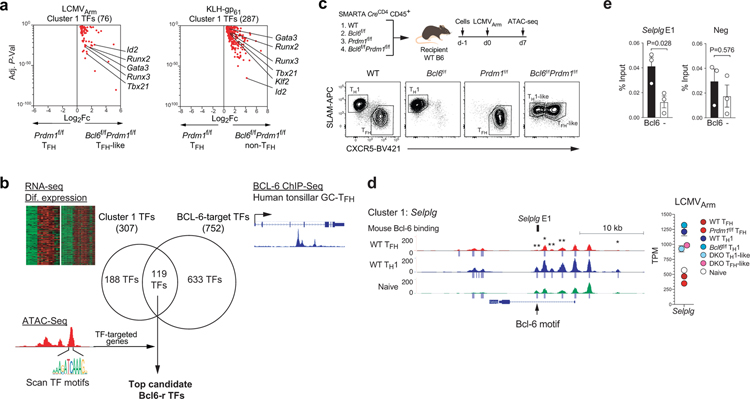
Which TFs in addition to Blimp-1 and Id2 are key repressors downstream of Bcl-6 that control genes upregulated in TFH cells? The simple circuitry repressor-of-repressors model predicts that such TFs should be present in Cluster 1 (Fig.3e). 307 TFs were identified in Cluster 1 (Fig.5a). We developed an analytical approach to identify candidate TFs by integrated analysis of the composite RNA-seq data with both BCL-6 ChIP-seq data from human tonsillar GC-TFH cells24 and ATAC-seq of TFH and non-TFH cells from multiple genetically modified mice. Among the Cluster 1 TFs, 119 TFs represented BCL-6–bound gene loci in human GC-TFH cells, confirming that these 119 TFs are direct targets of BCL-6 (Fig.5b).
Figure 5. Integrated analysis of multiple genetic backgrounds and data types.
a, Volcano plot of gene expression changes of Cluster 1 TFs between Bcl6f/fPrdm1f/f TFH-like cells and Prdm1f/f TFH cells (LCMVArm infection) or between Bcl6f/fPrdm1f/f non-TFH cells and Prdm1f/f TFH cells (KLH-gp61 immunization) (1.4-fold cut off, Adj. P<0.05); 76 TFs from LCMVArm infection; 287 TFs from KLH-gp61 immunization; combined 307 TF). Adj. P-values for multiple test correction were determined using Benjamini-Hochberg algorithm. Each data point was collected from independent experiments. Select genes of interest are labeled.
b, Schematic of the integrated analytical approach. The composite RNA-seq data with both BCL-6 ChIP-seq data from human tonsillar GC-TFH cells and ATAC-seq of TFH and TH1 cells from wild-type, Bcl6f/f, Prdm1f/f and Bcl6f/fPrdm1f/f CreCD4 SMARTA cells. Among the Cluster 1 TFs in Fig.5a, 119 TFs represented BCL-6-bound gene loci in human GC-TFH cells. ATAC-seq and TF motifs scanning filters top Bcl6-r TF candidates.
c, Schematic of the experimental plan to generate ATAC-seq data. TH1 (CXCR5loSLAMhi) populations from wild-type and Bcl6f/f CreCD4 SMARTA cells, TFH (CXCR5hiSLAMlo) populations from wild-type and Prdm1f/f CreCD4 SMARTA cells, TH1-like (CXCR5loSLAMint) and TFH-like (CXCR5+SLAMint) populations from Bcl6f/fPrdm1f/f CreCD4 SMARTA cells were sorted from spleens of C57BL/6 host mice given wild-type, Bcl6f/f, Prdm1f/f, and Bcl6f/fPrdm1f/f CreCD4 SMARTA cells, followed by infection of the host mice with LCMVArm, and analyzed 7 days later. Naive SMARTA cells were isolated as CD44loCD62LhiCD45.1+ from uninfected mice. Representative flow cytometry of TFH, TH1, TFH-like, and TH1-like subsets from three independent experiments.
d, Genome-browser tracks depict ATAC-seq chromatin accessibility and TF occupancy. Peak calls indicated below each track. A Bcl-6 liftover peak from human to mouse reference genome is indicated. * and ** indicate DEseq2 raw P-val ≤ 0.05 and ≤ 0.01, respectively, in comparison between wild-type TFH and TH1. Gene expression from RNA-seq data of LCMVArm infected mice is graphed. Each data point was collected from three independent experiments. DKO, Bcl6f/fPrdm1f/f CreCD4.
e, ChIP-qPCR analysis of Bcl-6 at Selplg E1 or negative control region among chromatin prepared from CXCR5hi TFH cells from spleens of C57BL/6 host mice given SMARTA CD4+ T cells transduced with myctagN-Bcl6-RV, followed by infection of the host mice with LCMVArm, and analyzed 7 days after infection. ChIP was performed using an anti-myc IgG or control IgG. Three independent experiments were performed. Each data point is from an independent experiment (n=3) and presented as a percent of input. Data are mean ± s.e.m., unpaired two-tailed Student’s t-test.
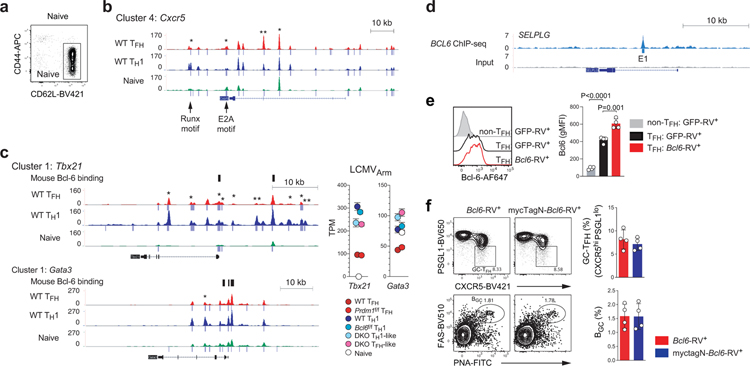
The most functionally important Bcl6-r TFs would repress Bcl6-rr genes, based on the repressor-of-repressors Bcl-6 model (Fig.3a). We reasoned that candidate Bcl6-r TFs could be functionally connected to transcriptional regulation of genes upregulated in wild-type TFH cells in a Bcl-6-dependent manner by testing for enrichment of candidate TF DNA binding motifs in differentially accessible chromatin regulatory regions of TFH-associated genes, particularly between Prdm1f/f TFH and Bcl6f/fPrdm1f/f TFH-like cells, as those chromatin changes would be dependent on Bcl-6 expression. We therefore conducted ATAC-seq of TFH or TH1 populations of Bcl6f/fPrdm1f/fCreCD4, Bcl6f/fCreCD4, Prdm1f/fCreCD4, and wild-type SMARTA cells in the context of acute LCMVArm infection (Fig.5c). Several genes of interest were examined as a first test. An E2A binding motif was identified in a differential TFH ATAC-seq peak in a downstream enhancer of Cxcr5, consistent with Bcl-6 control of CXCR5 expression via inhibition of Id2 (Extended Data Fig.5a–b). Selplg, Tbx21, and Gata3 are known Bcl-6-bound genes24. Substantial changes in chromatin accessibility were observed for each of these genes. BCL-6 binding sites of these genes in human GC-TFH cells were conserved in mouse by syntenic analysis (Fig.5d and Extended Data Fig.5c,d). A differential TFH ATAC-seq peak in an Selplg intron overlapped with a large human GC-TFH BCL-6 ChIP-Seq peak24 centered on a BCL-6 DNA binding motif (SELPLG E1) (Fig.5d and Extended Data Fig.5d). To evaluate whether SELPLG E1 BCL-6 binding is conserved in mouse TFH, we performed Bcl-6 ChIP with Myc-tagged Bcl-6 expressing (myctagN-Bcl6-RV+) Bcl6f/fCreCD4 TFH cells. Human BCL-6 bound SELPLG E1 in GC-TFH was indeed a site bound by Bcl-6 in mouse TFH cells (Fig.5e). Together, these results indicated the ATAC-seq data were high quality and could be used for broader TF motif scanning.
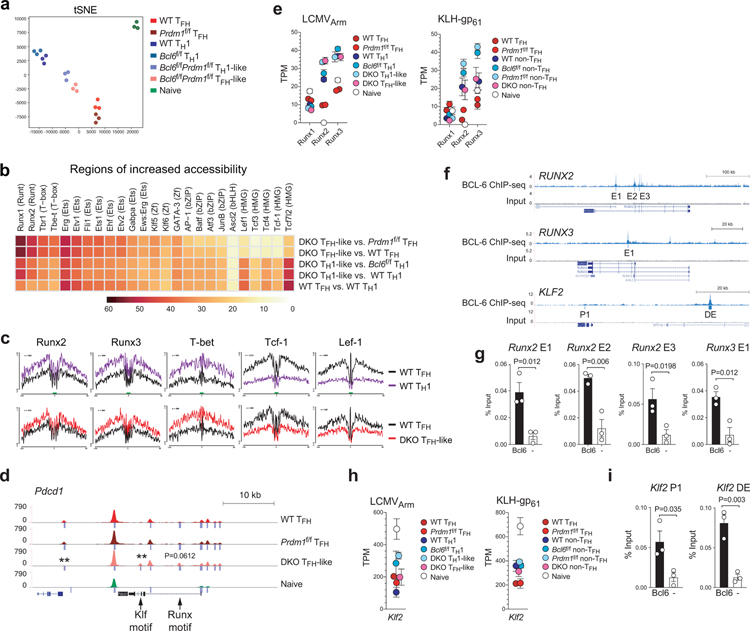
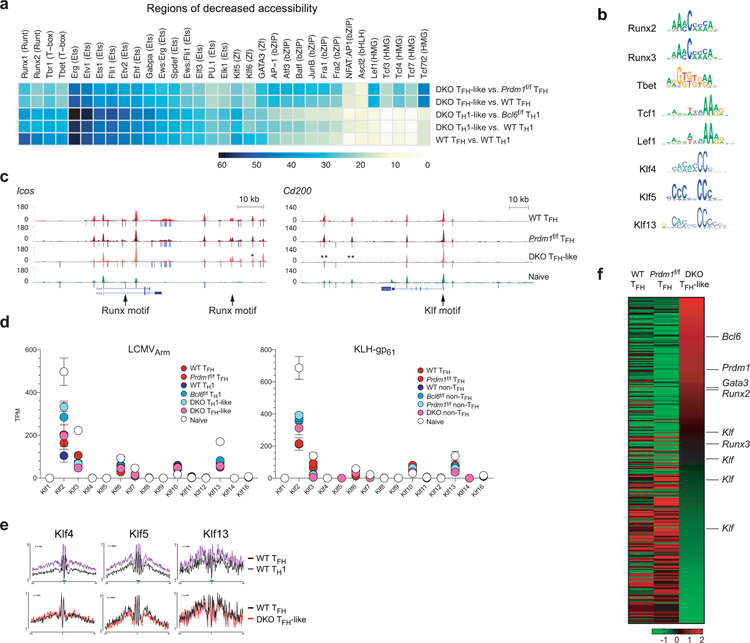
We then applied the differential chromatin accessibility plus TF motif analysis to all genes, across all ATAC-seq data sets, to identify TF motifs that were enriched within regions that underwent differential chromatin remodeling. Chromatin accessibility in the seven cell populations was distinct (Fig.6a). We scanned for 566 known TF-binding motifs within each differentially accessible ATAC peak in the genome. Motifs recognized by TFs Runx, Ets, T-box and Klf families were most highly enriched in chromatin regions with increased accessibility in Bcl6f/fPrdm1f/f TFH-like cells compared against Prdm1f/f TFH cells (each p<1.0 × 10⁻¹⁶) and wild-type TFH cells (Fig.6b). In contrast, in the same cell type comparisons, these TF motifs were depleted from chromatin regions with reduced accessibility (Extended Data Fig.6a). Changes in abundance of Runx DNA binding motifs were particularly significant (p<9 × 10−75). Runx and Tbet footprints were present (Fig.6c and Extended Data Fig.6b), indicating Bcl-6 expression prevents Runx and T-box family TFs from binding these sites, most likely by direct Bcl-6 transcriptional repression of Runx and T-box family genes. Runx DNA binding sites were observed in enhancer regions of TFH-associated genes including Pdcd1 and Icos (Fig.6d and Extended Data Fig.6c). All three Runx TFs are expressed in CD4+ T cells (Fig.6e), and each Runx TF is known to be competent for binding consensus Runx motifs32. Runx2 and Runx3 were grouped in Cluster 1 in the gene expression MAP-DP clustering analysis (Fig. 3d), making them the more likely Runx candidates for repression by Bcl-6. BCL-6 bound robustly to RUNX2 and RUNX324 enhancers in human GC-TFH cells (Fig.6f). Bcl-6 bound Runx2 E1, Runx2 E2, Runx2 E3, and Runx3 E1 in mouse TFH cells, confirming conservation of Bcl-6 binding to Runx2 and Runx3 loci (Fig.6g).
Figure 6. Identification of candidate TFs.
a, tSNE analysis of ATAC-seq chromatin accessibility.
b, Heatmap plots representing the frequencies of the most enriched TF motifs in regions of increased accessibility (relatively more open in first group than second group, DEseq2 raw P-val < 0.05). Scale, motif frequencies (%).
c, TF footprints derived from ATAC-seq reads over representative TF motifs within accessible ATAC-seq regions.
d, Genome-browser tracks depict ATAC-seq chromatin accessibility and TF occupancy. Peak calls indicated below each track. ** indicates DEseq2 raw p-val ≤ 0.01 in comparison between Bcl6f/fPrdm1f/f CreCD4 TFH-like and Prdm1f/f CreCD4 TFH.
e, Gene expression of Runx1, Runx2, and Runx3 from RNA-seq data of LCMVArm infected mice or KLH-gp61 immunized mice. Each data point was collected from three (LCMVArm) or four (KLH-gp61) independent experiments.
f, Genome-browser tracks depict BCL-6 ChIP-Seq peaks at RUNX2, RUNX3, and KLF2 loci. Peak calls indicated below each track.
g,i. ChIP-qPCR analysis of Bcl-6 at Runx2 E1, E2 and E3, Runx3 E1, or Klf2 P1 and DE among chromatin prepared from CXCR5hi TFH cells as shown in Fig.5e. Three independent experiments were performed. Each data point is from an independent experiment (n=3) and presented as a percent of input. Data are mean ± s.e.m., unpaired two-tailed Student’s t-test.
h, Gene expression of Klf2 from RNA-seq data of LCMVArm infected mice or KLH-gp61 immunized mice. Each data point was collected from three (LCMVArm) or four (KLH-gp61) independent experiments.
Enrichment of Klf DNA binding motifs in Bcl6f/fPrdm1f/f TFH-like cells was examined further. Several Klf-family TFs are expressed in CD4+ T cells, with Klf2 representing the dominant member (Extended Data Fig.6d). Klf2 exhibited a Cluster 1 type gene expression pattern in TFH cells in the context of KLH-gp61 immunization, while it exhibited a more complex gene expression pattern in acute LCMV infection (Fig.6h). The TF footprints for several Klf motifs were enriched in wild-type TH1 cells over wild-type TFH cells (Extended Data Fig.6b,e). Bcl-6 bound the Klf2 promoter (P1) and a putative distal enhancer (DE), confirming that Bcl-6 binding sites at Klf2 loci are conserved between humans and mice (Fig.6f,i). Klf binding sites were observed in open chromatin regions of multiple signature GC-TFH genes (Fig.6d and Extended Data Fig.6c). These results identified Klf2 as a Bcl6-r TF candidate. GATA-3 is constitutively expressed in CD4+ T cells. Gata3 was defined as a Cluster 1 gene, with reduction of GATA-3 expression in TFH cells compared to TH1 cells (Fig.3d and Extended Data Fig.5c). Taken together, integrated bioinformatic analyses revealed Runx2, Runx3, GATA-3, and Klf2 as strong potential Bcl6-r TF candidates that repress TFH genes.
Bcl-6 repressor-of-repressors circuits
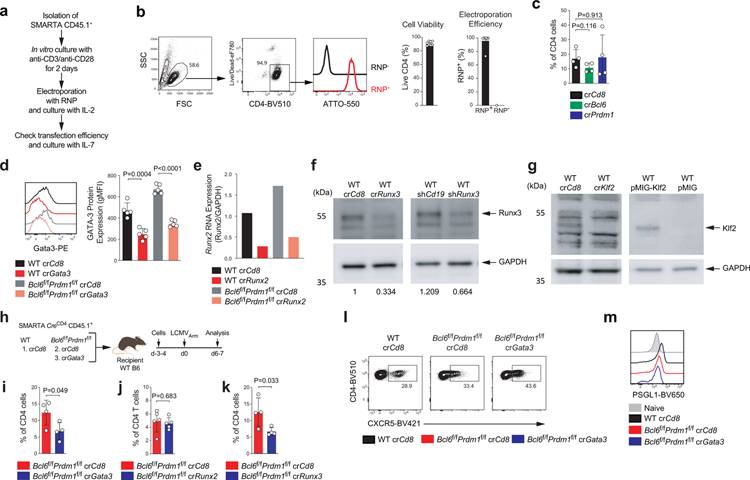
To test the in vivo roles of candidate Bcl6-r TFs, we optimized a system for direct transfection of SMARTA cells with target gene CRISPR RNA (crRNA) and Cas9 ribonucleoprotein (RNP) complexes to disrupt target genes (Extended Data Fig.7a–b). RNP+ SMARTA cells were adoptively transferred into host mice subsequently infected with LCMVArm. Bcl6 and Prdm1 were first tested as positive control genes (Fig.7a–b and Extended Data Fig.7c). crRNA-mediated deletion of TFs was efficient and was a suitable experimental system for exploring the genetics of TFH biology in vivo. We then disrupted Gata3, Runx2, Runx3, and Klf2 as candidate Bcl6-r TFH repressors, with crRNA RNPs in Bcl6f/fPrdm1f/fCreCD4 SMARTA cells, and examined their differentiation in the context of acute LCMV infection. crCd8+ wild-type SMARTA cells were used as controls. crGata3+Bcl6f/fPrdm1f/fCreCD4 SMARTA cells exhibited increased CXCR5 and reduced PSGL1 expression in comparison to crCd8+Bcl6f/fPrdm1f/fCreCD4 SMARTA cells (Fig.7c and Extended Data Fig.7). These results suggest that GATA-3 is a Bcl6-r TF that is a repressor of CXCR5 and a positive regulator of PSGL1.
Figure 7. Identification of Runx2, Runx3, and GATA-3 as repressors of TFH genes, acting downstream of Bcl-6.
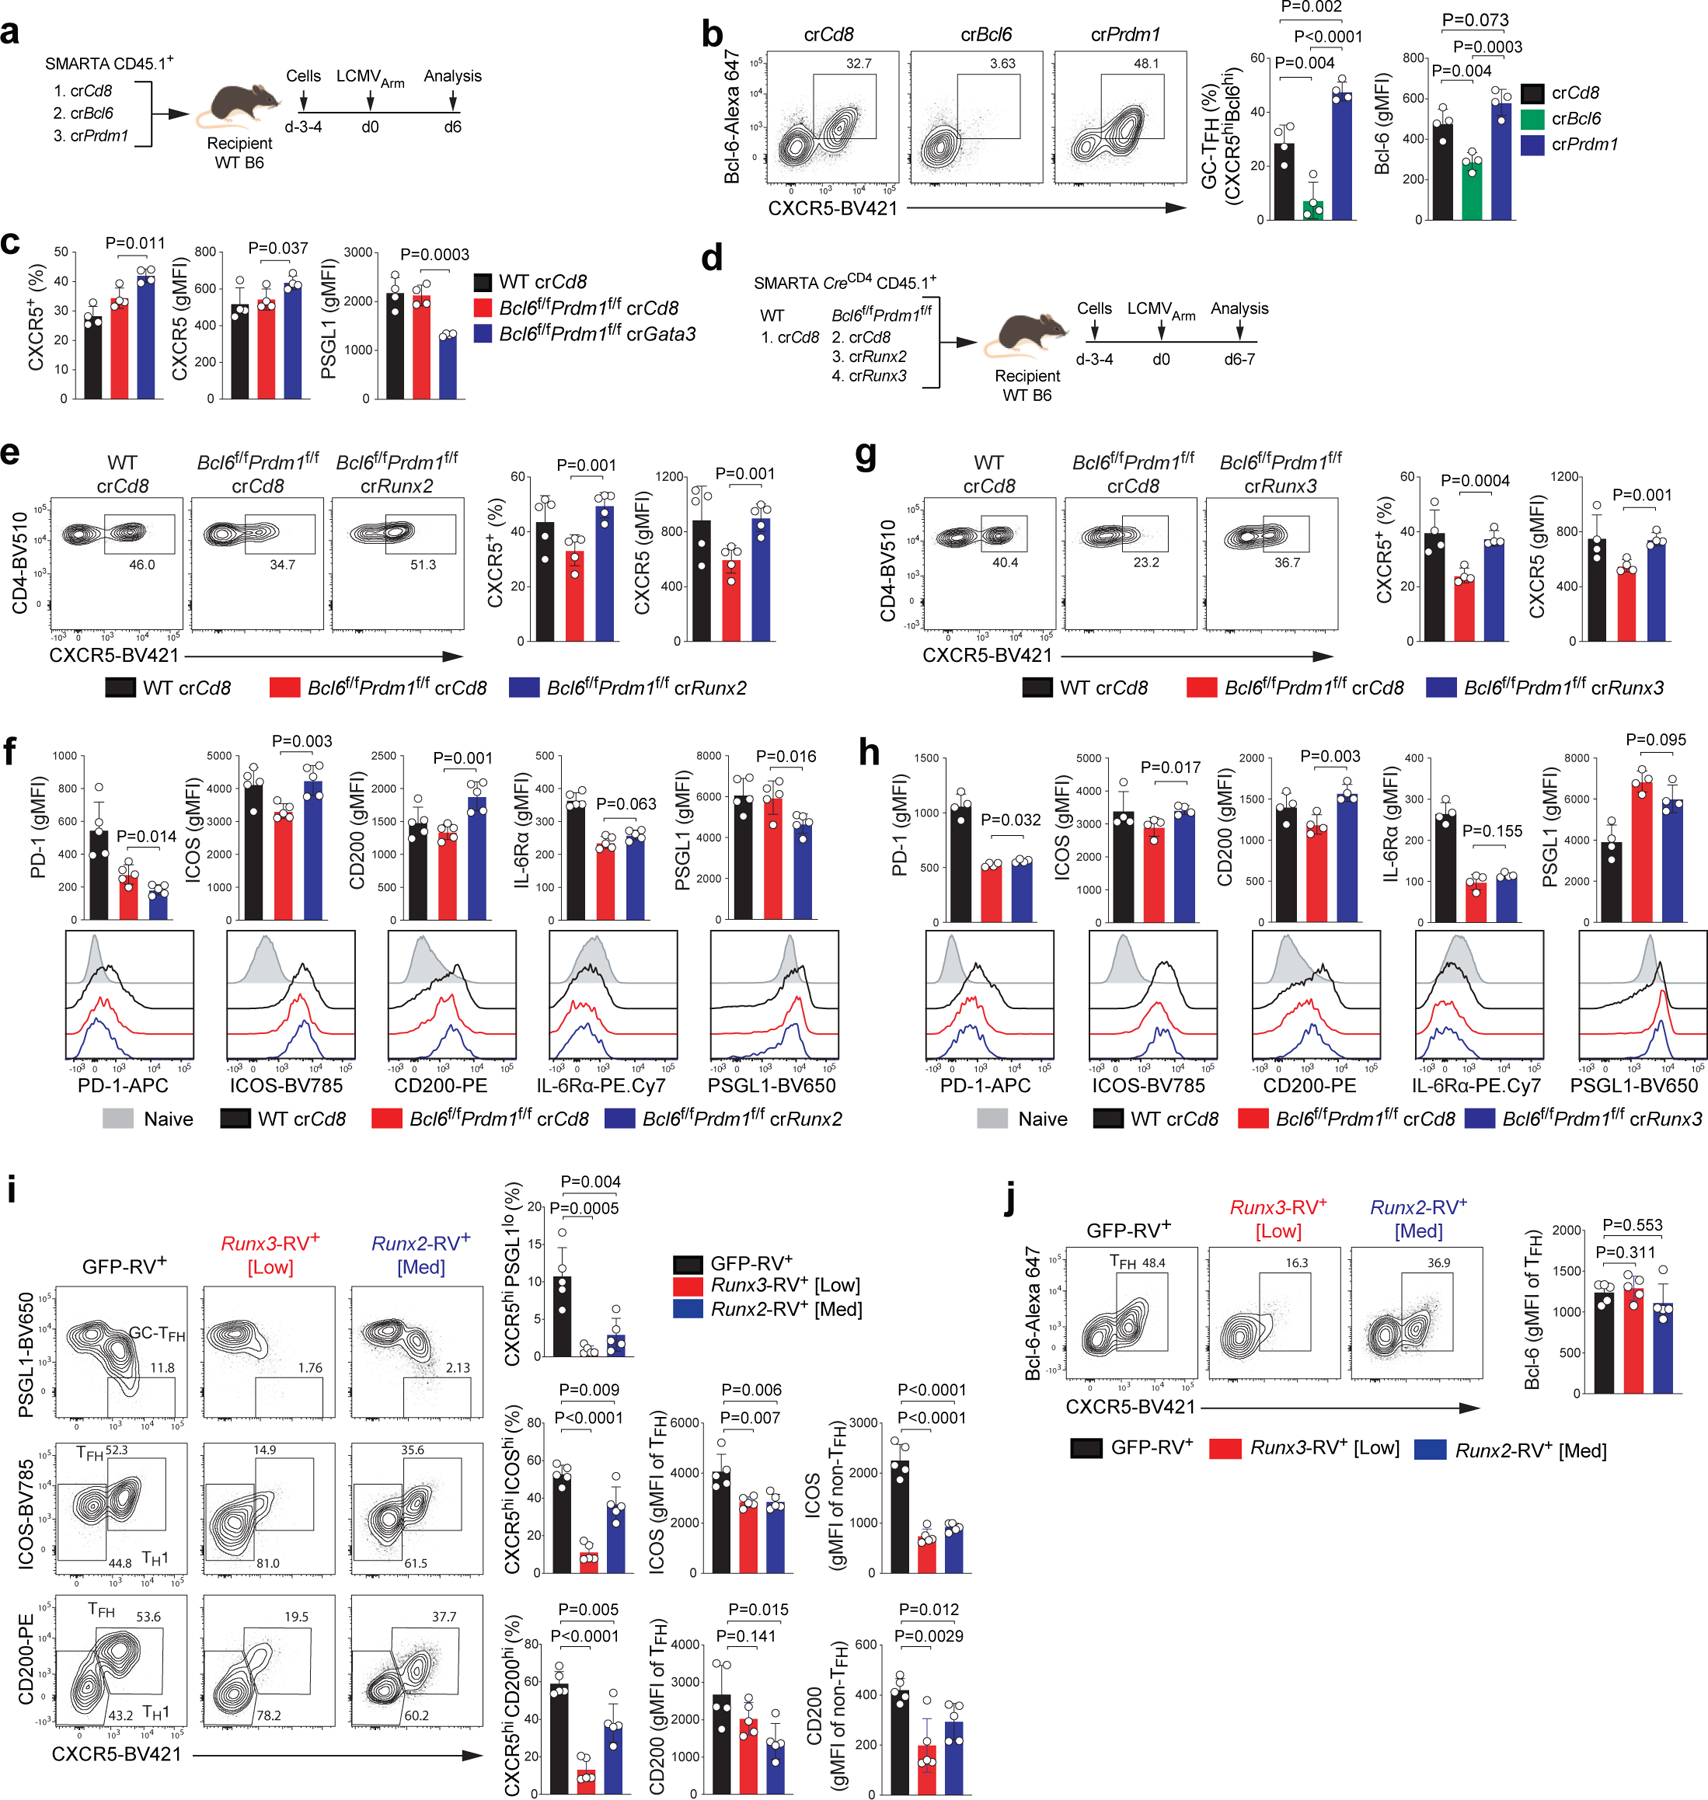
a, Schematic of the CRISPR/Cas9-mediated gene knockdown of SMARTA cell system used for testing Bcl6 and Prdm1 in LCMVArm infection. SMARTA CD4+ T cells transfected with crCd8, crBcl6, or crPrdm1 were transferred to C57BL/6 host mice, followed by infection of the host mice with LCMVArm, and analyzed 6 days later.
b, Representative flow cytometry of GC-TFH SMARTA cell subsets from spleens of LCMVArm infected mice in a. Two independent experiments were performed; each dot represents one mouse (n = 4). Data are mean ± s.d., unpaired two-tailed Student’s t-test.
c, Quantification of results from crCd8+ and crGata3+ SMARTA cells from spleens of LCMVArm infected mice. Three independent experiments were performed; each dot represents one mouse (n = 4). Data are mean ± s.d., unpaired two-tailed Student’s t-test. See Extended Data Fig.7h,i,l,m.
d, Schematic of the CRISPR/Cas9-mediated gene knockdown of SMARTA cell system used for testing Runx2 and Runx3 in LCMVArm infection. wild-type or Bcl6f/fPrdm1f/f CreCD4 SMARTA CD4+ T cells transfected with crCd8, crRunx2, or crRunx3 were transferred to C57BL/6 host mice, followed by infection of the host mice with LCMVArm, and analyzed 6–7 days later. See e–h and Extended Data Fig.7j–k.
e,g, Representative flow cytometry of TFH SMARTA cell subsets from spleens of LCMVArm infected mice in d. Three independent experiments were performed; each dot represents one mouse (e, n = 5;g, n = 4). Data are mean ± s.d., unpaired two-tailed Student’s t-test.
f,h, Quantification of GC-TFH core signature markers, gated on SMARTA cells in d. CD44lo naive CD4+ T cells were used as a negative control.
i,j, Representative flow cytometry of TH1, TFH and GC-TFH RV+ SMARTA cell subsets from spleens of C57BL/6 host mice given SMARTA CD4+ T cells transduced with pMIG (GFP-RV+), pMIG-Runx3myc (Runx3-RV+ [Low]), or pMIG-Runx2myc (Runx2-RV+ [Med]), followed by infection of the host mice with LCMVArm, and analyzed 7 days after infection. Two independent experiments were performed; each dot represents one mouse (n = 5). Data are mean ± s.d., unpaired two-tailed Student’s t-test.
Roles of Runx family TFs in TFH biology are largely unknown. We first examined the impact of Runx2 disruption on TFH gene regulation (Fig.7d–f and Extended Data Fig.7). We observed significantly greater frequencies of CXCR5+ TFH-like cells among crRunx2+Bcl6f/fPrdm1f/fCreCD4 CD4+ T cells compared to crCd8+ control cells. Expression of ICOS and CD200 was upregulated in the absence of Runx2 (Fig.7e–f). Runx3 disruption also increased the development of CXCR5+ TFH-like cells on the Bcl6f/fPrdm1f/fCreCD4 background, as well as expression of ICOS and CD200 (Fig.7g–h), paralleling the TFH gene regulation observed by Runx2.
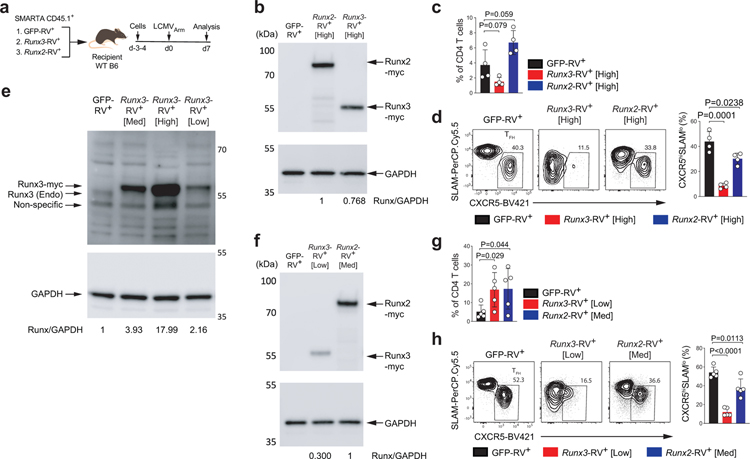
We next investigated whether Runx2 and Runx3 act predominantly upstream or downstream of Bcl-6 in TFH differentiation. The proposed Bcl-6 repressor-of-repressors model predicted that Runx2 and Runx3 would act downstream of Bcl-6. To test this, we transduced wild-type SMARTA cells with RVs expressing GFP alone (GFP-RV+), Runx3 (Runx3-RV+), or Runx2 (Runx2-RV+), transferred the cells into B6 mice, and analyzed TFH differentiation 7 days after acute LCMVArm infection (Extended Data Fig.8a). Enforced Runx2 expression resulted in reduced TFH and GC-TFH differentiation relative to control cells. Expression of ICOS and CD200 was also reduced in Runx2-RV+ TFH cells, consistent with the Runx2 gene disruption data. Constitutive Runx3 expression caused more severe disruption of TFH differentiation than did Runx2 (Fig.7i, Extended Data Fig.8). Most notably, Bcl-6 expression was not affected by enforced Runx2 or Runx3 expression, indicating that Bcl-6 is indeed upstream of Runx2 and Runx3 in TFH cells (Fig.7j). Disruption of Runx2 expression results in a gain of TFH gene expression similar to that of Runx3 gene disruption (Fig.7e–h), indicating that both Runx2 and Runx3 are relevant targets of Bcl-6 in vivo for TFH development.
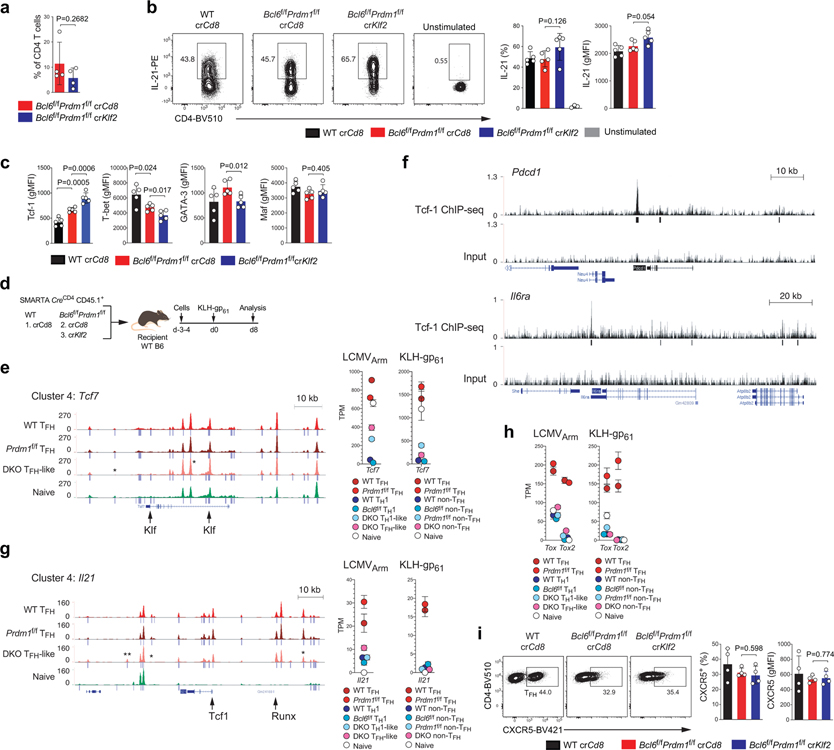
Klf2 has been connected to TFH differentiation in both mice and humans, downstream of ICOS signaling13,14. Klf2 represses CXCR5 expression and Klf2 binds the Prdm1 locus, but different models were proposed for how Klf2 influences TFH differentiation13,14. Thus, we investigated the effect of Klf2 on TFH gene expression using the crRNA RNP SMARTA system to test the model that Klf2 may act downstream of Bcl-6 as a Bcl6-r TF in a repressor-of-repressors circuit (Fig.8 and Extended Data Fig.9a–d). In the Bcl6f/fPrdm1f/fCreCD4 background, expression of PD-1, ICOS, CD200, and IL-6Rα were all significantly upregulated in crKlf2+ CD4+ T cells versus crCd8+ (Fig.8a–c). More surprisingly, expression of the TFH cytokine IL-21 was significantly increased (Fig.8d and Extended Data Fig.9b). Given that result, we examined expression of IL-4, the other major cytokine expressed by TFH cells. IL-4 expression was substantially increased in antigen-stimulated crKlf2+ versus crCd8+ CD4+ T cells in KLH-gp61 immunization (Fig.8e and Extended Data Fig.9d). This occurred even though GATA-3 expression was not changed in the absence of Klf213,14. Disruption of Klf2 did not affect the expression of Maf, a TF known to have a role in Il21 and Il4 expression33,34 (Fig.8f and Extended Data Fig.9c).
Figure 8. Identification of Klf2 as a repressor acting downstream of Bcl-6 regulating major TFH genes.
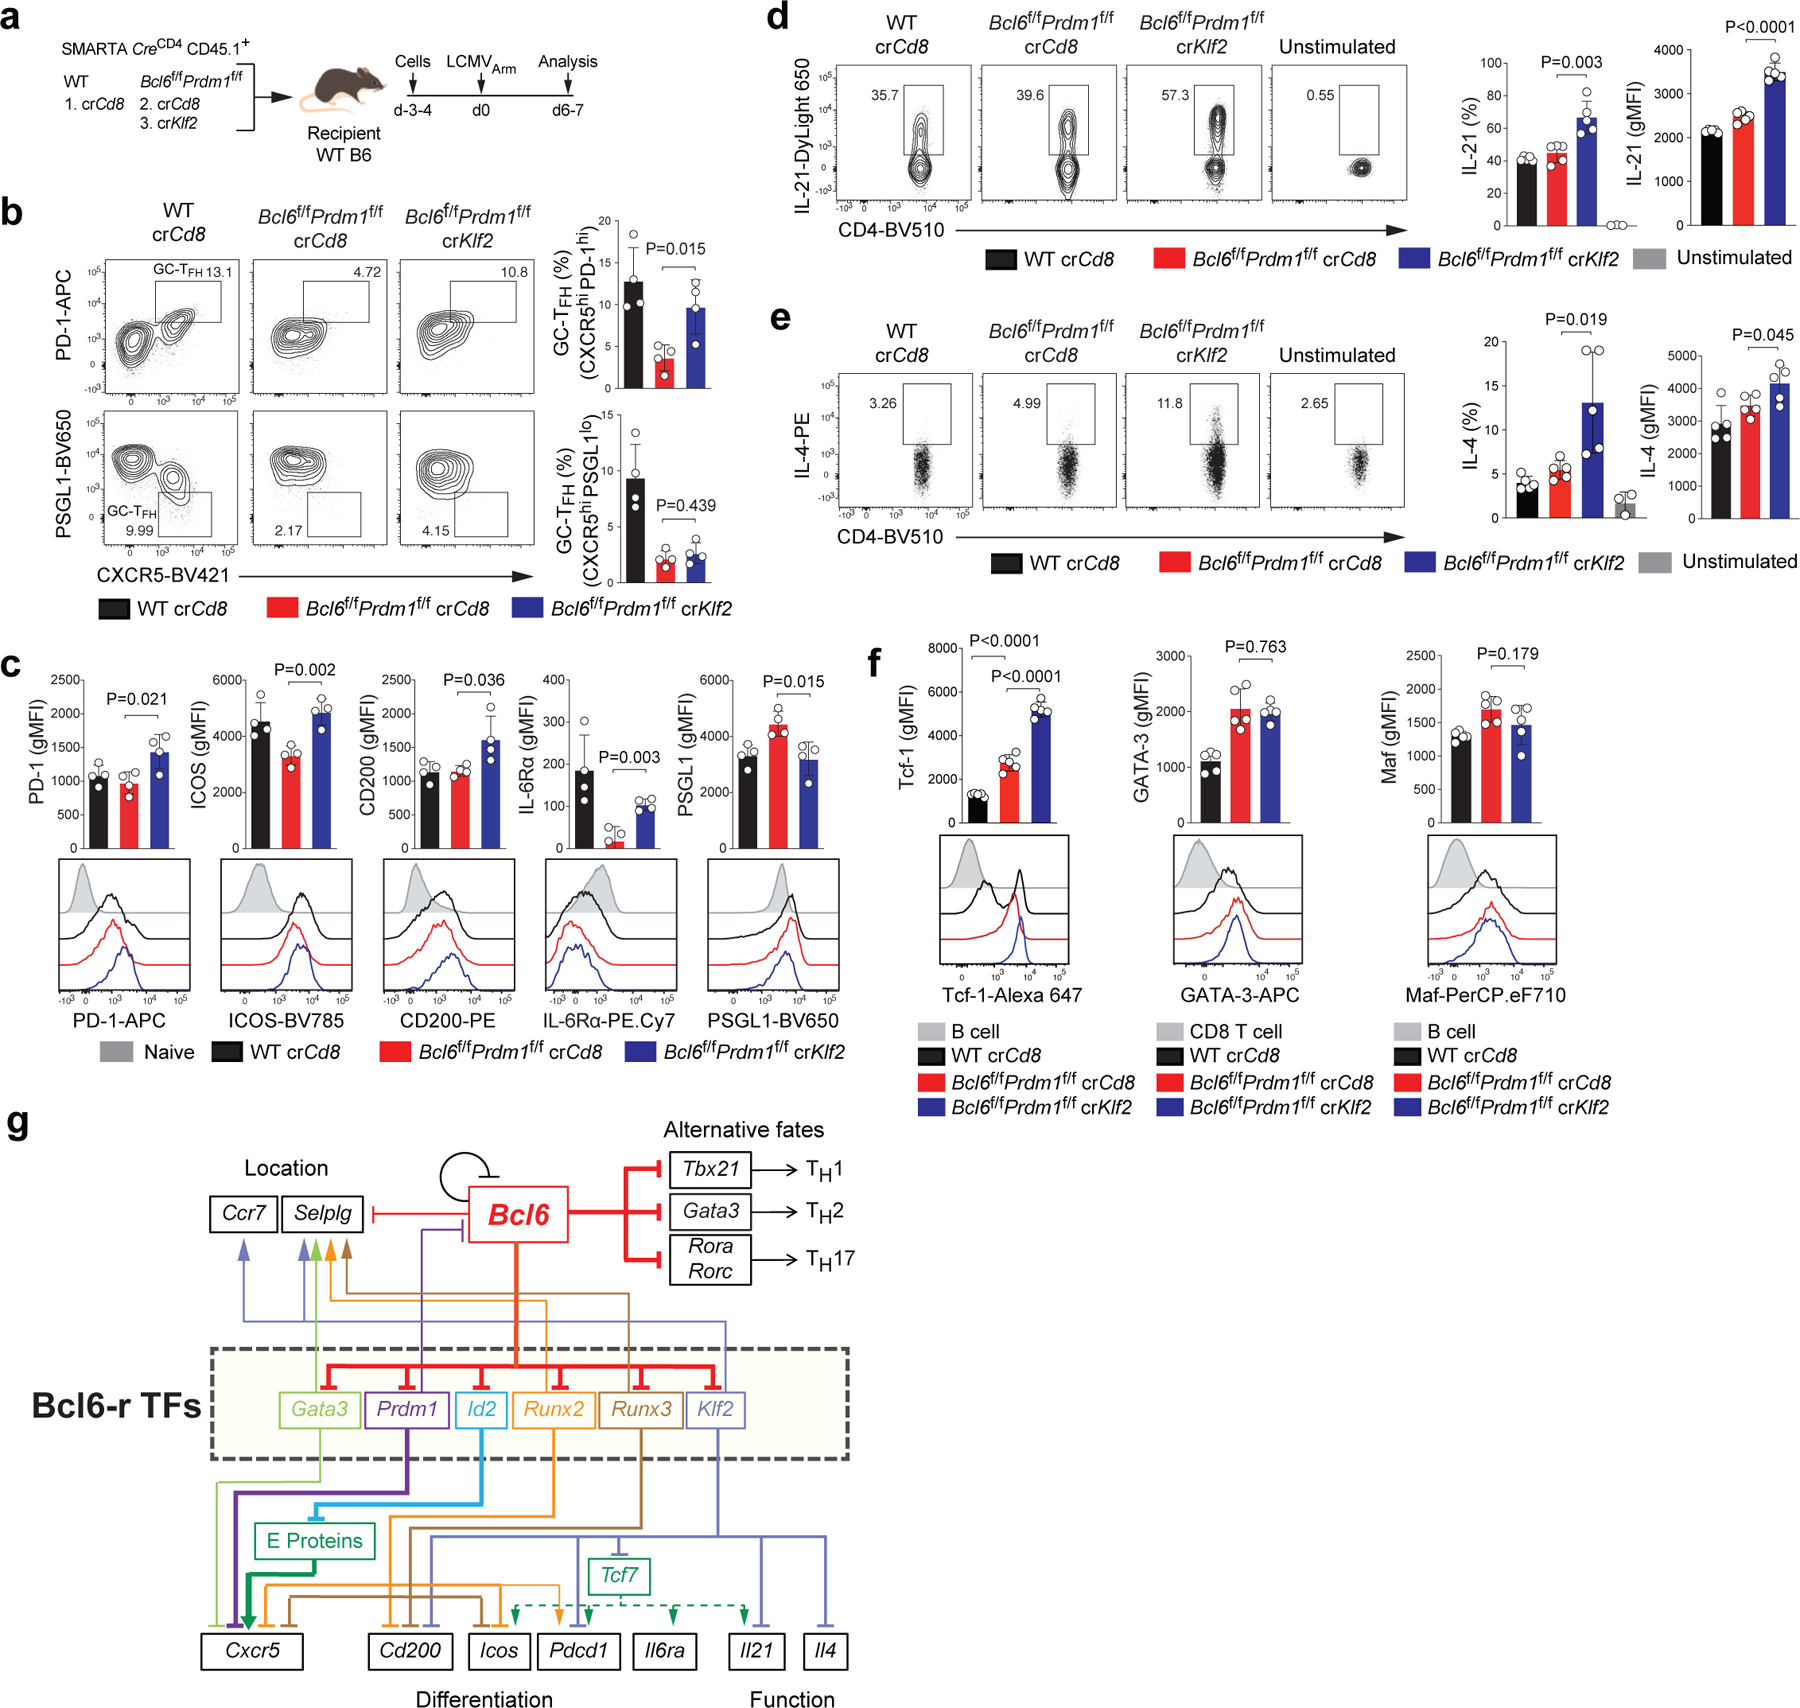
a, Schematic of the CRISPR/Cas9-mediated gene knockdown of SMARTA cell system used for testing Klf2 in LCMVArm infection. wild-type or Bcl6f/fPrdm1f/f CreCD4 SMARTA CD4+ T cells transfected with crCd8 or crKlf2 were transferred to C57BL/6 host mice, followed by infection of the host mice with LCMVArm, and analyzed 6–7 days later. See Fig.8b–c and Extended Data Fig.9a,b.
b, Representative flow cytometry of TFH and GC-TFH cells, gated on SMARTA cells from spleens of LCMVArm infected mice in a. Three independent experiments were performed; each dot represents one mouse (n = 4). Data are mean ± s.d., unpaired two-tailed Student’s t-test.
c, Quantification of GC-TFH core signature markers, gated on SMARTA cells from spleens of LCMVArm infected mice in a. CD44lo naive CD4+ T cells were used as a negative control.
d,e, wild-type or Bcl6f/fPrdm1f/f CreCD4 SMARTA CD4+ T cells transfected with crCd8 or crKlf2 were transferred to C57BL/6 host mice, followed by immunization of the host mice with KLH-gp61 and alum + cGAMP, and analyzed 8 days later. Representative flow cytometry and quantification of gp66-restimulated IL-21+ and IL-4+ SMARTA cells from dLNs of KLH-gp61 immunized mice. Two independent experiments were performed; each dot represents one mouse (n = 5). Data are mean ± s.d., unpaired two-tailed Student’s t-test. See Extended Data Fig.9d for experimental design.
f, Quantification of expression of Tcf-1, GATA-3, and Maf, gated on SMARTA cells from dLNs of KLH-gp61 immunized mice in Extended Data Fig.9d.
g, A circuitry model of the regulation of TFH genes upregulated by Bcl-6 through repression of repressor TFs.
These observations indicated that Klf2 is a negative regulator of the expression of PD-1, ICOS, CD200, IL-6Rα, IL-21, and IL-4. The regulation of IL-6Rα and ICOS by Klf2 was reminiscent of the role of Tcf-1 (the product of Tcf7), but opposite19–21. Multiple Klf motifs were observed in open chromatin regions of the Tcf7 gene locus in TFH cells, suggesting that Tcf7 may be a Klf2-targeted TF (Extended Data Fig.9e). Therefore, we examined Tcf-1 expression in crKlf2+ Bcl6f/fPrdm1f/fCreCD4 SMARTA cells. Expression of Tcf-1 protein was substantially increased in the absence of Klf2 (Fig.8f and Extended Data Fig.9c). In mouse TFH cells, Tcf-1 binding was observed at the promoter and enhancers of multiple GC-TFH signature genes including Pdcd1, Il6ra (Extended Data Fig.9f), Icos and Il21, all of which are upregulated in crKlf2+ Bcl6f/fPrdm1f/fCreCD4 SMARTA cells. These data support a Bcl-6 −| Klf2 −| Tcf7 pathway for upregulation of TFH genes (Fig.8g). Klf and Tcf-1 binding motifs were observed concomitantly in open chromatin of multiple Bcl6-rr genes including Pdcd1, Cd200, and Il21 (Fig.6d and Extended Data Fig.6c,9g), suggesting that Klf2 represses Bcl6-rr genes through a combinatorial mechanism via direct binding and by repression of Tcf7. Taken together, we conclude that Bcl-6 is a nexus for control of positive TFH gene expression by repression of multiple repressors (Fig.8g).
DISCUSSION
TFH differentiation is a multistage, multifactorial process1. How Bcl-6, the lineage defining TF of TFH cells, accomplishes control of TFH differentiation and function has remained unclear, at least in part because of the complexity of the biology, the antagonistic relationship between Bcl-6 and Blimp-1, and intrinsic challenges of studying repressors. The present study advances our mechanistic understanding of how Bcl-6 controls TFH differentiation and function. We resolved several obstacles through a series of logical approaches, integrating analyses of multiple data sources from multiple genotypes and genetically modified cells. Our observations excluded the two simplest models of Bcl-6 regulation of TFH differentiation via repression of Blimp-1 alone or Blimp-1 and Id2. Bioinformatic analyses identified numerous candidate Bcl6-r TFs, and experiments demonstrated that Runx2, Runx3, GATA-3, and Klf2 are Bcl-6 target TFs that regulate TFH differentiation and function. We conclude that Bcl-6 is a nexus for control of positive TFH gene expression by repression of multiple repressors.
Bcl-6 is an obligate repressor in B cells30,35,36. We find that Bcl-6 regulates its own expression by a negative autoregulatory loop in TFH cells. Based on these and other data, we proposed that Bcl-6 drives upregulation of canonical genes of TFH differentiation and function via repressor-of-repressors mechanisms. In addition, Bcl-6 represses alternative, non-TFH, cell fates. Bcl-6 clearly inhibits non-TFH differentiation fates via inhibition of Prdm12,3,9. BCL-6 can also block TH1/TH2/TH17 differentiation by repression of lineage-defining TFs TBX21, GATA3, and RORA4–6,24,37, as well as by repressing genes central to those cells types (e.g. Il17a, Il17f, Ifng, Il2ra, and Ifngr14,5,24). In contrast, testing the repressor-of-repressors model of Bcl-6 function required identification of Bcl6-r TFs that repress positive features of TFH biology, downstream of Bcl-6. Our analytical approach to identify candidate Bcl6-r repressor TFs integrated RNA-seq, ChIP-Seq, and ATAC-seq. Id2 is one Bcl6-r TF clearly important for regulation of Cxcr5. We further identified Runx2, Runx3, GATA-3, and Klf2 as Bcl6-r TFs that repress important TFH genes including PD-1, ICOS, CD200, IL-6Rα, IL-21, and IL-4. These observations demonstrate there are multiple repressors downstream of Bcl-6 that control TFH genes. While the results do not exclude additional TFs, or additional mechanisms of action including potential direct activator activity of Bcl-6 (see Supplementary Note), the overall structure of the repressor-of-repressors Bcl-6 gene regulatory network can explain why TFH differentiation is fully dependent on Bcl-6. In the absence of Bcl-6 no TF appears to substitute.
One might consider whether Bcl-6 acting as an obligate repressor in CD4+ T cells is a rare case for a lineage defining TF. Bcl-6 was, of course, originally identified as the master regulator of BGC differentiation, and it has been well characterized as an obligate repressor in B cells30,35,36, though efforts have predominantly focused on genes downregulated in BGC cells. Foxp3 is a second lineage-defining TF that mainly acts as a repressor38. RORγT appears to act substantially through repressor activity in TH17 cells, in concert with Maf39. The primary actions of T-bet in CD4+ T cells may also be predominantly repressive40. As such, it has been proposed that a general primary function of lineage defining TFs may be to limit, by direct repression or other mechanisms, the number of genes that are induced broadly by TCR and cytokine signaling41. Bcl-6 is a clear example of this direct repression model, but the work here adds to that by demonstrating how genes positively associated with a cell type can be upregulated downstream of a lineage-defining TF via repressor-of-repressor mechanisms. Our results thus establish an overall structure of TFH differentiation and gene regulation in a parsimonious model of Bcl-6 serving as the apex of a repressor-of-repressors network. This may also provide future insights into the biology of dysregulated TFH or TFH-like cells present in a range of biomedically relevant diseases such as atherosclerosis and autoantibody-mediated autoimmune diseases1.
METHODS
Mice.
C57BL/6J (B6) and CreCD4 and CD45.1+ mice were obtained from the Jackson Laboratory. Mouse strains described below were bred and housed in specific pathogen–free conditions in accordance with the Institutional Animal Care and Use Guidelines of the La Jolla Institute. SMARTA mice (T cell antigen receptor (TCR) transgenic for I-Ab-restricted lymphocytic choriomeningitis virus (LCMV) glycoprotein (gp) 66–77 peptide)42, Bcl6f/f43, Prdm1f/f44, and CD45.1+ congenic mice were on a full B6 background. Bcl6f/f or Prdm1f/f mice were crossed to the SMARTA, CreCD4, and CD45.1+ strains to generate Bcl6f/fCreCD4 CD45.1+ SMARTA and Prdm1f/fCreCD4 CD45.1+ SMARTA mice. Bcl6f/fPrdm1f/fCreCD4 CD45.1+ SMARTA mice were generated by crossing Bcl6f/fCreCD4 CD45.1+ SMARTA and Prdm1f/fCreCD4 CD45.1+ SMARTA strains. Blimp-1-YFP45 or ΔBPS1 (described below) mice were crossed to the CD45.1+ SMARTA strain to generate Blimp-1-YFP CD45.1+ SMARTA or ΔBPS1 CD45.1+ SMARTA mice. Both male and female mice (6–15 weeks of age) were used throughout the study, with sex- and age-matched T cell donors and recipients. All animal experiments were performed under protocols approved by the Institutional Animal Use and Care Committees of the La Jolla Institute for Immunology.
Adoptive cell transfer, infection, and immunization.
Adoptive transfer of congenically marked cells (CD45.1+) into recipient mice (CD45.2+) was performed by intravenous injection via the retroorbital sinus. For LCMV Armstrong (LCMVArm) infection, 10 × 103 naïve, transduced RV+, or crRNA+ CD4+ T cells were transferred into each mouse. Recipient mice were injected intraperitoneally with 2.0 × 10⁵ plaque-forming units (pfu) of LCMVArm in plain DMEM. For protein immunization, 50 × 103 naïve or crRNA+ CD4+ T cells were transferred into each mouse. A total of 10 μg of keyhole limpet hemocyanin (KLH) conjugated with LCMV gp61–80 peptide (KLH-gp61) was prepared in alum (Alhydrogel) only, alum + LPS (1 μg), alum + Poly (I:C) (10 μg), or alum + cyclic [G(3′,5′)pA(3′,5′)p] (3′,3′-cGAMP; 10 μg, Invivogen) adjuvants in a total volume of 20 μL and injected into each footpad of recipient mice. Alum + 3′,3′-cGAMP was chosen as the adjuvant combination because alum alone is a poor inducer of Blimp-1 (Extended Data Fig.1a). Transferred cells were allowed to rest in host mice for 1d (naive cells) or 3–4 d (RV+ or crRNA+ cells) before infection or immunization.
Plasmids and retroviral transduction.
pMIG (contains an IRES-GFP), pMIG-Bcl6, pMIG-Runx2myc, pMIG-Runx3myc retroviral (RV) plasmids, and pQCXIP (contains Thy1.1 and pGK-GFP) self-inactivating (SIN) RV plasmid were described previously28,46,47. pMIG-myctagN-Bcl6 plasmid was generated by insertion of sequences encoding the Myc-tag to those encoding the N-terminus of Bcl-6 with short-linker sequences (5′-GATCTGAATTCGGAATCTACC-3′). pQCXIP plasmid was further modified with deletion of the IRES-PuroR cassette and the CCAAT box and the TATA box of 3′-UTR to reduce background reporter expression (pQdT, Extended Data Fig. 2b). Constructs containing either wild-type or an 8-nt deletion that removes the Bcl-6 binding motif (+18; TCTAGGAA) in the proximal Bcl6 promoter region (−709 to +272 from transcription start site) were cloned into the pQdT plasmid at the upstream of the Thy1.1 reporter to generate wild-type Thy1.1-RV or ΔBPS1 Thy1.1-RV, respectively (Fig.2a). Virions were produced by transfection of the Plat-E cell line. Culture supernatants were collected 24 and 48 h after transfection, filtered through a 0.45 μm syringe filter and stored at 4 °C until transduction. CD4+ T cells were isolated from whole splenocytes by negative selection (Stemcell Technologies) and resuspended in R10 (RPMI1640 + 10% FBS, supplemented with 2 mM Glutamax, 100 U/ml Penicillin/Streptomycin, and non-essential amino acids (Gibco)) with 2 ng/ml recombinant human IL-7 (Peprotech) and 50 μM β-mercaptoethanol (2-ME). 0.5 × 10⁶ cells were stimulated in 24-well plates pre-coated with 8 μg/ml anti-CD3 (17A2; BioXcell) and anti-CD28 (37.51; BioXcell). At 40 and 48 h after stimulation, cells were transduced by adding RV supernatants supplemented with 50 μM 2-ME and 8 μg/ml polybrene (Millipore), followed by centrifugation for 90 min at 524 x g at 37 °C. Following each transduction, the RV-containing medium was replaced with R10 + 50 μM 2-ME + 10 ng/ml human IL-2. After 72 h of in vitro stimulation, CD4+ T cells were transferred into six-well plates in R10 + 50 μM 2-ME + 10 ng/ml human IL-2, followed by incubation for 2 days. One day before transfer, the culture medium was replaced with R10 + 50 μM 2-ME + 2 ng/ml human IL-7. Transduced cells were sorted based on GFP expression (FACSAria; BD Biosciences).
Enforced Runx3 (Runx3-RV+ [High]) or Runx2 (Runx2-RV+ [High]) expression disrupted TFH differentiation relative to control cells (GFP-RV+) (Extended Data Fig.8b,d). Since overexpression of Runx3 at much higher than the physiological level resulted in a negative effect on CD4+ T cell accumulation (Extended Data Fig.8b,c), we made methodological improvements by performing similar experiments with lower constitutive Runx3 expression by sorting the bottom 10% GFP+ cells (Runx3-RV+ [Low]) instead of total GFP+ SMARTA (Runx3-RV+ [high]) for adoptive transfer (Extended Data Fig.8e–f). With lower enforced expression of Runx3, SMARTA cell proliferation was enhanced to levels similar to that of Runx2-RV+ [Med] cells (Extended Data Fig.8g). Nevertheless, Runx3-RV+ [Low] SMARTA still showed a stronger impaired TFH and GC-TFH development compared to Runx2-RV+ [Med] SMARTA (Fig. 7i and Extended Data Fig.8h).
Generation of ΔBPS1 mice using CRISPR-Cas9 gene editing.
The in vitro molecular and cellular biology was performed by Ingenious Targeting Laboratory, Inc. Guide RNAs were selected using optimized CRISPR design by CHOP-CHOP (https://chopchop.cbu.uib.no/)48. Guide RNAs (gRNA1, 5′-caccgTCTAGGAAAGGCCGGACACC-3′ and 3′-cAGATCCTTTCCGGCCTGTGGcaaa-5′; gRNA2, 5′-caccgTGGTGATGCAAGAAGTTTCT-3′ and 3′-cACCACTACGTTCTTCAAAGAcaaa-5′) were cloned into px459-Cas9-puromycin plasmid. Lipofectamine transfection of each gRNA with a control gRNA was performed on Neuro2A cells (duplicate set per gRNA). The control gRNA was designed upstream of the gRNA. After 24 h, cells were selected for puromycin resistance for 3–5 days and then lysed. PCR analysis was performed to verify the cleavage efficiency of each gRNA. The cleavage efficiency of gRNA was 10–15%. An injection mix of 30 ng/μl Cas9 protein, 0.6 μM gRNA, and 20 ng/μl oligonucleotide (template DNA for the repair to delete the 8-nt Bcl-6 recognition motif) was injected into 150–250 fertilized eggs from C57BL/6J mice by the UCSD Stem Cell Core. These eggs were implanted into C57BL/6J surrogate mothers, and pups were genotyped by DNA sequencing. DNA sequences were analyzed and diagrammed using MacVector (Extended Data Fig.2e). ΔBPS1 mice were healthy, and immune cell development appeared grossly normal.
CRISPR/Cas9-mediated gene deletion of murine CD4+ T cells.
High-ranked guide sequenes with the highest on-target and off-target scores were selected by CHOP-CHOP. crRNA and ATTO-550 conjugated tracrRNA were purchased from Integrated DNA Technologies, Inc. Purified S. pyogenes Cas9-NLS protein was purchased from QB3 Macrolab of University of California, Berkeley. crRNA and tracrRNA were duplexed by heating 95 °C for 5 min. Ribonucleoprotein (RNP) complexes were generated by mixing crRNA-tracrRNA duplexes (240 pmol) and Cas9-NLS protein (80 pmol) for 10 min at 24–26 °C. Isolated CD4+ T cells were stimulated in 24-well plates pre-coated with 8 μg/ml anti-CD3 (17A2) and anti-CD28 (37.51) for 2 days. The cells were then transfected with a RNP mixture by electroporation using MaxCyte ATX with Expanded T cell-4 protocol (MaxCyte, Inc, MD). The transfected cells were cultured in R10 + 50 μM 2-ME + 10 ng/ml human IL-2 without TCR stimulation for 1 day, followed by culture for an additional day in R10 + 50 μM 2-ME + 2 ng/ml human IL-7. Transfection efficiency and cell viability were measured using LSRII or LSR Fortessa. RNP transfection efficiencies were consistently greater than 90%, with high viability (Extended Data Fig.7a,b). crRNA sequences used in the study: crCd8, 5′-GCAGGTTCAGCGACAGAAAG-3′; crBcl6, 5′-TCAAGATGTCCCGACTCCGG-3′; crPrdm1, 5′-TTGGAACTAATGCCGTACGG-3′, crRunx2, 5′-ACCATGGTGCGGTTGTCGTG-3′; crRunx3, 5′-GCTAAGCGCGCAGGCAACCG-3′; crGata3, 5′- TGTACGAATGGCCGAGGCCC-3′; crKlf2, 5′-CTGGCCGCGAAATGAACCCG-3′.
Wild-type or Bcl6f/fPrdm1f/fCreCD4 SMARTA CD4+ T cells transfected with crCd8, crGata3, crRunx2, crRunx3, or crKlf2 were transferred to C57BL/6 host mice, followed by infection with LCMVArm or immunization with KLH-gp61 of the host mice, and analyzed 6–7 days later. SMARTA cells were sorted by flow cytometry from spleens or lymph nodes of host mice. Gene knockdown efficiencies were measured by mRNA qPCR (for Runx2 using a primer set: fwd, 5′- CACGACAACCGCACCAT-3′ and rev, 5′- CACGGAGCACAGGAAGTT-3′), flow cytometry (for Bcl-6 and GATA-3), or immunoblot analysis (Runx3 and Klf2). shRunx3-RV+ (gene knockdown) SMATRA cells and pMIG-Klf2-RV+ (enforced expression) SMARTA cells were used as positive controls for immunoblot analysis.
Flow cytometry and cell sorting.
Single-cell suspensions of spleens or draining popliteal lymph nodes were prepared by standard gentle mechanical disruption. Surface staining for flow cytometry was done with monoclonal antibodies to CD4 (RM4–5), CD8 (53–6.7), SLAM (TC15–12F12.2), ICOS (C398.4A), CD200 (OX-90), CD138 (281–2) (from BioLegend), B220 (RA3–6B2), CD45.1 (A20), PD-1 (J43), CD44 (IM7) (from eBioscience), PSGL1 (2PH1), Fas (Jo2), IgD (11–26) (from BD Biosciences), PNA (FL-1071) (Vector Laboratories), and Fixable Viability Dye eFluor780 (eBioscience). Staining was performed for 30 min at 4 °C in PBS supplemented with 0.5% bovine serum albumin (BSA), unless specified otherwise. CXCR5 staining was done using biotinylated anti-CXCR5 (SPRCL5; eBioscience) for 30 min, followed by BV421 or PE.Cy7-labeled streptavidin (BioLegend) at 4 °C in PBS supplemented with 0.5% BSA. Intracellular staining for TFs was performed with monoclonal antibodies to Bcl-6 (K112–91, BD Biosciences), Tcf-1 (C63D9, Cell Signaling), T-bet (4B10), GATA-3 (TWAJ), Maf (Sym0F1) (from eBioscience) using the Foxp3/Transcription Factor Staining Buffer Set (eBioscience). For measurement of cytokines, the cells from spleen or lymph node were cultured in vitro for 5 h in 10 μg/ml gp66–77 peptide (gp66) and Brefeldin A. Intracellular staining for cytokines was performed with monoclonal antibody to IL-4 (11B11, eBioscience) and recombinant mouse IL-21 receptor Fc (R&D), followed by anti-human IgG (Invitrogen), using the Fixation/Permeabilization buffer kit (BD Biosciences). Stained cells were analyzed using LSRII, LSRFortessa, or FACS Celesta (BD) and FlowJo software v.10.6 (Flowjo, LLC). For cell sorting, CD45.1+ SMARTA cells were pre-enriched with PE conjugated anti-mouse CD45.1 Ab (eBioscience) and anti-PE microbead (Miltenyi). All sorting was done on a FACSAria or FACSAria Fusion (BD Biosciences). Cellular data were presented as frequencies of cell populations; absolute numbers of cells were also determined. Frequency and absolute number conclusion were equivalent unless stated otherwise. Spleen and LN size were equivalent between samples unless stated otherwise.
ELISA.
Nunc MaxiSorp plates (Thermo Fisher Scientific) were coated overnight at 4 °C with 1 μg/ml KLH-gp61 (Genscript) in PBS. Plates were blocked with PBS + 0.05% Tween-20 + 0.5% BSA for 90 min at 25 °C. After washing, mouse serum was added in a serial dilution in PBS + 0.05% Tween-20 + 0.5% BSA (PBST-B) and incubated for 90 min. After washing, horseradish peroxidase (HRP)-conjugated goat anti-mouse IgG (Thermofisher Scientific) was added at 1:5,000 in PBST-B for 90 min at 25 °C. Colorimetric detection was performed using a TMB substrate kit (Thermofisher Scientific). Color development was stopped after approximately 5–10 min with 2 N H2SO4, and absorbance was measured at 450 nm.
Immunofluorescence staining of lymph node.
Popliteal lymph nodes from mice immunized with KLH-gp61 were snap frozen in OCT medium (Sakura Finetek, USA), and 5–8 μm sections were prepared using a cryostat. Lymph node sections were fixed with acetone-methanol, and stained with antibodies to TCRβ (BV421), IgD (AlexaFlour488), GL7 (PE), and CD45.1 (AlexaFlour647) to reveal the T cell zone, B cell zone, GCs, and SMARTA cells, respectively. Sections were fixed and mounted with ProLong gold antifade reagent (Invitrogen), and imaged by Zeiss AxioScan Z1 Slide Scanner. SMARTA cell localization was analyzed by ImageJ software (v2.0.0-rc-69/1.52p, NIH). The T-B border was defined as ±15 μm region at a boundary line between T cell zone and B cell zone (Extended Data Fig.1h).
RNA-seq.
RNA-seq was performed with a method previously described49. Spleens or LNs were isolated and pooled from 4–8 mice per group. 25,000–100,000 CXCR5+SLAMlo/int TFH, CXCR5loSLAMhi TH1 SMARTA cells (CD45.1+CD4+CD8–B220– singlets), or naïve SMARTA cells (CD4+CD8–B220–CD44loCD62Lhi) were sorted using a FACSAria into Trizol LS (Invitrogen). RNA extraction was performed using miRNeasy micro kits (Qiagen) for downstream RNA-Smart-Seq2 input requirements49. cDNA was purified using AMPureXP beads (1:1 ratio; Beckman Coulter). One nanogram cDNA was used to prepare a standard Nextera XT sequencing library (Nextera XT DNA sample preparation and index kits; Illumina). Quality control steps were included to determine total RNA quality and quantity, the optimal number of PCR preamplification cycles, and fragment size selection. All samples passed the quality control. Libraries were sequenced using a HiSeq2500 to generate 50-bp single-end reads (TruSeq Rapid Kit; Illumina), generating median of >13 million (LCMVArm infection) or >7 million (KLH-gp61 immunization) mapped reads per sample. Three (LCMVArm infection) or 4 (KLH-gp61 immunization) biological replicates were generated.
RNA-seq analysis.
The single-end reads that passed Illumina filters were subsequently filtered for reads aligning to tRNA, rRNA, adapter sequences, and spike-in controls. The reads were aligned with the mm10 reference genome using TopHat (v1.4.1., library-type fr-secondstrand-C) and the RefSeq gene annotation downloaded from the University of California – Santa Cruz Genome Bioinformatics site. DUST scores were calculated with PRINSEQ Lite (v0.20.3) and low-complexity reads (DUST > 4) were removed from the BAM files. The alignment results were parsed via the SAMtools to generate SAM files. Read counts to each genomic feature were obtained with the HTSeq-count program (v0.7.1; -m union -s yes -t exon -i gene_id). After removing absent features (zero counts in all samples), the raw counts were imported to R/Bioconductor package DESeq2 (v3.1). P-values for differential expression were calculated using the Wald test and then adjusted for multiple test correction using Benjamini-Hochberg algorithm50. We considered genes differentially expressed between two groups of samples when the DESeq2 analysis resulted in an adjusted P-value of <0.05 and the difference in gene expression was 1.4-fold. Genes with raw counts less than 6 as minimum cutoff (an average raw count of Cd8a in all samples; Cd8a is considered to be not expressed, or very weakly expressed in peripheral, splenic CD4+ T cells.) were excluded from differential expression analysis. TPMs were calculated from raw count data by dividing by the number of counts by exon length in kilobases (RPK), dividing the total number of counts by 1 million (CM) and then dividing the RPK by CM. Principal Component Analysis (PCA) was performed using the ‘prcomp’ function in R.
We firstly assessed expression of a broad curated set19,22,25 of TFH-associated genes across all samples from RNA-seq gene expression profiling. Sequential clustering analyses were performed to analyze the patterns of gene expression changes between the six different TFH and TH1 populations. K-means analyses were firstly performed using K=10 for overall gene expression change patterns by ExpressCluster v1.3 software from CBDM Laboratory in Harvard School of Medicine (https://cbdm.hms.harvard.edu/). Total DEG genes (Fc > 1.4; adj. P-val < 0.05; pre-filtered with minimum cutoff) were subjected to the K-means clustering. Four major clusters (n= ~300 or more genes) of gene expression change were apparent. To obtain gene lists associated with those 4 major cluster patterns of gene expression, Maximum a-posteriori Dirichlet process mixtures (MAP-DP) clustering was then performed with predefined cluster centers according to the result from K-means analysis by R-ClustMAPDP51. We chose MAP-DP instead of K-means clustering because MAP-DP analysis efficiently separates outliers from the data and is statistically rigorous51. We used the following criteria for the 4 major clusters: (1) wild-type TFH and Prdm1f/f TFH have lower expression than the other populations; (2) wild-type TH1 and Bcl6f/f TH1 have higher expression than the other populations; (3) wild-type TH1 and Bcl6f/f TH1 have lower expression than the other populations; (4) wild-type TFH and Prdm1f/f TFH have higher expression than the other populations (Fig. 3d). Total DEG genes (Fc > 1.4; adj. P-val < 0.05; pre-filtered with minimum cutoff) were subjected to the MAP-DP analysis, as was done for the K-means clustering.
Hierarchical clustering analysis was performed with the genes upregulated or downregulated in TFH cells relative to their expression in TH1 cells (Fig. 3c; 1.4-fold cut off, Adj. P-val <0.05) using hclust function from stats package in R and the heatmap was generated using heatmap.2 function from gplots package in R.
Gene Set Enrichment Analysis (GSEA) was run on gene lists pre-ranked by DESeq log P-value multiplied by the sign of the log-fold change52 with GSEA v3.0 (Broad Institute, Inc.).
Bcl-6–bound, Blimp-1–bound, and TFH, TH1, TH2, TH17, and TREG signature gene lists were collected from previous studies19,22,24,25,53,54 and from Ingenuity Pathway Analysis database (Qiagen). E2A target-gene list was generated by Shaw et al.22 using ChIP-seq results from thymocytes by E2A Bio-ChIP method in previously described55. In multiple GSEA (Fig.3f), the nominal P-values were corrected with Benjamini-Hochberg algorithm.
ATAC-seq.
ATAC-seq was performed with a modified method from previously described56. Spleens were isolated and pooled from 3–5 mice per group. 5 × 10⁴ CXCR5+SLAMlo/int TFH, CXCR5loSLAMhi TH1 SMARTA cells (CD45.1+CD4+CD8–B220– singlets), or naive SMARTA cells (CD4+CD8–B220–CD44loCD62Lhi) were sorted using a FACSAria. Cells were pelleted and resuspended in 25 μl lysis buffer, and spun down. The nuclear pellet was resuspended into 25 μl transposition reaction mixture containing Tn5 transposase from Nextera DNA Sample Prep Kit (Illumina) and incubated at 37 °C for 30 min. Then the transposase-associated DNA was purified using MinElute Purification kit (Qiagen). To amplify the library, the DNA was amplified for twelve cycles using KAPA Real-Time Library amplification kit (KAPAbiosystems) with Nextera indexing primers. The total amplified DNA was purified using AmPureXP beads. The quantity and size of amplified DNA was examined by TapeStation to confirm that independent samples exhibited similar fragment distributions. The libraries were sequenced using Hiseq4000 with paired-end sequencing (Illumina). Replicates were generated from 3 independent experiments.
ATAC-seq analysis.
Fastq reads were aligned with the mm10 reference genome with Bowtie2 (-p 15 -m 1 -best -strata -X 2000 -S –fr –chunkmbs 1024). PCR duplicates were removed by SAMtools. Peaks were called with MACS2 (macs2 callpeak –t inputfile –f BED –g mm –n outputfile –nomodel −1 0.01 –keep-dup all –call-sumits -B). Bigwig files for ATAC-seq signal visualization on UCSC genome browser was generated by converting MACS2 output read pileup file into bigwig files with bedgraphtobigwig from UCSC tools. Peaks from all samples were merged to create a common reference peak set using Homer (mergePeaks -d 200). Peaks localized within 100 kb upstream of the transcription start site (TSS) and 100 kb downstream of the transcription end site (TES) were annotated to a gene46. hTseq-count was used to calculate Tn5 insertion site number in peaks57. Scikit-learn was used for t-SNE analysis of Tn5 count matrix to visualize sample similarity58. For differential analysis, DEseq2 was used to compare Tn5 insertion site numbers in peaks for each condition after filtering out low read peaks (count number <5 in all samples in comparison). The relative open / close regions were defined by using DEseq2 to compare the Tn5 insertion site number within ATAC-seq peaks among samples (DEseq2 raw P-val < 0.05). Motif enrichment was performed by Homer (findMotifsGenome.pl -size given -mis 3 -mask), with combination of Homer curated known motif set, motifs from MEME motif database, and JASPAR database. Frequencies of the enriched TF motifs were determined in regions of increased or decreased accessibility (DEseq2 raw P-val < 0.05). Significance for the differences of TF motif enrichment across comparisons was determined by Chi-squared tests. Family of transcription factors were characterized with information from tFclass database59. Transcription factor footprint analyses were performed with RGT-hint60 using JASPAR database. JASPAR motifs are described by a position weight matrix (PWM) providing information on the frequency of usage of each nucleotide in the motifs derived from experimental data, such as ChIP-seq61. Although two related TFs (e.g., Runx2 and Runx3) can bind the identical consensus sequences, use of the PWMs in JASPAR allows for non-identical assignments if the data support differential PWMs. PageRank analysis was performed with Taiji as previously described method56, as a separate bioinformatic algorithm based on differential gene expression and TF binding motifs, with compatible results with differential ATAC-seq analysis (Extended Data Fig.6f), although the nature of the PageRank algorithm is more effective for identifying activator TFs instead of repressors.
ChIP-seq analysis.
Raw sequencing reads for Blimp-1 (GSE75724, GSE79339)53,54, Tcf-1 (GSE103387)62, and BCL-6 and NCOR (GSE29282)35 were downloaded from the SRA database. Reads were aligned to UCSC mm9 (Blimp-1), mm10 (Tcf-1), or hg19 (BCL-6 and NCOR) with Bowtie (v1.1.2) using options (-S–-fr -p 3 -m 1 -k 1–-best –strata) and peaks were called using MACS with default settings. The UCSC tracks and peak calls of BCL-6 ChIP-seq data of human tonsillar GC-TFH (GSE59933) were from the data of the original paper24. Peaks were annotated based on the RefSeq database. Peaks localized ±2 kb of the TSS were defined as promoter peaks, peaks localized ±2 kb of the TES were defined as 3′ end peaks, and peaks >2 kb away from genes were defined as intergenic24. Syntenic analysis of human Bcl-6-binding sites in the mouse genome was performed using the Liftover tool of UCSC Browser with default settings (https://genome.ucsc.edu/cgi-bin/hgLiftOver). The human BCL-6 binding peaks firstly converted from hg18 to mm9, and then converted from mm9 to mm10 (7,673 peaks were successfully converted to mouse genome from the original human 8,523 peaks). Bcl-6-binding in mouse genome was evaluated by ChIP-qPCR for some genes of interest.
ChIP-qPCR.
To validate whether Bcl-6 binding in human GC-TFH cell is conserved in mouse TFH cell, Bcl-6 ChIP-qPCR of mouse TFH cells was performed using tagged-Bcl6 RV transduction. We confirmed that Bcl-6 protein from pMIG-Bcl6 (Bcl6-RV) was expressed at levels similar to that of endogenous Bcl-6 in TFH cells (Extended Data Fig.5e). We then validated that an N-terminal Myc-tagged Bcl-6 fusion protein (myctagN-Bcl6-RV) was functionally comparable with non-tagged Bcl6-RV (Bcl6-RV), based on tag-Bcl6-RV rescue of TFH differentiation and function of Bcl6f/fCreCD4 CD4+ T cells in LCMV infected mice (Extended Data Fig.5e,f). To perform myctagN-Bcl6 ChIP-qPCR, Bcl6f/fCreCD4 SMARTA cells transduced with myctagN-Bcl6-RV were transferred to C57BL/6 mice, followed by infection of the host mice with LCMVArm. Seven days later, spleens were isolated and pooled from 30 mice, and pre-enriched CD45.1+GFP+ SMARTA cells were further sorted to obtain CXCR5+SLAMlo TFH cells. 9 × 10⁶ TFH cells were fixed in 1% formaldehyde for 2.5 min and then quenched with 125 mM glycine for 5 min. Cells were lysed using truChIP Chromatin Shearing Kit and sonicated to generate < 500-bp fragments using E220 Focused-ultrasonicator (Covaris). Fragmented DNA was used as input control. Magnetic Dynabeads (45 μL) were washed with IP buffer (50 mM NaCl, 5 mM EDTA, 50 mM Tris pH8.0, and 0.1% NP-40) and then mixed with 7.5 μg anti-Myc tag or goat IgG (Abcam) antibodies in 300 μl IP buffer and rotated for 6 h at 4 °C. The sonicated lysates were diluted in IP buffer at 1:4 ratio and precleared with Dynabeads for 2 h at 4 °C. The precleared lysates were added to antibody-conjugated Dynabeads and incubated overnight at 4 °C. The beads were washed with IP buffer once, Wash Buffer I (150 mM NaCl, 0.5% sodium deoxycholate, 1% NP-40, 0.1% SDS, 1 mM EDTA, and 50 mM Tris pH8.0) twice, Wash Buffer II (500 mM NaCl, 0.5% sodium deoxycholate, 1% NP-40, 0.1% SDS, 1 mM EDTA, and 50 mM Tris pH8.0) twice, Wash Buffer III (250 mM LiCl, 0.5% sodium deoxycholate, 1% NP-40, 0.1% SDS, 1 mM EDTA, and 50 mM Tris pH8.0) twice, and TE buffer twice for 5 min each. The beads were resuspended in 200 μl Elution Buffer (100 mM NaHCO3 and 1% SDS) and reverse-crosslinked at 65 °C for 30 min and then treated with rNase A for 30 min at 37 °C and Proteinase K at 65 °C for overnight. DNA was purified using AMPureXP beads, and eluted in nuclease-free water. The eluted DNA were further diluted in water and subjected to perform qPCR using primers: Selplg E1 F, 5′-CGCACAAACACACACAACTC-3′; Selplg E1 R, 5′-TCAGACCCTCCAAACTACCT-3′; Runx2 E1 F, 5′-AGATCGCTCACTCGACTCAT-3′; Runx2 E1 R, 5′-CTTCTTCTACTTCCGCCACAC-3′; Runx2 E2 F, 5′-TCCTTGTCTCTTGCTCTCTTTC-3’; Runx2 E2 R, 5′- ACAGGTAGTGGCATAGAGGA-3’; Runx2 E3 F, 5’- GCTGTGTGT TCTTGCTCTTCT-3′; Runx2 E3 R, 5′-CTAATGAGATGCTGTCGCTGAA-3’; Runx3 E1 F, 5′- GAGAGCCTTTGAGGTCTCTTTG-3′; Runx3 E1 R, 5′- CTCAACAGTGCACACCTTCT-3′; Klf2 P1 F, 5′-AGCAAGGTACCAGGCTACA-3′; Klf2 P1 R, 5′- TCCCACAGCCTGAAGTCTAA-3’; Klf2 DE F, 5′-CTATCTCAGGCAACCCAATCA-3′; Klf2 DE R, 5′-ACCGCTGAAGTTTCTAGGTAAA-3′; Neg F 5′-GCCGCTCTATCATCCGAAAT-3′; Neg R 5′-CCAGCTGCAAGATTAACACAAC-3′. Negative control region was arbitrary selected approximately 40 kb upstream of Sleplg E1 site (Fig.5e).
Immunoblot Analysis.
Equivalent cell numbers were lysed in 2X Laemmli sample buffer and boiled for 10 min. The proteins were resolved by NuPAGE 4–12% Bis-Tris gels and transferred onto PVDF membrane in NuPAGE transfer buffer (Invitrogen). Membranes were incubated with primary antibodies: anti-Myc tag (Cell Signaling), anti-Klf2 (EMD Millipore), anti-Runx3 (HRP-conjugated, Santa Cruz Biotechnology), and anti-GAPDH (Santa Cruz Biotechnology). After incubation with HRP-conjugated secondary antibody, target proteins were detected by ECL prime detection kit (GE healthcare) and OdysseyFc Imaging System (LI-COR). The band densities were quantified by ImageStudio Lite software (v.5.2.5; LI-COR).
Statistical analysis.
All RNA-seq and ATAC-seq were performed independently in 3–4 replicates. All graphs represent mean and standard deviations (SD) unless otherwise noted (Prism 8.0, GraphPad). Comparison between two groups was determined by unpaired or paired Student’s t-test with a 95% confidence interval. Statistical details of each experiment can be found in the figure legends and specific methods.
Extended Data
Extended Data Fig. 1. TFH differentiation is not the default pathway.
Related to Fig. 1.
a, Schematic diagram of a mutually antagonistic relationship of Bcl-6 and Blimp-1. UCSC browser tracks from BCL-6 ChIP-seq and Blimp-1 ChIP-seq were indicated below.
b, A null hypothesis of a default TFH differentiation pathway model.
c, SMARTA CD4 T cells were transferred to C57BL/6 host mice, followed by immunization of the host mice with KLH-gp61 in alum only, alum + LPS, alum + Poly(I:C), or alum + cGAMP adjuvants, and analyzed 7 days later. Representative flow cytometry of TFH and non-TFH SMARTA cell subsets from draining LNs (dLNs) of KLH-gp61 immunized mice. Two independent experiments were performed; each dot represents one mouse (n = 4). Data are mean ± s.d., unpaired two-tailed Student’s t-test.
d, Quantification of results from Fig.1b.
e, Schematic of the SMARTA cell transfer system used for LCMVArm infection. WT, Bcl6f/f, Prdm1f/f, and Bcl6f/fPrdm1f/f CreCD4 SMARTA CD4+ T cells were transferred to C57BL/6 host mice, followed by infection of the host mice with LCMVArm, and analyzed 7 days later.
f, Representative flow cytometry of GC-TFH, TFH and non-TFH SMARTA cell subsets from spleens of LCMVArm infected mice in Extended Data Fig.1c. Three independent experiments were performed; each dot represents one mouse (n = 4). Data are mean ± s.d., unpaired two-tailed Student’s t-test.
g, Quantification of results from Extended Data Fig.1f.
h, Representative histology section to define GC, B cell zone, T cell zone, and T-B border. T-B border was defined as ±15 μm region at a boundary line of T cell zone and B cell zone. Scale bar, 200 μm. Related to Fig.1g.
i, Histology of draining LNs at d8 after KLH-gp61 immunization in Fig. 1d. Blue, TCRβ; red, GL7; green, IgD; white, CD45.1 SMARTA. SMARTA cells were presented with large dots for clarity. Scale bar, 200 μm. Related to Fig.1g.
Extended Data Fig. 2. Bcl-6 exhibits direct negative autoregulatory feedback.
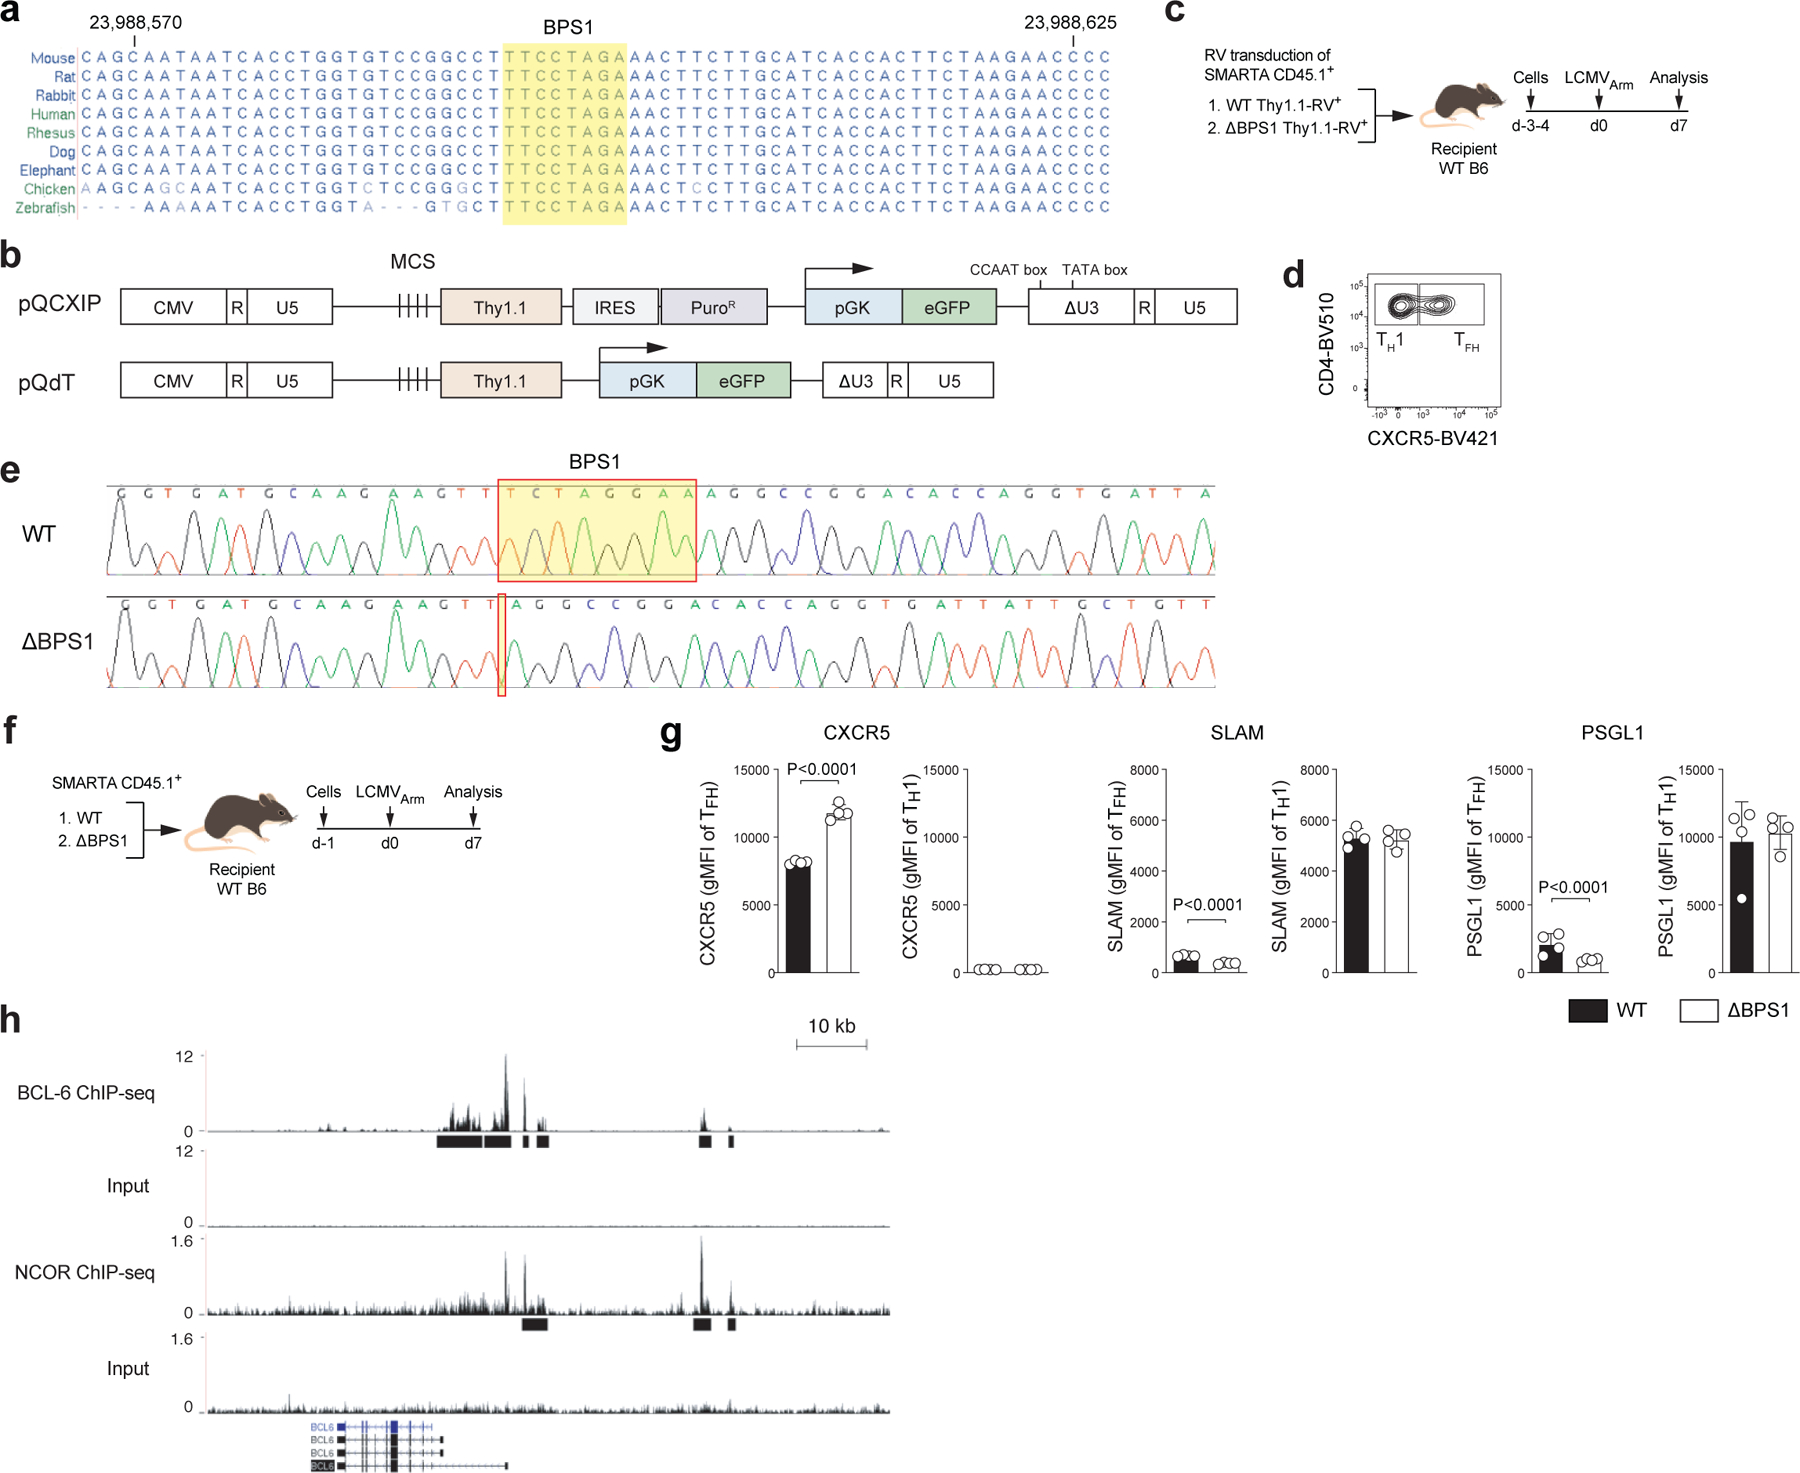
Related to Fig. 2.
a, Sequence homology at BPS1 locus between various species. The numbers indicate region of mouse chromosome 19 (mm10).
b, Schematic diagram of self-inactivating (SIN) vectors. pQdT SIN vector were generated from original pQCXIP SIN vector by removing IRES-PuroR cassette and additional deletion of CCAAT box and TATA box.
c, Schematic of the RV+ SMARTA cell transfer system used for LCMVArm infection. SMARTA CD4 T cells transduced with WT Thy1.1-RV or ΔBPS1 Thy1.1-RV were adoptively transferred to C57BL/6 host mice, followed by infection of the host mice with LCMVArm, and analyzed 7 days after infection. Related to Fig.2a–b and Extended Data Fig.2d–e.
d, TFH and TH1 gates used for Fig.2b and Extended Data Fig.2e.
e, Chromatogram of DNA sequencing from WT or ΔBPS1 mouse.
f, Schematic of the SMARTA cell transfer system used for LCMVArm infection. WT or ΔBPS1 SMARTA CD4 T cells were transferred to C57BL/6 host mice, followed by infection of the host mice with LCMVArm, and analyzed 7 days after infection. Related to Fig. 2c–d.
g, Quantification of expression of CXCR5, SLAM, and PSGL1 in Fig.2d, gated on CXCR5hiSLAMlo TFH or CXCR5loSLAMhi TH1 cells. Two independent experiments were performed; each dot represents one mouse (n = 4). Data are mean ± s.d., unpaired two-tailed Student’s t-test.
h, Genome-browser tracks depict BCL-6 or NCOR ChIP-Seq peaks at BCL6 locus from OCI-LY1 cell line. Peak calls indicated below each track.
Extended Data Fig. 3. RNA-seq of TFH and non-TFH populations from multiple genetic backgrounds.
Related to Fig. 3
a, Schematic of the SMARTA cell transfer system used for RNA-seq analysis in KLH-gp61 immunization. Non-TFH (CXCR5loPSGL1hi) populations from WT, Bcl6f/f CreCd4, Prdm1f/f CreCD4, or Bcl6f/fPrdm1f/f CreCd4 SMARTA cells and TFH (CXCR5hiPSGL1lo) populations from WT or Prdm1f/f CreCD4 SMARTA cells were sorted from C57BL/6 host mice given WT, Bcl6f/f, Prdm1f/f, or Bcl6f/fPrdm1f/f CreCD4 SMARTA CD4 T cells, followed by infection of the host mice with KLH-gp61 in alum + cGAMP, and analyzed 8 days later. Naive SMARTA cells were isolated as CD44loCD62LhiCD45.1+ from uninfected mice. Representative flow cytometry of TFH and TH1 subsets from four independent experiments.
b, Heatmap of gene expression of curated TFH-associated genes. Scale, row z-score. DKO, Bcl6f/fPrdm1f/f CreCD4. As a first analysis the effect of Bcl6/Prdm1 double-deficiency on the TFH biology, we assessed expression of a broad curated set of TFH-associated genes across all samples from RNA-seq gene expression profiling. Bcl6f/fPrdm1f/fCreCD4 TFH-like cells lost expression of positively TFH-associated genes in comparison to WT TFH cells or Prdm1f/fCreCD4 TFH cells. Conversely, Bcl6f/fPrdm1f/fCreCD4 TH1-like cells had a gene expression profile different from WT TH1 or Bcl6f/fCreCD4 TH1 cells.
c, Principal component analysis of differential gene expression from RNA-seq of LCMVArm infection. Principal component analysis provided similar findings as (b), supporting the overall hypothesis that TFH is not a default differentiation pathway of CD4+ T cells and Bcl-6 has important activities beyond inhibition of Prdm1.
d, Gene expression changes were clustered by K-means clustering analysis (K=10) of LCMVArm infection.
e, Hierarchical clustering analysis of genes upregulated or downregulated in TFH cells relative to their expression in TH1 cells (1.4-fold cut off, Adj. P <0.05) of LCMVArm infection shown in Fig.3c. Scale, row z-score.
f, GSEA of BCL-6 bound genes from human tonsillar GC-TFH compared to Cluster 2 genes (left) or Cluster 3 genes (right) differentially expressed between Bcl6f/fPrdm1f/f TFH-like cells and Prdm1f/f TFH cells. NES, normalized enrichment score; FDR, false discovery rate.
g, GSEA of Blimp-1 bound genes from CD8 and TH17 cells in comparison of Cluster 2 and Cluster 3 genes differentially expressed between Bcl6f/fPrdm1f/f TH1-like cells and Bcl6f/f TH1 cells.
Extended Data Fig. 4. Bcl-6 drives CXCR5 expression via repression of Id2-E2A pathway.
Related to Fig. 4
a, Quantification of GC-TFH core signature markers in SMARTA cells from dLNs of KLH-gp61 immunized mice in Fig. 4d.
b, Schematic of the SMARTA cell transfer system used for LCMVArm infection. WT, Bcl6f/fPrdm1f/f, or Bcl6f/fPrdm1f/fId2f/f CreCD4 SMARTA CD4 T were transferred to C57BL/6 host mice, followed by infection of the host mice with LCMVArm, and analyzed 7 days later. Related to Fig 4g and Extended Data Fig. 4c–g.
c,e, Representative flow cytometry of TFH and GC-TFH SMARTA cell subsets from spleen of LCMVArm infected mice. Two independent experiments performed; each dot represents one mouse (n = 4). Data are mean ± s.d., unpaired two-tailed Student’s t-test.
d, Quantification of expression of CXCR5 in Extended Data Fig. 4c, gated on SMARTA cells.
f, Quantification of frequency of CXCR5hiPD1hi GC-TFH cells in Extended Data Fig.4e, gated on SMARTA cells.
g, Quantification of GC-TFH core signature markers in Extended Data Fig.4e, gated on SMARTA cells.
Extended Data Fig. 5. ATAC-seq of TFH and non-TFH populations from multiple genetic backgrounds.
Related to Fig. 5
a, Representative flow cytometry of naive SMARTA cells (CD44loCD62LhiCD45.1+) used for ATAC-seq analysis.
b, Genome-browser tracks depict ATAC-seq chromatin accessibility at Cxcr5 locus. Peak calls indicated below each track. * indicates DEseq2 raw p ≤ 0.05 in comparison between WT TFH and TH1.
c, Genome-browser tracks depict ATAC-seq chromatin accessibility at Tbx21 and Gata3 loci.
Peak calls indicated below each track. Bcl-6 liftover peaks from human to mouse reference genome are indicated. * and ** indicate DEseq2 raw p-val 0.05 and 0.01, respectively, in comparison between WT TFH and TH1. Gene expressions from RNA-seq data of LCMVArm infected mice are graphed. DKO, Bcl6f/fPrdm1f/f CreCD4.
d, Genome-browser tracks depict BCL-6 ChIP-Seq peaks at SELPLG locus. Peak calls indicated below the track.
e, Representative flow cytometry and quantification of the level of Bcl-6 in RV+ TFH or non-TFH SMARTA cell subsets from spleen of LCMVArm infected mice. SMARTA CD4 T cells transduced with GFP-RV or Bcl6-RV were transferred to C57BL/6 host mice, followed by infection of the host mice with LCMVArm, and analyzed 3 days after infection. Non-TFH: GFP-RV+ and TFH: GFP-RV+ indicate the expression level of endogenous Bcl-6 in each population. Each dot represents one mouse (n = 4). Data are mean s.d., unpaired two-tailed Student’s t-test.
f, Representative flow cytometry and quantification of GC-TFH and BGC subpopulations from spleen of LCMVArm infected mice. Bcl6f/f CreCD4 SMARTA CD4 T cells transduced with Bcl6-RV or myctagN-Bcl6-RV were transferred to Bcl6f/f CreCD4 host mice, followed by infection of the host mice with LCMVArm, and analyzed 8 days after infection. We validated that an myctagN-Bcl6-RV was functionally comparable with non-tagged Bcl6-RV (Bcl6-RV), based on myctagN-Bcl6-RV rescue of TFH differentiation and B cell help function of Bcl6f/f CreCD4 CD4 T cells in LCMV infected mice. Each dot represents one mouse (n = 4). Data are mean s.d.
Extended Data Fig. 6. Identification of candidate TFs.
Related to Fig. 6
a, Heatmap plots representing the frequencies of the most enriched TF motifs in regions in decreased accessibility (relatively less open in first group than second group, DEseq2 raw p-val < 0.05). Scale, motif frequencies (%). Related to Fig.6b.
b, Motif analysis of the center of TF footprint (green bar) in Fig.6c and Extended Data Fig.6e from ATAC-seq reads.
c, Genome-browser tracks depict ATAC-seq chromatin accessibility and TF occupancy at Icos and Cd200 loci. Peak calls indicated below each track. ** indicates DEseq2 raw p-val ≤ 0.01 in comparison between Bcl6f/fPrdm1f/f CreCD4 TFH-like and Prdm1f/f CreCD4 TFH.
d, Gene expression of Klf genes from RNA-seq data of LCMVArm infected mice or KLH-gp61 immunized mice.
e, TF footprints derived from ATAC-seq reads over representative TF motifs within accessible ATAC-seq regions.
f, Heatmap plots of relative PageRank scores. Scale, row z-score.
Extended Data Fig. 7. CRISPR/Cas9-mediated gene knockdown of SMARTA cells.
Related to Fig. 7
a, Schematic of the CRISPR/Cas9-mediated gene knockdown of SMARTA cell system. Details are in the Method section.
b, Representative flow cytometry of RNP transfection from more than four independent experiment; each dot represents one RNP+ group (n = 9). Data are mean ± s.d. Quantification of cell viability and transfection efficiency of RNP+ and RNP− (electroporation without RNP) SMARTA cells.
c, Frequency of crRNA+ CD45.1+ SMARTA cells among total CD4 T cells from spleen of LCMVArm infected mice in Fig.7a. Two independent experiments were performed; each dot represents one crRNA+ group (n = 4). Data are mean ± s.d., unpaired two-tailed Student’s t-test.
d,e,f,g, WT or Bcl6f/fPrdm1f/f CreCD4 SMARTA CD4 T cells transfected with crCd8, crGata3, crRunx2, crRunx3, and crKlf2 were transferred to C57BL/6 host mice, followed by infection with LCMVArm (e,f,g) or immunization with KLH-gp61 (d) of the host mice, and analyzed 6–7 days later. crRNA+ SMARTA cells were FACS sorted from spleens (LCMVArm infection) or dLN (KLH-gp61 immunization) of host mice. Gene knockdown efficiencies were measured by flow cytometry (d), mRNA qPCR (e), or Western blot analysis (f,g). shRunx3-RV+ SMATRA cells and pMIG-Klf2-RV+ SMARTA cells were used as positive controls. Two independent experiments were performed; Each dot represents one mouse (n = 5). Data are mean ± s.d., unpaired two-tailed Student’s t-test. Details are in the Method section.
h, Schematic of the CRISPR/Cas9-mediated gene knockdown of SMARTA cell system used for testing Gata3 in LCMVArm infection. WT or Bcl6f/fPrdm1f/f CreCD4 SMARTA CD4 T cells transfected with crCd8 or crGata3 were transferred to C57BL/6 host mice, followed by infection of the host mice with LCMVArm, and analyzed 6–7 days later. Related to Fig.7c and Extended Data Fig.7i,l,m.
i,j,k, Frequency of crRNA+ CD45.1+ SMARTA cells among total CD4 T cells from spleen of LCMVArm infected mice in Fig.7d and Extended Data Fig.7h. Two (i) or three (j,k) independent experiments were performed; each dot represents one mouse (n = 4). Data are mean ± s.d., unpaired two-tailed Student’s t-test.
l, Representative flow cytometry of TFH SMARTA cell subsets from spleen of LCMVArm infected mice in Extended Data Fig.7h. Two independent experiments were performed; Each dot represents one mouse (n = 4). Data are mean ± s.d., unpaired two-tailed Student’s t-test.
m, Quantification of expression of PSGL1 in Extended Data Fig.7h, gated on SMARTA cells. CD44lo naive CD4 T cells were used as a negative control.
Extended Data Fig. 8. Identification of Runx2, Runx3, and Gata3 as repressors of TFH genes, acting downstream of Bcl-6.
Related to Fig. 7
a, Schematic of the RV+ SMARTA cell transfer system used for LCMVArm infection. WT SMARTA CD4 T cells transduced with pMIG (GFP-RV+), pMIG-Runx3myc (Runx3-RV+), or pMIG-Runx2myc (Runx2-RV+) were transferred to C57BL/6 host mice, followed by infection of the host mice with LCMVArm, and analyzed 7 days after infection. Related to Fig.7i–j and Extended Data Fig.7o–u.
b, Total GFP+ RV+ SMARTA cells [RV+ high] were FACS sorted from in vitro culture. Whole cell lysates were analyzed by immunoblotting using anti-myc tag and anti-GAPDH antibodies. Relative Runx expressions are indicated.
c, SMARTA CD4 T cells transduced with pMIG (GFP-RV+), pMIG-Runx3myc (Runx3-RV+ [High]), or pMIG-Runx2myc (Runx2-RV+ [High]) were transferred to C57BL/6 host mice, followed by infection of the host mice with LCMVArm, and analyzed 7 days later. Frequency of CD45.1+ SMARTA cells among total CD4 T cells from spleen of LCMVArm infected mice. Two independent experiments were performed; each dot represents one mouse (n = 4). Data are mean ± s.d., unpaired two-tailed Student’s t-test.
d, Representative flow cytometry of TFH RV+ [High] SMARTA cell subsets from spleen of LCMVArm infected mice. Quantification of results from left panels.
e, Bottom 10% [Low], bottom 10–30% [Med] and remaining 30–100% [High] GFP+ Runx3-RV+ SMARTA cells, and total GFP+ RV+ SMARTA cells were FACS sorted from in vitro culture. Whole cell lysates were analyzed by immunoblotting using anti-Runx3 and anti-GAPDH antibodies. Relative Runx expressions are indicated.
f, Bottom 10% GFP+ Runx3-RV+ (Runx3-RV+ [Low]), bottom 30% GFP+ Runx2-RV+ (Runx2-RV+ [Med]), and total GFP+ RV+ (GFP-RV+) SMARTA cells were FACS sorted from in vitro culture. Whole cell lysates were analyzed by immunoblotting using anti-myc tag and anti-GAPDH antibodies. Relative Runx expressions are indicated.
g, SMARTA CD4 T cells transduced with pMIG (GFP-RV+), pMIG-Runx3myc (Runx3-RV+ [Low]), or pMIG-Runx2myc (Runx2-RV+ [Med]) were transferred to C57BL/6 host mice, followed by infection of the host mice with LCMVArm, and analyzed 7 days later. Frequency of CD45.1+ SMARTA cells among total CD4 T cells from spleen of LCMVArm infected mice. Two independent experiments were performed; each dot represents one mouse (n = 5). Data are mean ± s.d., unpaired two-tailed Student’s t-test.
h, Representative flow cytometry of TFH Runx3-RV+ [Low] and Runx2-RV+ [Med] SMARTA cell subsets from spleen of LCMVArm infected mice. Quantification of results from left panels.
h, Representative flow cytometry of TFH Runx3-RV+ [Low] and Runx2-RV+ [Med] SMARTA cell subsets from spleen of LCMVArm infected mice. Quantification of results from left panels.
Extended Data Figure 9. Identification of Klf2 as a repressor, acting downstream of Bcl-6 regulating major of TFH genes.
Related to Fig.8
a-c, WT or Bcl6f/fPrdm1f/f CreCd4 SMARTA CD4 T cells transfected with crCd8 or crKlf2 were transferred to C57BL/6 host mice, followed by infection of the host mice with LCMVArm, and analyzed 6–7 days later (n=4–5 mice per group). (a) Frequency of CD45.1+ SMARTA cells among total CD4 T cells from spleen of LCMVArm infected mice. (b) Representative flow cytometry of gp66-restimulated IL-21+ SMARTA cells. Quantification of results from left panels. (c) Quantification of expression of Tcf-1, T-bet, GATA-3, and Maf, gated on SMARTA cells. Three independent experiments were performed; each dot represents one mouse (a, n = 4; b-c, n = 5). Data are mean ± s.d., unpaired two-tailed Student’s t-test. Related to Fig.8a–c.
d, Schematic of the CRISPR/Cas9-mediated gene knockdown of SMARTA cell system used for testing Klf2 in KLH-gp61 immunization. WT or Bcl6f/fPrdm1f/f CreCD4 SMARTA CD4 T cells transfected with crCd8 or crKlf2 were transferred to C57BL/6 host mice, followed by immunization of the host mice with KLH-gp61 and alum + cGAMP, and analyzed 8 days later. Related to Fig. 8d–f.
e,g, Genome-browser tracks depict ATAC-seq chromatin accessibility and TF occupancy. Peak calls indicated below each track. * and ** indicate DEseq2 raw p-val ≤ 0.05 and ≤ 0.01, respectively, in comparison between Bcl6f/fPrdm1f/f CreCD4 TFH-like and Prdm1f/f CreCD4 TFH. Gene expression from RNA-seq data of LCMVArm infected mice and KLH-gp61 immunized mice are graphed.
f, Genome-browser tracks depict Tcf1 ChIP-Seq peaks at Pdcd1 and IL6ra loci from murine TFH cells.
h, Gene expression of Tox and Tox2 from RNA-seq data of LCMVArm infected mice or KLH-gp61 immunized mice.
i, Representative flow cytometry of TFH cells, gated on SMARTA cells from spleens of LCMVArm infected mice (n=4 mice per group) in Fig. 8a. Quantification of results from left panels.
Supplementary Material
ACKNOWLEDGEMENTS
We thank C. Kim, L. Boggeman, D. Hinz, and C. Dillingham of LJI Flow Cytometry Core Facility for cell sorting, J. Greenbaum and A. Sethi of LJI Bioinformatics core for bioinformatics analysis, G. Seumois and J. Day of LJI Sequencing core, and K. Jepsen of UCSD IGM sequencing core for consultation. We thank MaxCyte, Inc. for generously providing the MaxCyte ATX electroporator and reagents. This work was funded by grants from the USA National Institutes of Health (NIH), including National Institute of Allergy and Infectious Diseases (NIAID) U19 AI109976 and NIAID R01 AI072543, NIH S10 RR027366 (LJI), and internal La Jolla Institute institutional funds to S.C.
Footnotes
Reporting Summary. Further information on research design is available in the Nature Research Reporting Summary linked to this article.
DATA AVAILABILITY
RNA-seq and ATAC-seq data are deposited to the the Gene Expression Omnibus (GEO) under the GSE140187 super series (https://www.ncbi.nlm.nih.gov/geo/query/acc.cgi?acc=GSE140187). Scripts for analysis are deposited on Github: https://github.com/ScrippsPipkinLab/JYC_DataAnalysis. All other data that support the findings of this study are available from the corresponding author upon request.
COMPETING INTERESTS
The authors have no competing interests to declare.
REFERENCES
- 1.Crotty S T Follicular Helper Cell Biology: A Decade of Discovery and Diseases. Immunity 50, 1132–1148 (2019). [DOI] [PMC free article] [PubMed] [Google Scholar]
- 2.Vinuesa CG, Linterman MA, Yu D & MacLennan ICM Follicular Helper T Cells. Annu. Rev. Immunol 34, 335–368 (2016). [DOI] [PubMed] [Google Scholar]
- 3.Johnston RJ et al. Bcl6 and Blimp1 Are Reciprocal and Antagonistic Regulators of T Follicular Helper Cell Differentiation. Science 325, 1006–1010 (2009). [DOI] [PMC free article] [PubMed] [Google Scholar]
- 4.Yu D et al. The Transcriptional Repressor Bcl-6 Directs T Follicular Helper Cell Lineage Commitment. Immunity 31, 457–468 (2009). [DOI] [PubMed] [Google Scholar]
- 5.Nurieva RI et al. Bcl6 Mediates the Development of T Follicular Helper Cells. Science 325, 1001–1005 (2009). [DOI] [PMC free article] [PubMed] [Google Scholar]
- 6.Crotty S T follicular helper cell differentiation, function, and roles in disease. Immunity 41, 529–542 (2014). [DOI] [PMC free article] [PubMed] [Google Scholar]
- 7.Ise W et al. The transcription factor BATF controls the global regulators of class-switch recombination in both B cells and T cells. Nature Immunology 12, 536–543 (2011). [DOI] [PMC free article] [PubMed] [Google Scholar]
- 8.Kroenke MA et al. Bcl6 and Maf Cooperate To Instruct Human Follicular Helper CD4 T Cell Differentiation. J. Immunol 188, 3734–3744 (2012). [DOI] [PMC free article] [PubMed] [Google Scholar]
- 9.Johnston RJ, Choi YS, Diamond JA, Yang JA & Crotty S STAT5 is a potent negative regulator of TFH cell differentiation. J. Exp. Med 209, 243–250 (2012). [DOI] [PMC free article] [PubMed] [Google Scholar]
- 10.Choi YS, Eto D, Yang JA, Lao C & Crotty S Cutting edge: STAT1 is required for IL-6-mediated Bcl6 induction for early follicular helper cell differentiation. J. Immunol 190, 3049–3053 (2013). [DOI] [PMC free article] [PubMed] [Google Scholar]
- 11.Wang H et al. The transcription factor Foxp1 is a critical negative regulator of the differentiation of follicular helper T cells. Nature Immunology 15, 667–675 (2014). [DOI] [PMC free article] [PubMed] [Google Scholar]
- 12.Stone EL et al. ICOS coreceptor signaling inactivates the transcription factor FOXO1 to promote Tfh cell differentiation. Immunity 42, 239–251 (2015). [DOI] [PMC free article] [PubMed] [Google Scholar]
- 13.Lee J-Y et al. The transcription factor KLF2 restrains CD4⁺ T follicular helper cell differentiation. Immunity 42, 252–264 (2015). [DOI] [PMC free article] [PubMed] [Google Scholar]
- 14.Weber JP et al. ICOS maintains the T follicular helper cell phenotype by down-regulating Krüppel-like factor 2. J. Exp. Med 212, 217–233 (2015). [DOI] [PMC free article] [PubMed] [Google Scholar]
- 15.Krishnamoorthy V et al. The IRF4 Gene Regulatory Module Functions as a Read-Write Integrator to Dynamically Coordinate T Helper Cell Fate. Immunity 47, 481–497.e7 (2017). [DOI] [PMC free article] [PubMed] [Google Scholar]
- 16.Kim CJ et al. The Transcription Factor Ets1 Suppresses T Follicular Helper Type 2 Cell Differentiation to Halt the Onset of Systemic Lupus Erythematosus. Immunity 49, 1034–1048.e8 (2018). [DOI] [PubMed] [Google Scholar]
- 17.Lahmann A et al. Bach2 Controls T Follicular Helper Cells by Direct Repression of Bcl-6. J. Immunol 202, 2229–2239 (2019). [DOI] [PubMed] [Google Scholar]
- 18.Geng J et al. Bach2 Negatively Regulates T Follicular Helper Cell Differentiation and Is Critical for CD4+ T Cell Memory. J. Immunol ji1801626 (2019). doi: 10.4049/jimmunol.1801626 [DOI] [PMC free article] [PubMed]
- 19.Choi YS et al. LEF-1 and TCF-1 orchestrate TFH differentiation by regulating differentiation circuits upstream of the transcriptional repressor Bcl6. Nature Immunology 16, 980–990 (2015). [DOI] [PMC free article] [PubMed] [Google Scholar]
- 20.Xu L et al. The transcription factor TCF-1 initiates the differentiation of TFH cells during acute viral infection. Nature Immunology 16, 1–11 (2015). [DOI] [PubMed] [Google Scholar]
- 21.Wu T et al. TCF1 Is Required for the T Follicular Helper Cell Response to Viral Infection. Cell Rep 12, 2099–2110 (2015). [DOI] [PMC free article] [PubMed] [Google Scholar]
- 22.Shaw LA et al. Id2 reinforces TH1 differentiation and inhibits E2A to repress TFH differentiation. Nature Immunology 17, 834–843 (2016). [DOI] [PMC free article] [PubMed] [Google Scholar]
- 23.Liu X et al. Transcription factor achaete-scute homologue 2 initiates follicular T-helper-cell development. Nature 507, 513–518 (2014). [DOI] [PMC free article] [PubMed] [Google Scholar]
- 24.Hatzi K et al. BCL6 orchestrates Tfh cell differentiation via multiple distinct mechanisms. J. Exp. Med 212, 539–553 (2015). [DOI] [PMC free article] [PubMed] [Google Scholar]
- 25.Liu X et al. Genome-wide Analysis Identifies Bcl6-Controlled Regulatory Networks during T Follicular Helper Cell Differentiation. Cell Rep 14, 1735–1747 (2016). [DOI] [PMC free article] [PubMed] [Google Scholar]
- 26.Crotty S, Johnston RJ & Schoenberger SP Effectors and memories: Bcl6 and Blimp1 in T and B lymphocyte differentiation. Nature Immunology 11, 114–120 (2010). [DOI] [PMC free article] [PubMed] [Google Scholar]
- 27.Crotty S Follicular Helper CD4 T Cells (TFH). Annu. Rev. Immunol 29, 621–663 (2011). [DOI] [PubMed] [Google Scholar]
- 28.Nance JP et al. Bcl6 middle domain repressor function is required for T follicular helper cell differentiation and utilizes the corepressor MTA3. Proc. Natl. Acad. Sci. U.S.A 112, 13324–13329 (2015). [DOI] [PMC free article] [PubMed] [Google Scholar]
- 29.Xie MM et al. Bcl6 promotes follicular helper T-cell differentiation and PD-1 expression in a Blimp1-independent manner in mice. European Journal of Immunology 47, 1136–1141 (2017). [DOI] [PMC free article] [PubMed] [Google Scholar]
- 30.Mendez LM et al. CtBP is an essential corepressor for BCL6 autoregulation. Mol. Cell. Biol 28, 2175–2186 (2008). [DOI] [PMC free article] [PubMed] [Google Scholar]
- 31.Huynh KD & Bardwell VJ The BCL-6 POZ domain and other POZ domains interact with the co-repressors N-CoR and SMRT. Oncogene 17, 2473–2484 (1998). [DOI] [PubMed] [Google Scholar]
- 32.Bartfeld D et al. DNA Recognition by the RUNX1 Transcription Factor Is Mediated by an Allosteric Transition in the RUNT Domain and by DNA Bending. Structure 10, 1395–1407 (2002). [DOI] [PubMed] [Google Scholar]
- 33.Hiramatsu Y et al. c-Maf activates the promoter and enhancer of the IL-21 gene, and TGF-beta inhibits c-Maf-induced IL-21 production in CD4+ T cells. J Leukoc Biol 87, 703–712 (2010). [DOI] [PubMed] [Google Scholar]
- 34.Sahoo A et al. Batf is important for IL-4 expression in T follicular helper cells. Nat Commun 6, 7997 (2015). [DOI] [PMC free article] [PubMed] [Google Scholar]
- 35.Hatzi K et al. A Hybrid Mechanism of Action for BCL6 in B Cells Defined by Formation of Functionally Distinct Complexes at Enhancers and Promoters. Cell Rep 4, 578–588 (2013). [DOI] [PMC free article] [PubMed] [Google Scholar]
- 36.Pasqualucci L & Dalla Favera R Genetics of diffuse large B-cell lymphoma. Blood 131, 2307–2319 (2018). [DOI] [PMC free article] [PubMed] [Google Scholar]
- 37.Kusam S, Toney LM, Sato H & Dent AL Inhibition of Th2 Differentiation and GATA-3 Expression by BCL-6. J. Immunol 170, 2435–2441 (2003). [DOI] [PubMed] [Google Scholar]
- 38.Kwon H-K, Chen H-M, Mathis D & Benoist C Different molecular complexes that mediate transcriptional induction and repression by FoxP3. Nature Immunology 486, 549–1248 (2017). [DOI] [PMC free article] [PubMed] [Google Scholar]
- 39.Ciofani M et al. A validated regulatory network for Th17 cell specification. Cell 151, 289–303 (2012). [DOI] [PMC free article] [PubMed] [Google Scholar]
- 40.Iwata S et al. The Transcription Factor T-bet Limits Amplification of Type I IFN Transcriptome and Circuitry in T Helper 1 Cells. Immunity 46, 983–991.e4 (2017). [DOI] [PMC free article] [PubMed] [Google Scholar]
- 41.Vahedi G et al. Helper T-cell identity and evolution of differential transcriptomes and epigenomes. Immunol. Rev 252, 24–40 (2013). [DOI] [PMC free article] [PubMed] [Google Scholar]
- 42.Oxenius A, Bachmann MF, Zinkernagel RM & Hengartner H Virus‐specific major MHC class II‐restricted TCR‐transgenic mice: effects on humoral and cellular immune responses after viral infection. European Journal of Immunology 28, 390–400 (1998). [DOI] [PubMed] [Google Scholar]
- 43.Kaji T et al. Distinct cellular pathways select germline-encoded and somatically mutated antibodies into immunological memory. J. Exp. Med 209, 2079–2097 (2012). [DOI] [PMC free article] [PubMed] [Google Scholar]
- 44.Shapiro-Shelef M et al. Blimp-1 is required for the formation of immunoglobulin secreting plasma cells and pre-plasma memory B cells. Immunity 19, 607–620 (2003). [DOI] [PubMed] [Google Scholar]
- 45.Rutishauser RL et al. Transcriptional repressor Blimp-1 promotes CD8(+) T cell terminal differentiation and represses the acquisition of central memory T cell properties. Immunity 31, 296–308 (2009). [DOI] [PMC free article] [PubMed] [Google Scholar]
- 46.Wang D et al. The Transcription Factor Runx3 Establishes Chromatin Accessibility of cis -Regulatory Landscapes that Drive Memory Cytotoxic T Lymphocyte Formation. Immunity 48, 659–674.e6 (2018). [DOI] [PMC free article] [PubMed] [Google Scholar]
- 47.Rosenbauer F et al. Lymphoid cell growth and transformation are suppressed by a key regulatory element of the gene encoding PU.1. Nat. Genet 38, 27–37 (2006). [DOI] [PubMed] [Google Scholar]
- 48.Montague TG, Cruz JM, Gagnon JA, Church GM & Valen E CHOPCHOP: a CRISPR/Cas9 and TALEN web tool for genome editing. Nucleic Acids Res 42, W401–7 (2014). [DOI] [PMC free article] [PubMed] [Google Scholar]
- 49.Seumois G et al. Transcriptional Profiling of Th2 Cells Identifies Pathogenic Features Associated with Asthma. J. Immunol 197, 655–664 (2016). [DOI] [PMC free article] [PubMed] [Google Scholar]
- 50.Benjamini Y & Hochberg Y Controlling the False Discovery Rate: A Practical and Powerful Approach to Multiple Testing. Journal of the Royal Statistical Society: Series B (Methodological) 57, 289–300 (1995). [Google Scholar]
- 51.Raykov YP, Boukouvalas A, Baig F & Little MA What to Do When K-Means Clustering Fails: A Simple yet Principled Alternative Algorithm. PLoS ONE 11, e0162259 (2016). [DOI] [PMC free article] [PubMed] [Google Scholar]
- 52.Subramanian A et al. Gene set enrichment analysis: a knowledge-based approach for interpreting genome-wide expression profiles. Proc. Natl. Acad. Sci. U.S.A 102, 15545–15550 (2005). [DOI] [PMC free article] [PubMed] [Google Scholar]
- 53.Jain R et al. Interleukin-23-Induced Transcription Factor Blimp-1 Promotes Pathogenicity of T Helper 17 Cells. Immunity 44, 131–142 (2016). [DOI] [PMC free article] [PubMed] [Google Scholar]
- 54.Mackay LK et al. Hobit and Blimp1 instruct a universal transcriptional program of tissue residency in lymphocytes. Science 352, 459–463 (2016). [DOI] [PubMed] [Google Scholar]
- 55.Masson F et al. Id2-Mediated Inhibition of E2A Represses Memory CD8(+) T Cell Differentiation. J. Immunol 190, 4585–4594 (2013). [DOI] [PMC free article] [PubMed] [Google Scholar]
- 56.Yu B et al. Epigenetic landscapes reveal transcription factors that regulate CD8(+) T cell differentiation. Nature Immunology 18, 573–582 (2017). [DOI] [PMC free article] [PubMed] [Google Scholar]
- 57.Anders S, Pyl PT & Huber W HTSeq-a Python framework to work with high-throughput sequencing data. Bioinformatics 31, 166–169 (2015). [DOI] [PMC free article] [PubMed] [Google Scholar]
- 58.Pedregosa F et al. Scikit-learn: Machine Learning in Python. Journal of Machine Learning Research 12, 2825–2830 (2011). [Google Scholar]
- 59.Wingender E, Schoeps T, Haubrock M, Krull M & Dönitz J TFClass: expanding the classification of human transcription factors to their mammalian orthologs. Nucleic Acids Res 46, D343–D347 (2018). [DOI] [PMC free article] [PubMed] [Google Scholar]
- 60.Li Z et al. Identification of transcription factor binding sites using ATAC-seq. Genome Biol 20, 45 (2019). [DOI] [PMC free article] [PubMed] [Google Scholar]
- 61.Stormo GD Modeling the specificity of protein-DNA interactions. Quant Biol 1, 115–130 (2013). [DOI] [PMC free article] [PubMed] [Google Scholar]
- 62.Li F et al. Ezh2 programs TFH differentiation by integrating phosphorylation-dependent activation of Bcl6 and polycomb-dependent repression of p19Arf. Nat Commun 9, 5452 (2018). [DOI] [PMC free article] [PubMed] [Google Scholar]
Associated Data
This section collects any data citations, data availability statements, or supplementary materials included in this article.


