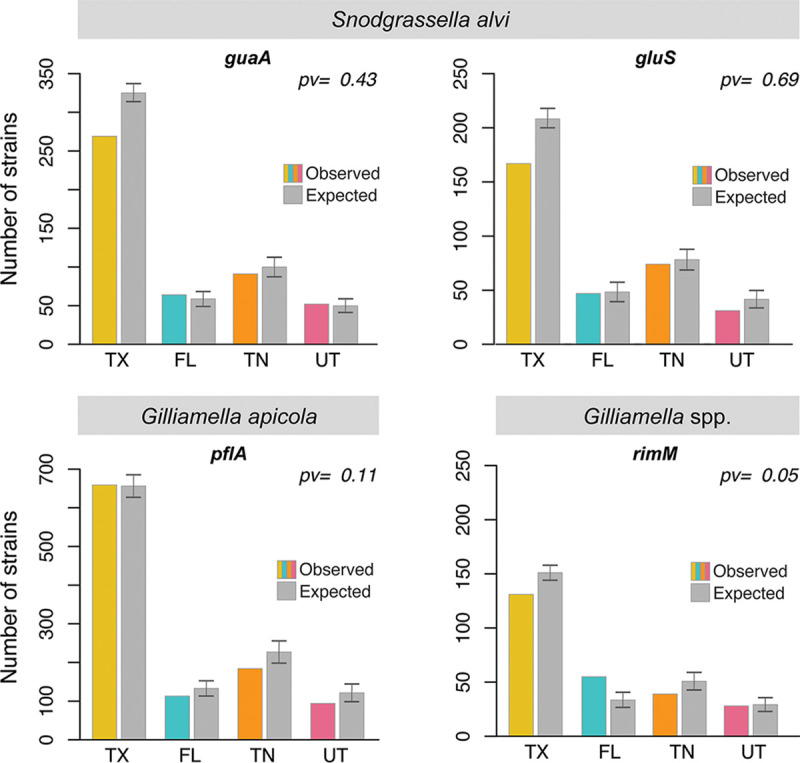
FIG 2.

Number of observed strains versus number of randomly expected strains for each location. For each marker, the number of strains is indicated for each location (color bars). The number of strains for each location was compared to the number of strains expected at each location under random expectation (gray bars). The random expectation was obtained by randomly reallocating each bee to a different location. The error bars represent standard deviations. pv, P value.
