. 2020 Aug 26;9:e57757. doi: 10.7554/eLife.57757

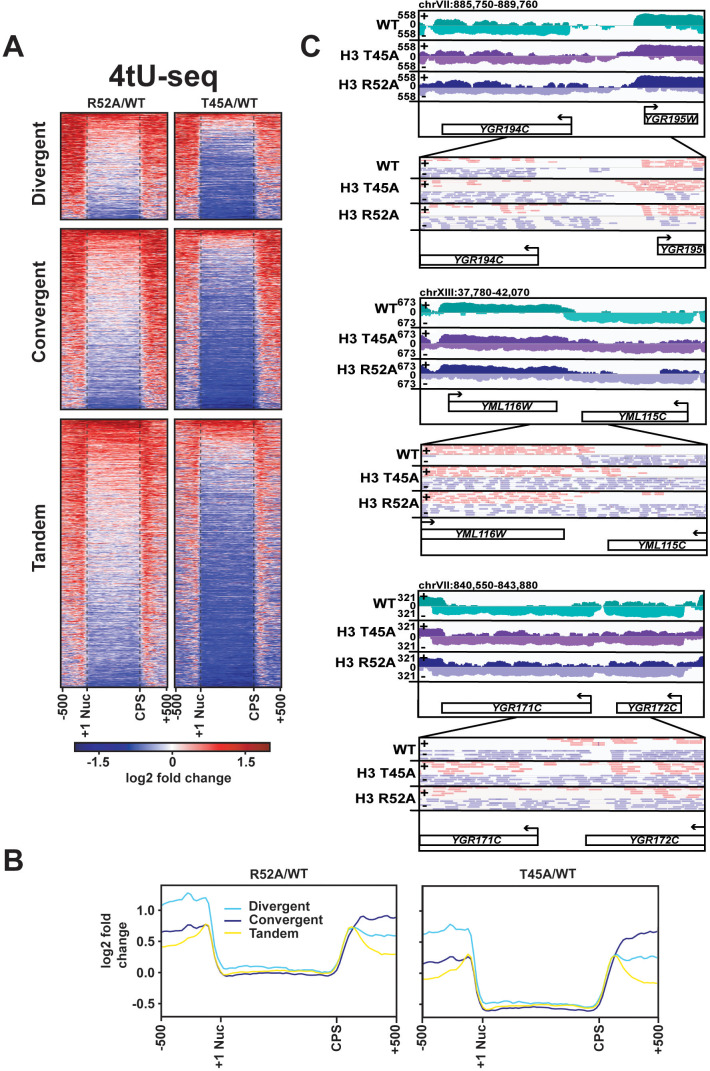
Figure 4. DNA entry-exit site mutants display aberrant transcription 5’ and 3’ to protein-coding genes.

(A) Heatmaps showing log2-fold change in spike-in normalized 4tU-seq read counts in H3 R52A or H3 T45A mutants relative to WT at divergent, convergent, and tandem genes. Heatmap rows represent 1186 divergent, 1981 convergent, and 2976 tandem protein-coding genes showing 500 bp upstream of the +1 nucleosome (Brogaard et al., 2012) and 500 bp downstream of the CPS (Ozsolak et al., 2010). (B) Metagene plots show averaged intensity over regions displayed in the difference heatmaps shown in panel A. (C) Browser tracks visualized in IGV (Thorvaldsdóttir et al., 2013) depicting aberrant transcription 5’ and 3’ to divergent (top), convergent (middle), and tandem (bottom) gene pairs in the indicated strains. Data represent log-scaled, spike-in normalized 4tU-seq read density over the plus (+) and minus (-) strands. Regions were chosen to be void of neighboring ncRNA loci. IGV-visualized BAM-file snapshots depict presence or absence of strand-specific read-pairs between genes. Arrows above gene names indicate directionality of transcription. All heatmaps and metagene plots were generated using deepTools2 (Ramírez et al., 2014; Ramírez et al., 2016) using 25 bp bins.

Figure 4.

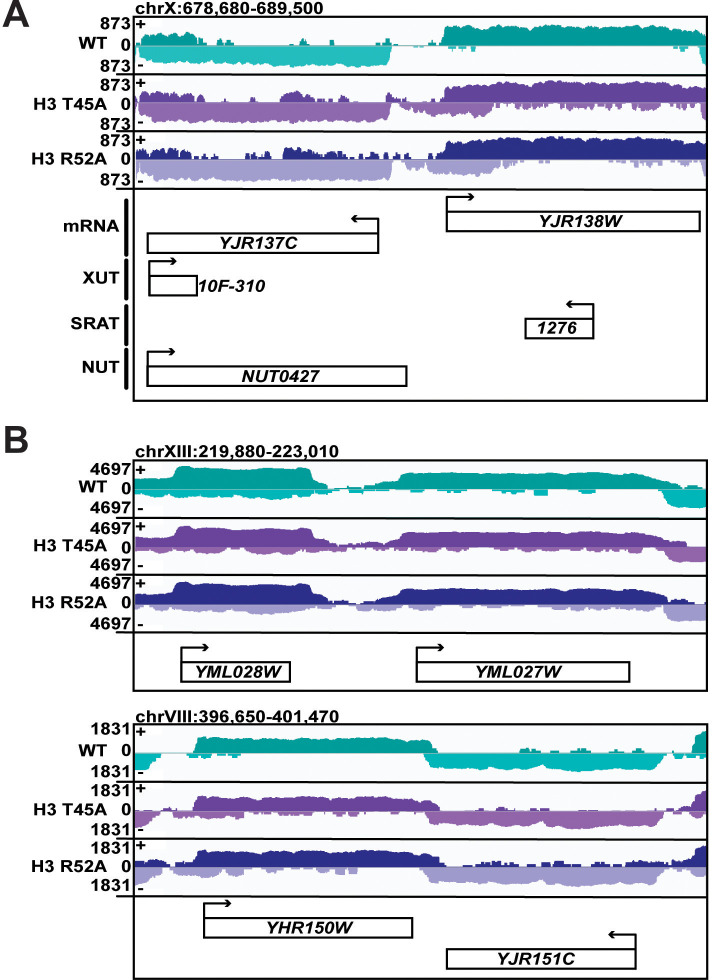
Figure 4—figure supplement 1. Some genes in DNA entry-exit site mutants show little to no change in 5’ and 3’ expression.

Figure 4—figure supplement 1.

(A, B) Browser tracks of 4tU-seq read density in WT, H3 T45A, and H3 R52A mutant cells visualized in IGV (Thorvaldsdóttir et al., 2013). Data displayed are spike-in normalized read density over the plus (+) and minus (-) strand. All annotated ncRNA within the browser track are displayed. Arrows above gene names indicate directionality of transcription. (A) Tracks depict aberrant transcription on the minus strand 5’ to the YJR137C locus which is sense with respect to YJR137C, but terminating prior to the TSS. This read density appears to originate as an antisense cryptic transcript from the gene body of YJR138W. These data suggest that some increases in 5’ read density seen in Figure 4 can be attributed to short, cryptic, antisense transcripts. (B) Tracks depict YML028W/YML027W and YHR150C/YHR151W gene pairs with little change in 5’ or 3’ reads, exemplifying that extensions in 5’ and 3’ reads in H3 T45A, and H3 R52A mutants occur at many genes but are not universal.
Figure 4—figure supplement 2. Transcriptional changes at ncRNA loci in DNA entry-exit site mutants.
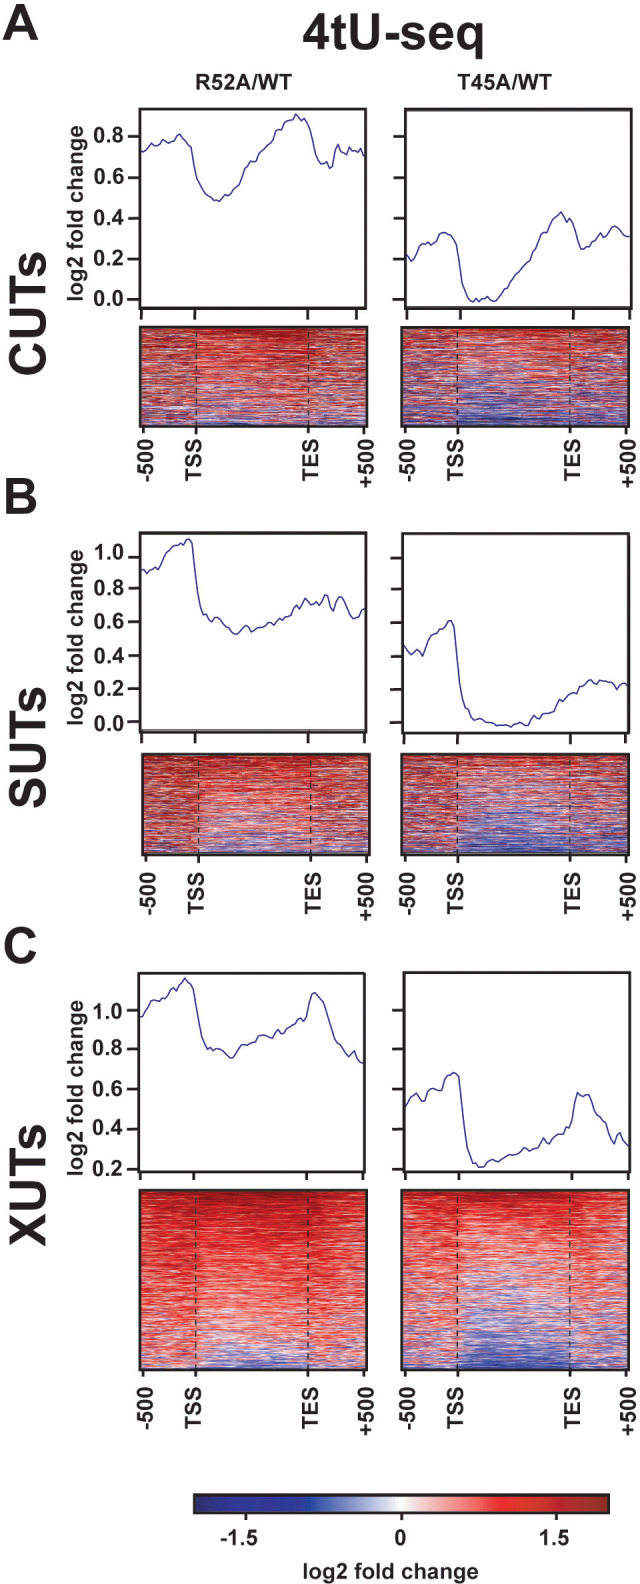
Figure 4—figure supplement 2.

(A–C) Heatmaps showing log2-fold change in spike-in normalized 4tU-seq read counts between H3 R52A or H3 T45A mutant and WT loci. Heatmap rows represent (A) 924 CUT (Xu et al., 2009), (B) 846 SUT (Xu et al., 2009), and (C) 1657 XUT (van Dijk et al., 2011) ncRNA loci with an additional 500 bp upstream of their annotated transcription start site (Brogaard et al., 2012) and 500 bp downstream of the transcription end site (Ozsolak et al., 2010). Rows are group-sorted by decreasing mean intensity in mutant strains. Metagene plots show averaged intensity over regions displayed in the associated heatmaps. All heatmaps and metagene plots were generated using deepTools2 (Ramírez et al., 2014; Ramírez et al., 2016) using 25 bp bins.