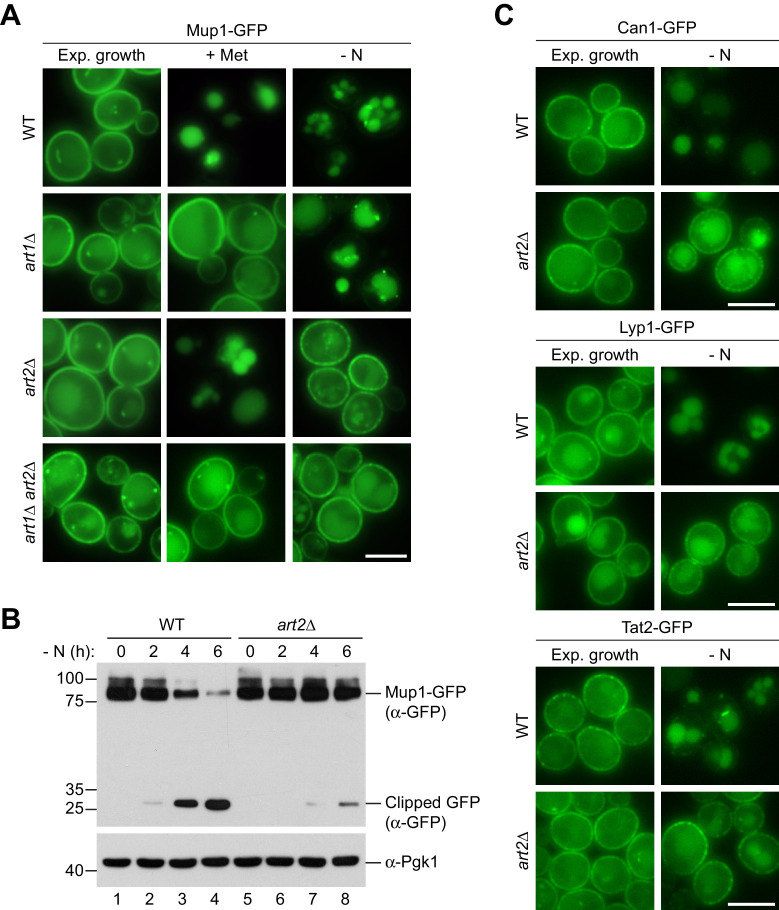
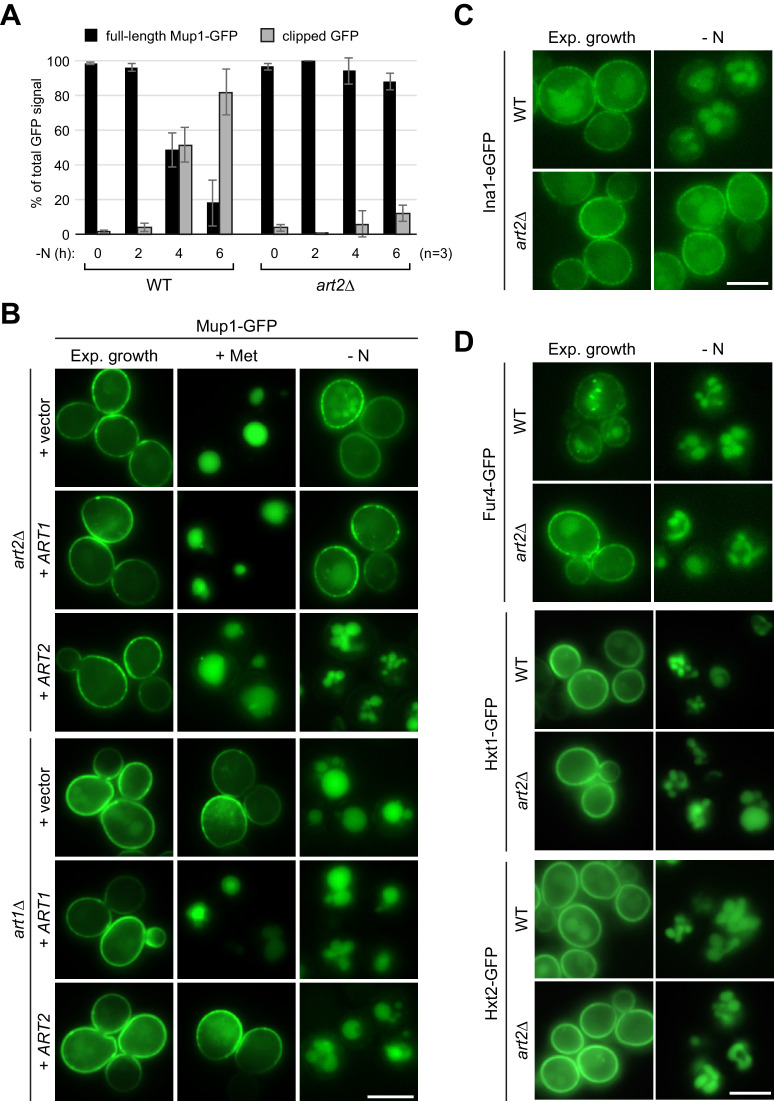
Figure 3. Art1 and Art2 are non-redundant in promoting substrate- and starvation-induced endocytosis of amino acid transporters.
(A) Live-cell fluorescence microscopy analysis of Mup1-GFP endocytosis in wild type (WT), art1∆, art2∆ and art1∆ art2∆ cells expressing MUP1-GFP from plasmid. Cells were treated with 20 µg/ml L-methionine (+ Met) for 1.5 hr or starved (- N) for 6 hr after 24 hr exponential growth. (B) SDS PAGE and western blot analysis with the indicated antibodies of whole cell protein extracts from wild type (WT) and art2∆ cells expressing MUP1-GFP that were starved (- N) for the indicated times after 24 hr exponential growth. Quantification in Figure 3—figure supplement 1A. (C) Live-cell fluorescence microscopy analysis of wild type (WT) and art2∆ cells expressing CAN1-GFP, LYP1-GFP or TAT2-GFP. Cells were starved (- N) for 6 hr after 24 hr exponential growth. Scale bars = 5 µm. See also Figure 3—figure supplement 1.


