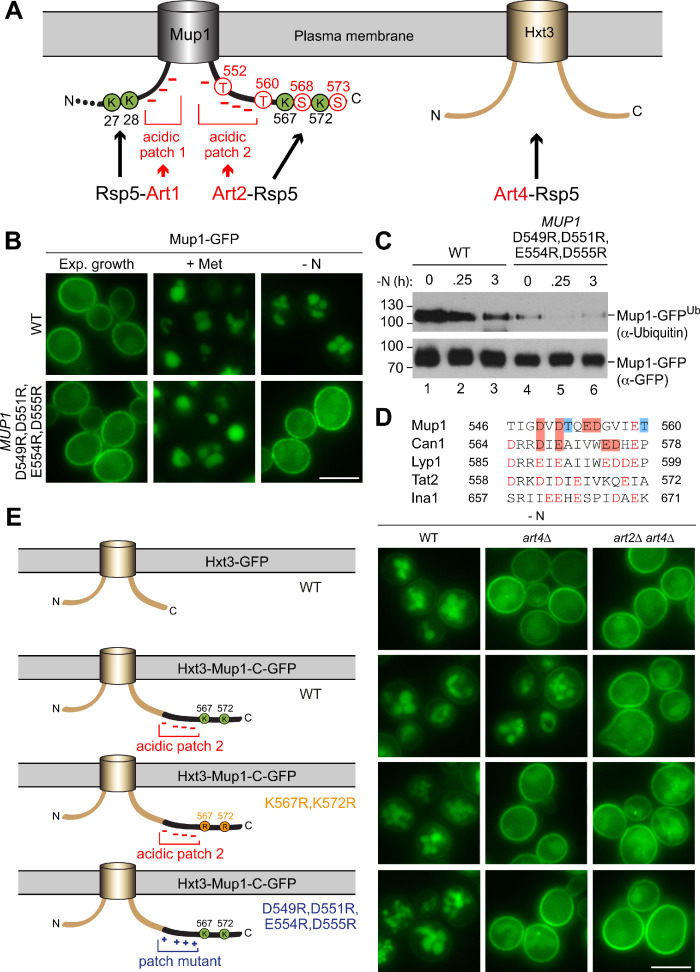
Figure 6. The C-terminus of Mup1 harbors a transplantable, starvation-responsive acidic degron.
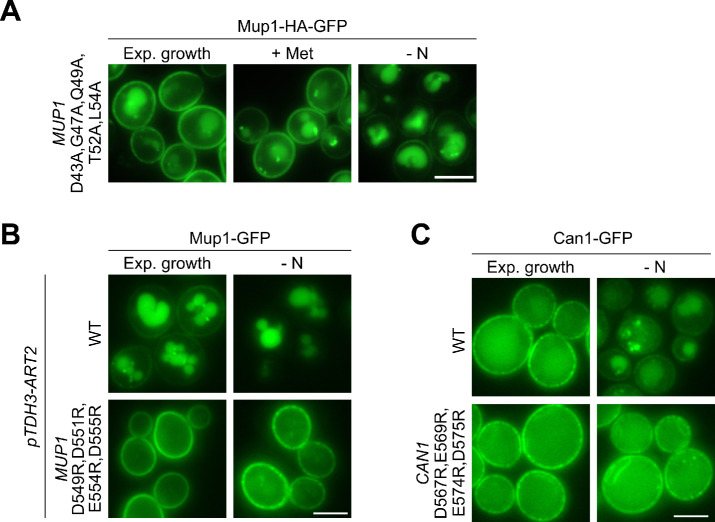
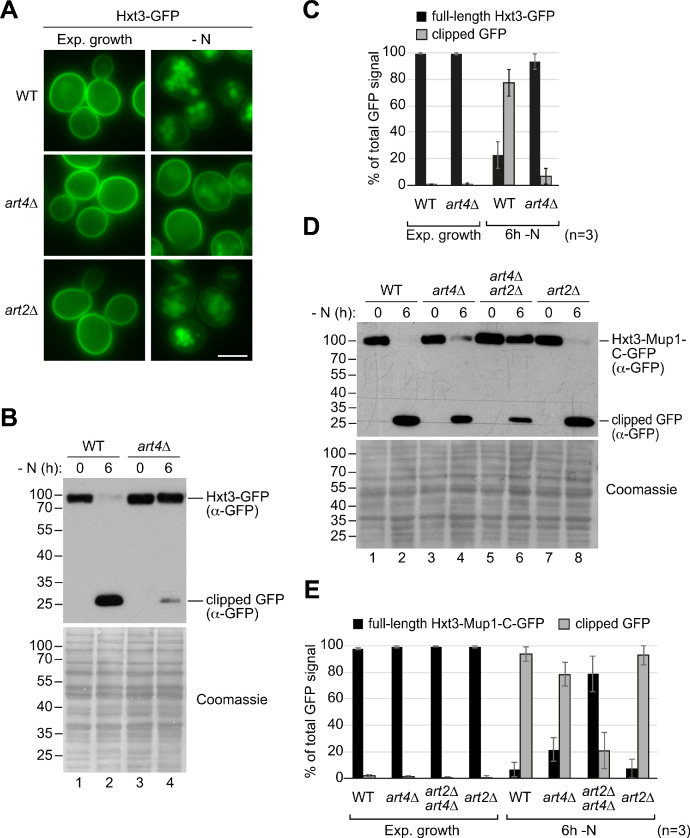
(A) Left: scheme of Mup1 topology with N- and C-terminal ubiquitination sites and acidic patches targeted by Art1-Rsp5 and Art2-Rsp5, respectively, and the C-terminal phosphorylation sites of Mup1 that promote its starvation-induced endocytosis. Ubiquitinated lysines (K) shown in green and phosphorylated serines (S) and threonines (T) in red with numbers corresponding to amino acid positions in the Mup1 sequence. Right: Hxt3 as an Art4-Rsp5 dependent cargo during nitrogen starvation. (B) Live-cell fluorescence microscopy analysis of Mup1-GFP endocytosis in cells expressing MUP1-GFP (wild type (WT)) or MUP1 D549R,D551R,E554R,D555R-GFP. Cells were treated with 20 µg/ml L-methionine (+ Met) for 1.5 hr or starved (- N) for 6 hr after 24 hr exponential growth. (C) SDS PAGE and western blot analysis with the indicated antibodies of immunoprecipitated Mup1-GFP from cells expressing MUP1-GFP (WT) or MUP1 D549R,D551R,E554R,D555R-GFP starved for the indicated times after 24 hr of exponential growth. Equal amounts of immunoprecipitated Mup1-GFP were loaded to compare the extent of ubiquitination. (D) Amino acid sequence alignment of the C-terminal acidic patches of Mup1, Can1, Lyp1, Tat2 and Ina1. The boxes indicate acidic residues (red) and phosphorylation sites (blue), which are required for Art2-dependent starvation-induced endocytosis. Red letters illustrate further acidic residues. (E) Live-cell fluorescence microscopy analysis of wild type (WT), art4∆ and art2∆ art4∆ cells expressing HXT3-GFP (top), HXT3-MUP1-C-GFP (second row), HXT3-MUP1-C K567,572R-GFP (third row) or HXT3-MUP1-C D549R,D551R,E554R,D555R-GFP (bottom). Cells were starved (- N) for 6 hr after 24 hr exponential growth. Scale bars = 5 µm. See also Figure 6—figure supplements 1 and 2.


