Abstract
This study investigates the fluence rate effect, an essential modulating mechanism of photodynamic therapy (PDT), by using photoacoustic imaging method. To the best of our knowledge, this is the first time that the fluence rate dependence is investigated at a microscopic scale, as opposed to previous studies that are based on tumor growth/necrosis or animal surviving rate. This micro-scale examination enables subtle biological responses, including the vascular damage and the self-healing response, to be studied. Our results reveal the correlations between fluence rate and PDT efficacy/self-healing magnitude, indicating that vascular injuries induced by high fluence rates are more likely to recover and by low fluence rates (≤126 mW/cm2) are more likely to be permanent. There exists a turning point of fluence rate (314 mW/cm2), above which PDT practically produces no permanent therapeutic effect and damaged vessels can fully recover. These findings have practical significance in clinical setting. For cancer-related diseases, the ‘effective fluence rate’ is useful to provoke permanent destruction of tumor vasculature. Likewise, the ‘non effective range’ can be applied when PDT is used in applications such as opening the blood brain barrier to avoid permanent brain damage.
1. Introduction
Photodynamic therapy (PDT) is a modern treatment in clinical medicine and shows potentials in a number of diseases treatment [1–4]. In PDT, the photosensitizer (PS), molecular oxygen, and laser irradiation are indispensable elements that give rise to the photodynamic reaction. The above three elements are also considered as the main PDT dose parameters, i.e., PDT dosimetry. To optimize the outcome of PDT treatment, a number of studies on PDT dosimetry have been reported [5–8]. It has been found that the rate of light delivery, also termed as fluence rate, plays a key role in manipulating the PDT therapy efficacy [9–11]. The reason of this owns to the dependence of metabolic oxygen consumption on fluence rate, which ultimately influences the photodynamic reaction efficiency [5,12,13].
In the existing studies, the effects of fluence rate were assessed according to the growth of tumors [10], the surviving ratio of animals [5], or the degree of tumor necrosis evaluated using histological examination [9]. The efficiency of PDT in these studies, however, is difficult to be quantified until the tumors develop to a certain level or the animals are sacrificed. So far, the non-invasive imaging examination, especially at microscopic level to investigate the comprehensive biological responses to PDT fluence rate, is still rare. The role of fluence rate in governing PDT therapeutic responses, such as the destruction of vasculature and self-healing reactions, is important to thoroughly understand the fluence rate effect on PDT treatment. In particular, the vascular destruction is one significant mechanism of PDT treatment that leads to ischemic necrosis of tumor [14–16], thus monitoring vascular variation is critical for the determination of the fluence rate dependence of PDT treatment. The visualization of vascular changes for long-term tracking also fulfills the goal of examining the healing process, which is characterized by the recovery of blood vessels.
Conventional imaging modalities, including ultrasound, MRI, CT and optical imaging, have been applied in the visualization of vascular structures [17–20]. However, CT has radiation hazard and hence is not suitable for long-term observations. Ultrasound and MRI do not have sufficient spatial resolution to resolve mirovasculature with subtle variations. Optical imaging is able to provide vascular morphology image with good resolution, but suffers from strong light scattering in biological tissues, which leads to limited tissue penetration depth. Some optical imaging techniques such as confocal microscopy and two-photon microscope need exogenous contrast agents for vasculature imaging, which adds computational complexity to differentiate the signals between the imaging probe and the photosensitizer.
Photoacoustic technique is a newly emerging imaging technology. The photoacoustic signal originates from the acoustic wave when the laser irradiation is absorbed by endogenous chromospheres such as hemoglobin in blood, which makes photoacoutic technique inherently suited for imaging vascular morphology without employing any contrast agents [21–23]. Furthermore, ultrasound waves of photoacoustic signal are less scattered in biological tissues by two or three magnitudes compared with light. Among different implementations of photoacoustic imaging [24], the optical resolution photoacoustic microscopy (OR-PAM), in particular, offers spatial resolution up to 1-10 µm or even submicron [25,26]. This allows us to examine the subtle alterations of the vascular network and other biological responses of PDT at a sub-cellular scale. As a hybrid and non-invasive imaging modality, photoacoustic imaging is highly suitable for monitoring comprehensive therapeutic reactions of PDT in vivo for a long term, and the monitoring of photoacoustic imaging also allows the PDT dose parameters to be optimized promptly so as to maximize the therapeutic effect.
Photoacoustic imaging technique has been applied in the monitoring of PDT-induced vascular damage to analyze the total light dose effect [27]. However, the study on PDT treatment in response to fluence rate is still rare. In this study, we measure vascular damage of mice ear using photoacoustic technique for the investigation of vascular damage as a function of fluence rate. To the best of our knowledge, this is the first time that the fluence rate dependence of PDT is investigated and visualized at a microscopic scale. This microscopic level investigation allows the subtle therapeutic reactions of PDT, including the self-healing and inflammation responses, to be studied. Moreover, this study offers the longest continuous angiography (15 days) for the investigation of PDT fluence rate effect, which is significant to thoroughly evaluate the role of fluence rate in governing long-lasting PDT therapeutic responses. In this paper, we quantified both blood vessels destruction and the self-healing magnitude as a function of fluence rate, based on a long term detection of PDT responses. The ischemic necrosis of tissue was also analyzed to provide a better understanding of fluence rate effects on PDT treatment.
2. Materials and methods
2.1. Animals and photosensitizer
The animals used in this study were male BALB/c nude mice (4–6 weeks old and 18–20 g weight), which were purchased from Beijing Vital River Laboratory Animal Technology Co., Ltd, China. All animal experiments were conducted according to a protocol approved by the Animal Study Committee of the Shenzhen Institutes of Advanced Technology, Chinese Academy of Sciences. Mice were anesthetized using a mixture of isoflurane and oxygen (1L/minute) in both PDT treatment and photoacoustic imaging (Sections 2.3 and 2.4). In fluorescence imaging (Section 2.2), mice received intraperitoneal anesthesia (1% sodium pentobarbital, 50 mg/kg) due to the compatibility of intraperitoneal injection with the imaging system (CRI Inc.). During all imaging and PDT treatments in this study, mice body temperature was maintained at 37°C using a temperature-controlled heating pad (RWD Life Science, Shenzhen, China).
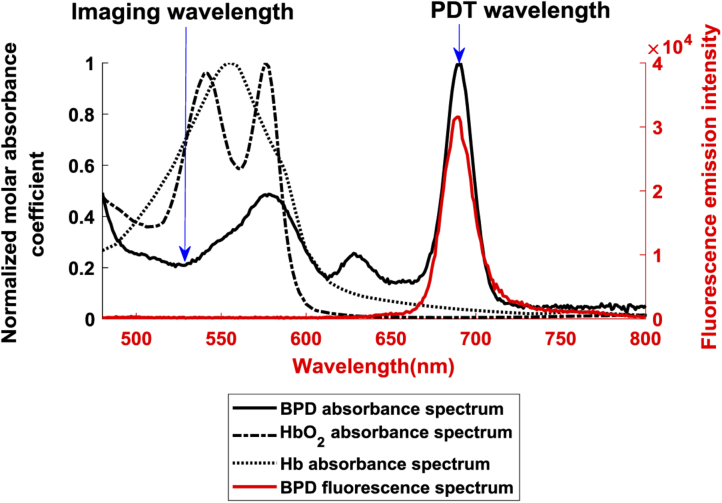
We applied the FDA-approved PS benzoporphyrin derivative monoacid ring-A (BPD) for PDT treatments in this study. BPD is a chlorin-type molecule and exists as a mixture of two regioisomers, which was obtained from VWR International, LLC. (Radnor, Pennsylvania, USA) with the product identifier as Verteporfin. Previous studies [15,29] demonstrate that BPD has effective selectivity for vascular damage in photodynamic therapy. In our tests, BPD was supplied as a lyophilized powder and was initially dissolved in DMSO to a concentration of 1 mg/ml, and then was stored in the dark at 4 °C until needed. For each PDT treatment, this solution was further diluted to 0.075 mg/ml concentration using deionized water and protected from light before intravenous injection. Figure 1 shows the fluorescence spectrum of BPD, and the absorbance spectrum of BPD, oxygenated hemoglobin (HbO2) and deoxygenated hemoglobin (Hb). Each absorbance spectrum was normalized by their own peak within the wavelength range shown in the figure. The absorption peak of 690 nm (Q-band) of BPD was used for PDT treatment, whilst the wavelength of 532 nm was applied for photoacoustic imaging because the endogenous hemoglobin has high absorbance at this wavelength. Note that the absorbance of BPD at 532 nm is sufficiently low compared to 690 nm so as to minimize the PDT therapeutic effect activated by 532 nm pulsed laser during photoacoustic imaging. In particular, this effect was quantified in this study with a control group and will be demonstrated in Section 3.1.
Fig. 1.
Measured absorbance and fluorescence spectrum of BPD in comparison with the spectrum of HbO2 and Hb obtained from [28]. BPD: benzoporphyrin derivative monoacid ring-A; HbO2: oxygenated hemoglobin; Hb: deoxygenated hemoglobin.
2.2. PS accumulation in ears
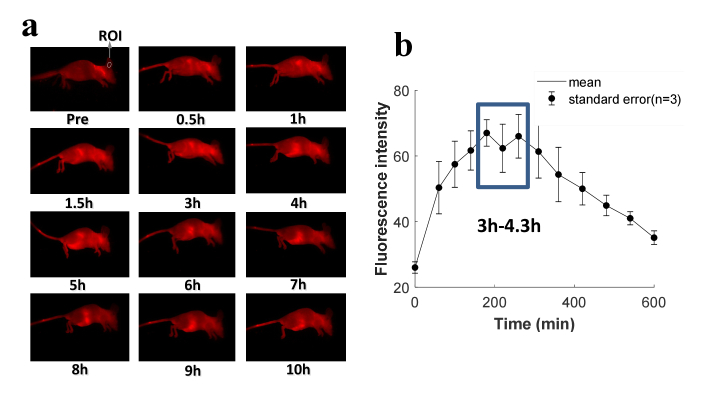
In this study, mice ears were employed for PDT treatment as they possess abundant blood vessels and capillaries, making them ideal for both vascular-acting PDT and photoacoustic imaging. The purpose of this section is to determine the time interval between the injection of drug and application of PDT light based on the peak of PS accumulation in mice ears. This was achieved via assessing the uptake and clearance of PS in mice using fluorescence imaging. Maestro imaging system (CRI Inc.) was applied for fluorescence imaging, in which the wavelength of 450 nm and 710 nm were employed as the band-pass excitation filter and long-pass emission filter, respectively, based on the fluorescence spectrum of BPD shown in Fig. 1 (red color). Mice were injected intravenously with 0.75 mg/kg of BPD before imaging. For statistical analysis, three mice were imaged. The fluorescence images prior to intravenous injection and at different time points post-intravenous injection were obtained. The images of one representative mouse are displayed in Fig. 2(a). The average fluorescence intensity within the same sub-region of the ear [white circle in Fig. 2(a)] was acquired to quantitatively analyze the PS accumulation in mice ears as a function of time. The data of three mice were obtained to determine the statistical value of fluoresce intensity in the ear region at multiple specific time points, as shown in Fig. 2(b), the results of which indicate that the PS accumulation at mice ears approximately peaks at the time between 3 h and 4.3 h.
Fig. 2.
The fluorescence imaging of PS biodistribution. (a) Images of BPD distribution in mice at different time points. The white circle shows the region of interest (ROI) in the mouse ear used for fluorescence intensity quantification. (b) Fluorescence intensity of BPD at ear region as a function of time.
2.3. PDT treatment
BPD solution was used within 1 hour post-preparation for each PDT treatment. Mice were given BPD solution via tail vein injection at a dose of 0.75 mg/kg and were isolated in dark places post-injection. During PDT treatment, mice bodies were covered by tapes except for the targeted ear zone. Note that only a small portion of the ear was treated by PDT, and the rest of the ear was enclosed in the tape as a control, as shown in Fig. 3(d) and Fig. 8 (Appendix A). Mouse ear was flattened on a glass plate and the laser source was placed perpendicular to the exposed region to enable a uniform distribution of irradiation on the surface of the ear [Fig. 3(d)]. The targeted ear zone was irradiated with a continuous wave 690 nm laser diode source (Model MRL-III-690 nm-500 mW, Changchun New Industries Optoelectronics Tech) at four different combinations of fluence rate and irradiation time in four treated groups. The total radiant exposure dose (i.e., fluence rate times irradiation time) in all four groups, however, are kept the same (113 J/cm2). In our investigation, PDT treatments were performed within the time interval of 3h-4.3 h post-administration, according to the peak of PS accumulation in ear region shown in Fig. 2(b). This arrangement is to maintain PS concentration a constant during PDT treatment. As such fluence rate is the only variable between different treatment groups, which facilitates the quantitatively investigation of PDT efficacy as a function of fluence rate. Further details will be discussed in Section 2.5 and Section 3. The 690 nm wavelength of the PDT laser source was validated using a spectrometer (Model USB4000, Ocean Optics), and the fluence rate was monitored via a photodiode power sensor (Model PD300, Ophir Optronics). A liquid core optical fiber (core diameter 5 mm; NA 0.5) was applied to transmit laser beam to the ear surface. The distance between the ear surface and the output of the fiber was kept at 1 mm, leading to a light spot on the surface of the ear bigger than that of the uncovered region of the ear. Given that mice ears are considerably thin and tend to get dehydrated when exposed to a strong laser irradiation, ultrasonic coupling agents were applied on the exposed ear surface to avoid burn injuries during PDT treatment. After treatment, the covered tape was removed from the mice ears for the subsequent photoacoustic imaging.
Fig. 3.
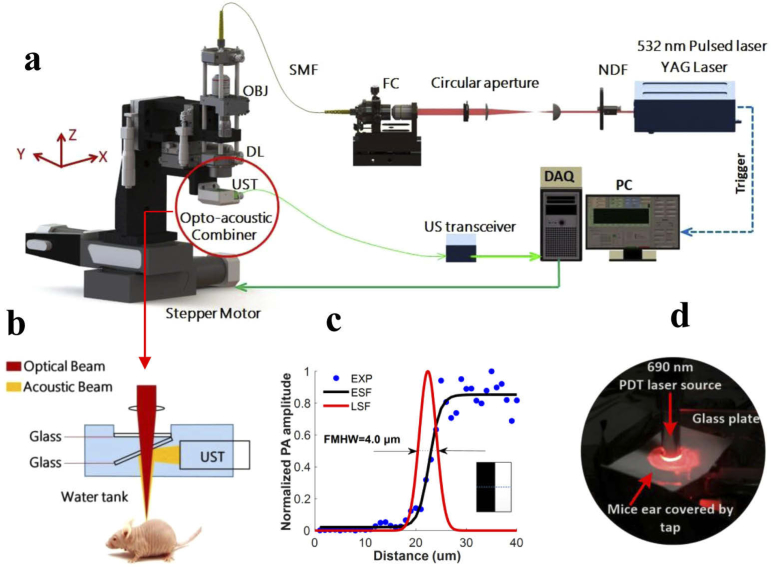
An overview of the experimental setup. (a) The schematic diagram of the custom-built OR-PAM System. NDF, neutral density filter; FC, fiber coupler; SMF, single-mode fiber; OBJ, objective; DL, doublet lense; UST, ultrasonic transducer; DAQ, acquisition card; PC, personal computer. (b) Detailed view of the optical-acoustic beam combiner. (c) Lateral resolution measurement on a metallic blade edge. (d) A photograph of PDT treatment on a mice ear.
2.4. Photoacoustic imaging system
The schematic diagram of a custom-built OR-PAM is shown in Fig. 3(a). Briefly, a nanosecond-pulsed laser source (Nd:YAG, GKNQL-532-4-20, Beijing Guoke Laser Co., Beijing, China) was used to provide 532 nm laser pulses with a repetition rate of 2 kHz. The laser beam was reshaped by a circular aperture and coupled into a signal mode fiber, the output of which was collimated by a microscope objective (PLN4X, Olympus, NA: 0.1), and then focused by a doublet lense (AC080-030-A-ML,Thorlabs, New Jersey, USA) to provide an incident focal spot on the surface of the mice ear and excite photoacoustic signal. An opto-acoustic combiner was used for the coaxial and confocal alignment between optical and acoustic beams. The photoacoustic signals excited by the laser beam were reflected by a thin glass in the combiner due to the mismatched acoustic impedances between the thin glass and surrounding water. A detailed schematic of opto-acoustic combiner is provided in Fig. 3(b). The acoustic signals reflected by the thin glass were then detected by a signal element ultrasonic transducer (25 MHz central frequency, V324-SM, Olympus, Japan). An electrical amplifier integrated in the US transceiver (5073PR, Olympus, Japan) was employed to amplify the photoacoustic signals by 39 dB. We used a 2-channel data acquisition (DAQ) card (CSE1422; Gage Applied Technologies Inc., Lockport, New York) to digitize the photoacoustic signal at a sampling rate of 200 MS/s. A 2-axis motorized translation stage (PLS-85, Physik Instrumente, Germany) controlled by Labview system (2011, National Instruments, TX, USA) was applied to drive the entire head to mechanically scan over the target region. The lateral resolution of OR-PAM was assessed via the line spread function (LSF) of a sharp metallic blade edge, and the resolution was measured to be ∼4 µm by calculating the full-width at half-maximum (FMHW) of the derivative of the LSF [Fig. 3(c)]. The axial resolution was around 100 µm for the 25 MHz transducer with -6 dB bandwidth. The system scanned in two orthotropic directions within the same horizontal plane, one in the direction between adjacent A-lines, and another in the direction between adjacent B scans. The scan in the A-line direction was continuous and had a speed of 10 mm/s while the scan in the B-scan direction was step by step with a step size of 10 µm. For scanning a 6×6 mm2 region of interest, the total imaging time was approximately 13 min and the B-scan rate was 0.83 Hz. The scanning range fully covered the circular treatment area (diameter of 3.5 mm). The fluence of photoacoustic imaging on the tissue surface was around 4.0 mJ/cm2 (2.3 µm beam spot size at tissue surface), measured using a power sensor (S121C, Thorlabs, New Jersey, USA), which is well below the maximum permissible exposure standard (20 mJ/cm2 at wavelength of 532 nm) allowed by American National Standard Institute. The signal-to-noise ratio (SNR) was calculated to be around 17.75 when above laser fluence is applied. The SNR is defined as the ratio of the maximal intensity of vascular signals to the average intensity of background noises in the region of interest. Table 2 (Appendix E) summarizes the parameters of the two lasers employed in this study, one for photoacoustic imaging and one for PDT treatment, which are portrayed in Figs. 3(a) and 3(d), respectively.
It is to be noted that there are generally three typical implementations of photoacoustic imaging, including photoacoustic computed tomography (PACT), acoustic resolution photoacoustic microscopy (AR-PAM) and OR-PAM, which allow the spatial resolution to be scaled with the desired imaging depth [24,30,31]. We applied OR-PAM in this study as it provides optical contrast at micron-scale spatial resolution, which enables the subtle changes of blood vessels to be monitored and the biological responses of PDT to be revealed at micron scale. However, OR-PAM is only suited for the visualization at low imaging depths (∼1 mm), such as the ear regions of mice used in this study. For deeper regions, especially when large tumors are involved in PDT treatment, AR-PAM and PACT would be more suitable as they offer the imaging depth ranging from millimeters to several centimeters, and accordingly the lateral spatial resolution generally scales from dozens to hundreds of microns for above depths.
2.5. PDT experimental design
Table 1 illustrates the PDT experimental design used in this study. To validate that PS or PDT light alone does not generate the photodynamic effect, two control groups were employed, one was treated with only PDT light (690 nm) and the other with only PS. In regards to PDT treatment groups, four experimental groups were treated with both PS and PDT light. The total light dose for all four groups was the same and fixed at 113 J/cm2. The differences among each group were fluence rate and treatment time. The fluence rate ranged from 47 mW/cm2 to 876 mW/cm2 as shown from PDT 1 to PDT 4 in Table 1. The purpose of the arrangement is to quantitatively investigate the dependence of PDT efficacy on fluence rate. Photoacoustic imaging was applied to all treatment and control groups after PDT. Each PDT treatment group has three mice for statistical analysis. Among them, two mice were monitored with photoacoustic imaging for 5 days in each group. Since the strongest injuries occur on day 2, as will be discussed in Section 3.1, the third mouse in each group was monitored only on pre-PDT and day 2 with results provided in Fig. 11 (Appendix D). This yields a total number of three mice with photoacoustic imaging results on day 2 post-PDT in each treatment group as will be shown by the statistical results in Fig. 5. Among the two mice of 5-days tracking in each treatment group, one mouse was used for continuous long term monitoring (15 days).
Table 1. Experimental arrangement of different groups and corresponding observing periods.
| Group | BPD (mg/kg) | F a (mW/cm2) | △t b | D c (J/cm2) | No. of animals |
||
|---|---|---|---|---|---|---|---|
| Pre+5 days Post | Pre+2 days Post | Pre+15 days Post | |||||
| PDT 1 | 0.75 | 47 | 40 min | 113 | 1 | 1 | 1 |
| PDT 2 | 0.75 | 126 | 15 min | 113 | 1 | 1 | 1 |
| PDT 3 | 0.75 | 314 | 6 min | 113 | 1 | 1 | 1 |
| PDT 4 | 0.75 | 876 | 2 min9s | 113 | 1 | 1 | 1 |
| Control 1 | N/A | 47 | 40 min | 113 | NA | 1 | NA |
| Control 2 | 0.75 | N/A | N/A | N/A | NA | 1 | NA |
F, fluence rate on the surface of targets, measured from the fiber output and then multiplied by an approximate factor of 0.74, to account for the light attenuation in ultrasonic coupling agent and the light blocked by the round tape boundary, as shown in Fig. 3(d).
△t, treatment time;
D, total light dose.
Fig. 5.
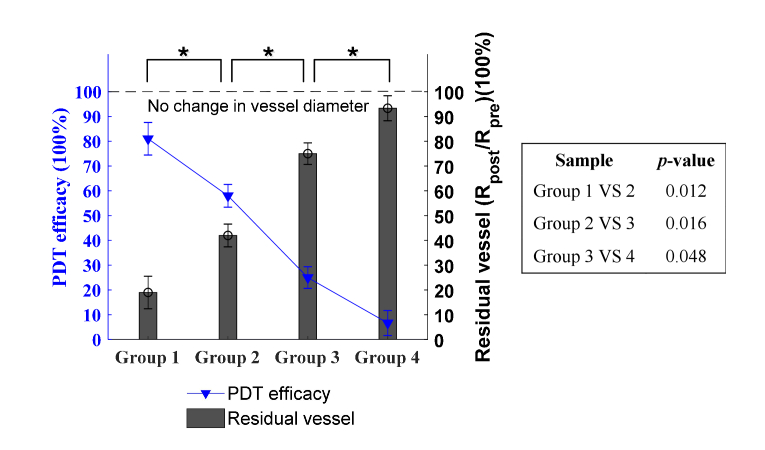
Quantitative analysis of PDT efficacy and residual vessel as a function of fluence rate (based on the strongest injuries on day 2 post-PDT). Blue line: the efficacy of PDT. Histogram: the residual vessel in diameter, quantified by Rpost/Rpre. Error bars: standard deviation (3 mice in each group). , p<0.05. The right table shows the specific p-values between groups, indicating the statistical difference. The PDT efficacy (ΔR/Rpre) and residual vessel (Rpost/Rpre) have the same p-value results.
We used mice ears instead tumor models for the investigation of the fluence rate effect, because tumors with biological complexity may introduce the divergence of the tumor depth/size between different mice and affect the fluence rate inside the tumor, which may ultimately influence the determination of fluence rate effect and the quantification of its effective range. As a contrast, the ear skins of mice are suitable to provide a consistent environment and a uniform receiving of optical illumination, so as to guarantee the fluence rate to be the only variable between different mice, which helps remove the considerable difference of the tissue depth/size/shape and the optical scattering variance between all groups.
2.6. Photoacoustic data processing
The raw 3D volume data for each animal at each time point acquired by photoacoustic imaging were processed using MATLAB (R2017b) to show the maximum amplitude projection (MAP) image. An imaging processing algorithm developed earlier in our group [32] was applied to the MAP image, which enables a readily identification of vascular centerlines and vessel walls. The diameters of all vessels were then calculated. Detailed description of the algorithm and processing procedures can be found in our previous publications [32,33]. In the calculation of PDT-induced vascular destruction, vessel change was quantified using the average value of diameter reductions at randomly selected positions (at least 10 positions) in the PDT treated ear region, so as to assess the magnitude of PDT efficacy in destructing vasculature.
3. Results and discussion
3.1. PDT-induced vascular damage at different fluence rates
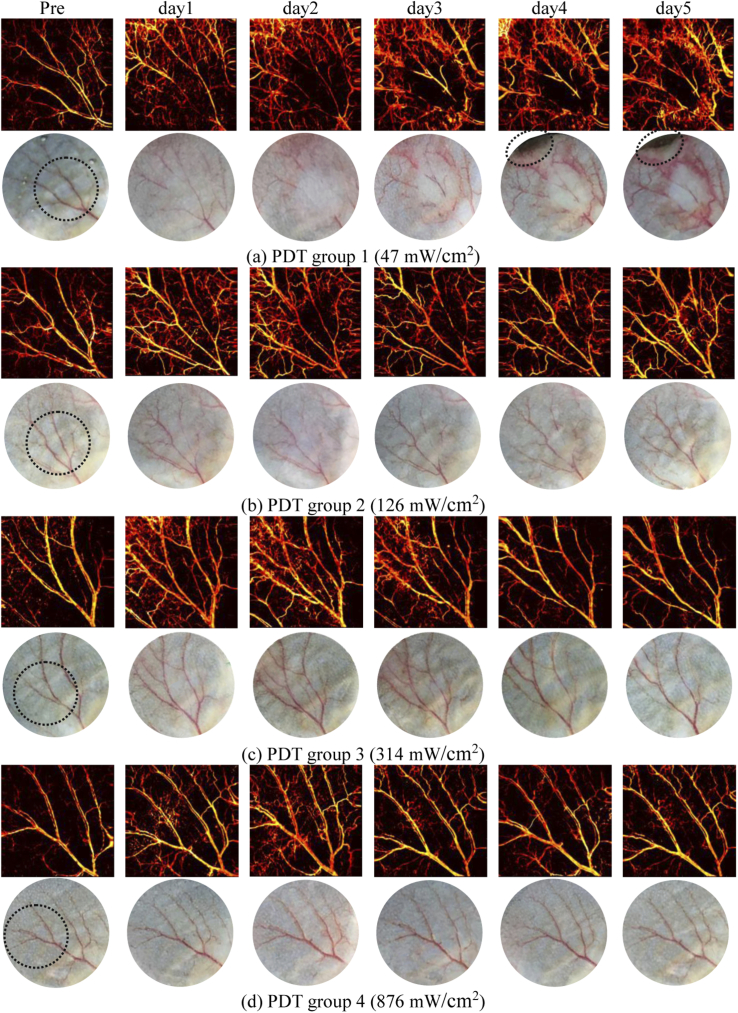
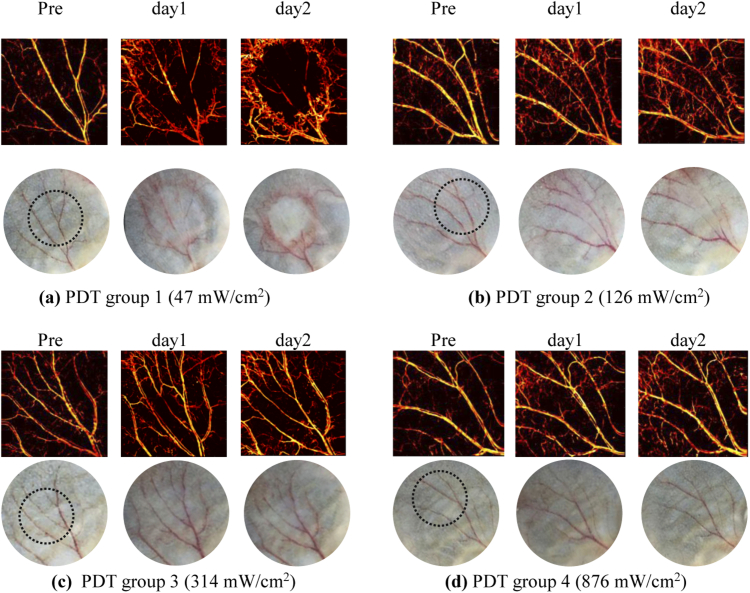
During experiments, no obvious damage of vessels in response to PDT was observed immediately after treatment in all groups, as shown in Fig. 9 (Appendix B) where the representative photographs are provided. Thus we performed OR-PAM imaging of blood vessels prior to, and 1, 2, 3, 4 and 5 days post-PDT to evaluate the development of vascular damage as a function of time. The MAP images of vasculature in ears were obtained and displayed in Fig. 4 for different groups and different days, and photograph-monitored changes of vessels are also presented for reference. Each group shows one representative mouse. The round circle in the photograph of pre-condition shows the specific region treated with PDT light irradiation and the rest ear region was covered with tapes (Fig. 8 in Appendix A). As the vascular destruction occurs at the irradiation region and nearby, while the vasculature farther away at the covered region remains unchanged, the covered untreated ear region also performs as an indicator for system calibration between different days. As shown in Fig. 4, photodynamic reaction induces vascular destruction of different magnitudes for different groups. For group 1 and 2 treated with lower fluence rates, obvious injuries on major vessels are observed immediately from day 1 post-PDT, as shown in Figs. 4(a) and 4(b) where vessels of the first and second grade are essentially injured at the irradiation region. In contrast, for group 3 and 4 where the fluence rate is higher, the vascular damage is less serious compared with lower fluence rate groups. For all the groups, the vessel destruction tends to display the highest degree on day 2. For group 1 and 2, the blood vessels are almost invisible as shown in the photographs on day 2. However, vasculatures characterized by OR-PAM for the above two groups are still noticeable compared with the photographs, demonstrating the high sensitivity and resolution of photoacoustic imaging as opposed to white light imaging in identifying vascular information. The detailed quantification of PDT efficacy as a function of fluence rate will be demonstrated in Section 3.2.
Fig. 4.
PDT-induced vascular damage in response to fluence rate (5 days tracking) for different groups, characterized by OR-PAM and photograph at different days (Each group shows one representative mouse).
Apart from the destruction of major vessels, the emergence of small capillaries near major vessels is also noted from post-PDT images, which mostly arises from the local inflammatory reaction induced by PDT. According to previous studies [34–36], PDT frequently provokes a strong acute inflammatory reaction at the affected site, which is a protective action launched by the host. The photographs in Fig. 4 show the clinical inflammation signs of redness, composed by an abundance of small capillaries that appear straight away from the first day post-PDT as shown in photoacoustic MAP images. The innate immune system initiates the inflammation reaction to restrain the disrupted homeostasis, eliminate dead and damaged cells, and promote local healing to reinstate tissue function [37]. This, in turn, gives rise to the recovery of PDT-induced damage. Accordingly, our results show the restoring of injured vessels as a result of local healing, as can be noted from the regaining of major vessels from day 3 to day 5 post-PDT among all the groups in Fig. 4. It is worth noting that some vascular damage are permanent while some are not. The degree of recovery varies with different fluence rates, and the relevance between permanent damage and fluence rate will be analyzed in Section 3.3. In addition, as can be seen from group 1, tissue damage was also found at distal location relative to PDT treated area (i.e., ear boundary) from day 4, the mechanism of which will be discussed in Section 3.3.
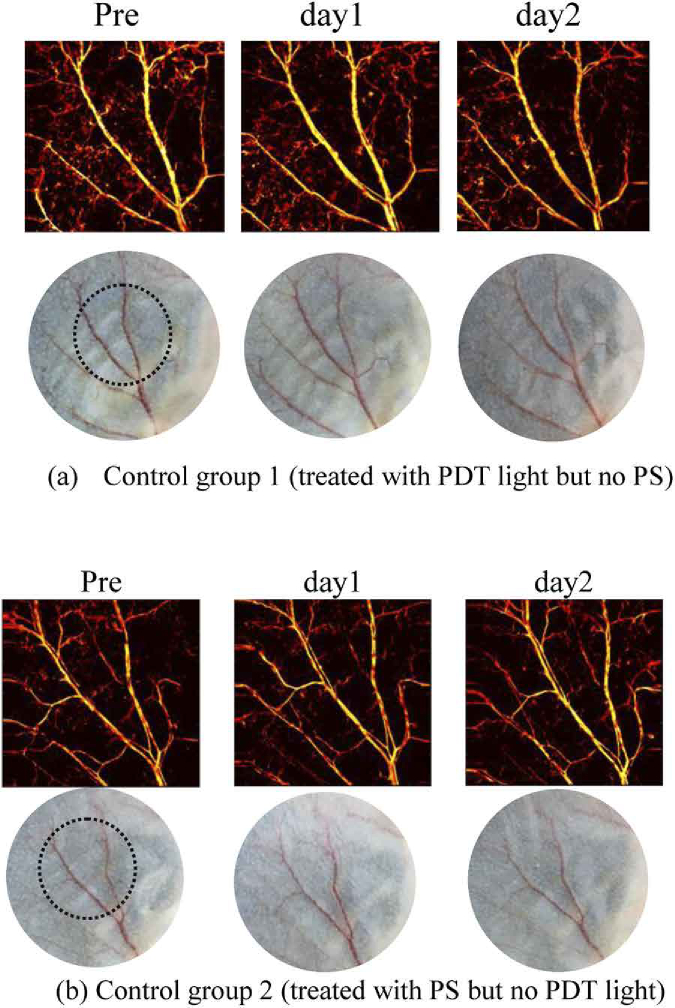
Figure 10(a) in Appendix C displays the photoacoustic imaging results of control group 1 where mice ears were treated with only PDT light and no intravenous administration of PS. The laser fluence rate and irradiation time in this group, as illustrated in Table 1, are the same as PDT group 1 where the strongest vascular damage occurs. In such a case, if there is no damage caused by fluence rate in group 1, it can be concluded that fluence rate in other groups clearly would not lead to any vessel injures when no PS is administrated. The vasculature conditions were monitored at Pre-PDT, and post conditions at day 1 and day 2 when usually the strongest injuries occur. As can be observed from Fig. 10(a), no observable injuries to vasculature or tissue appear in control group 1 after laser irradiation throughout 2 days of observation. This, in turn, proves that the damage in all PDT treated groups as shown in Fig. 4 comes from the photodynamic effect instead of any laser burn of the 690 nm irradiation.
The photoacoustic imaging results of control group 2 are shown in Fig. 10(b) (Appendix C), where the mice were injected intravenously with PS but without 690 nm continuous laser irradiation. Compared with the pre-condition, there is no noticeable damage to vasculature or tissue from post-PDT results on both day 1 and day 2. The results indicate that the pulsed laser of 532 nm used in photoacoustic imagining has a negligible PDT treatment effect, which is presumably due to the following reasons. Firstly, the absorbance of BPD at 532 nm is much lower than 690 nm, thus BPD is less activated by this wavelength compared with 690 nm. Secondly, due to 10 mm/s mechanical scanning speed of the laser beam spot during photoacoustic imaging, there is a lack of adequate response time for photodynamic mechanism to take noticeable effect at each local point at ear region. Thirdly, the short pulse duration (around 15 ns) and low pulse energy (around 200 µJ) also account for the low PDT effect. In fact, the conclusion that 532 nm irradiation has negligible effect on PDT efficacy can also be deduced from PDT group 4, because the laser source of 690 nm and 532 nm were both applied to mice ear in group 4 for PDT treatment and for photoacoustic imaging, respectively, and there were no evident vessel injures throughout 5 days of observation. These results positively verify that 532 nm pulsed laser during photoacoustic imaging does not generate noticeable effect on vascular destruction.
After ruling out the possibility that the vascular damage shown in Fig. 4 are caused by laser burn of 690 nm irradiation, or result from the PDT effect induced by the 532 nm pulsed laser of OR-PAM, it can be concluded that the effect of vascular injuries in our results only comes from photodynamic reaction. This allows us to focus on the fluence rate of 690 nm irradiation in modulating the PDT mechanism, without considering any offsets caused by other mechanisms.
3.2. Fluence rate dependence of PDT
In order to quantify the therapeutic outcome of PDT, the photoacoustic imaging data on day 2, when the strongest vascular damage occurs, were applied for the quantitative analysis of PDT-induced vascular damage. Note that only the destruction of major vessels, i.e, vessels of the first and second grade, was analyzed. The small capillaries were not considered to avoid the confusion of mechanisms between inflammations and PDT, as both has impacts on changes of small capillaries. The results of residual vessel diameter Rpost/Rpre were quantified under different fluence rates and the efficacy of PDT in destructing vessels was calculated as the change in vessels (ΔR/Rpre), which equals 1-Rpost/Rpre. These two quantities as a function of fluence rate are displayed in Fig. 5, where the blue line indicates the efficacy of PDT, and histogram characterizes the residual vessels (Rpost/Rpre). The error bars represent the standard deviation with 3 mice in each group. Clearly, a high fluence rate of laser irradiation diminishes and inhibits the therapeutic effect of PDT, and a low fluence rate promotes the efficacy. There is no overlap between different groups, and a statistical significant difference (p < 0.05) is observed between all adjacent groups in Fig. 5, demonstrating an evident role of fluence rate in quantitatively modulating PDT efficacy in destructing vasculature. When fluence rate reaches 876 mW/cm2, the vascular-acting PDT causes almost no damage to blood vessels and the PDT practically displays no effect, which is consistent with the oxygen depletion theory of PDT proposed by Foster et al [38]. This is because a high fluence rate leads to a fast consumption of oxygen, which eventually exceeds the replenish rate provided by the oxygen diffusion from surrounding vasculature [38,39]. On the contrary, when the fluence rate decreases to 47 mW/cm2, as shown in Fig. 5, nearly 80% of vessels are destructed, giving rise to the PDT therapeutic effectiveness of 80%. The light fluence rate in this case (47 mW/cm2) allows a sustainable consumption rate of oxygen for photodynamic reaction to take effect.
In this study, lower fluence rates (< 47 mW/cm2) could be investigated. However, a lower fluence rate corresponds to an even longer treatment time to maintain the total light dose as a constant. As discussed in Section 2.2, PDT treatment needs to be conducted within 3h-4.3 h post-administration to ensure a stable level of PS concentration at ear region during the treatment period. Otherwise, two variables would exist in the study, including both PS concentration and fluence rate. Therefore, no groups with lower fluence rate were included in this study. The fluence rate is guaranteed to be the only variable so as to fulfill the goal of modulating PDT through fluence rate. It is worth mentioning that in the study of Henderson et al. [5], a fluence rate limit of 7 mW/cm2 was proposed, beyond which the PDT efficacy starts to decrease. It was speculated that at such low fluence rates, the repair of sublethal damage should override the effect of PDT treatment. However, such a study was evaluated based on animal cure rate of a murine colon carcinoma model, and no details were found in this study on how the variable of PS concentration was controlled at such low fluence rates.
3.3. Self-healing and long-lasting damage
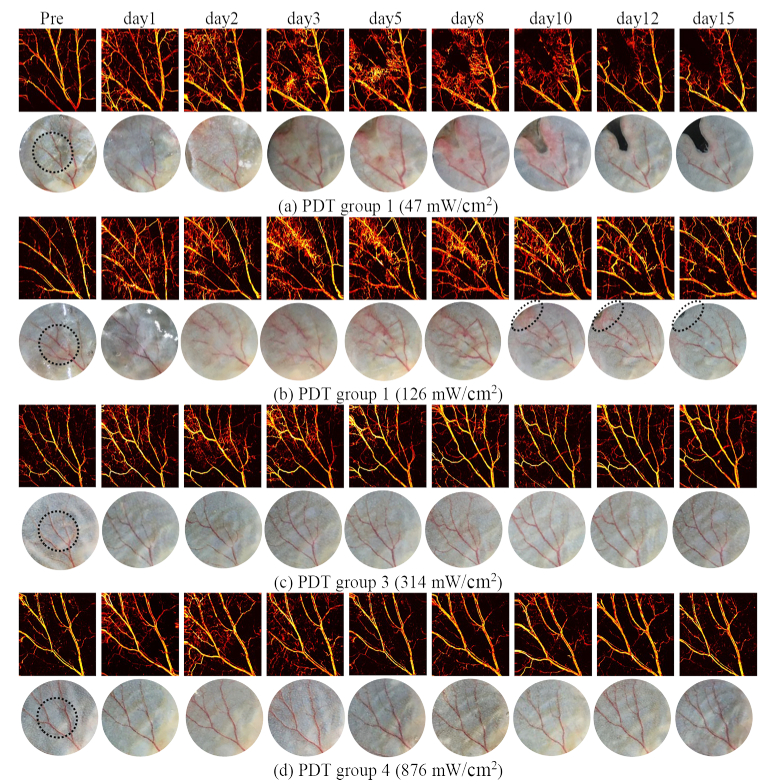
As discussed in Section 3.1, the inflammatory/immune responses promote the local healing and induce the recurrence of the injured vasculature. As such, this section is to assess the level of self-healing and to identify permanent vascular damage as a function of fluence rate. The results in Fig. 4 show that the five days post-PDT monitoring may not be sufficient to capture the entire healing process, particularly for group 1 and 2 in which the vascular recovery is still ongoing. Therefore, we performed a long-term (15 days) tracking of the dynamic variation of PDT-treated vasculature, the results for selected days during the tracking process is presented in Fig. 6. The inflammation reaction faded away in the subsequent days and disappeared on day 15 for all groups, as indicated by both photoacoustic images and photographs, which suggests that day 15 is the proper time to evaluate the long-lasting damage as the dynamic variation of vasculature almost reaches a steady state.
Fig. 6.
Long term (15 days) tracking of PDT-induced vasculature damage for different fluence rate groups, characterized by OR-PAM and photograph at different days.
As shown in Figs. 4 and 6, the damaged vasculature normally starts to restore from day 3 or 4 post-PDT. For PDT with high fluence rates such as in group 3 and 4, the subsequent restoration allows the vasculature gradually return towards the pre-conditions, suggesting a low level of permanent damage and therefore a low PDT efficacy for vascular damage. As opposed, for mice treated with lower fluence rates such as in group 1 and 2, the destructed vessels have not been fully recovered, and disconnections in the vessels can still be observed on day 15, which demonstrates long-lasting destruction. In group 1 where the laser irradiation was delivered at the lowest rate, the vasculature destruction becomes more serious on day 15 compared with day 2, and the two injured vessels have almost vanished. This progressive damage occurs in conjunction with the tissue necrosis that appears at the ear boundary as depicted by the photographs, the mechanism of which will be discussed later in this section.
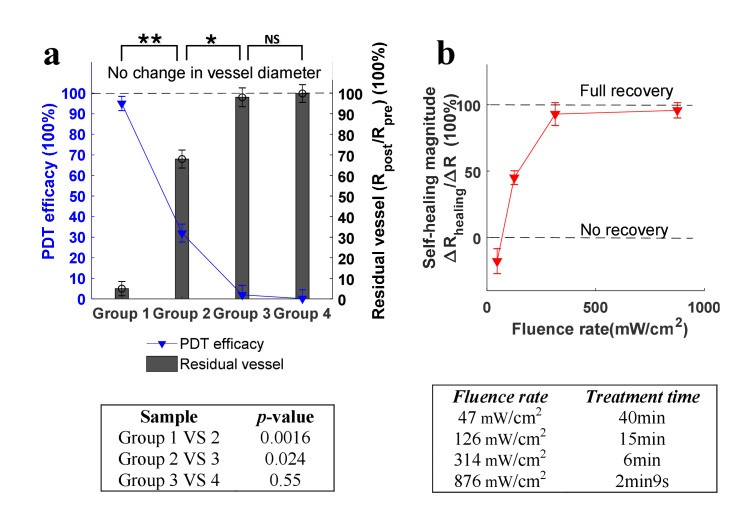
In order to characterize the relationship between the long-lasting vascular destruction and the fluence rate, the same quantification procedures of vascular diameter described in Section 3.2 is applied here. The vessel diameter change ΔR on day 15 compared to pre-PDT is calculated to assess the long-lasting damage. Vascular destruction at day 15 post PDT is considered permanent. Figure 7(a) shows the quantification results, from which it can be seen the correlation between the long-lasting PDT efficacy and fluence rate is similar to that in shown Fig. 5. The extent of permanent vascular destruction decreases with fluence rate. Meanwhile, Fig. 7(a) displays a much lower threshold of fluence rate for permanent damage to occur. The fluence rate needs to be lower than 314 mW/cm2 for PDT to take permanent effect, compared with 876 mW/cm2 shown in Fig. 5, the difference of which is due to the local healing mechanism. The results show that PDT induces no long-lasting therapeutic effect when fluence rate approaches 314 mW/cm2 and higher, as no significant statistical difference is noted between group 3 and 4 (p>0.05) compared to other adjacent groups (Group 1 versus 2, p<0.01; Group 2 versus 3, p<0.05) where significant statistical differences are observed. The above findings emphasize the need for caution in clinical settings when choosing the suitable fluence rate for the destruction of tumor vasculature in cancer treatments, as the lower fluence rate range is evidently a better choice for permanent damage. The ‘no permanent damage’ range (314 mW/cm2 to ∞), on the other hand, is highly required in other applications, for example, when PDT is applied in opening the blood brain barrier (BBB) to facilitate the delivery of therapeutic agents [40–42] without causing permanent damage to brain. Although the fluence rate range needs to be tailored for different target depths, photosensitizer types and concentrations, etc, our results provide a qualitative estimation of fluence rate range for both no permanent damage and effective destruction on vasculatures during PDT.
Fig. 7.
Quantitative analysis of PDT responses after 15 days of treatment (a) Permanent vascular change and PDT efficacy as a function of fluence rate (vascular destruction at day 15 post PDT was considered permanent). Blue line: the efficacy of PDT. Histogram: the residual vessel in diameter, quantified by Rpost/Rpre. Error bars: standard deviation (from 3 sets of random sampling statistics, each sampling contains 10 random positions in treated ear region). , p<0.05; , p<0.01; NS, not significant. The table below shows the specific p-values between groups, indicating the statistical difference. The PDT efficacy (ΔR/Rpre) and the residual vessel (Rpost/Rpre) have the same p-value results. (b) Self-healing magnitude as a function of PDT fluence rate based on the results of day 15 Post-PDT. Total light dose (fluence rate times treatment time) was maintained at a constant (113 J/cm2), as shown by the table below. Error bars: standard deviation.
In addition to vascular injures, PDT treatment also gives rise to tissue destruction as depicted in the photographs of Fig. 6(a). It should be noted that the region of tissue destruction is not at the PDT treated area, as indicated by the round circle in the photograph on the day of Pre-PDT in Fig. 6(a) and Fig. 8 (Appendix A). Hence we rule out the possibility of direct PDT-induced tissue destruction. The destruction is presumably due to the ischemic necrosis of tissue, as the PDT-damaged major vessels act as the blood supply chain of the affected tissue region. It can be inferred from Figs. 4 and 6 that a low fluence rate of PDT (47 mW/cm2) is more likely to bring about tissue necrosis. This tendency is mostly due to the fact that the severity of ischemic necrosis is dependent on the extent of damage on the vascular circulatory system. The above results indicate that in clinical practices, the improved PDT effectiveness with low fluence rates may need to be counterbalanced by reducing the total light dose to avoid unnecessary tissue destruction as a result of the ischemic necrosis.
It should be noted that the two effects, namely the tissue necrosis and the vascular damage, interact with each other. For one thing, a severe vascular destruction gives rise to the ischemic necrosis of tissue. For another, the tissue apoptosis tends to further worsen the condition of vascular injuries as it eliminates the vascular network on the affected localized tissue. Despite that the vasculature attempts to recover with acute inflammation responses as depicted on day 3 and day 4 in Fig. 6(a), it cannot restore or resist the development of tissue necrosis, but the condition of which tends to become worse over time, which justifies the results that the vascular destruction on day 15 is more serious than day 2. To gain a quantitative insight into the self-healing as a function of fluence rate, we define the self-healing magnitude as the absolute recovery extent ΔRhealing (the difference between day 2 and day 15) normalized by the original vascular damage ΔR (the difference between pre and day 2). The self-healing magnitude indicates how much the vasculature restored from day 2, when the most serious vascular damage occurred. The data processing algorithm described in Section 2.6 is applied here again. As shown in Fig. 7(b), the self-healing magnitude demonstrates a positive correlation with fluence rate. When the fluence rate is around 47 mW/cm2, the self-healing magnitude exhibits a negative value because the vascular damage is inclined to get worse along with the development of tissue apoptosis. When the fluence rate increases to 126 mW/cm2, the PDT-induced injured vasculature starts to demonstrate recovery at the affected area, but only restores to a certain level and then reaches a steady-state with further days of observation. This leads to some permanent vascular destruction shown in Fig. 6(b). With further increase of fluence rate to 314 mW/cm2 and 876 mW/cm2, the previously damaged vasculature tends to fully recover to the pre-PDT condition [Figs. 6(c) and 6(d)]. As shown in Fig. 7(b), the self-healing magnitude starts to flat when the fluence rate reaches 314 mW/cm2, indicating that additional increase of fluence rate no longer influence the self-healing magnitude of PDT-induced vascular injures, as the damaged vessels practically recuperate to the pre-PDT conditions anyhow beyond 314 mW/cm2. The above results reveal a key role of fluence rate in manipulating the self-healing magnitude of PDT-induced vascular destruction.
4. Conclusions
In this study, we quantitatively investigated the therapeutic effects of PDT as a function of fluence rate by using OR-PAM. To the best of our knowledge, this is the first time that the fluence rate dependence of PDT efficacy is investigated with imaging technology at microscopic scale, as opposed to examination based on animal survival ratio or tumor size presented in previous studies. The microscopic investigation enables the subtle biological responses to PDT, including vascular changes, self-healing responses and the ischemic necrosis of tissue, to be studied. Moreover, this study offers the longest continuous angiography (15 days) in response to PDT fluence rate, which is significant to thoroughly investigate the fluence rate effect in governing long-lasting PDT therapeutic reactions.
The results of our study suggest that PDT efficacy exhibits a negative correlation with respect to light delivery rate, i.e., a high fluence rate diminishes therapeutic effect while a low fluence rate enhances the effect. The ischemic necrosis of tissue, which is a secondary result of vascular destruction, is influenced by fluence rate in an analogous manner: a low fluence rate (around 47 mW/cm2) gives rise to severe tissue destruction, and a high fluence rate (≥314 mW/cm2) causes minimal tissue destruction. A long term (15 days) track of vasculature damage was conducted for the evaluation of long-lasting PDT effects in response to fluence rate. The results show a similar fluence rate tendency as compared to the vascular damage at the earlier time point (day 2), but with a much wider range of fluence rate (from 278 to ∞) where practically no permanent damage occurs, which is due to the self-healing response of vasculature in the affected region. In particular, we quantitatively examined the correlation between the self-healing magnitude of vasculature and fluence rate based on 15 days monitoring. The results reveal a positive correlation between the self-healing magnitude and fluence rate, indicating that vessels treated with high PDT fluence rates are more likely to recover, and vascular injuries induced by low PDT fluence rates (≤126 mW/cm2) are more likely to be permanent. There exists a turning point of fluence rate (314 mW/cm2), above which PDT practically produces no permanent therapeutic effect and the damaged vessels can fully recover within 15 days. These findings have practical significance in clinical settings. For example, for treatments of cancer-related diseases, the ‘effective fluence rate’ is useful to provoke permanent destruction of tumor vasculature. Likewise, the ‘non-effective’ fluence rate range is highly needed when PDT is applied in opening the blood brain barrier, as it helps avoid permanent brain injuries when PDT is used to deliver therapeutic drugs through BBB. These findings have not been noted in previous PDT studies.
During the course of a long term examination of biological reactions in response to the injured vasculature, this study reveals the role of fluence rate in governing the ischemic necrosis of tissue and modulating the magnitude of self-healing. Moreover, photoacoustic imaging has been demonstrated as an effective evaluation method in this paper for the assessment of PDT dosage responses owning to the merits of noninvasive and label-free imaging.
Appendix A.
The ear region for PDT irradiation characterized by photograph for all mice used in this study.
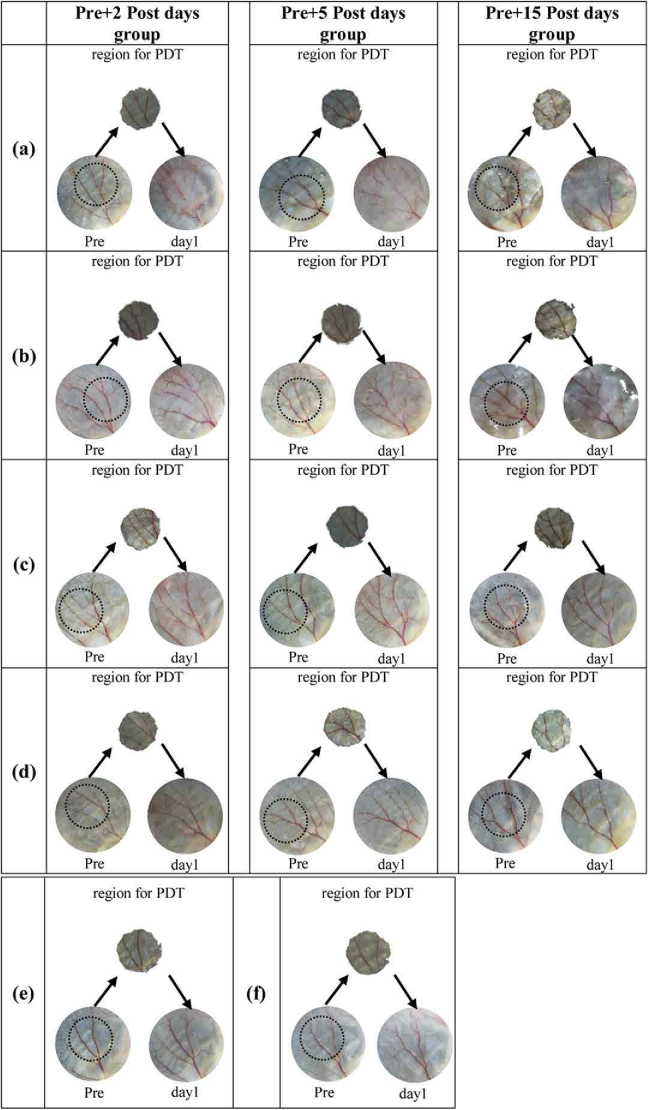
Fig. 8.
The ear region for PDT irradiation characterized by photograph for all mice used in this study. The photographs of Pre condition, treatment region and day 1 post-PDT are shown for each mouse to verify the treatment area, where the round black circle in Pre-condition indicates the region for PDT irradiation, and matches the tape hole area (region for PDT).(a) PDT group 1 (fluence rate of 47 mW/cm2) (b) PDT group 2 (fluence rate of 126 mW/cm2); (c) PDT group 3 (fluence rate of 314 mW/cm2); (d) PDT group 4 (fluence rate of 876 mW/cm2). Each PDT group has three mice for statistical analysis, corresponding to three observing periods, including 2 days, 5 days and 15 days post PDT. (e) Control group 1 (mice treated with only light); (f) Control group 2 (mice treated with only PS).
Appendix B.
The photographs of mice ear vasculature before and immediately after PDT treatment.
Fig. 9.
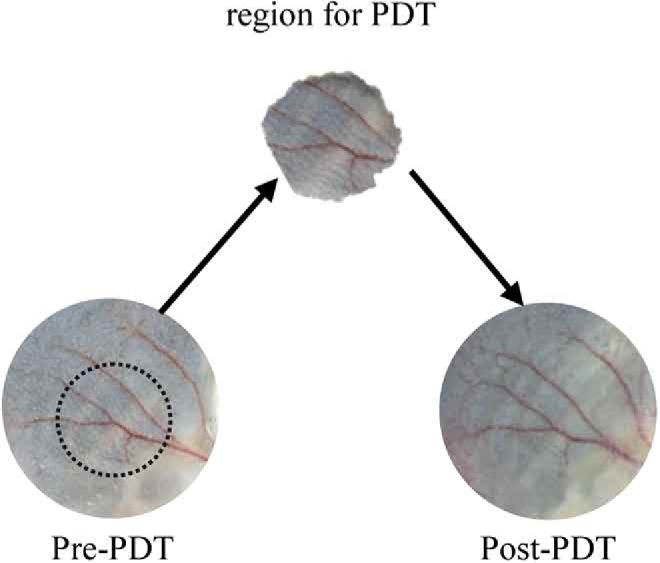
The photographs of mice ear vasculature before and immediately after PDT treatment. The mouse was treated with fluence rate of 47 mW/cm2, and no obvious destruction were noted immediately after PDT treatment.
Appendix C.
Vasculature tracking of two control groups, characterized by OR-PAM and photograph at different days.
Fig. 10.
Vasculature tracking of two control groups, characterized by OR-PAM and photograph at different days. The vasculature conditions were monitored at Pre-PDT, and post condition at day 1 and day 2 when usually the strongest injuries occur. Control group 1 was treated with PDT light (690 nm) without PS. Control group 2 was treated with PS without 690 nm irradiation. Photoacoustic imaging light (532 nm) was applied to mice in both control groups and PDT treatment groups, thus control group 1 is to evaluate the vascular injuries from light alone (PDT light 690 nm and photoacoustic light 532 nm), and control group 2 is to assess the PDT effect caused by the photoacoustic light at 532 nm.
Appendix D.
PDT-induced vascular damage in response to fluence rate (2 days tracking)
Fig. 11.
PDT-induced vascular damage in response to fluence rate (2 days tracking) for different groups, characterized by OR-PAM and photograph at different days (Each group shows one representative mouse).
Appendix E.
The parameters of the two lasers used in this study
Table 2. The parameters of the two lasers used in this study, YAG (GKNQL-532-4-20) for photoacoustic imaging, and laser diode (Model MRL-III) for PDT treatment, corresponding to the experimental setups in Figs. 3(a) and 3(d), respectively.
| Laser source | Purpose | Wavelength | Type |
|---|---|---|---|
| YAG (GKNQL-532-4-20) | Photoacoustic imaging | 532 nm | Pulsed |
| Laser diode (Model MRL-III) | PDT treatment | 690 nm | Continuous wave |
Funding
China Postdoctoral Science Foundation10.13039/501100002858 (2019M653128); National Natural Science Foundation of China10.13039/501100001809 (61705139, 81927807, 91739117); Chinese Academy of Sciences10.13039/501100002367 (2019352, GJJSTD20180002, YJKYYQ20190078); Science, Technology and Innovation Commission of Shenzhen Municipality10.13039/501100010877 (JCYJ20170413153129570); CAS Key Laboratory of Health Informatics (2011DP173015); Guangdong Provincial Key Laboratory of Biomedical Optical Imaging (2020B121201010); Shenzhen Key Laboratory for Molecular Imaging (ZDSY20130401165820357).
Disclosures
The authors declare that there are no conflicts of interest related to this article.
References
- 1.Boehncke W. H., Elshorst-Schmidt T., Kaufmann R., “Systemic photodynamic therapy is a safe and effective treatment of psoriasis,” Arch. Dermatol. 136(2), 271–272 (2000). 10.1001/archderm.136.2.271 [DOI] [PubMed] [Google Scholar]
- 2.Trauner K. B., Hasan T., “Photodynamic treatment of rheumatoid and inflammatory arthritis,” Photochem. Photobiol. 64(5), 740–750 (1996). 10.1111/j.1751-1097.1996.tb01829.x [DOI] [PubMed] [Google Scholar]
- 3.Barr H., “Barrett’s Esophagus: Treatment with 5-Aminolevulinic Acid Photodynamic Therapy,” Gastrointestinal Endoscopy Clinics 10(3), 421–437 (2000). 10.1016/S1052-5157(18)30114-4 [DOI] [PubMed] [Google Scholar]
- 4.Rockson S. G., Lorenz D. P., Cheong W.-F., Woodburn K. W., “Photoangioplasty : an emerging clinical cardiovascular role for photodynamic therapy,” Circulation 102(5), 591–596 (2000). 10.1161/01.CIR.102.5.591 [DOI] [PubMed] [Google Scholar]
- 5.Henderson B. W., Busch T. M., Snyder J. W., “Fluence rate as a modulator of PDT mechanisms,” Lasers Surg. Med. 38(5), 489–493 (2006). 10.1002/lsm.20327 [DOI] [PubMed] [Google Scholar]
- 6.Zhu T. C., Finlay J. C., “Prostate PDT dosimetry,” Photodiagn. Photodyn. Ther. 3(4), 234–246 (2006). 10.1016/j.pdpdt.2006.08.002 [DOI] [PMC free article] [PubMed] [Google Scholar]
- 7.Finlay J. C., Darafsheh A., “Light Sources, Drugs, and Dosimetry,” Biomedical Optics in Otorhinolaryngology: Head and Neck Surgery 311–336 (2016). 10.1007/978-1-4939-1758-7_19 [DOI]
- 8.Kruijt B., van der Snoek E. M., Sterenborg H. J. C. M., Amelink A., Robinson D. J., “A dedicated applicator for light delivery and monitoring of PDT of intra-anal intraepithelial neoplasia,” Photodiagn. Photodyn. Ther. 7(1), 3–9 (2010). 10.1016/j.pdpdt.2010.01.006 [DOI] [PubMed] [Google Scholar]
- 9.Angell-Petersen E., Spetalen S., Madsen S. J., Sun C.-H., Peng Q., Carper S. W., Sioud M., Hirschberg H., “Influence of light fluence rate on the effects of photodynamic therapy in an orthotopic rat glioma model,” J. Neurosurg. 104(1), 109–117 (2006). 10.3171/jns.2006.104.1.109 [DOI] [PubMed] [Google Scholar]
- 10.Gibson S. L., Vandermeid K. R., Murant R. S., Raubertas R. F., Hilf R., “Effects of various photoradiation regimens on the antitumor efficacy of photodynamic therapy for R3230AC mammary carcinomas,” Cancer Res. 50(22), 7236 (1990). [PubMed] [Google Scholar]
- 11.Foster T. H., Hartley D. F., Nichols M. G., Hilf R., “Fluence rate effects in photodynamic therapy of multicell tumor spheroids,” Cancer Res. 53(6), 1249 (1993). [PubMed] [Google Scholar]
- 12.Henning J. P., Fournier R. L., Hampton J. A., “A transient mathematical model of oxygen depletion during photodynamic therapy,” Radiat. Res. 142(2), 221–226 (1995). 10.2307/3579032 [DOI] [PubMed] [Google Scholar]
- 13.Nichols M. G., Foster T. H., “Oxygen diffusion and reaction kinetics in the photodynamic therapy of multicell tumour spheroids,” Phys. Med. Biol. 39(12), 2161–2181 (1994). 10.1088/0031-9155/39/12/003 [DOI] [PubMed] [Google Scholar]
- 14.Fingar V. H., “Vascular effects of photodynamic therapy,” Journal of clinical laser medicine & surgery 14(5), 323–328 (1996). 10.1089/clm.1996.14.323 [DOI] [PubMed] [Google Scholar]
- 15.Fingar V. H., Kik P. K., Haydon P. S., Cerrito P. B., Tseng M., Abang E., Wieman T. J., “Analysis of acute vascular damage after photodynamic therapy using benzoporphyrin derivative (BPD),” Br. J. Cancer 79(11-12), 1702–1708 (1999). 10.1038/sj.bjc.6690271 [DOI] [PMC free article] [PubMed] [Google Scholar]
- 16.Wilson B. C., Patterson M. S., Lilge L., “Implicit and explicit dosimetry in photodynamic therapy: a New paradigm,” Lasers Med. Sci. 12(3), 182–199 (1997). 10.1007/BF02765099 [DOI] [PubMed] [Google Scholar]
- 17.Sorensen A. G., Emblem K. E., Polaskova P., Jennings D., Kim H., Ancukiewicz M., Wang M., Wen P. Y., Ivy P., Batchelor T. T., “Increased survival of glioblastoma patients who respond to antiangiogenic therapy with elevated blood perfusion,” Cancer Res. 72(2), 402–407 (2012). 10.1158/0008-5472.CAN-11-2464 [DOI] [PMC free article] [PubMed] [Google Scholar]
- 18.Emblem K. E., Mouridsen K., Bjornerud A., Farrar C. T., Jennings D., Borra R. J., Wen P. Y., Ivy P., Batchelor T. T., Rosen B. R., “Vessel architectural imaging identifies cancer patient responders to anti-angiogenic therapy,” Nat. Med. 19(9), 1178–1183 (2013). 10.1038/nm.3289 [DOI] [PMC free article] [PubMed] [Google Scholar]
- 19.Sampath D., Oeh J., Wyatt S. K., Cao T. C., Koeppen H., Eastham-Anderson J., Robillard L., Ho C. C., Ross J., Zhuang G., “Multimodal microvascular imaging reveals that selective inhibition of class I PI3 K is sufficient to induce an antivascular response,” Neoplasia (New York, NY) 15(7), 694–IN4 (2013). 10.1593/neo.13470 [DOI] [PMC free article] [PubMed] [Google Scholar]
- 20.Vakoc B. J., Lanning R. M., Tyrrell J. A., Padera T. P., Bartlett L. A., Stylianopoulos T., Munn L. L., Tearney G. J., Fukumura D., Jain R. K., “Three-dimensional microscopy of the tumor microenvironment in vivo using optical frequency domain imaging,” Nat. Med. 15(10), 1219–1223 (2009). 10.1038/nm.1971 [DOI] [PMC free article] [PubMed] [Google Scholar]
- 21.Attia A. B. E., Balasundaram G., Moothanchery M., Dinish U., Bi R., Ntziachristos V., Olivo M., “A review of clinical photoacoustic imaging: Current and future trends,” Photoacoustics 16, 100144 (2019). 10.1016/j.pacs.2019.100144 [DOI] [PMC free article] [PubMed] [Google Scholar]
- 22.Zhao T., Desjardins A. E., Ourselin S., Vercauteren T., Xia W., “Minimally invasive photoacoustic imaging: Current status and future perspectives,” Photoacoustics 16, 100146 (2019). 10.1016/j.pacs.2019.100146 [DOI] [PMC free article] [PubMed] [Google Scholar]
- 23.Li M., Tang Y., Yao J., “Photoacoustic tomography of blood oxygenation: A mini review,” Photoacoustics 10, 65–73 (2018). 10.1016/j.pacs.2018.05.001 [DOI] [PMC free article] [PubMed] [Google Scholar]
- 24.Wang L. V., Hu S., “Photoacoustic tomography: in vivo imaging from organelles to organs,” Science 335(6075), 1458–1462 (2012). 10.1126/science.1216210 [DOI] [PMC free article] [PubMed] [Google Scholar]
- 25.Maslov K., Ku G., Wang L. V., “Photoacoustic microscopy with submicron resolution,” in Photons Plus Ultrasound: Imaging and Sensing 2010 2010. International Society for Optics and Photonics. [Google Scholar]
- 26.Zhang C., Maslov K. I., Hu S., Wang L. V., Chen R., Zhou Q., Shung K. K., “Reflection-mode submicron-resolution in vivo photoacoustic microscopy,” J. Biomed. Opt. 17(2), 020501 (2012). 10.1117/1.JBO.17.2.020501 [DOI] [PMC free article] [PubMed] [Google Scholar]
- 27.Xiang L., Xing D., Gu H., Yang D., Yang S., Zeng L., Chen W. R., “Real-time optoacoustic monitoring of vascular damage during photodynamic therapy treatment of tumor,” J. Biomed. Opt. 12(1), 014001 (2007). 10.1117/1.2437752 [DOI] [PubMed] [Google Scholar]
- 28.Prahl S., Tabulated molar extinction coefficient for hemoglobin in water, compiled by Scott Prahl (prahl@ ece.ogi.edu) using data from WB Gratzer, Med. Res. Council Labs, Holly Hill, London, UK, and N. Kollias, Wellman Laboratories, Harvard Medical School, Boston, 1999.
- 29.Salvador González, Chitralada Vibhagool, Margaret Sherwood, Thomas, “The phototoxicity of photodynamic therapy may be suppressed or enhanced by modulation of the cutaneous vasculature,” J. Photochem. Photobiol., B 57(2-3), 142–148 (2000). 10.1016/S1011-1344(00)00089-0 [DOI] [PubMed] [Google Scholar]
- 30.Aguirre Hindelang, Andrei Berezhnoi, Darsow, Lauffer, “Assessing nailfold microvascular structure with ultra-wideband raster-scan optoacoustic mesoscopy,” Photoacoustics, 2018. [DOI] [PMC free article] [PubMed]
- 31.Deán-Ben X. L., López-Schier H., Razansky D., “Optoacoustic micro-tomography at 100 volumes per second,” Sci. Rep. 7(1), 6850 (2017). 10.1038/s41598-017-06554-9 [DOI] [PMC free article] [PubMed] [Google Scholar]
- 32.Zhao H., Wang G., Lin R., Gong X., Song L., Li T., Wang W., Zhang K., Qian X., Zhang H., “Three-dimensional Hessian matrix-based quantitative vascular imaging of rat iris with optical-resolution photoacoustic microscopy in vivo,” J. Biomed. Opt. 23(04), 1 (2018). 10.1117/1.JBO.23.4.046001 [DOI] [PubMed] [Google Scholar]
- 33.Zhou H.-C., Chen N., Zhao H., Yin T., Zhang J., Zheng W., Song L., Liu C., Zheng R., “Optical-resolution photoacoustic microscopy for monitoring vascular normalization during anti-angiogenic therapy,” Photoacoustics 15, 100143 (2019). 10.1016/j.pacs.2019.100143 [DOI] [PMC free article] [PubMed] [Google Scholar]
- 34.Agostinis P., Berg K., Cengel K. A., Foster T. H., Girotti A. W., Gollnick S. O., Hahn S. M., Hamblin M. R., Juzeniene A., Kessel D., “Photodynamic therapy of cancer: An update,” CA: A Cancer Journal for Clinicians 61(4), 250–281 (2011). 10.3322/caac.20114 [DOI] [PMC free article] [PubMed] [Google Scholar]
- 35.Castano A. P., Mroz P., Hamblin M. R., “Photodynamic therapy and anti-tumour immunity,” Nat. Rev. Cancer 6(7), 535–545 (2006). 10.1038/nrc1894 [DOI] [PMC free article] [PubMed] [Google Scholar]
- 36.Firczuk M., Nowis D., Gołąb J., “PDT-induced inflammatory and host responses,” Photochem. Photobiol. Sci. 10(5), 653–663 (2011). 10.1039/c0pp00308e [DOI] [PubMed] [Google Scholar]
- 37.Korbelik M., “PDT-associated host response and its role in the therapy outcome,” Lasers in Surgery & Medicine 38(5), 500–508 (2006). 10.1002/lsm.20337 [DOI] [PubMed] [Google Scholar]
- 38.Foster T. H., Murant R. S., Bryant R. G., Knox R. S., Gibson S. L., Hilf R., “Oxygen consumption and diffusion effects in photodynamic therapy,” Radiat Research 126(3), 296–303 (1991). 10.2307/3577919 [DOI] [PubMed] [Google Scholar]
- 39.Henderson B. W., Busch T. M., Snyder J. W., “Fluence rate as a modulator of PDT mechanisms,” The Official Journal of the American Society for Laser Medicine and Surgery 38(5), 489–493 (2006). 10.1002/lsm.20327 [DOI] [PubMed] [Google Scholar]
- 40.Chao Zhang, Wei Feng, Elena Vodovozova, Daria Tretiakova, Boldyrevd Ivan, “Photodynamic opening of the blood-brain barrier to high weight molecules and liposomes through an optical clearing skull window,” Biomed. Opt. Express 9(10), 4850–4862 (2018). 10.1364/BOE.9.004850 [DOI] [PMC free article] [PubMed] [Google Scholar]
- 41.Henry Hirschberg, Francisco A., Uzal David, Chighvinadze Michelle, Zhang J., “Disruption of the blood–brain barrier following ALA-mediated photodynamic therapy,” The Official Journal of the American Society for Laser Medicine and Surgery 40(8), 535–542 (2008). 10.1002/lsm.20670 [DOI] [PMC free article] [PubMed] [Google Scholar]
- 42.Madsen S. J., Hirschberg H., Madsen S. J., Hirschberg H., “Site-specific opening of the blood-brain barrier,” J. Biophotonics 3(5-6), 356–367 (2010). 10.1002/jbio.200900095 [DOI] [PMC free article] [PubMed] [Google Scholar]


