Abstract
Diabetic foot is one of the major complications of diabetes. In this work, a real-time Single Snapshot Multiple-frequency Demodulation (SSMD) - Spatial Frequency Domain Imaging (SFDI) system was used to image the forefoot of healthy volunteers, diabetes, and diabetic foot patients. A layered skin model was used to obtain the 2D maps of optical and physiological parameters, including cutaneous hemoglobin concentration, oxygen saturation, scattering properties, melanin content, and epidermal thickness, from every single snapshot. We observed a strong correlation between the measured optical and physiological parameters and the degree of diabetes. The cutaneous hemoglobin concentration, oxygen saturation, and epidermal thickness decrease, whereas the melanin content increases with the progress of diabetes. The melanin content further increases, and the reduced scattering coefficient and scattering power are lower for diabetic foot patients than those of both healthy and diabetic subjects. High accuracies (AUC) of 97.2% (distinguishing the diabetic foot patients among all subjects), 95.2% (separating healthy subjects from the diabetes patients), and 87.8% (classifying mild vs severe diabetes), respectively, are achieved in binary classifications in sequence using the SSMD-SFDI system, demonstrating its applicability to risk stratification of diabetes and diabetic foot. The prognostic value of the SSMD-SFDI system in the prediction of the occurrence of the diabetic foot and other applications in monitoring tissue microcirculation and peripheral vascular disease are also addressed.
1. Introduction
Diabetes is a common disease that affected 425 million people worldwide in 2017, and the number is estimated to reach 700 million in 2045. According to the International Diabetes Federation (IDF), one in eleven adults are expected to have diabetes among whom 2/3 are at the prime time. The low awareness and poor control of the disease for diabetes patients can easily lead to various complications, including cardiovascular, retinal-related complications, and diabetic foot [1]. A quarter of diabetes patients will suffer from diabetic foot eventually. The Global Lower Limb Amputation Study Group estimated that between 25 and 90 percent of amputations are related to diabetes, and 46% of diabetes deaths occur at the prime time [1,2].
Diabetic foot is generally classified into neuropathy, peripheral vascular disease, and mixed type. Diabetic foot diagnosis is foremost based on neurologic examination of skin temperature and perfusion pressure, transcutaneous oxygen pressure, the dorsal foot pulses, and the measurement of ankle or toe blood pressure [3]. Vascular ultrasound and angiography have been widely used in the clinic to assist the diagnosis. Non-invasive detection methods such as X-ray, CT imaging, MRI, and radionuclide scanning are also used for diabetic foot, in particular, with infection and severe ischemic ulcers [3,4]. However, current non-invasive methods have several deficiencies. First, the measurement may not necessarily reflect ischemia at the site of the ulcer. With different blood vessels supplying blood to the feet, low blood flow in one vessel may not accurately reflect blood supply at the location of the ulcer [5,6]. Second, international guidelines indicate that there is a grey area where healing probabilities are unclear [7]. For example, toe pressure values between 30 and 50mmHg indicate a 20-80% chance of healing without vascular intervention [6,8,9]. This condition is common in diabetic patients whose microcirculation is affected but has not altered the ankle pressures nor toe pressures used to assess ischemia. Such uncertainty may cause delayed vascular intervention and prolonged healing times. Overcoming these shortcomings of the existing non-invasive diagnostics remains one major challenge in the field of diabetic foot ulcers [7]. There is an unmet need for a non-invasive real-time continuous imaging technique for mapping local micro-circulation over a large field of view and timely risk stratification of diabetes and diabetic foot ulcers [10,11].
In this article, we present a real-time non-contact Single Snapshot Multiple Frequency Demodulation - Spatial Frequency Domain Imaging (SSMD-SFDI) platform implemented with a digital mirror device to map the optical properties of the subsurface of the foot skin. The SSMD-SFDI platform is suitable for imaging and monitoring dynamic turbid medium and processes over a large field of view. In the context of foot imaging, this method not only enables rapid mapping of both structural and physiological parameters of the layered foot skin but also identifies the stage of diabetes and assesses the risk of diabetes and diabetic foot. The potential applications of the technique in early diagnosis, disease tracking, and efficacy evaluation of tissue microcirculation and cardiovascular disease complications, in general, are discussed at the end.
2. Materials and methods
2.1. SSMD-SFDI
SSMD-SFDI has been presented elsewhere [12,13]. Here the principle of SSMD-SFDI is briefly outlined. SFDI is a non-contact optical imaging technology with the unique capability of allowing wide-field quantitative mapping of tissue optical properties (absorption and scattering coefficients). In SFDI, the incident spatially modulated light comprises a DC component, , and an AC component, , modulated at a specific frequency f. The reflectance of the spatially-modulated light is demodulated to obtain the tissue modulation transfer function (MTF). Conventional SFDI utilizes a demodulation technique referred to as the three-phase method and requires three images , , acquired at different phase delays (0, 2π/3, and 4π/3) to compute MTF (the ratio of and ) at one spatial frequency [12,23]:
| (1) |
In contrast, the recently proposed single snapshot multiple frequency demodulation (SSMD) method [13,14] can extract multiple modulation transfer functions from a single structured light image containing multiple components of different spatial modulation frequencies. The amplitude of the -th AC component is given by
| (2) |
where () is the spatial frequency of the -th spatial modulation pattern and σ represents the kernel window of an appropriate size over which the integration is being performed [16].
SSMD can extract both AC and DC components from a single structured light image, whereas conventional three phase demodulation requires three images to obtain AC and DC components. The main advantage of SSMD over other single snapshot SFDI approaches includes the superiority in SNR, the robustness against measurement imperfections, and the capability of extracting multiple AC components of different frequencies from one single snapshot [13–15].
2.2. Mapping a two-layer structure to an equivalent homogeneous medium in SFDI
Biological tissue such as the skin is highly structured. The foot skin consists of three main layers from the surface: the epidermis (∼800µm thick, the blood-free layer), dermis (1–4mm thick, vascularized layer), and subcutaneous fat (from 1 to 6mm thick, dependent on the body site). Light penetration is mostly confined within the top two (epidermis and dermis) layers in reflection measurements [17,18], such as SFDI. Accounting for the two-layer structure has been found to be critical to the accurate recovery of cutaneous hemoglobin concentration and oxygen saturation [16,19]. To this end, we have developed a novel approach that maps the two-layer structure to a homogeneous medium for spatial frequency domain imaging (Fig. 1).
Fig. 1.
A layered structure is mapped to the equivalent homogeneous medium of the same reduced scattering coefficient and an effective absorption coefficient.
The principle of mapping a two-layer structure to an equivalent homogeneous medium is briefly outlined here [12,16,19]. Ignoring the difference in the scattering property between the epidermis and dermis and noting that light absorption in the epidermis is dominated by melanin and that in the dermis by oxy- and deoxyhemoglobins, the mapped homogeneous medium has the same reduced scattering coefficient as the original medium and an equivalent absorption coefficient determined by requiring total light absorption is equivalent within the two systems, i.e.,
| (3) |
where h is the epidermal thickness and L is the mean penetration depth for the modulated light at the spatial frequency f and the wavelength λ, given by
| (4) |
where , , , and l is the extrapolation length for diffusing light.
The fractal refractive index fluctuation dominates light scattering by the epidermis and dermis. Consequently, the reduced scattering coefficient is described by a power law:
| (5) |
where b is the scattering power and λ and λ0 are the wavelengths in nanometers [12].
Ignoring the layered structure will lead to significant errors in the recovered physiological parameters and underestimation of the penetration depth of spatially modulated light. The above mapping of a layered structure to an equivalent homogeneous medium not only resolves this deficiency but also obtains both optical and physiological parameters at the same time from one single snapshot [16,20].
2.3. Experiment procedure and data analysis
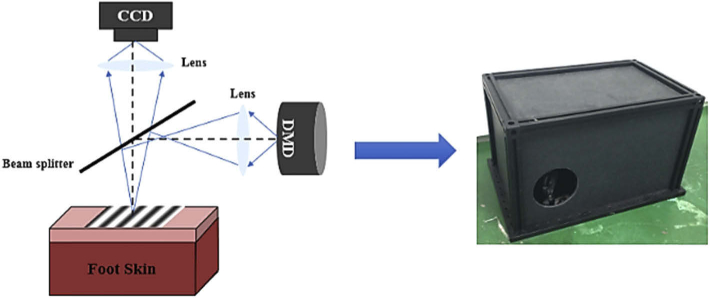
The experimental setup is shown in Fig. 2. The sinusoidal fringe pattern from the digital micromirror device (DMD, DLP Light Crafter 4500, Texas Instruments) is projected onto the specimen. Backscattered light from the sample is then imaged onto the CCD camera (Point Gray Grasshopper3 GS3-U3-51S5C-C). The illumination uses white light, which comprises three monochromatic components of wavelengths: 623 nm, 540 nm, and 460 nm, respectively. One millimeter on the specimen surface corresponds to 23 pixels on the CCD. The full usable image window is 33mmx33mm.
Fig. 2.
Schematic diagram of the SSMD-SFDI imaging system.
The SSMD-SFDI system was used to image the bottom of the foot of healthy subjects, diabetes, and diabetic foot subjects. The spatial modulation frequency of the white illumination light is 0.2 mm−1. The CCD exposure time was fixed at 55000µs, and the sampling rate was 6fps. Forefoot (the front part of the foot) was imaged by the SSMD-SFDI system after resting in a supine position for 5-10 minutes [21].
A region of interest (ROI) of size 8.5mmx8.5mm at the center of the image window was selected for data analysis. Single Snapshot Multiple Frequency Demodulation (SSMD) was used to compute the modulation transfer functions, and , at the spatial frequencies f = 0 and 0.2 mm−1 for red, green, and blue light from the recorded color image over the ROI after color correction [12]. The properties of the two-layer skin including oxy- and deoxyhemoglobin concentrations, the reduced scattering coefficient at 540 nm, the scattering power, the melanin concentration, alpha (skin roughness), and the epidermal thickness are then fitted using the function fmincon in MATLAB by minimizing the least squared error:
| (6) |
where i = 1,2,3 represent the three colors, and the theoretical values of the modulation transfer functions mtfDC and mtfAC are computed with the enhanced diffusion model for the equivalent homogeneous medium [20,22].
Monte Carlo simulations have been performed to determine the dependence of the penetration depth on the wavelength and the spatial modulation frequency of spatially modulated light into layered skin [12]. We selected the three visible wavelengths of 623 nm, 540 nm, and 460 nm and the spatial modulation frequency of 0.2 mm−1 in this study as (1) it probes the epidermis and dermis predominantly and can be imaged with ordinary RGB cameras; and (2) it offers high sensitivity for separating the three major chromophores (melanin, deoxy-hemoglobin, and oxyhemoglobin) in the skin. Furthermore, the accuracy of the diffusion model deteriorates with the increase of the spatial modulation frequency higher than 0.2 mm−1.
In this study, a total of 219 ROIs were obtained for 26 healthy volunteers, 163 diabetes patients (87 mild diabetes and 76 severe diabetes subjects), and 30 diabetic foot patients. The diabetic foot patients are mainly of mixed type. Some patients with diabetic foot have severe ulceration at the base of the foot. The imaging window excludes the scabbing area of the foot.
3. Results
3.1. 2D maps for optical and physiological properties of the foot skin
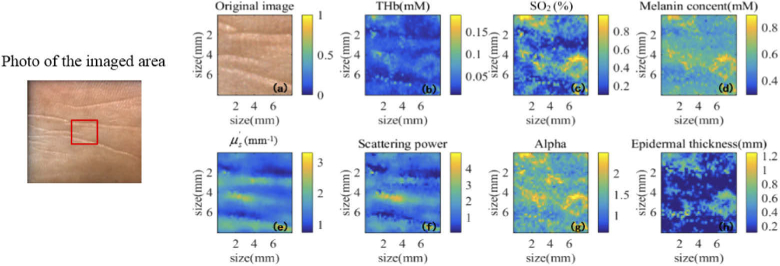
The photo of the imaged area and the 2D ROI images of a typical diabetes subject are shown in Fig. 3, including the photograph and the maps for total hemoglobin concentration (THb), tissue oxygen saturation (SO2), melanin concentration (Melanin), reduced scattering coefficient (), scattering power, alpha, and epidermal thickness. These images show the spatial variations of the skin property. The features in Fig. 3 reflect both the surface texture and the underlying spatial distribution of structures and chromophores of the skin. The ring shape appearing at the lower right part of most images is attributed to a capillary loop. Hereafter, the properties averaged over the ROI will be used as the basis for diagnosis and risk stratification.
Fig. 3.
The photo of the imaged area and 2D images for optical and physiological properties of typical foot skin. The red rectangle outlines the ROI within the image window.
3.2. Characteristics and differentiation of diabetes and diabetic foot
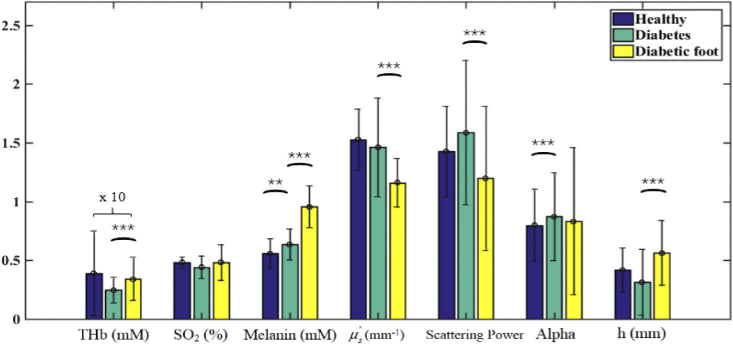
Figure 4 compares the optical and physiological parameters between healthy, diabetes, and diabetic foot subjects. The total hemoglobin concentration and oxygen saturation are lower, and melanin concentration is higher for diabetes patients than the healthy control, consistent with the fact that the diabetes patients have symptoms of local microcirculation ischemia and hypoxia at the extremity. The increase of melanin concentration reflects that the body endocrine is abnormal for diabetes patients. In contrast to diabetes subjects, the melanin content continues to increase in diabetic foot patients. The reduced scattering coefficient and scattering power are significantly lower, and the epidermal thickness is higher in diabetic foot patients, indicating a skin structural alteration with the further deterioration of the disease. The anti-trend increase of the total hemoglobin in diabetic foot patients is likely due to drug intervention (Metformin and Gliclazide), which enhances microcirculation.
Fig. 4.
Comparison of healthy, diabetes, and diabetic foot subjects. The significance is presented by “*” (p < 0.05), “**” (p < 0.01), and “***” (p < 0.001). The values of THb have been multiplied by 10 for clarity.
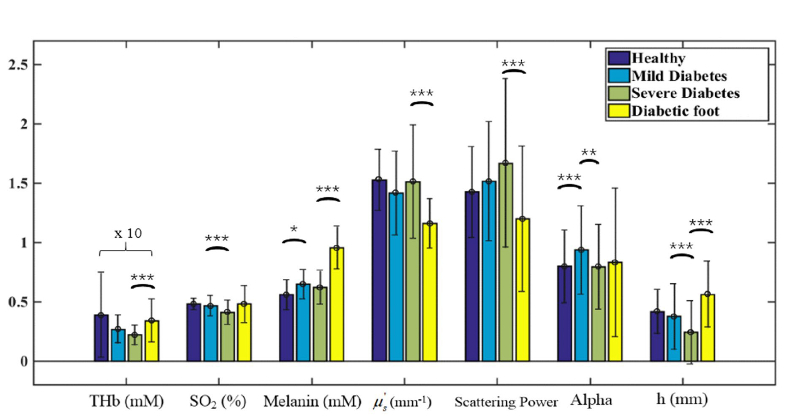
Glycated hemoglobin (HbA1c) reflects the average level of blood glucose control in the past 2-3 months and is not affected by occasional changes in blood glucose [24]. According to IDF, the range of control is when HbA1c is less than 6.5%, and HbA1c is a risk factor for the occurrence of chronic complications leading to diabetic nephropathy, atherosclerosis, cataract, etc. when HbA1c is higher than 9%. We hence further divided the experimental data into four groups according to HbA1c: healthy subjects, mild diabetes patients (HbA1c: 5.5%-9%), severe diabetes patients (HbA1c: >9%), and diabetic foot patients. It is worth mentioning that HbA1c of diabetic foot subjects ranged from 5.7% to 9.2% in our data set, which was lower than that in severe diabetes subjects (HbA1c: 9.5%-16.5%). The same trends observed in Fig. 4 are also evident across the four groups (see Fig. 5).
Fig. 5.
Structural properties and physiological parameters of healthy, mild diabetes, severe diabetes, and diabetic foot subjects. The significance is presented by “*” (p < 0.05), “**” (p < 0.01), and “***” (p < 0.001). The values of THb have been multiplied by 10 for clarity.
Referring to both Fig. 4 and Fig. 5, several important observations are in order. First, the reduction in blood supply to the patient’s extremities (feet) leads to a decrease in intracellular thiols, which ultimately contributes to the increase in melanin production of the body, as shown in the steady rise of the melanin content from healthy, diabetes, to diabetic foot subjects. Second, microvascular ischemia and neuropathy lead to tissue nutritional dystrophia, which is manifested in the reduced epidermal thickness with the progress of diabetes. The thinned skin barrier is more prone to damage by fungal infection and trauma, eventually resulting in foot ulcers. The patients presented with foot ulcers, after healing, tend to have a thicker epidermis due to scabbing.
The characteristics of the optical and physiological parameters for healthy, mild diabetes, severe diabetes, and diabetic foot subjects are summarized in Table 1. The number in “()” shows the standard deviation computed across the subjects of a common type.
Table 1. Mean and Standard Deviation of Optical and Physiological Parameters for Healthy, Mild Diabetes, Severe Diabetes, and Diabetic Foot Subjects.
| THb (mM) | SO2 (%) | Melanin content (mM) | Reduced scattering coefficient (mm-1) | Scattering power | Alpha | Epidermal thickness (mm) | |
|---|---|---|---|---|---|---|---|
| Healthy (n=26) | 0.039 (0.036) | 0.48 (0.05) | 0.56 (0.13) | 1.53 (0.26) | 1.43 (0.38) | 0.80 (0.31) | 0.42 (0.19) |
| Mild diabetes (n=87) | 0.027 (0.012) | 0.47 (0.09) | 0.65 (0.12) | 1.42 (0.35) | 1.52 (0.50) | 0.94 (0.37) | 0.38 (0.28) |
| Severe diabetes (n=76) | 0.022 (0.0084) | 0.41 (0.10) | 0.62 (0.14) | 1.51 (0.48) | 1.67 (0.71) | 0.80 (0.36) | 0.24 (0.27) |
| Diabetic foot (n=30) | 0.034 (0.018) | 0.48 (0.16) | 0.96 (0.18) | 1.16 (0.21) | 1.20 (0.61) | 0.83 (0.63) | 0.56 (0.28) |
Based on the Wilcoxon rank sum test, the oxygen saturation, epidermal thickness, and alpha are significantly different between mild and severe diabetes patients, attributed to the changes in microcirculation such as ischemia, hypoxia, and nutritional dystrophia (see Table 2).
Table 2. Key Properties Differentiating Mild and Severe Diabetes.
| SO2 (°) | Epidermal thickness (mm) | Alpha | |
|---|---|---|---|
| Mild diabetes | 0.47 (0.09) | 0.38 (0.28) | 0.94 (0.37) |
| Severe diabetes | 0.41 (0.10) | 0.24 (0.27) | 0.80 (0.36) |
| P-value | 2e-6 | 2e-3 | 0.03 |
The total hemoglobin concentration, melanin concentration, epidermal thickness, and scattering power are significantly altered between severe diabetes and diabetic foot patients, as the outcome of the deterioration of microvascular ischemia and neuropathy leading to altered skin structure (see Table 3).
Table 3. Key Properties Differentiating Severe Diabetes and Diabetic Foot.
| THb (mM) | Melanin content (mM) | Reduced scattering coefficient (mm-1) | Scattering power | Epidermal thickness (mm) | |
|---|---|---|---|---|---|
| Severe diabetes | 0.022 (0.0084) | 0.62 (0.14) | 1.51 (0.48) | 1.67 (0.71) | 0.24 (0.27) |
| Diabetic foot | 0.034 (0.018) | 0.96 (0.18) | 1.16 (0.21) | 1.20 (0.61) | 0.56 (0.28) |
| P-value | 6e-4 | 2e-6 | 2e-4 | 1e-3 | 4e-4 |
3.3. Risk stratification of diabetes and diabetic foot
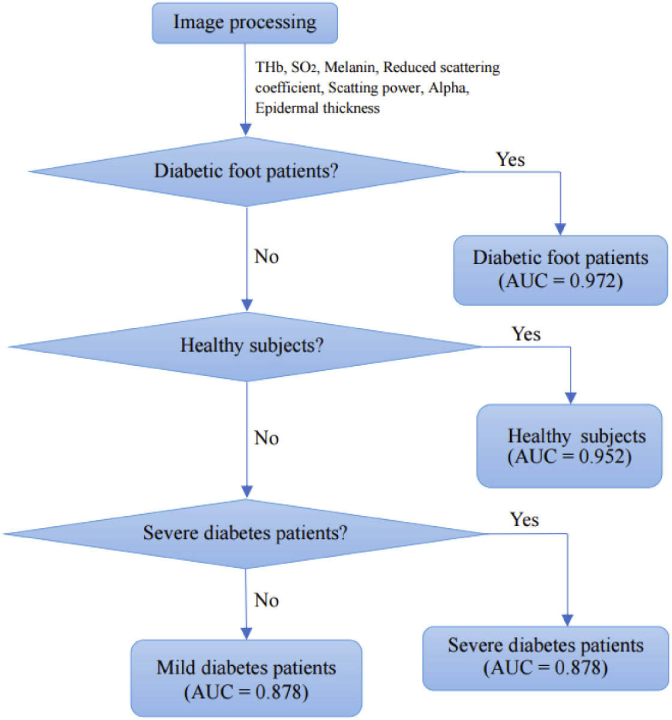
Three binary classifications using support vector machines (SVM) [25,26] were then conducted in sequence to classify the cohort of subjects into diabetic foot patients, healthy subjects, severe diabetes, or mild diabetes patients, as outlined in Fig. 6. A weighted SVM scheme with nested 5-fold cross-validation was used to suppress any potential biases and account for the imbalanced data of a limited sample size explicitly [25,26]. The ROC (Receiver Operating Characteristic) curves for the three successive binary classifications were shown in Fig. 7, Fig. 8, and Fig. 9, respectively. The AUC (the area under the ROC curve) for the three binary classifications is 0.972, 0.952, and 0.878, respectively.
Fig. 6.
Diagram for the diagnosis of disease progression.
Fig. 7.
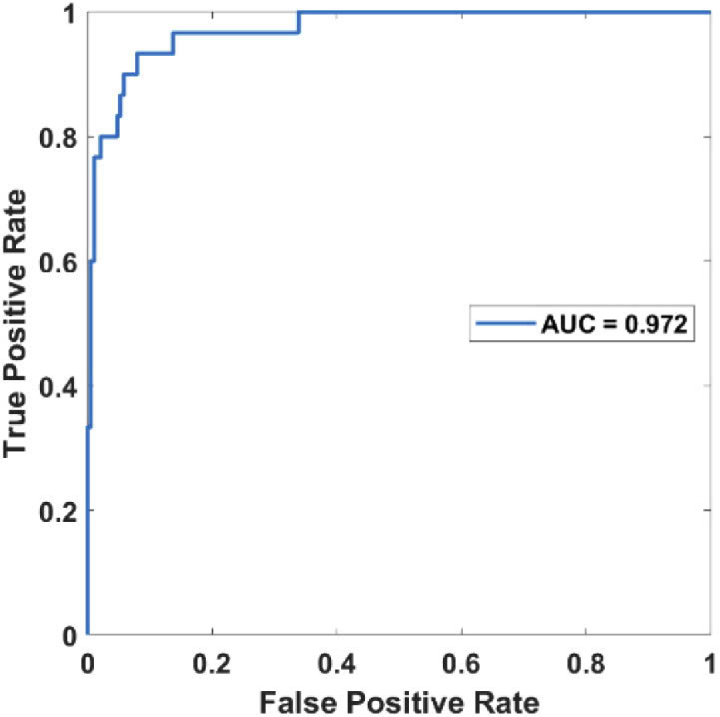
ROC curve for distinguishing the diabetic foot patients from the rest.
Fig. 8.
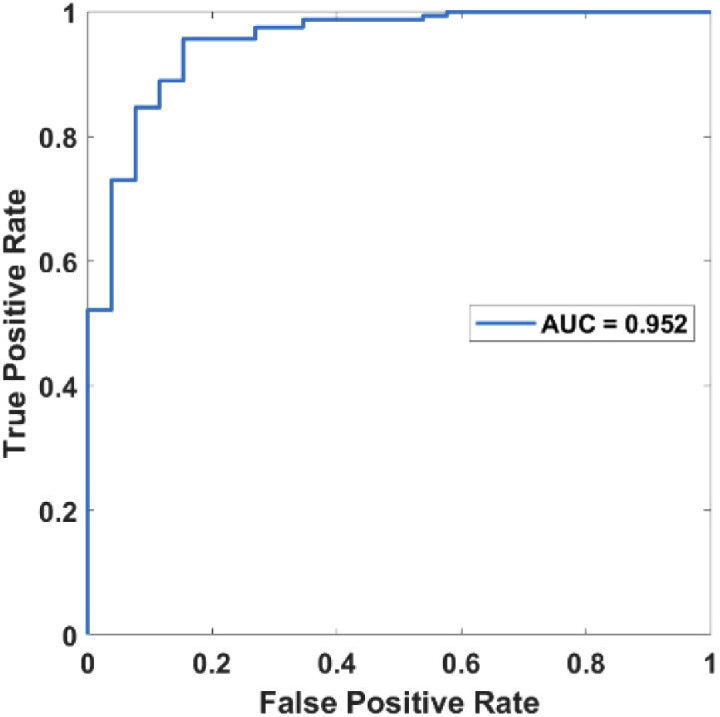
ROC curve for distinguishing the healthy subjects from the rest (mild and severe diabetes patients).
Fig. 9.
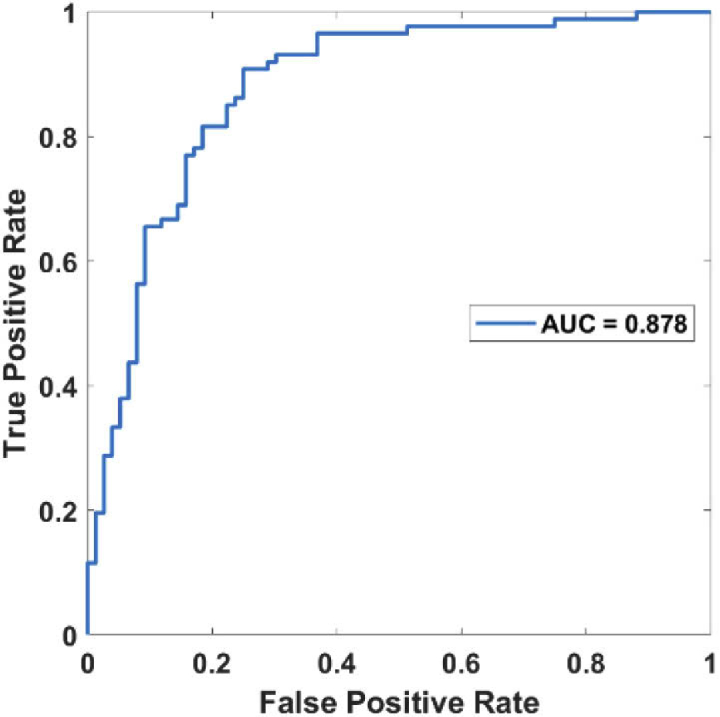
ROC curve for distinguishing mild and severe diabetes subjects.
At present, there are no clinical methods that can be used to predict the occurrence of diabetic foot [9]. The optical and physiological parameters measured by the SSMD-SFDI system may potentially be used to assess the risk of developing into the diabetic foot from diabetes. Among the measured parameters differentiating diabetic foot patients from other subjects, the melanin content reflects the internal endocrine condition of diabetes patients and is least likely to be affected by drug intervention. Other parameters, including the epidermal thickness, in particular, will also be of prognostic values but cannot be included as they are either altered by drug intervention or scabbing in the diabetic foot in the current data set. The melanin content has been found to increase from healthy, diabetes, and diabetic foot subjects steadily (see Table 1). We thus used a single-factor logistic regression with 5-fold cross-validation on the melanin content to predict the risk of the diabetic foot [27]. Figure 10 shows the ROC curve for the logistic regression model for predicting the diabetic foot in severe diabetes subjects (AUC = 93.0%). The optimal cutoff point for the melanin content using Youden’s index is 0.79 mM, with the sensitivity and specificity at 90.0% and 84.2%, respectively [28].
Fig. 10.
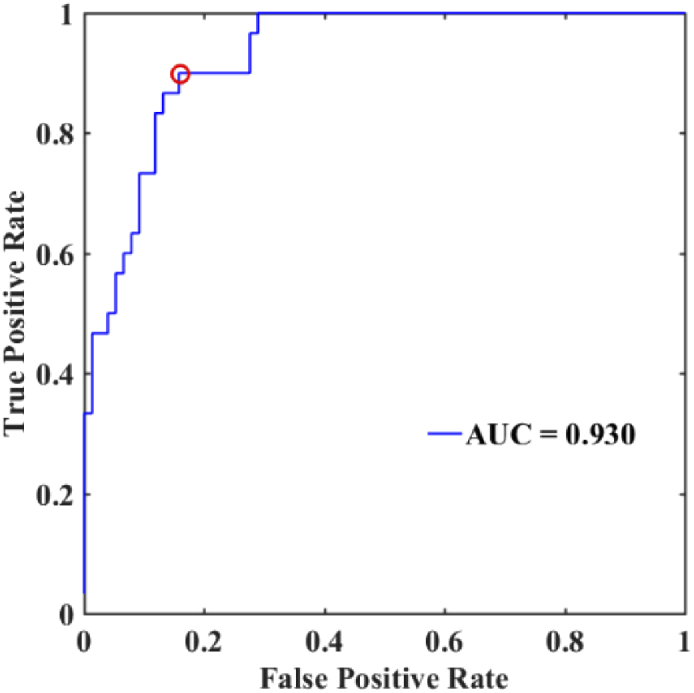
ROC curve for the logistic risk prediction model for the diabetic foot.
4. Discussion
We have presented SSMD-SFDI, a non-contact imaging technique, for risk stratification of diabetes and diabetic foot. SSMD-SFDI is capable of mapping optical properties (reduced scattering coefficient and scattering power) and physiological parameters including hemoglobin concentration, oxygen saturation, melanin content, and epidermal thickness over a large field of view for foot skin in real-time. The melanin concentration increases, whereas the hemoglobin concentration decreases with the occurrence of mild diabetes. The hemoglobin concentration, oxygen saturation, alpha, and epidermal thickness further decrease when the patient’s condition deteriorates into severe diabetes. The reduced scattering coefficient and scattering power alter for diabetes foot patients, resulting from permanent tissue structural damage. The measured optical and physiological parameters were shown to be capable of risk stratification of diabetes and diabetic foot.
The hyperglycemia toxicity of diabetes is related to local microcirculation complications. Microvascular dysfunction can be attributed to endothelial dysfunction, increased brittleness of vessels, novel branches of arteries, and platelet aggregation, causing prolonged healing of ulcers in diabetic patients [29]. Microvascular ischemia and neuropathy lead to tissue dystrophia, fungal infections, and trauma, ultimately resulting in the occurrence of diabetic foot. These physiological alterations manifest themselves in the reduction of cutaneous hemoglobin concentration and oxygen saturation, and the increase of melanin concentration. The structural parameters such as the epidermal thickness, the reduced scattering coefficient, and the scattering power mark the alterations in local tissue structure [30–33]. The oxygen saturation drops significantly from mild diabetes to severe diabetes (see Fig. 5). No significant difference in SO2 between diabetes and the diabetic foot is observed, likely due to drug interventions on diabetic foot patients to enhance microcirculation. The reduction in blood supply to the patient’s extremities (feet) results in a decrease in intracellular thiols, which ultimately leads to an increase in melanin production of the body.
The optical and physiological parameters measured by the SSMD-SFDI system can accurately differentiate between healthy subjects, mild diabetes patients, severe diabetes patients, and diabetic foot patients. In our study of 26 healthy volunteers, 163 diabetic patients (87 mild diabetes and 76 severe diabetes subjects), and 30 diabetic foot patients, the accuracies (AUC) of the successive binary classifications were 97.2% (distinguishing the diabetic foot patients among all subjects), 95.2% (separating the healthy subjects from diabetes patients), and 87.8% (classifying mild vs severe diabetes), respectively. We have further shown the potential of the melanin content to assess the risk of diabetes developing into the diabetic foot with an accuracy of 93.0%. We note that a weighted SVM scheme with nested 5-fold cross-validation has been adopted to suppress potential biases and address the limited sample size in our analysis. A study of a larger sample size and, in particular, monitoring the same subjects over the full span of disease progression will be warranted to corroborate the above results.
As it directly interrogates local microcirculation, metabolic, and structural alterations, the SSMD-SFDI approach can complement or even replace the existing diagnostic assessment of microcirculation for diabetes patients [5,6,34]. User-friendliness, low cost, and noninvasiveness are the advantages of the SSMD-SFDI system as well as one portable device convenient for bedside or point-of-care measurements. The SSMD-SFDI system is hence suitable for the early diagnosis and treatment tracking of the diabetic foot and peripheral vascular diseases [34,35].
Finally, the study of tissue changes in microstructure and local blood circulation will be helpful to understand pathogenesis, the progress of the disease, and guide clinical treatment of the diabetic foot. The SSMD-SFDI system can be useful in monitoring and efficacy tracking of patients for the long-term in the ward. Future work is planned to study the application of this system in areas such as monitoring anesthesia, neurological function detection, and image-guided surgery.
5. Conclusion
In summary, we have demonstrated a method of using the SSMD-SFDI system and a layered skin model to assess the local microcirculation in diabetes and diabetic foot. The optical and physiological parameters were obtained, including cutaneous hemoglobin concentration, oxygen saturation, scattering properties, melanin content, alpha, and epidermal thickness. The parameters such as cutaneous hemoglobin concentration, oxygen saturation, epidermal thickness, and reduced scattering coefficient show a strong correlation with the progress of diabetes and have been demonstrated to be applicable to risk stratification and prognosis of diabetes and diabetic foot. The melanin content has been shown as one potential risk predictor for the occurrence of diabetic foot. As a non-contact technique, SSMD-SFDI is suitable for the efficacy tracking and long-term monitoring of diabetes. This system also has potential applications in monitoring microcirculatory and peripheral vascular diseases, in general.
Acknowledgments
We thank Chao Z for clinical support.
Funding
Key Research Program of Zhejiang Natural Science Foundation of China (LZ16H180002); US National Science Foundation (NSF) (1607664); Wenzhou Science and Technology Major Project (ZS2017022); National Natural Science Foundation of China10.13039/501100001809 (81670777); Natural Science Foundation of Zhejiang Province10.13039/501100004731 (LZ19H020001).
Disclosures
We report a patent application related to the technology and analysis methods described in this study. The authors declare that there are no other conflicts of interest related to this article.
References
- 1.Cho N. H., Shaw J. E., Karuranga S., Huang Y., da Rocha Fernandes J. D., Ohlrogge A. W., Malanda B., “IDF Diabetes Atlas: Global estimates of diabetes prevalence for 2017 and projections for 2045,” Diabetes Res. Clin. Pract. 138, 271–281 (2018). 10.1016/j.diabres.2018.02.023 [DOI] [PubMed] [Google Scholar]
- 2.Maria N., Tatjana K., Heiner C., Sigrid D., Bjorn S., Stephan M., Gerhard R., Kristien V. A., Andrea I., Alena G., “Incidence of lower extremity amputations in the diabetic compared with the non-diabetic population: A systematic review,” PLoS One 12(8), e0182081 (2017). 10.1371/journal.pone.0182081 [DOI] [PMC free article] [PubMed] [Google Scholar]
- 3.Lipsky B. A., Berendt A. R., Cornia P. B., Pile J. C., Peters E. J. G., “2012 infectious diseases society of America clinical practice guideline for the diagnosis and treatment of diabetic foot infections,” J. Am. Podiatr. Med. Assoc. 103(1), 2–7 (2013). 10.7547/1030002 [DOI] [PubMed] [Google Scholar]
- 4.Naves C. C. L. M., “The diabetic foot: a historical overview and gaps in current treatment,” Adv Wound Care 5(5), 191–197 (2016). 10.1089/wound.2013.0518 [DOI] [PMC free article] [PubMed] [Google Scholar]
- 5.Mennes O. A., van Netten J. J., Slart R., Steenbergen W., “Novel optical techniques for imaging microcirculation in the diabetic foot,” Curr. Pharm. Des. 24(12), 1304–1316 (2018). 10.2174/1381612824666180302141902 [DOI] [PubMed] [Google Scholar]
- 6.Sumpio B. E., Forsythe R. O., Ziegler K. R., van Baal J. G., Lepantalo M. J., Hinchliffe R. J., “Clinical implications of the angiosome model in peripheral vascular disease,” J. Vasc. Surg. 58(3), 814–826 (2013). 10.1016/j.jvs.2013.06.056 [DOI] [PubMed] [Google Scholar]
- 7.Hinchliffe R. J., Brownrigg J. R., Apelqvist J., Boyko E. J., Fitridge R., Mills J. L., Reekers J., Shearman C. P., Zierler R. E., Schaper N. C., “International Working Group on the Diabetic, “IWGDF guidance on the diagnosis, prognosis and management of peripheral artery disease in patients with foot ulcers in diabetes,” Diabetes/Metab. Res. Rev. 32(Suppl 1), 37–44 (2016). 10.1002/dmrr.2698 [DOI] [PubMed] [Google Scholar]
- 8.Brownrigg J. R. W., Hinchliffe R. J., Apelqvist J., Boyko E. J., Fitridge R., Mills J. L., Reekers J., Shearman C. P., Zierler R. E., Schaper N. C., “Effectiveness of bedside investigations to diagnose peripheral artery disease among people with diabetes mellitus: a systematic review,” Diabetes/Metab. Res. Rev. 32(Suppl 1), 119–127 (2016). 10.1002/dmrr.2703 [DOI] [PubMed] [Google Scholar]
- 9.Brownrigg J. R. W., Hinchliffe R. J., Apelqvist J., Boyko E. J., Fitridge R., Mills J. L., Reekers J., Shearman C. P., Zierler R. E., Schaper N. C., “Performance of prognostic markers in the prediction of wound healing or amputation among patients with foot ulcers in diabetes: a systematic review,” Diabetes/Metab. Res. Rev. 32(Suppl 1), 128–135 (2016). 10.1002/dmrr.2704 [DOI] [PubMed] [Google Scholar]
- 10.Gioux S., Mazhar A., Cuccia D. J., “Spatial frequency domain imaging in 2019: principles, applications, and perspectives,” J. Biomed. Opt. 24(7), 1–18 (2019). 10.1117/1.JBO.24.7.071613 [DOI] [PMC free article] [PubMed] [Google Scholar]
- 11.Nothelfer S., Bergmann F., Liemert A., Reitzle D., Kienle A., “Spatial frequency domain imaging using an analytical model for separation of surface and volume scattering,” J. Biomed. Opt. 24(07), 1 (2019). 10.1117/1.JBO.24.7.071604 [DOI] [PMC free article] [PubMed] [Google Scholar]
- 12.Chen X., Lin W., Wang C., Chen S., Sheng J., Zeng B., Xu M., “In vivo real-time imaging of cutaneous hemoglobin concentration, oxygen saturation, scattering properties, melanin content, and epidermal thickness with visible spatially modulated light,” Biomed. Opt. Express 8(12), 5468 (2017). 10.1364/BOE.8.005468 [DOI] [PMC free article] [PubMed] [Google Scholar]
- 13.Xu M., Cao Z., Lin W., Chen X., Zheng L., Zeng B., “Single snapshot multiple frequency modulated imaging of subsurface optical properties of turbid media with structured light,” AIP Adv. 6(12), 125208 (2016). 10.1063/1.4971428 [DOI] [Google Scholar]
- 14.Cao Z., Lin W., Chen X., Zeng B., Xu M., “Real-time spatial frequency domain imaging by single snapshot multiple frequency demodulation technique,” Proc. SPIE 10059, 100590Z (2017). 10.1117/12.2253992 [DOI] [Google Scholar]
- 15.Vervandier J., Gioux S., “Single snapshot imaging of optical properties,” Biomed. Opt. Express 4(12), 2938 (2013). 10.1364/BOE.4.002938 [DOI] [PMC free article] [PubMed] [Google Scholar]
- 16.Saager R. B., Truong A., Cuccia D. J., Durkin A. J., “Method for depth-resolved quantitation of optical properties in layered media using spatially modulated quantitative spectroscopy,” J. Biomed. Opt. 16(7), 077002 (2011). 10.1117/1.3597621 [DOI] [PMC free article] [PubMed] [Google Scholar]
- 17.Jacques S. L., “Optical properties of biological tissues: a review,” Phys. Med. Biol. 58(11), R37–R61 (2013). 10.1088/0031-9155/58/11/R37 [DOI] [PubMed] [Google Scholar]
- 18.Jacques S. L., Samatham R., Choudhury N., “Rapid spectral analysis for spectral imaging,” Biomed. Opt. Express 1(1), 157–164 (2010). 10.1364/BOE.1.000157 [DOI] [PMC free article] [PubMed] [Google Scholar]
- 19.Yudovsky D., Nguyen J. Q., Durkin A. J., “In vivo spatial frequency domain spectroscopy of two layer media,” J. Biomed. Opt. 17(10), 107006 (2012). 10.1117/1.JBO.17.10.107006 [DOI] [PMC free article] [PubMed] [Google Scholar]
- 20.Xu M., “Low-coherence enhanced backscattering beyond diffusion,” Opt. Lett. 33(11), 1246–1248 (2008). 10.1364/OL.33.001246 [DOI] [PubMed] [Google Scholar]
- 21.Kato S., Yoshitani K., Kubota Y., Inatomi Y., Ohnishi Y., “Effect of posture and extracranial contamination on results of cerebral oximetry by near-infrared spectroscopy,” J. Anesth. 31(1), 103–110 (2017). 10.1007/s00540-016-2275-1 [DOI] [PubMed] [Google Scholar]
- 22.Xu M., “Diagnosis of the phase function of random media from light reflectance,” Sci. Rep. 6(1), 22535 (2016). 10.1038/srep22535 [DOI] [PMC free article] [PubMed] [Google Scholar]
- 23.Reilly M., Xu M., “Analytical model for sub-diffusive light reflection and the application to spatial frequency-domain imaging,” Proc. SPIE 9319, 93191A (2015). 10.1117/12.2082714 [DOI] [Google Scholar]
- 24.Sugawara A., Kawai K., Motohashi S., Saito K., Sone H., “Erratum: HbA1c variability and the development of microalbuminuria in type 2 diabetes (Tsukuba Kawai Diabetes Registry 2),” Diabetologia 55(8), 2128–2131 (2012). 10.1007/s00125-012-2572-7 [DOI] [PubMed] [Google Scholar]
- 25.Vabalas A., Gowen E., Poliakoff E., Casson A. J., “Machine learning algorithm validation with a limited sample size,” PLoS One 14(11), e0224365 (2019). 10.1371/journal.pone.0224365 [DOI] [PMC free article] [PubMed] [Google Scholar]
- 26.Angraal S., Mortazavi B. J., Gupta A., Khera R., Krumholz H. M., “Machine learning prediction of mortality and hospitalization in heart failure with preserved ejection fraction,” JACC Heart Fail 8(1), 12–21 (2020). 10.1016/j.jchf.2019.06.013 [DOI] [PubMed] [Google Scholar]
- 27.Stoltzfus J. C., “Logistic regression: a brief primer,” Acad. Emerg. Med. 18(10), 1099–1104 (2011). 10.1111/j.1553-2712.2011.01185.x [DOI] [PubMed] [Google Scholar]
- 28.Schisterman E. F., Faraggi D., Reiser B., Hu J., “Youden Index and the optimal threshold for markers with mass at zero,” Stat Med 27(2), 297–315 (2008). 10.1002/sim.2993 [DOI] [PMC free article] [PubMed] [Google Scholar]
- 29.Forsythe R. O., Brownrigg J., Hinchliffe R. J., “Peripheral arterial disease and revascularization of the diabetic foot,” Diabetes, Obes. Metab. 17(5), 435–444 (2015). 10.1111/dom.12422 [DOI] [PubMed] [Google Scholar]
- 30.Xu M., “Plum pudding random medium model of biological tissue toward remote microscopy from spectroscopic light scattering,” Biomed. Opt. Express 8(6), 2879–2895 (2017). 10.1364/BOE.8.002879 [DOI] [PMC free article] [PubMed] [Google Scholar]
- 31.Xu Z., Reilley M., Li R., Xu M., “Mapping absolute tissue endogenous fluorophore concentrations with chemometric wide-field fluorescence microscopy,” J. Biomed. Opt. 22(6), 066009 (2017). 10.1117/1.JBO.22.6.066009 [DOI] [PubMed] [Google Scholar]
- 32.Wu T. T., Qu J. Y., Xu M., “Unified Mie and fractal scattering by biological cells and subcellular structures,” Opt. Lett. 32(16), 2324–2326 (2007). 10.1364/OL.32.002324 [DOI] [PubMed] [Google Scholar]
- 33.Xu M., Wu T. T., Qu J. Y., “Unified Mie and fractal scattering by cells and experimental study on application in optical characterization of cellular and subcellular structures,” J. Biomed. Opt. 13(2), 024015 (2008). 10.1117/1.2907790 [DOI] [PubMed] [Google Scholar]
- 34.Forsythe R. O., Hinchliffe R. J., “Assessment of foot perfusion in patients with a diabetic foot ulcer,” Diabetes/Metab. Res. Rev. 32(Suppl 1), 232–238 (2016). 10.1002/dmrr.2756 [DOI] [PubMed] [Google Scholar]
- 35.Allen J., Howell K., “Microvascular imaging: techniques and opportunities for clinical physiological measurements,” Physiol. Meas. 35(7), R91–R141 (2014). 10.1088/0967-3334/35/7/R91 [DOI] [PubMed] [Google Scholar]


