Abstract
We have previously reported successful isolation and cryopreservation of human intestinal mucosa (CHIM) with retention of viability and drug metabolizing enzyme activities. Here we report the results of the quantification of drug metabolizing enzyme activities in CHIM from different regions of the small intestines from 14 individual donors. CHIM were isolated from the duodenum, jejunum, and ileum of 10 individuals, and from 10 consecutive 12‐inch segments starting from the pyloric sphincter of human small intestines from four additional individuals. P450 and non‐P450 drug metabolizing enzyme activities (CYP1A2, CYP2A6, CYP2B6, CYP2C8, CYP2C9, CYP2C19, CYP2D6, CYP2E1, CYP3A, UGT, SULT, FMO, MAO, AO, NAT1, and NAT2) were quantified via incubation with pathway‐selective substrates. Quantifiable activities were observed for all pathways except for CYP2A6. Comparison of the duodenum, jejunum, and ileum in 10 donors shows jejunum had higher activities for CYP2C9, CYP3A, UGT, SULT, MAO, and NAT1. Further definition of regional variations with CHIM from ten 12‐inch segments of the proximal small intestine shows that the segments immediately after the first 12‐inch segment (duodenum) had the highest activity for most of the drug metabolizing enzymes but with substantial differences among the four donors. Our overall results demonstrate that there are substantial individual differences in drug metabolizing enzymes and that jejunum, especially the regions immediately after the duodenum, had the highest drug metabolizing enzyme activities.
Keywords: CHIM, duodenum, enteric drug metabolism, human intestine, ileum, jejunum
Abbreviations
- CERM™
Cryopreserved enterocytes recovery medium
- HQM™
Hepatocyte/enterocyte incubation medium
- CHIM
Cryopreserved human intestinal mucosa
1. INTRODUCTION
Intestinal drug metabolism is known to play an important role in the bioavailability of orally administered drugs including CYP3A substrates, such as midazolam, 1 , 2 , 3 , 4 cyclosporin, 5 lovastatin, 6 and digoxin, 7 and the UGT substrates, raloxifene 8 , 9 and lamotrigine. 10 Furthermore, enteric metabolism is known to play a key role in drug toxicity via the formation of toxic and reactive metabolites 11 and in efficacy via metabolic inactivation as well as prodrug activation. 12 , 13 It is therefore important to evaluate the role of intestinal drug metabolism in the development of orally administered drugs to assess bioavailability, toxicity, and efficacy.
Upon entrance to the intestinal lumen, an orally administered drug travels from the proximal to distal regions of the small intestine where the drug is subjected to absorption and metabolism by the intestinal mucosal epithelium. Knowledge of regional differences in drug metabolizing enzyme activities of the small intestine can aid the assessment of enteric metabolism of an orally administered drug during its transit in the intestinal tract. An important parameter of bioavailability, the fraction of drug that escapes intestinal metabolism (Fg), 14 for instance, is a function of the abundance of the drug metabolizing enzymes responsible for its metabolism in various regions of the small intestine.
Human hepatic drug metabolism has been extensively defined due to the availability of in vitro experimental systems. Primary cultured human hepatocytes, which, because of the intact plasma membrane, uninterrupted cellular organelles, and endogenous cofactors, are generally considered as the “gold standard” experimental system for in vitro evaluation of human hepatic drug properties 15 , 16 over cell‐free systems such as human liver postmitochondrial supernatant (S9), microsomes, and cDNA‐derived liver microsomes. In contrast, until recently, in vitro evaluation of human enteric drug metabolism has been hampered by the lack of experimental models with adequate drug metabolizing enzyme activities. Human in vitro enteric systems such as Caco‐2 and primary enterocyte cultures derived from crypt and stem cells are known to express drug metabolizing enzymes substantially lower than that in the human small intestine in vivo. 17 , 18 , 19 , 20 , 21 To overcome this major obstacle in the evaluation of enteric drug metabolism, our laboratory evaluated an approach previously found successful with human in vitro hepatic models, namely isolation of metabolically competent cells from the organ of interest followed by immediate cryopreservation without culturing. Our investigations led to the development of in vitro enteric systems with robust drug metabolizing enzyme activities, namely cryopreserved human enterocytes, 22 , 23 , 24 permeabilized cofactor‐supplemented (MetMax™) cryopreserved human enterocytes, 23 , 24 and cryopreserved human intestinal mucosal epithelium (CHIM). 25 These experimental models are now being applied toward the assessment of human enteric drug properties in drug development. 24 The current status of in vitro enteric systems for the evaluation of drug metabolism and drug interactions has been recently reviewed. 26
We report here the results of a study evaluating potential inter‐individual and inter‐regional differences in drug metabolizing enzyme activities in the human small intestine. Activities of 15 drug metabolizing enzymes (CYP1A2, CYP2A6, CYP2B6, CYP2C8, CYP2C9, CYP2C19, CYP2D6, CYP2E1, CYP3A, UGT, SULT, FMO, MAO, AO, and NAT2) were quantified in CHIM derived from the duodenum, jejunum, and ileum of 10 donors as well as from 10 consecutive 12‐inch segments of the small intestines from four donors. The purpose of our study is to provide information to complement current knowledge on the distribution of drug metabolizing enzymes in the human small intestine, 27 , 28 , 29 furthering our understanding of the role of the metabolic fate, drug interaction potential, pharmacology, and toxicology of orally administered drugs.
2. MATERIALS AND METHODS
2.1. Chemicals
Acetaminophen, astemizole, bupropion, N‐acetyl‐p‐aminobenzoic acid, 4‐aminobenzoic acid, benzydamine hydrochloride, chlorzoxazone, coumarin, dextromethorphan hydrobromide, 7‐Ethoxyresorufin, 7‐Hydroxycoumarin β‐D‐glucuronide sodium salt, 7‐Hydroxycoumarin sulfate potassium salt, 6β‐hydroxy testosterone, irinotecan, midazolam, phenacetin, resorufin, SN38, and sulfamethazine were purchased from Sigma Aldrich. Dextrorphan tartrate, diclofenac sodium salt, 4‐hydroxydiclofenac, hydroxy bupropion, S‐mephenytoin, 4‐hydroxyquinoline, paclitaxel, and testosterone were purchased from Cayman Chemical. 7‐hydroxycoumarin was purchased from Chem Service. Benzydamine N‐oxide, kynuramine hydrobromide, and N‐acetyl sulfamethazine were obtained from Santa Cruz Biotechnology. Carbazeran, 4‐hydroxycarbazeran, 6‐hydroxychlorzoxazone, 6α‐hydroxy paclitaxel, 1′‐hydroxymidazolam, and 4‐hydroxy‐S‐mephenytoin were obtained from Toronto Research Chemicals.
2.2. Human intestine
Human small intestines from 14 individuals were evaluated in this study. The tissues were obtained from the International Institute for the Advancement of Medicine (IIAM) as tissues intended but not used for transplantation. The small intestines were collected and stored in University of Wisconsin solution 30 and shipped to our laboratory on wet ice with a cold ischemic time (time on ice from initial placement on ice to processing of the tissue for CHIM isolation) of less than 24 hours. The demographics of the 14 donors are presented in Table 1.
TABLE 1.
Demographic information of the donors of the small intestines used in the preparation of CHIM for the study
| DONOR | Lot number | Region | Gender | Race | Age (years) | BMI | BT | Cause of death | Disease | Alcohol | Tobacco | Substance |
|---|---|---|---|---|---|---|---|---|---|---|---|---|
| 1 | CHIM6001D | Duodenum | M | C | 20 | 30.62 | O | CVA, Anoxia | None reported | NO | NO | YES |
| CHIM6003J | Jejunum | |||||||||||
| CHIM6005I | Ileum | |||||||||||
| 2 | CHIM6006‐I | Duodenum | M | C | 20 | 26.33 | A | Anoxia | None reported | YES | YES | NO |
| CHIM6007‐J | Jejunum | |||||||||||
| CHIM6008‐D | Ileum | |||||||||||
| 3 | CHIM6014J | Duodenum | M | C | 35 | 24.83 | A | Head Trauma | Thrush | OCCASIONAL | YES | YES |
| CHIM6021I | Jejunum | |||||||||||
| CHIM6022D | Ileum | |||||||||||
| 4 | CHIM6010J | Duodenum | M | C | 59 | 37.88 | A | Head Trauma | HTN | NO | NO | NO |
| CHIM6015D | Jejunum | |||||||||||
| CHIM6016I | Ileum | |||||||||||
| 5 | CHIM6017J | Duodenum | F | C | 57 | 37.5 | A | CVA, Anoxia | Ovarian cancer | YES | YES | YES |
| CHIM6018D | Jejunum | |||||||||||
| CHIM6019I | Ileum | |||||||||||
| 6 | CHIM6030D | Duodenum | M | C | 64 | 29.52 | A | CVA, Anoxia | HTN | NO | NO | NO |
| CHIM6028J | Jejunum | |||||||||||
| CHIM6029I | Ileum | |||||||||||
| 7 | CHIM6036‐D | Duodenum | F | C | 44 | 24.26 | O | Drug Overdose | None reported | YES | YES | YES |
| CHIM6034‐J | Jejunum | |||||||||||
| CHIM6035‐I | Ileum | |||||||||||
| 8 | CHIM6043‐D | Duodenum | M | C | 35 | 23.38 | A | Drug Overdose | None reported | YES | YES | YES |
| CHIM6044‐J | Jejunum | |||||||||||
| CHIM6045‐I | Ileum | |||||||||||
| 9 | CHIM6050‐D | Duodenum | F | C | 35 | 19.67 | O | CVA/Stoke, ICH | Polycystic kidney disease | YES | YES | NO |
| CHIM6048‐J | Jejunum | |||||||||||
| CHIM6049‐I | Ileum | |||||||||||
| 10 | HE3061‐D | Duodenum | M | H | 58 | 30.27 | O | CVA/Stoke, ICH | None reported | OCCASIONAL | YES | NO |
| HE3064‐J | Jejunum | |||||||||||
| HE3048‐I | Ileum | |||||||||||
| 11 | CHIM6023 | A to J | F | C | 49 | 32.17 | A | CVA/Stoke, ICH | Diabetes | NO | NO | NO |
| 12 | CHIM6037 | A to J | F | AMERICAN SAMOAN | 59 | 33.42 | A | CVA, Anoxia | None reported | NO | NO | NO |
| 13 | CHIM6038 | A to J | M | C | 38 | 21.52 | O | Head Trauma | Hemochromatosis | YES | YES | YES |
| 14 | CHIM6039 | A to J | M | AA | 57 | 41.19 | A | CVA/Stoke, ICH | HTN | YES | YES | NO |
Abbreviations: AA, African American; BMI, body mass index; C, Caucasian; CVA, cardiovascular arrest; F, female; HTN, hypertension; M, male; Substance, substance of abuse.
2.3. Ethics statement
All human tissues from IIAM had explicit donor/immediate family approval and Institutional Review Board approval for use in research.
2.4. CHIM isolation and cryopreservation
A schematic of the isolation of CHIM from the various regions of the human small intestine is shown in Figure 1. CHIM were prepared from the duodenum, jejunum, and ileum from donors 1‐10 and from 10 consecutive 12‐inch segments spanning the duodenum (segment A), jejunum (segments B to I), and proximal ileum (segment J) of donors 11‐14. Isolation of mucosa was performed via enzymatic digestion of the intestinal lumen using procedures established in our laboratory, 25 which are based on that previously reported for porcine intestines. 31 , 32
FIGURE 1.

Schematic representation of the regions of the human small intestine evaluated in this study. For intestines from donors 1‐10, CHIM were prepared from the duodenum, jejunum, and ileum. For donors 11‐14, 10 consecutive 12‐inch segments were prepared spanning the duodenum (segment A), jejunum (segments B to I), and the proximal regions of the ileum (segment J). CHIM was prepared by collagenase digestion of the intestinal lumen. The intestinal mucosa released from enzyme digestion was gently homogenized to multicellular aggregates followed by cryopreservation in liquid nitrogen as previously reported 25
2.5. Recovery of CHIM
CHIM vials were removed from liquid nitrogen storage and thawed in a 37°C water bath for approximately 2 minutes. The contents of each individual vial were decanted into a 50‐mL conical tube containing Cryopreserved Enterocyte Recovery Medium (CERMTM, In Vitro ADMET Laboratories) that was prewarmed in a 37°C water bath. The thawed CHIM were recovered by centrifugation at 100× g for 10 minutes at room temperature. After centrifugation, the supernatant was removed by decanting. A volume of 5 mL of Hepatocyte Incubation Medium (HQM) at 4°C was added to the intact pellet of enterocytes at the bottom of the conical tube followed by briskly pipetting five times with a P1000 micropipette to create an even suspension of the intestinal mucosal fragments.
2.6. Incubation of CHIM with drug metabolizing enzyme substrates
Substrates, concentrations, and the metabolites quantified for the multiple drug metabolism pathways evaluated are shown in Table 2 for P450 isoforms and Table 3 for non‐P450 drug metabolizing enzymes. Incubations of CHIM and metabolism substrates were performed in a cell culture incubator maintained at 37°C with a humidified atmosphere of 5% CO2. A volume of 50 uL of drug metabolizing enzyme substrates at 2× of the final desired concentrations was added into the designated wells of 96‐well plates (reaction plate). The reaction plate was placed in a cell culture incubator for 15 minutes to prewarm the substrate solutions to 37°C, followed by addition of CHIM at a volume of 50 uL per well to initiate the reaction. The reaction plates were then incubated at 37°C for 30 minutes. All incubations were performed in triplicate. Metabolism was terminated in each well by the addition of 200‐µL acetonitrile containing 250 nM of the internal standard tolbutamide. The incubated samples were stored at −80°C for the subsequent LC/MS‐MS analysis.
TABLE 2.
A summary of the P450 isoform‐selective substrates and their respective metabolites quantified for CHIM
| Isoform | Substrate | Substrate conc. (µmol/L) | Metabolites quantified |
|---|---|---|---|
| CYP1A1 | 7‐Ethoxyresorufin | 20 | Resorufin |
| CYP1A2 | Phenacetin | 100 | Acetaminophen |
| CYP2A6 | Coumarin | 50 | 7‐HC, 7‐HC‐Sulfate, 7‐HC‐Glucuronide |
| CYP2B6 | Bupropion | 500 | Hydroxy bupropion |
| CYP2C8 | Paclitaxel | 20 | 6α‐hydroxy paclitaxel |
| CYP2C9 | Diclofenac | 25 | 4‐hydroxydiclofenac |
| CYP2C19 | S‐Mephenytoin | 250 | 4‐hydroxy S‐Mephenytoin |
| CYP2D6 | Dextromethorphan | 15 | Dextrorphan |
| CYP2E1 | Chlorzoxazone | 250 | 6‐hydroxy chlorzoxazone |
| CYP2J2 | Astemizole | 50 | O‐Demethyl Astemizole |
| CYP3A‐1 | Midazolam | 20 | 1′‐hydroxymidazolam |
| CYP3A‐2 | Testosterone | 200 | 6β‐hydroxy testosterone |
TABLE 3.
A summary of the non‐P450 pathway‐selective substrates and their respective metabolites quantified in CHIM
| DME pathway | Substrate | Substrate conc. (µmol/L) | Metabolites quantified |
|---|---|---|---|
| UGT | 7‐Hydroxycoumarin | 100 | 7‐Hydroxycoumarin Glucuronide |
| SULT | 7‐Hydroxycoumarin | 100 | 7‐Hydroxycoumarin Sulfate |
| FMO | Benzydamine HCl | 250 | Benzydamine‐N‐Oxide |
| MAO | Kynuramine HBr | 160 | 4‐hydroxyquinoline |
| AO | Carbazeran | 20 | 4‐Hydroxycarbazeran |
| NAT1 | 4‐Aminobenzoic Acid | 200 | N‐Acetyl‐p‐aminobenzoic acid |
| NAT2 | Sulfamethazine | 100 | N‐Acetyl‐sulfamethazine |
| CES2 | Irinotecan | 50 | SN38 |
2.7. Quantification of protein concentration
As CHIM consists of multiple cell aggregates, cellular contents were quantified as protein concentrations. Determination of protein concentration was performed using the Pierce BCA Protein Assay Kit (Thermo Fisher Scientific) per instructions specified by the manufacturer.
2.8. LC/MS/MS analysis
Quantification of CYP1A2, CYP2A6, CYP2B6, CYP2C8, CYP2C9, CYP2C19, CYP2D6, CYP2E1, CYP3A (midazolam 1′‐hydroxylation (CYP3A‐1), testosterone 6β‐hydroxylation (CYP3A‐2), UGT, SULT, FMO, MAO, AO, and NAT2 metabolites was performed with an API 5000 mass spectrometer with an electrospray ionization source (AB SCIEX) connected to Waters Acquity UPLC (Waters Corporation) using LC/MS/MS MRM mode, monitoring the mass transitions (parent to daughter ion) as previously described. 25 Data acquisition and data procession were performed with the software Analyst 1.6.2 (AB SCIEX). Metabolite formation was quantified based on metabolite/internal standard peak ratio using standard curves with standard curve samples analyzed before, after, as well as interspersed within the experimental samples.
2.9. Data analysis
2.9.1. Specific activity
Specific activity (pmol/min/mg protein) of each drug metabolizing enzyme pathway was determined by dividing the total metabolite formed by the incubation time and normalized to protein contents.
2.9.2. Relative regional activity
Drug metabolizing enzyme activities of the various regions of the human intestines were also expressed as relative regional activity for statistical evaluation of regional differences using the following equation:
where specific activity (segment) is that for each individual segment (duodenum, jejunum, or ileum; each of the A‐J segments) of a specific donor, while average activity (all segments) is the mean activity of the various regions (duodenum, jejunum, and ileum or segments A to J) of the same donor.
2.9.3. Statistical analysis
Data are presented as mean and standard errors of triplicate incubations derived using the Microsoft Excel 6.0 software and the GraphPad Prism software. Statistical analysis comparing activities of the different regions of the small intestines was performed by Tukey's multiple comparison test using the GraphPad Prism 8 software. Probability values (P) equal or lower than .05 are considered statistically significant.
3. RESULTS
3.1. Drug metabolizing enzyme activities in CHIM from duodenum, jejunum, and ileum of 10 donors
3.1.1. Comparison of drug metabolizing enzyme pathways
The mean activities of the drug metabolizing enzyme pathways evaluated in CHIM prepared from the duodenum, jejunum, and ileum of 10 donors are shown in Table 4. MAO was found to be the most active pathway with mean specific activities (pmol/min/mg protein) of 1582.95 ± 328.79, 2589 ± 662.74, and 1715 ± 457.95 for duodenum, jejunum, and ileum, respectively. Of all the P450 isoforms, CYP3A‐2 activity (testosterone β‐hydroxylation was) is the most active, with specific activities of 112.90 ± 65.29 (duodenum), 199.40 ± 80.40 (jejunum), and 71.09 ± 33.86 (ileum). AO was the least active drug metabolizing enzyme that was quantifiable, with specific activities of 0.07 ± 0.02 (duodenum), 0.06 ± 0.01 (jejunum), and 0.13 ± 0.04 (ileum). CYP2A6 activity was not quantifiable (data not shown).
TABLE 4.
P450 (top) and non‐P450 (bottom) drug metabolizing enzyme specific activities in CHIM from the duodenum, jejunum, and ileum of the small intestines (Mean and standard errors (sem) of 10 donors)
| Region | Specific activity (pmol/min/mg protein) | |||||||||||
|---|---|---|---|---|---|---|---|---|---|---|---|---|
| Pathway | CYP1A1 | CYP1A2 | CYP2B6 | CYP2C8 | CYP2C9 | CYP2C19 | CYP2D6 | CYP2E1 | CYP2J2 | CYP3A‐1 | CYP3A‐2 | |
| Duodenum | Mean | 1.21 | 5.72 | 0.71 | 0.19 | 5.75 | 2.53 | 1.68 | 3.07 | 14.68 | 10.77 | 112.90 |
| SEM | 0.23 | 1.54 | 0.20 | 0.04 | 3.37 | 1.19 | 1.22 | 2.15 | 4.27 | 6.77 | 65.29 | |
| Jejunum | Mean | 1.22 | 5.71 | 0.86 | 0.25 | 9.11 | 4.45 | 0.80 | 1.08 | 15.20 | 13.84 | 199.40 |
| SEM | 0.38 | 1.25 | 0.25 | 0.07 | 2.92 | 1.77 | 0.37 | 0.44 | 5.69 | 3.92 | 80.40 | |
| Ileum | Mean | 1.23 | 7.26 | 1.03 | 0.19 | 3.87 | 1.15 | 0.55 | 3.39 | 12.16 | 6.71 | 71.09 |
| SEM | 0.29 | 1.68 | 0.34 | 0.07 | 1.65 | 0.45 | 0.26 | 2.07 | 3.81 | 2.66 | 33.86 | |
| Region | Specific activity (pmol/min/mg protein) | ||||||||
|---|---|---|---|---|---|---|---|---|---|
| Pathway | UGT | SULT | FMO | MAO | AO | NAT1 | NAT2 | CES2 | |
| Duodenum | Mean | 4.81 | 7.03 | 8.26 | 1582.95 | 0.07 | 17.95 | 5.00 | 3.13 |
| SEM | 1.21 | 3.79 | 0.87 | 328.79 | 0.02 | 5.55 | 1.07 | 0.68 | |
| Jejunum | Mean | 16.02 | 12.97 | 10.59 | 2589.98 | 0.06 | 70.51 | 7.95 | 2.96 |
| SEM | 4.90 | 4.75 | 1.26 | 662.74 | 0.01 | 30.57 | 1.75 | 0.56 | |
| Ileum | Mean | 10.98 | 10.36 | 9.10 | 1715.12 | 0.13 | 22.88 | 4.36 | 2.97 |
| SEM | 4.91 | 5.38 | 1.26 | 457.95 | 0.04 | 7.86 | 0.75 | 0.71 | |
Abbreviation: SEM, standard error of the mean.
3.1.2. Relative expression of enteric drug metabolizing enzymes
A pie chart of illustrating the relative expression of the various drug metabolizing enzymes in the duodenum based on the mean activity of the 10 donors (tabulated in Tables 3 and 4) is shown in Figure 2. MAO represented the most abundant of all pathways. CYP3A was the most abundant of all P450 isoforms. Similar relative expression was observed for the jejunum and ileum (pie charts not shown).
FIGURE 2.
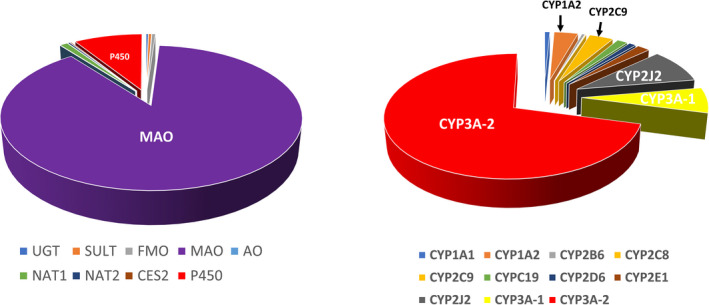
Pie charts depicting the relative contribution of the various drug metabolizing enzyme pathways in enteric drug metabolism. The pie charts were constructed based on activities quantified in CHIM from the duodenum. The distribution is similar for the jejunum and ileum. Results are from the mean specific activity of 10 donors. The relative contribution of all pathways (left) and for the individual isoforms for P450 pathways (right) are shown
3.1.3. Individual variations
Drug metabolizing enzyme activities for each of the 10 donors are shown in Figure 3 (P450 isoforms) and Figure 4 (non‐P450 pathways). Large individual variations, with activities differed by over two orders of magnitude, are shown for all P450 isoforms (except CYP1A2 and CYP2J2), UGT, SULT, and NAT1. FMO and MAO had the lowest individual variations, with specific activities within the same order of magnitude for the duodenum, jejunum, and ileum of the 10 donors.
FIGURE 3.
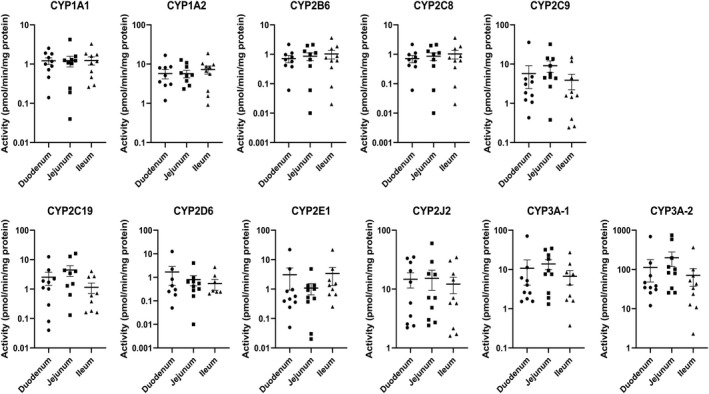
P450 isoform‐selective drug metabolizing enzyme activities in CHIM from the duodenum, jejunum, and ileum of the small intestines from 10 individual donors quantified using isoform‐selective pathways. Each symbol represents activity from CHIM isolated from each of the regions from a single donor. The horizontal bars represent the mean and standard error values of the 10 donors. CYP3A‐1 and CYP3A‐2 represent midazolam 1′‐hydroxylation and testosterone 6‐β hydroxylation activities, respectively. No statistically significant differences were observed among activities from duodenum, jejunum, and ileum
FIGURE 4.
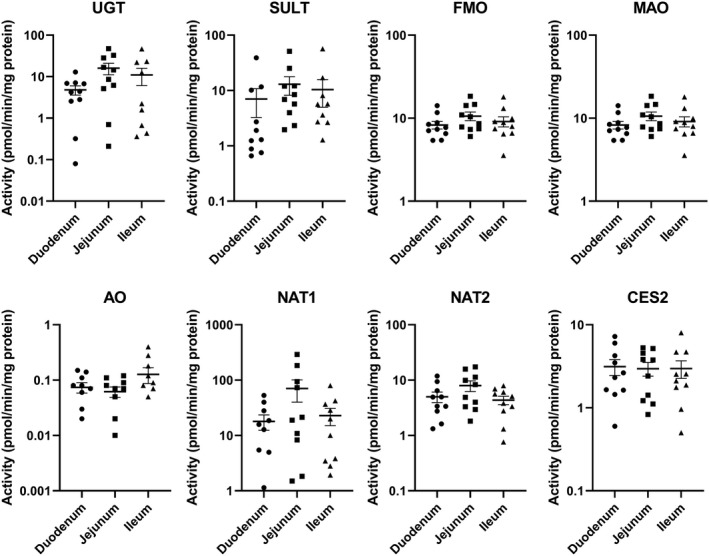
Non‐P450 drug metabolizing enzyme activities in CHIM from the duodenum, jejunum, and ileum of the small intestines from 10 individual donors. Each symbol represents activity from CHIM isolated from each of the regions from a single donor. The horizontal bars represent the mean and standard error values of the 10 donors. No statistically significant differences were observed among activities from duodenum, jejunum, and ileum
3.1.4. Regional difference
To minimize the contribution of individual variation in the evaluation of regional variations, activity from each region of the small intestine was expressed as “relative regional activity” by normalization of the activity of each of the three regions to the average activity of the three regions of each donor. Results with relative activity demonstrate statistically significant higher relative activities for jejunum than duodenum and/or ileum for the P450 isoforms CYP2C9, 3A‐1, and 3A‐2 (Figure 5), and for the non‐P450 pathways UGT, SULT, MAO, NAT1, and NAT2 (Figure 6). A comparison of the CYP3A‐1 activity (midazolam 1′‐hydroxylation) in CHIM from the duodenum, jejunum, and ileum in each of the 10 donors is shown in Figure 7, with jejunum found to have statistically significant higher activities than duodenum and/or ileum in seven of the 10 donors.
FIGURE 5.
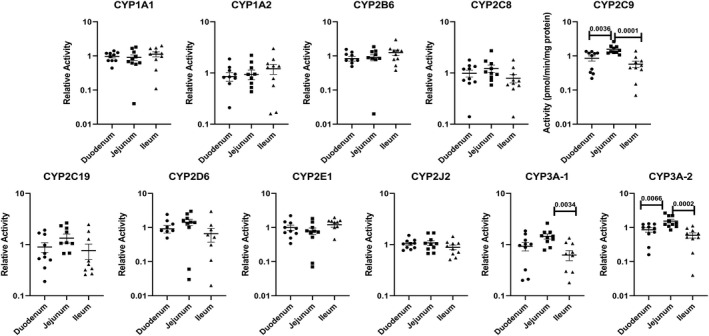
Relative activities for P450 isoforms in CHIM from the duodenum, jejunum, and ileum of the small intestines from 10 individual donors. The relative activities were calculated as a ratio of the specific activity of each of the three regions (duodenum, jejunum, and ileum) to the average specific activity of all three regions for each donor. Each symbol represents relative activity of CHIM from each of the regions from a single donor. The horizontal bars represent the mean and standard error values of the 10 donors. The probability values are indicated where statistically significant differences (P < .05) were observed
FIGURE 6.
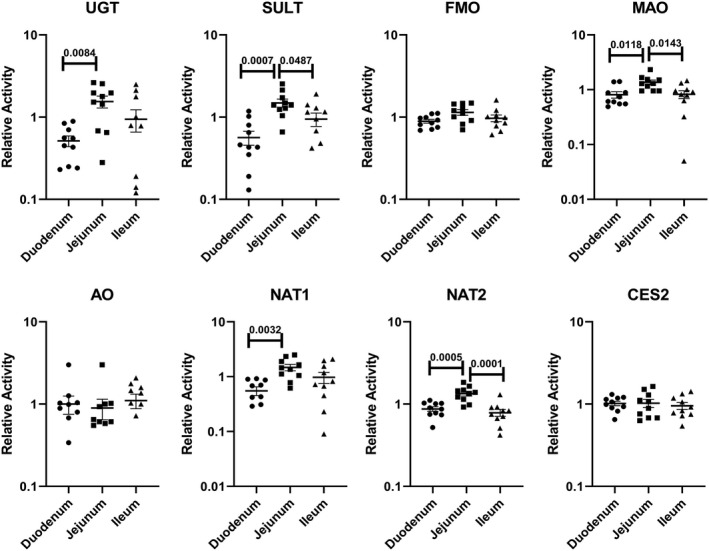
Relative activities of non‐P450 drug metabolizing enzymes in CHIM from the duodenum, jejunum, and ileum of the small intestines from 10 individual donors. Relative activity was calculated as a ratio of the specific activity of each of the three regions (duodenum, jejunum, and ileum) to the average specific activity of all three regions for each donor. Each symbol represents relative activity of CHIM from each of the regions from a single donor. The horizontal bars represent the mean and standard error values of the 10 donors. The probability values are indicated where statistically significant differences (P < .05) were observed
FIGURE 7.
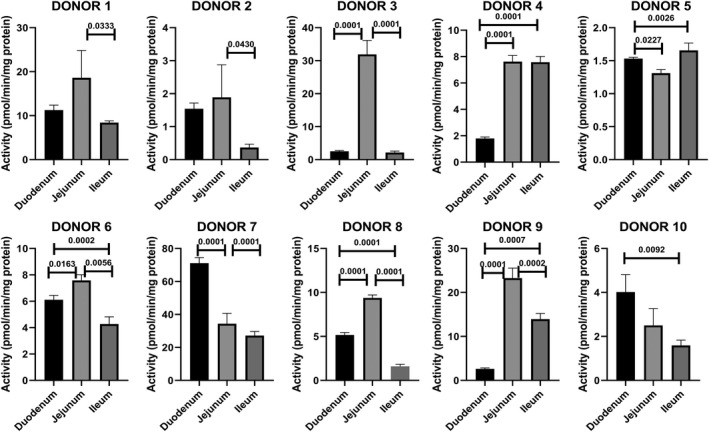
CYP3A activity quantified as midazolam 1′‐hydroxylation (CYP3A‐1) in CHIM derived from the duodenum, jejunum, and ileum of donors 1 to 10. The probability values of regions that are statistically different (P < .05) from other regions are shown
3.2. Drug metabolizing enzyme activities of CHIM from 10 consecutive 12‐inch sections of the small intestines of four donors
3.2.1. Comparison of drug metabolizing enzyme pathways
The mean activities of the drug metabolizing enzyme pathways in CHIM from the 10 consecutive 12‐inch segments from the four donors are shown in Table 5 (P450 isoforms) and Table 6 (non‐P450 pathways). As observed in the duodenum, jejunum, and ileum, MAO was found to be the most active pathway, with mean specific activities (pmol/min/mg protein) ranged from 2991.06 ± 1564.21 (E) to 14 429.44 ± 473.95 (segment A) (Table 6). CYP3A activity based on testosterone β‐hydroxylation (CYP3A‐2) was the most active, with specific activities ranged from 73.66 ± 22.65 (segment H) to 533.65 ± 230.85 (segment B). AO was the least active drug metabolizing enzyme that was quantifiable, with specific activities of 0.06 ± 0.01 (segment J) to 0.71 ± 0.59 (segment B). As in the duodenum, jejunum, and ileum, CYP2A6 activity was not quantifiable (data not shown).
TABLE 5.
P450 isoform‐specific activities in CHIM derived from 10 consecutive 12‐inch segments of the small intestines of four donors. Segment A was isolated from the 12‐inch segment proximal to the pyloric sphincter, while all other segments were 12‐inch segments distal to segment A
| DME | Specific activity (pmol/min/mg protein) | ||||||||||
|---|---|---|---|---|---|---|---|---|---|---|---|
| A | B | C | D | E | F | G | H | I | J | ||
| CYP1A1 | Mean | 2.08 | 1.60 | 1.44 | 0.99 | 1.21 | 1.46 | 1.59 | 1.44 | 1.28 | 1.37 |
| SEM | 0.23 | 0.28 | 0.27 | 0.27 | 0.33 | 0.30 | 0.16 | 0.26 | 0.22 | 0.17 | |
| CYP1A2 | Mean | 12.32 | 8.35 | 17.74 | 13.60 | 6.54 | 6.91 | 4.14 | 10.15 | 9.91 | 13.84 |
| SEM | 5.19 | 3.83 | 12.85 | 7.73 | 2.03 | 1.81 | 0.68 | 6.61 | 4.68 | 7.37 | |
| CYP2B6 | Mean | 0.95 | 1.02 | 1.49 | 1.54 | 1.86 | 1.57 | 1.67 | 1.76 | 1.33 | 1.94 |
| SEM | 0.37 | 0.23 | 0.68 | 0.75 | 1.08 | 0.83 | 1.05 | 1.20 | 0.64 | 1.08 | |
| CYP2C8 | Mean | 0.23 | 0.38 | 0.63 | 0.79 | 0.37 | 0.37 | 0.54 | 0.44 | 0.46 | 0.41 |
| SEM | 0.09 | 0.22 | 0.27 | 0.39 | 0.23 | 0.21 | 0.18 | 0.21 | 0.20 | 0.20 | |
| CYP2C9 | Mean | 7.24 | 13.50 | 12.26 | 11.30 | 9.47 | 8.78 | 8.13 | 6.39 | 6.04 | 6.00 |
| SEM | 1.69 | 4.25 | 4.44 | 6.37 | 3.78 | 2.74 | 3.01 | 2.01 | 1.58 | 2.47 | |
| CYP2C19 | Mean | 3.26 | 6.33 | 4.75 | 4.86 | 3.68 | 3.77 | 1.82 | 1.19 | 1.44 | 1.48 |
| SEM | 1.79 | 3.13 | 2.45 | 3.60 | 1.90 | 1.90 | 0.67 | 0.31 | 0.66 | 0.47 | |
| CYP2D6 | Mean | 0.42 | 1.29 | 1.36 | 1.15 | 1.15 | 1.30 | 1.28 | 1.26 | 0.97 | 1.07 |
| SEM | 0.21 | 0.59 | 0.95 | 0.87 | 0.85 | 1.02 | 1.01 | 1.05 | 0.76 | 0.93 | |
| CYP2E1 | Mean | 0.73 | 0.82 | 1.18 | 0.89 | 1.63 | 1.60 | 1.07 | 0.97 | 1.56 | 1.49 |
| SEM | 0.27 | 0.23 | 0.38 | 0.22 | 0.21 | 0.21 | 0.44 | 0.39 | 0.27 | 0.21 | |
| CYP2J2 | Mean | 13.79 | 14.30 | 33.48 | 37.89 | 40.52 | 42.23 | 26.02 | 27.34 | 71.76 | 88.12 |
| SEM | 3.96 | 4.04 | 7.53 | 9.55 | 15.94 | 13.28 | 7.82 | 7.20 | 39.44 | 57.24 | |
| CYP3A‐1 | Mean | 9.70 | 27.87 | 20.25 | 24.69 | 18.12 | 14.71 | 10.54 | 6.72 | 7.14 | 10.89 |
| SEM | 1.58 | 13.88 | 9.44 | 18.31 | 8.67 | 6.94 | 3.52 | 1.36 | 1.83 | 4.01 | |
| CYP3A‐2 | Mean | 235.80 | 533.65 | 376.89 | 303.98 | 359.48 | 297.98 | 182.85 | 155.63 | 206.16 | 301.18 |
| SEM | 106.46 | 230.85 | 162.82 | 150.88 | 158.01 | 116.13 | 87.63 | 83.52 | 131.30 | 199.13 | |
TABLE 6.
Specific activity of non‐P450 drug metabolizing enzymes in CHIM derived from 10 consecutive 12‐inch segments of the small intestines of four donors. Segment A was isolated from the 12‐inch segment proximal to the pyloric sphincter, while all other segments were 12‐inch segments distal to segment A
| DME | Specific activity (pmol/min/mg protein) | ||||||||||
|---|---|---|---|---|---|---|---|---|---|---|---|
| A | B | C | D | E | F | G | H | I | J | ||
| UGT | Mean | 11.14 | 16.08 | 19.53 | 24.83 | 16.69 | 10.18 | 17.11 | 7.09 | 9.49 | 16.38 |
| SEM | 5.20 | 7.28 | 10.29 | 16.22 | 10.73 | 4.26 | 10.52 | 3.85 | 3.85 | 9.01 | |
| SULT | Mean | 2.79 | 4.09 | 4.21 | 3.89 | 3.71 | 3.31 | 4.26 | 3.77 | 3.21 | 3.50 |
| SEM | 0.92 | 1.24 | 1.84 | 2.26 | 1.71 | 1.44 | 2.10 | 1.70 | 0.71 | 1.58 | |
| FMO | Mean | 31.72 | 45.13 | 47.15 | 56.42 | 62.63 | 71.57 | 91.50 | 91.83 | 86.55 | 137.22 |
| SEM | 20.04 | 29.36 | 31.78 | 39.89 | 45.18 | 54.81 | 79.44 | 78.53 | 68.38 | 117.79 | |
| MAO | Mean | 1429.44 | 2400.50 | 2332.02 | 1821.18 | 2991.06 | 2327.78 | 2890.56 | 2882.78 | 2077.89 | 1974.44 |
| SEM | 473.95 | 1420.33 | 1241.22 | 1163.93 | 1564.21 | 663.93 | 1306.51 | 1214.40 | 823.31 | 1059.52 | |
| AO | Mean | 0.33 | 0.55 | 0.12 | 0.11 | 0.11 | 0.11 | 0.20 | 0.09 | 0.14 | 0.09 |
| SEM | 0.21 | 0.45 | 0.02 | 0.03 | 0.02 | 0.02 | 0.11 | 0.02 | 0.02 | 0.03 | |
| NAT1 | Mean | 74.96 | 118.16 | 88.24 | 71.71 | 36.74 | 38.83 | 133.92 | 89.16 | 42.92 | 52.46 |
| SEM | 36.86 | 57.35 | 41.08 | 36.79 | 13.29 | 13.69 | 108.59 | 65.09 | 22.03 | 33.53 | |
| NAT2 | Mean | 15.37 | 18.56 | 14.00 | 14.06 | 13.64 | 13.02 | 16.52 | 12.71 | 10.24 | 10.80 |
| SEM | 4.61 | 4.13 | 2.52 | 3.53 | 4.26 | 4.53 | 8.32 | 4.70 | 3.07 | 4.40 | |
| CES2 | Mean | 3.91 | 4.24 | 4.88 | 3.55 | 4.63 | 4.15 | 5.18 | 3.27 | 3.79 | 3.72 |
| SEM | 1.41 | 1.58 | 1.72 | 1.68 | 2.21 | 1.73 | 1.88 | 1.05 | 1.32 | 1.48 | |
3.2.2. Regional variations
Drug metabolizing enzyme activities for segments A‐J in each of the four donors are shown in Figures 8, 9, 10, 11. Plots of relative regional activity values (mean of the four donors) for each of the pathways are shown in Figure 12. The results show that the proximal regions of the jejunum in general have the higher activities.
FIGURE 8.
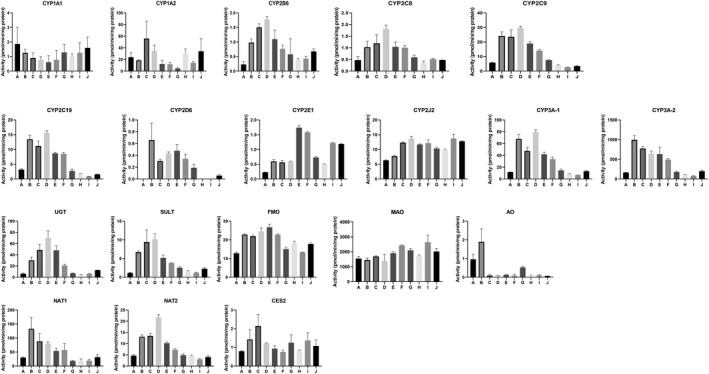
Drug metabolizing enzyme activities of CHIM derived from 10 consecutive 12‐inch segments of the small intestine of Donor 11 (49 y.o. Caucasian Female)
FIGURE 9.
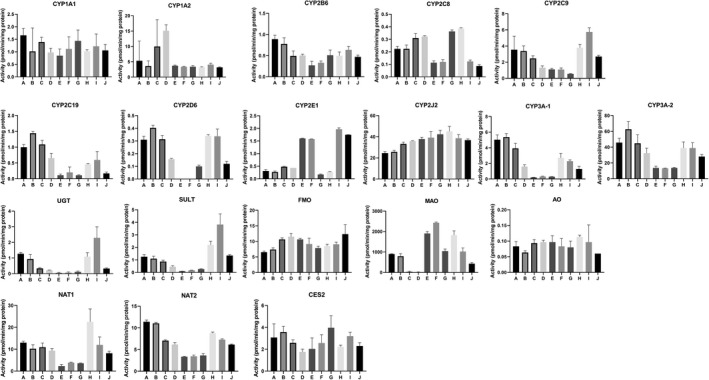
Drug metabolizing enzyme activities of CHIM derived from 10 consecutive 12‐inch segments of the small intestine of Donor 12 (59 y.o. Samoan Female)
FIGURE 10.
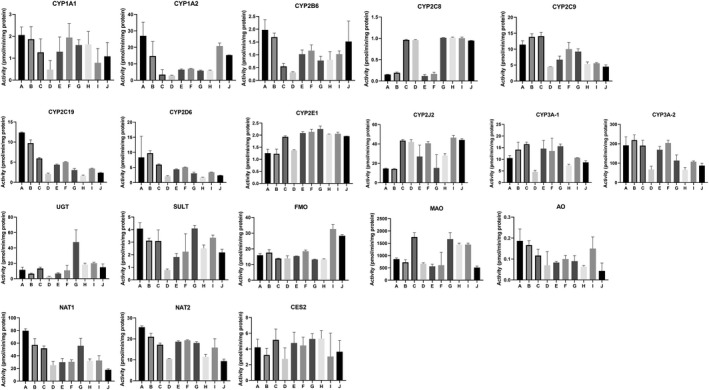
Drug metabolizing enzyme activities of CHIM derived from 10 consecutive 12‐inch segments of the small intestine of Donor 13 (38 y.o. Caucasian Male)
FIGURE 11.
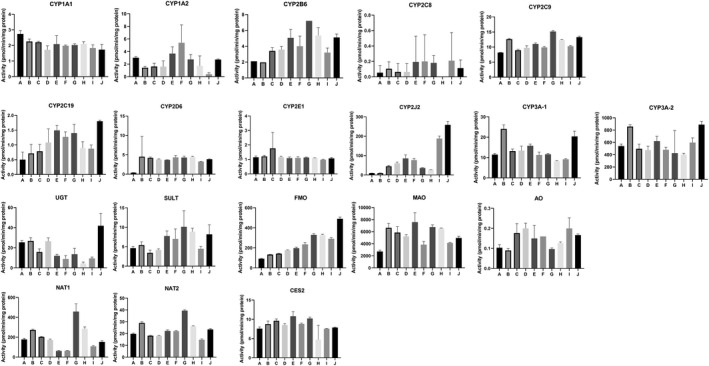
Drug metabolizing enzyme activities of CHIM derived from 10 consecutive 12‐inch segments of the small intestine of Donor 14 (57 y.o. African American Male
FIGURE 12.
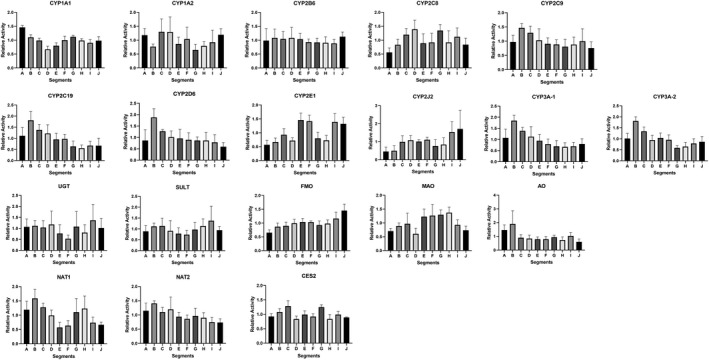
Relative activities of P450 and non‐P450 drug metabolizing enzymes in CHIM from the 10 consecutive 12‐inch segments of the small intestine. Results represent the mean and standard errors of the relative activities for donors 11 ‐ 14
4. DISCUSSION
We have recently reported successful preparation of CHIM with retention of robust drug metabolizing enzyme activities. 25 This novel enteric system is being applied in our laboratory to investigate various aspects of enteric drug metabolism. This report represents our endeavor to evaluate inter‐individual and inter‐regional variations in enteric drug metabolism. We evaluated P450 (CYPs 1A1, 1A2, 2A6, 2B6, 2C8, 2C9, 2C19, 2J2, and 3A) and non‐P450 (UGT, SULT, MAO, FMO, AO, and CES) activities in CHIM isolated from the duodenum, jejunum, and ileum of 10 donors using pathway‐selective substrates, with two substrates used for CYP3A, namely midazolam and testosterone, which are known to occupy different regions of the active site. 33 To further define inter‐regional variations, we also evaluated CHIM from ten 12‐inch segments of the first 10 feet of the small intestine (segments A to J) from four additional donors, with the first segment (A) representing the duodenum, and the second to ninth segments (B to I) representing the proximal to distal regions of the jejunum, and the 10th segment (J) representing the proximal region of the ileum. Our results are intended to be complementary to that previously reported by others on enteric drug metabolizing enzymes based on gene expression and proteomics, 34 , 35 , 36 , 37 and drug metabolizing enzyme activity based on human intestinal microsomes, 27 , 28 , 35 , 38 , 39 , 40 , 41 , 42 , 43 freshly isolated human small intestinal slices, 44 as well as a recent report on the activity of various UGT isoforms in CHIM isolated from various regions of the human small intestine. 37
A major conclusion from our study is that all regions of the small intestine have similar composition of drug metabolizing enzymes. CHIM from the various regions of the human small intestines from the 14 donors were found to be active in the drug metabolizing enzyme pathways evaluated except for CYP2A6. Among the active enzyme pathways, MAO was found to have the highest specific activity, and AO the lowest. CYP3A was the most active P450 isoform (especially for testosterone 6β‐hydroxylation), a result similar to that previously reported 27 based on Western blotting analysis of microsomes prepared from mucosal scrapings from the duodenal/jejunal portion of 31 human donors. The composition of the various drug metabolizing enzyme pathways of the duodenum is shown in Figure 2 which are representative of that for all other segments of the human small intestine. In this study, the MAO activity evaluated based on the metabolism of kynuramine to 4‐hydroxyquinoline is likely a function of MAO‐A which is known to be extensively expressed in the human intestine. 45 , 46 , 47 The results suggest that substrates of MAO and CYP3A are likely to be extensively metabolized by the intestine upon oral administration. While the role of enteric CYP3A in bioavailability of its substrates has been well established, 48 , 49 , 50 , 51 much less information is available for MAO. It is interesting to note that MAO is a drug target to treat various psychological disorders. Oral administration of MAO inhibitor drugs, therefore, is likely to increase Fg of orally administered drugs and food‐associated chemicals that are MAO substrates. Patients taking MAO inhibitors, for instance, are advised to avoid foods rich in tyramine, a MAO substrate, to prevent the onset of tyramine‐induced hypertension. 52 , 53
Our results show that all regions of the human small intestine have the capacity to metabolize orally administered substrates of CYP1A1, CYP1A2, CYP2B6, CYP2C8, CYP2C9, CYP2C19, CYP2D6, CYP2E1, CYP2J2, CYP3A, UGT, SULT, MAO, FMO, AO, CES2, NAT1, and NAT2 but not that for CYP2A6. The lack of quantifiable enteric CYP2A6 activity confirms that reported by others with small intestines from cynomolgus monkeys 54 and mRNA expression in human small intestines. 55 The lack of CYP2A6 in the human small intestine is interesting as it is known to be expressed in the respiratory tract 56 and esophageal mucosa 57 in addition to the liver. One interesting implication of this confirmation of the lack of CYP2A6 activity in the human small intestine is that the reported correlation between CYP2A6 polymorphism and nicotine addiction 58 , 59 , 60 is not likely to be an enteric phenomenon, and that enteric nicotine metabolism is likely due to activities of other P450 isoforms such as CYP2B6. 61
Most investigations on individual differences in drug metabolism, a major contributing factor to inter‐individual differences in drug efficacy and toxicity, are focused on liver metabolism. 62 , 63 , 64 , 65 , 66 , 67 , 68 , 69 , 70 , 71 , 72 Our results with CHIM from the duodenum, jejunum, and ileum from 10 donors show that P450 isoforms, UGT, SULT, and NAT1, demonstrated relatively large inter‐individual variations for all three regions of the small intestine, with specific activities differing by more than three orders of magnitude. FMO, MAO, NAT2, and CES2 had lower inter‐individual differences, with the activities from the various donors falling within two orders of magnitude. Of all the pathways, FMO and MAO appear to have the lowest inter‐individual variations. The distribution of activities clusters around the mean except for CYP2J2 where the activities from the 10 donors were apparently separated into two distinct groups with activities above and below the mean value. This phenomenon may be related to a chance collection of donors with allelic variants of the human CYP2J2 gene resulting in reduced catalytic function, 73 , 74 , 75 , 76 which needs to be further confirmed by genotyping. Our results suggest that inter‐individual differences in enteric drug metabolism may contribute to variations in drug bioavailability, toxicity, and efficacy like that attributed to hepatic drug metabolism.
A second objective of our investigation is to evaluate inter‐regional differences in enteric drug metabolism. A unique feature of the small intestine is that metabolism of an absorbed drug mainly occurs in the enterocytes that the drug enters and exits, with minimal involvement by enterocytes in the rest of the intestine. This phenomenon is different from that in the liver, where the hepatocytes of the entire liver would participate in the metabolism of a drug that enters the liver. A thorough understanding of the distribution of drug metabolizing enzyme, in combination with other key parameters such as permeability, solubility, and gastric emptying time, will aid the assessment of the extent of enteric metabolism of an orally administered drug during its transit in the organ.
To minimize the confounding effects of individual differences in specific activities on the evaluation of potential regional differences, the data were expressed as “relative regional activity”, calculated as a ratio of the activity of each segment to the average of all segments (duodenum, jejunum, and ileum), followed by statistical evaluation of regional differences with data from the 10 donors. Using this approach, the jejunum was found to have the highest overall relative activity of CYP2C9, CYP3A‐1, CYP3A‐2, UGT, SULT, NAT1, and NAT2. Results with individual donors substantiate the “relative regional activity” approach, with CYP3A activity found to be significantly higher than duodenum and/or ileum in seven of the 10 donors, a result similar to that reported based on intestinal microsomes. 28
Upon demonstrating the jejunum has the highest activities for several drug metabolizing enzymes compared to duodenum and ileum, we proceeded to further define regional variations within the duodenum and jejunum using CHIM isolated from ten 12‐inch segments of the small intestines from four donors. The results show that relative activity peaks in the segments immediately after segment A (representing the duodenum) for CYP2C8, CYP2C9, CYP2C19, CYP3A‐1/2, and NAT1, suggesting that the proximal regions of the jejunum in general have higher drug metabolizing enzyme activities. Our results with UGT, SULT, and CES2 for CHIM from the various regions are similar to that previously reported. 29 , 77
In conclusion, our results provide clear evidence for inter‐individual and inter‐regional differences in enteric drug metabolism. The variations are likely results of genetic and environmental factors as observed for hepatic drug metabolism. The environmental factors may include foods, drugs, tobacco products, and environmental pollutants which can affect drug metabolizing enzyme activity as inducers and inhibitors, and may also act via the modification of the intestinal microbiome which is known to affect the expression of enteric drug metabolizing enzymes as observed for the hepatic pathways. 78 , 79 , 80 , 81
Our results support our previous assertion that CHIM represents a valuable in vitro experimental system for the evaluation of enteric drug metabolism, 25 providing information complementary to the current in vitro human enteric systems including intestinal microsomes, 28 intestinal slices (van, 82 cryopreserved human enterocytes, and MetMax™ cryopreserved human enterocytes. 22 , 23 , 24 CHIM, due to the presence of virtually all cell types in the intestinal mucosal epithelium, represent the most complete model for the evaluation of enteric drug properties, while cryopreserved enterocytes can be used to define enterocyte‐specific events, and MetMax™ cryopreserved enterocytes for the evaluation of specific pathways. Investigations with CHIM from various regions of the human small intestine can aid the estimation of enteric metabolic fate of drug candidate in drug development, with results that can be applied toward IVIVC approaches in the assessment of the metabolic fate of orally administered drugs. 83 , 84 We will continue to further define enteric drug metabolism, for instance, for the various UGT isoforms, and to develop approaches to evaluate uptake and efflux transporters using CHIM for the application of this experimental system to evaluate enteric drug properties.
AUTHOR CONTRIBUTIONS
Participated in research design: Li, AP, Ho, D.; conducted experiments: Ho, D., Alam, N., Mitchell, W.; performed data analysis: Li, A. P., Ho, D., Alam, N., Mitchell, W., Wong, S., Yan, Z., Kenny, J., Hop, M.; manuscript preparation: Li, A. P., Ho, D., Amaral, K., Alam, N., Wong, S., Yan, Z., Kenny, J., Hop, M.
Li AP, Ho M‐CD, Alam N, et al. Inter‐individual and inter‐regional variations in enteric drug metabolizing enzyme activities: Results with cryopreserved human intestinal mucosal epithelia (CHIM) from the small intestines of 14 donors. Pharmacol Res Perspect. 2020;8:e00645 10.1002/prp2.645
DATA AVAILABILITY STATEMENT
Please contact the corresponding author for additional data requests.
REFERENCES
- 1. Brill MJ, van Rongen A, Houwink AP, et al. Midazolam pharmacokinetics in morbidly obese patients following semi‐simultaneous oral and intravenous administration: a comparison with healthy volunteers. Clin Pharmacokinet. 2014;53:931‐941. [DOI] [PMC free article] [PubMed] [Google Scholar]
- 2. Brussee JM, Yu H, Krekels EHJ, et al. First‐pass CYP3A‐mediated metabolism of midazolam in the gut wall and liver in preterm neonates. CPT Pharmacometrics Syst Pharmacol. 2018;7:374‐383. [DOI] [PMC free article] [PubMed] [Google Scholar]
- 3. Hu ZY, Zhao YS. Sex‐dependent differences in cytochrome P450 3A activity as assessed by midazolam disposition in humans: a meta‐analysis. Drug Metab Dispos. 2010;38:817‐823. [DOI] [PubMed] [Google Scholar]
- 4. Thummel KE, O'Shea D, Paine MF, et al. Oral first‐pass elimination of midazolam involves both gastrointestinal and hepatic CYP3A‐mediated metabolism. Clin Pharmacol Ther. 1996;59:491‐502. [DOI] [PubMed] [Google Scholar]
- 5. Gomez DY, Wacher VJ, Tomlanovich SJ, Hebert MF, Benet LZ. The effects of ketoconazole on the intestinal metabolism and bioavailability of cyclosporine. Clin Pharmacol Ther. 1995;58:15‐19. [DOI] [PubMed] [Google Scholar]
- 6. Zhu Y, D'Agostino J, Zhang QY. Role of intestinal cytochrome P450 (P450) in modulating the bioavailability of oral lovastatin: insights from studies on the intestinal epithelium‐specific P450 reductase knockout mouse. Drug Metab Dispos. 2011;39:939‐943. [DOI] [PMC free article] [PubMed] [Google Scholar]
- 7. Norregaard‐Hansen K, Klitgaard NA, Pedersen KE. The significance of the enterohepatic circulation on the metabolism of digoxin in patients with the ability of intestinal conversion of the drug. Acta Med Scand. 1986;220:89‐92. [DOI] [PubMed] [Google Scholar]
- 8. Mizuma T. Intestinal glucuronidation metabolism may have a greater impact on oral bioavailability than hepatic glucuronidation metabolism in humans: a study with raloxifene, substrate for UGT1A1, 1A8, 1A9, and 1A10. Int J Pharm. 2009;378:140‐141. [DOI] [PubMed] [Google Scholar]
- 9. Snyder KR, Sparano N, Malinowski JM. Raloxifene hydrochloride. Am J Health Syst Pharm. 2000;57(18):1669‐1675. [PubMed] [Google Scholar]
- 10. Cohen AF, Land GS, Breimer DD, Yuen WC, Winton C, Peck AW. Lamotrigine, a new anticonvulsant: pharmacokinetics in normal humans. Clin Pharmacol Ther. 1987;42:535‐541. [DOI] [PubMed] [Google Scholar]
- 11. Boelsterli UA, Redinbo MR, Saitta KS. Multiple NSAID‐induced hits injure the small intestine: underlying mechanisms and novel strategies. Toxicol Sci. 2013;131:654‐667. [DOI] [PMC free article] [PubMed] [Google Scholar]
- 12. Dahan A, Duvdevani R, Dvir E, Elmann A, Hoffman A. A novel mechanism for oral controlled release of drugs by continuous degradation of a phospholipid prodrug along the intestine: in‐vivo and in‐vitro evaluation of an indomethacin‐lecithin conjugate. J Control Release. 2007;119:86‐93. [DOI] [PubMed] [Google Scholar]
- 13. Hatfield MJ, Tsurkan L, Garrett M, et al. Organ‐specific carboxylesterase profiling identifies the small intestine and kidney as major contributors of activation of the anticancer prodrug CPT‐11. Biochem Pharmacol. 2011;81:24‐31. [DOI] [PMC free article] [PubMed] [Google Scholar]
- 14. Tanaka Y, Kitamura Y, Maeda K, Sugiyama Y. Explication of definitional description and empirical use of fraction of orally administered drugs absorbed from the intestine (Fa) and intestinal availability (Fg): effect of P‐glycoprotein and CYP3A on Fa and Fg. J Pharm Sci. 2016;105:431‐442. [DOI] [PubMed] [Google Scholar]
- 15. Lahoz A, Gombau L, Donato MT, Castell JV, Gomez‐Lechon MJ. In vitro ADME medium/high‐throughput screening in drug preclinical development. Mini Rev Med Chem. 2006;6:1053‐1062. [DOI] [PubMed] [Google Scholar]
- 16. Li AP. Screening for human ADME/Tox drug properties in drug discovery. Drug Discov Today. 2001;6:357‐366. [DOI] [PubMed] [Google Scholar]
- 17. Akazawa T, Yoshida S, Ohnishi S, Kanazu T, Kawai M, Takahashi K. Application of intestinal epithelial cells differentiated from human induced pluripotent stem cells for studies of prodrug hydrolysis and drug absorption in the small intestine. Drug Metab Dispos. 2018b;46:1497‐1506. [DOI] [PubMed] [Google Scholar]
- 18. Lu W, Rettenmeier E, Paszek M, et al. Crypt organoid culture as an in vitro model in drug metabolism and cytotoxicity studies. Drug Metab Dispos. 2017;45:748‐754. [DOI] [PMC free article] [PubMed] [Google Scholar]
- 19. Mithal A, Capilla A, Heinze D, et al. Generation of mesenchyme free intestinal organoids from human induced pluripotent stem cells. Nat Commun. 2020;11:215. [DOI] [PMC free article] [PubMed] [Google Scholar]
- 20. Onozato D, Yamashita M, Nakanishi A, et al. Generation of intestinal organoids suitable for pharmacokinetic studies from human induced pluripotent stem cells. Drug Metab Dispos. 2018;46:1572‐1580. [DOI] [PubMed] [Google Scholar]
- 21. Vaessen SF, van Lipzig MM, Pieters RH, Krul CA, Wortelboer HM, van de Steeg E. Regional expression levels of drug transporters and metabolizing enzymes along the pig and human intestinal tract and comparison with Caco‐2 cells. Drug Metab Dispos. 2017;45:353‐360. [DOI] [PubMed] [Google Scholar]
- 22. Ho MD, Ring N, Amaral K, Doshi U, Li AP. Human enterocytes as an in vitro model for the evaluation of intestinal drug metabolism: characterization of drug‐metabolizing enzyme activities of cryopreserved human enterocytes from twenty‐four donors. Drug Metab Dispos. 2017;45:686‐691. [DOI] [PubMed] [Google Scholar]
- 23. Li AP, Amaral K, Ho MD. A novel in vitro experimental system for the evaluation of enteric drug metabolism: cofactor‐supplemented permeabilized cryopreserved human enterocytes (MetMax cryopreserved human enterocytes). Drug Metab Lett. 2018b;12:132‐137. [DOI] [PMC free article] [PubMed] [Google Scholar]
- 24. Wong S, Doshi U, Vuong P, et al. Utility of pooled cryopreserved human enterocytes as an in vitro model for assessing intestinal clearance and drug‐drug interactions. Drug Metab Lett. 2018;12:3‐13. [DOI] [PubMed] [Google Scholar]
- 25. Li AP, Alam N, Amaral K, et al. Cryopreserved human intestinal mucosal epithelium: a novel in vitro experimental system for the evaluation of enteric drug metabolism, cytochrome P450 induction, and enterotoxicity. Drug Metab Dispos. 2018;46:1562‐1571. [DOI] [PubMed] [Google Scholar]
- 26. Sawant‐Basak A, Obach RS. Emerging models of drug metabolism, transporters, and toxicity. Drug Metab Dispos. 2018;46:1556‐1561. [DOI] [PubMed] [Google Scholar]
- 27. Paine MF, Hart HL, Ludington SS, Haining RL, Rettie AE, Zeldin DC. The human intestinal cytochrome P450 "pie". Drug Metab Dispos. 2006;34:880‐886. [DOI] [PMC free article] [PubMed] [Google Scholar]
- 28. Paine MF, Khalighi M, Fisher JM, et al. Characterization of interintestinal and intraintestinal variations in human CYP3A‐dependent metabolism. J Pharmacol Exp Ther. 1997;283:1552‐1562. [PubMed] [Google Scholar]
- 29. Zhang H, Wolford C, Basit A, et al. Regional proteomic quantification of clinically relevant non‐cytochrome P450 enzymes along the human small intestine. Drug Metab Dispos. 2020;48:528‐536. [DOI] [PubMed] [Google Scholar]
- 30. Kalayoglu M, Stratta RJ, Sollinger HW, et al. Clinical results in liver transplantation using UW solution for extended preservation. Transplant Proc. 1989;21:1342‐1343. [PubMed] [Google Scholar]
- 31. Bader A, Hansen T, Kirchner G, Allmeling C, Haverich A, Borlak JT. Primary porcine enterocyte and hepatocyte cultures to study drug oxidation reactions. Br J Pharmacol. 2000;129:331‐342. [DOI] [PMC free article] [PubMed] [Google Scholar]
- 32. Hansen T, Borlak J, Bader A. Cytochrome P450 enzyme activity and protein expression in primary porcine enterocyte and hepatocyte cultures. Xenobiotica. 2000;30:27‐46. [DOI] [PubMed] [Google Scholar]
- 33. Galetin A, Clarke SE, Houston JB. Multisite kinetic analysis of interactions between prototypical CYP3A4 subgroup substrates: midazolam, testosterone, and nifedipine. Drug Metab Dispos. 2003;31:1108‐1116. [DOI] [PubMed] [Google Scholar]
- 34. Akazawa T, Uchida Y, Miyauchi E, Tachikawa M, Ohtsuki S, Terasaki T. High expression of UGT1A1/1A6 in monkey small intestine: comparison of protein expression levels of cytochromes P450, UDP‐glucuronosyltransferases, and transporters in small intestine of cynomolgus monkey and human. Mol Pharm. 2018;15:127‐140. [DOI] [PubMed] [Google Scholar]
- 35. Clermont V, Grangeon A, Barama A, et al. Activity and mRNA expression levels of selected cytochromes P450 in various sections of the human small intestine. Br J Clin Pharmacol. 2019;85:1367‐1377. [DOI] [PMC free article] [PubMed] [Google Scholar]
- 36. Couto N, Al‐Majdoub ZM, Gibson S, et al. Quantitative proteomics of clinically relevant drug‐metabolizing enzymes and drug transporters and their intercorrelations in the human small intestine. Drug Metab Dispos. 2020;48:245‐254. [DOI] [PMC free article] [PubMed] [Google Scholar]
- 37. Zhang H, Wolford C, Basit A, et al. Regional proteomic quantification of clinically relevant non‐cytochrome P450 enzymes along the human small intestine. Drug Metab Dispos. 2020;48(7):528‐536. [DOI] [PubMed] [Google Scholar]
- 38. Lampen A, Christians U, Bader A, Hackbarth I, Sewing KF. Drug interactions and interindividual variability of ciclosporin metabolism in the small intestine. Pharmacology. 1996;52:159‐168. [DOI] [PubMed] [Google Scholar]
- 39. Lampen A, Christians U, Guengerich FP, et al. Metabolism of the immunosuppressant tacrolimus in the small intestine: cytochrome P450, drug interactions, and interindividual variability. Drug Metab Dispos. 1995;23:1315‐1324. [PubMed] [Google Scholar]
- 40. Nishimuta H, Nakagawa T, Nomura N, Yabuki M. Species differences in hepatic and intestinal metabolic activities for 43 human cytochrome P450 substrates between humans and rats or dogs. Xenobiotica. 2013;43:948‐955. [DOI] [PubMed] [Google Scholar]
- 41. Obach RS, Zhang QY, Dunbar D, Kaminsky LS. Metabolic characterization of the major human small intestinal cytochrome p450s. Drug Metab Dispos. 2001;29:347‐352. [PubMed] [Google Scholar]
- 42. Prueksaritanont T, Gorham LM, Hochman JH, Tran LO, Vyas KP. Comparative studies of drug‐metabolizing enzymes in dog, monkey, and human small intestines, and in Caco‐2 cells. Drug Metab Dispos. 1996;24:634‐642. [PubMed] [Google Scholar]
- 43. Zeldin DC, Foley J, Goldsworthy SM, et al. CYP2J subfamily cytochrome P450s in the gastrointestinal tract: expression, localization, and potential functional significance. Mol Pharmacol. 1997;51:931‐943. [DOI] [PubMed] [Google Scholar]
- 44. Iswandana R, Irianti MI, Oosterhuis D, et al. Regional differences in human intestinal drug metabolism. Drug Metab Dispos. 2018;46:1879‐1885. [DOI] [PubMed] [Google Scholar]
- 45. Anderson MC, Hasan F, McCrodden JM, Tipton KF. Monoamine oxidase inhibitors and the cheese effect. Neurochem Res. 1993;18:1145‐1149. [DOI] [PubMed] [Google Scholar]
- 46. Grimsby J, Lan NC, Neve R, Chen K, Shih JC. Tissue distribution of human monoamine oxidase A and B mRNA. J Neurochem. 1990;55:1166‐1169. [DOI] [PubMed] [Google Scholar]
- 47. Shih JC, Grimsby J, Chen K. The expression of human MAO‐A and B genes. J Neural Transm Suppl. 1990;32:41‐47. [DOI] [PubMed] [Google Scholar]
- 48. Devandla A, Yamsani SK, Yamsani MR. Effect of rifampicin pretreatment on the oral bioavailability of domperidone in healthy human volunteers. Drug Metab Pers Ther. 2015;30:257‐261. [DOI] [PubMed] [Google Scholar]
- 49. Hisaka A, Nakamura M, Tsukihashi A, Koh S, Suzuki H. Assessment of intestinal availability (FG) of substrate drugs of cytochrome p450s by analyzing changes in pharmacokinetic properties caused by drug‐drug interactions. Drug Metab Dispos. 2014;42:1640‐1645. [DOI] [PubMed] [Google Scholar]
- 50. Kato M. Intestinal first‐pass metabolism of CYP3A4 substrates. Drug Metab Pharmacokinet. 2008;23:87‐94. [DOI] [PubMed] [Google Scholar]
- 51. Thelen K, Dressman JB. Cytochrome P450‐mediated metabolism in the human gut wall. J Pharm Pharmacol. 2009;61:541‐558. [DOI] [PubMed] [Google Scholar]
- 52. Alkhouli M, Mathur M, Patil P. Revisiting the "cheese reaction": more than just a hypertensive crisis? J Clin Psychopharmacol. 2014;34:665‐667. [DOI] [PubMed] [Google Scholar]
- 53. Sathyanarayana Rao TS, Yeragani VK. Hypertensive crisis and cheese. Indian J Psychiatry. 2009;51:65‐66. [DOI] [PMC free article] [PubMed] [Google Scholar]
- 54. Nakanishi Y, Matsushita A, Matsuno K, et al. Regional distribution of drug‐metabolizing enzyme activities in the liver and small intestine of cynomolgus monkeys. Drug Metab Pharmacokinet. 2011;26:288‐294. [DOI] [PubMed] [Google Scholar]
- 55. Su T, Bao Z, Zhang QY, Smith TJ, Hong JY, Ding X. Human cytochrome P450 CYP2A13: predominant expression in the respiratory tract and its high efficiency metabolic activation of a tobacco‐specific carcinogen, 4‐(methylnitrosamino)‐1‐(3‐pyridyl)‐1‐butanone. Cancer Res. 2000;60:5074‐5079. [PubMed] [Google Scholar]
- 56. Chiang HC, Wang CK, Tsou TC. Differential distribution of CYP2A6 and CYP2A13 in the human respiratory tract. Respiration. 2012;84:319‐326. [DOI] [PubMed] [Google Scholar]
- 57. Godoy W, Albano RM, Moraes EG, et al. CYP2A6/2A7 and CYP2E1 expression in human oesophageal mucosa: regional and inter‐individual variation in expression and relevance to nitrosamine metabolism. Carcinogenesis. 2002;23:611‐616. [DOI] [PubMed] [Google Scholar]
- 58. Chenoweth MJ, Sylvestre MP, Contreras G, Novalen M, O'Loughlin J, Tyndale RF. Variation in CYP2A6 and tobacco dependence throughout adolescence and in young adult smokers. Drug Alcohol Depend. 2016;158:139‐146. [DOI] [PMC free article] [PubMed] [Google Scholar]
- 59. Digard H, Proctor C, Kulasekaran A, Malmqvist U, Richter A. Determination of nicotine absorption from multiple tobacco products and nicotine gum. Nicotine Tob Res. 2013;15:255‐261. [DOI] [PMC free article] [PubMed] [Google Scholar]
- 60. Swan GE, Lessov‐Schlaggar CN. Tobacco addiction and pharmacogenetics of nicotine metabolism. J Neurogenet. 2009;23:262‐271. [DOI] [PubMed] [Google Scholar]
- 61. Bloom AJ, Martinez M, Chen LS, Bierut LJ, Murphy SE, Goate A. CYP2B6 non‐coding variation associated with smoking cessation is also associated with differences in allelic expression, splicing, and nicotine metabolism independent of common amino‐acid changes. PLoS One. 2013;8:e79700. [DOI] [PMC free article] [PubMed] [Google Scholar]
- 62. Basile VS, Masellis M, Potkin SG, Kennedy JL. Pharmacogenomics in schizophrenia: the quest for individualized therapy. Hum Mol Genet. 2002;11:2517‐2530. [DOI] [PubMed] [Google Scholar]
- 63. Bolonna AA, Arranz MJ, Mancama D, Kerwin RW. Pharmacogenomics – can genetics help in the care of psychiatric patients? Int Rev Psychiatry. 2004;16:311‐319. [DOI] [PubMed] [Google Scholar]
- 64. Guengerich FP, Parikh A, Turesky RJ, Josephy PD. Inter‐individual differences in the metabolism of environmental toxicants: cytochrome P450 1A2 as a prototype. Mutat Res. 1999;428:115‐124. [DOI] [PubMed] [Google Scholar]
- 65. Kawajiri K, Fujii‐Kuriyama Y. P450 and human cancer. Jpn J Cancer Res. 1991;82:1325‐1335. [DOI] [PMC free article] [PubMed] [Google Scholar]
- 66. Lauschke VM, Ingelman‐Sundberg M. Prediction of drug response and adverse drug reactions: from twin studies to Next Generation Sequencing. Eur J Pharm Sci. 2019;130:65‐77. [DOI] [PubMed] [Google Scholar]
- 67. Naidoo P, Chetty VV, Chetty M. Impact of CYP polymorphisms, ethnicity and sex differences in metabolism on dosing strategies: the case of efavirenz. Eur J Clin Pharmacol. 2014;70:379‐389. [DOI] [PubMed] [Google Scholar]
- 68. Plant N. The human cytochrome P450 sub‐family: transcriptional regulation, inter‐individual variation and interaction networks. Biochim Biophys Acta. 2007;1770:478‐488. [DOI] [PubMed] [Google Scholar]
- 69. Serpe L, Canaparo R, Scordo MG, Spina E. Pharmacogenetics of drug‐metabolizing enzymes in Italian populations. Drug Metab Pers Ther. 2015;30:107‐120. [DOI] [PubMed] [Google Scholar]
- 70. Shahabi P, Siest G, Meyer UA, Visvikis‐Siest S. Human cytochrome P450 epoxygenases: variability in expression and role in inflammation‐related disorders. Pharmacol Ther. 2014;144:134‐161. [DOI] [PubMed] [Google Scholar]
- 71. Stojiljkovic M, Patrinos GP, Pavlovic S. Clinical applicability of sequence variations in genes related to drug metabolism. Curr Drug Metab. 2011;12:445‐454. [DOI] [PubMed] [Google Scholar]
- 72. Wolf CR, Smith G. Pharmacogenetics. Br Med Bull. 1999;55:366‐386. [DOI] [PubMed] [Google Scholar]
- 73. Gaedigk A, Baker DW, Totah RA, et al. Variability of CYP2J2 expression in human fetal tissues. J Pharmacol Exp Ther. 2006;319:523‐532. [DOI] [PMC free article] [PubMed] [Google Scholar]
- 74. King LM, Ma J, Srettabunjong S, et al. Cloning of CYP2J2 gene and identification of functional polymorphisms. Mol Pharmacol. 2002;61:840‐852. [DOI] [PubMed] [Google Scholar]
- 75. Wang H, Jiang Y, Liu Y, et al. CYP2J2*7 single nucleotide polymorphism in a Chinese population. Clin Chim Acta. 2006;365:125‐128. [DOI] [PubMed] [Google Scholar]
- 76. Wu S, Moomaw CR, Tomer KB, Falck JR, Zeldin DC. Molecular cloning and expression of CYP2J2, a human cytochrome P450 arachidonic acid epoxygenase highly expressed in heart. J Biol Chem. 1996;271:3460‐3468. [DOI] [PubMed] [Google Scholar]
- 77. Drozdzik M, Groer C, Penski J, et al. Protein abundance of clinically relevant multidrug transporters along the entire length of the human intestine. Mol Pharm. 2014;11:3547‐3555. [DOI] [PubMed] [Google Scholar]
- 78. Ikarashi N, Ogawa S, Hirobe R, et al. Epigallocatechin gallate induces a hepatospecific decrease in the CYP3A expression level by altering intestinal flora. Eur J Pharm Sci. 2017;100:211‐218. [DOI] [PubMed] [Google Scholar]
- 79. Ishii M, Toda T, Ikarashi N, Ochiai W, Sugiyama K. Effects of intestinal flora on the expression of cytochrome P450 3A in the liver. Yakugaku Zasshi. 2012;132:301‐310. [DOI] [PubMed] [Google Scholar]
- 80. Jourova L, Anzenbacher P, Liskova B, et al. Colonization by non‐pathogenic bacteria alters mRNA expression of cytochromes P450 in originally germ‐free mice. Folia Microbiol (Praha). 2017;62:463‐469. [DOI] [PubMed] [Google Scholar]
- 81. Toda T, Saito N, Ikarashi N, et al. Intestinal flora induces the expression of Cyp3a in the mouse liver. Xenobiotica. 2009;39:323‐334. [DOI] [PubMed] [Google Scholar]
- 82. van de Kerkhof EG, de Graaf IA, Ungell AL, Groothuis GM. Induction of metabolism and transport in human intestine: validation of precision‐cut slices as a tool to study induction of drug metabolism in human intestine in vitro. Drug Metab Dispos. 2008;36:604‐613. [DOI] [PubMed] [Google Scholar]
- 83. Fisher MB, Labissiere G. The role of the intestine in drug metabolism and pharmacokinetics: an industry perspective. Curr Drug Metab. 2007;8:694‐699. [DOI] [PubMed] [Google Scholar]
- 84. Margolskee A, Darwich AS, Galetin A, Rostami‐Hodjegan A, Aarons L. Deconvolution and IVIVC: exploring the role of rate‐limiting conditions. AAPS J. 2016;18:321‐332. [DOI] [PMC free article] [PubMed] [Google Scholar]
Associated Data
This section collects any data citations, data availability statements, or supplementary materials included in this article.
Data Availability Statement
Please contact the corresponding author for additional data requests.


