

Abstract
Alcohol and other drug (AOD) use disorders exact a prodigious annual economic toll in the United States (U.S.), driven largely by lost productivity due to illness-related absenteeism, underemployment, and unemployment. While recovery from AOD disorders is associated with improved health and functioning, little is known specifically about increases in productivity due to new or resumed employment and who may continue to struggle. Also, because employment can buffer relapse risk by providing structure, meaning, purpose, and income, greater knowledge in this regard would inform relapse prevention efforts as well as employment-related policy. We conducted a cross-sectional, nationally representative survey of the U.S. adult population assessing persons who reported having resolved an AOD problem (n = 2002). Weighted employment, unemployment, retirement, and disability statistics were compared to the general U.S. population. Logistic and linear regression models tested for differences in employment and unemployment among demographic categories and measures of well-being. Compared to the general U.S. population, individuals who had resolved an AOD problem were less likely to be employed or retired, and more likely to be unemployed and disabled. Certain recovering subgroups, including those identifying as black and those with histories of multiple arrests, were further disadvantaged. Conversely, certain factors, such as a higher level of education and less prior criminal justice involvement were associated with lower unemployment risk. Despite being in recovery from an AOD problem, individuals continue to struggle with obtaining employment, particularly black Americans and those with prior criminal histories. Given the importance of employment in addiction recovery and relapse prevention, more research is needed to identify employment barriers so that they can be effectively addressed.
Keywords: Employment, Unemployment, Under employment, Alcohol and other drugs, Substance use disorder, Addiction recovery, Disparities
1. Introduction
Healthcare costs are a major contributing factor underlying the $600 billion annual economic burden of alcohol and other drug (AOD) problems in the United States (U.S.). Yet lost productivity is a far greater contributor, accounting for > 70% of this burden (Bouchery, Harwood, Sacks, Simon, & Brewer, 2011). From this standpoint, helping individuals who have overcome an AOD problem get back to work is economically imperative. Yet this population commonly struggles with impoverished or limited access to employment resources, and due to the highly stigmatized nature of addiction, also faces numerous social- and policy-related barriers to returning to work (Kulesza et al., 2016; McQuaid, Jesseman, & Rush, 2018; Office of National Drug Control Policy, 2019).
For someone attempting AOD problem recovery, gaining employment can make the difference between achieving sustained remission, and relapse to active substance use disorder (SUD; Kelly & Hoeppner, 2015; Laudet & White, 2008; Ruais, 2019; Sahker, Ali, & Arndt, 2019; Vilsaint et al., 2017; Xie, McHugo, Fox, & Drake, 2005). Further, employment provides critical recovery building blocks—commonly referred to as recovery capital—by increasing access to independent housing and health insurance, alleviating financial insecurity, and improving individuals’ standing in society. Employment is also thought to aid individuals in SUD recovery by providing structure, improving quality of life (Petry, Andrade, Rash, & Cherniack, 2014), and increasing self-esteem (Platt, 1995) and positive affect (Braunstein, Powell, McGowan, & Thoreson, 1983; Epstein & Preston, 2012), which in turn may buffer against SUD relapse (Braunstein et al., 1983; Kessler et al., 2002; Petry et al., 2014). We decided to examine each of these separately, because, while there is certainly overlap in these positive indices, they represent distinct constructs.
Despite the important role of employment in SUD recovery, little is currently known about employment rates among individuals who have overcome problems with AOD. Moreover, though previous work supports the idea that employment is positively correlated with quality of life, self-esteem, and positive affect, their relationship has not previously been quantified at a population level among individuals who have overcome an AOD problem. The current study, therefore, sought to, 1) compare employment status between a nationally representative sample of U.S. adults who have resolved an AOD problem, and the general U.S. population (U.S. Bureau of Labor Statistics, 2015, 2016); 2) explore demographic differences in employment status within this nationally representative sample, including age, sex, race/ethnicity, education, time since resolving a problem with AOD, primary substance used, history of arrest, and number of arrests; and 3) within this sample, characterize employment’s associations with quality of life, self-esteem, and happiness, with consideration given to age, sex, race/ethnicity, education, income, and time since resolving a problem with AOD.
Based on previous research that shows that those identifying as racial and ethnic minorities face more employment problems before and after treatment (Fosados, Evans, & Hser, 2007; Laudet, 2012; Niv, Pham, & Hser, 2009), and barriers to accruing resources necessary for recovery than those identifying as white (Kelly, Greene, & Bergman, 2018), we hypothesized that individuals identifying as black non-Hispanic and Hispanic would report higher percentages of unemployment compared to those identifying as white non-Hispanic. Further, we predicted that a higher level of education would be associated with greater likelihood of employment. And because a history of criminal justice system–involvement can be a barrier to employment, we hypothesized that individuals reporting previous arrest/s would have higher unemployment. We also predicted that being employed would be positively associated with quality of life, self-esteem, and happiness. Associations among employment status, sex, time since resolving a problem with AOD, primary substance used, and contrasts with the U.S. population were treated as exploratory.
2. Method
2.1. Sample and procedure
This is a secondary data analysis of the National Recovery Study (NRS; Kelly, Bergman, Hoeppner, Vilsaint, & White, 2017), which targeted the U.S. non-institutionalized civilian population 18 years or older that had resolved an AOD problem, as indicated by an affirmative response to the screener question: “Did you use to have a problem with drugs or alcohol, but no longer do?” For a full description of the survey methodology see Kelly et al. (2017). Briefly, data were collected by the survey company GfK, using a probability sampling approach to select respondents at random. GfK screened everyone in their “Knowledge-Panel” (GfK, 2013), which consists of approximately 55,000 adults aged 18 and older. The KnowledgePanel uses address-based sampling to randomly select individuals from 97% of all U.S. households based on the U.S. Postal Service’s Delivery Sequence File. For this study, a representative subset of 39,809 individuals from the GfK KnowledgePanel received the screening question.
Of those in the initial sampling frame (N = 39,809), 25,229 individuals responded to the screening question (63.4%). This response rate is comparable to most other current nationally representative surveys, including the National Epidemiologic Survey on Alcohol and Related Conditions-III (60.1%; Grant et al., 2015), the 2015 National Survey on Drug Use and Health (58.3%; Center for Behavioral Health Statistics and Quality, 2016), and the 2013–2014 National Health and Nutrition Examination Survey (68.5%; Centers for Disease Control and Prevention, 2013). Data were weighted to accurately represent the civilian population using the method of iterative proportional fitting (Battaglia, Izrael, Hoaglin, & Frankel, 2009).
To produce unbiased estimates of population parameters from these respondents, GfK first computed base weights, then made post-stratification adjustments according to benchmarks from the Current Population Survey, conducted in March 2015 by the U.S. Census Bureau, along eight demographic dimensions. A sample of 2002 individuals who indicated they had resolved a problem with AOD were included in the analyses.
The NRS findings were contrasted with nationally representative employment summary statistics obtained from the U.S. Bureau of Labor Statistics’ Current Population Survey for July 2016 (U.S. Bureau of Labor Statistics, 2016), the same month and year that the NRS sample was surveyed.
3. Measures
3.1. Demographic characteristics
Demographic data were derived both from GfK’s existing KnowledgePanel data (collected prior to the survey) as well as from survey data. Existing KnowledgePanel data included 1) age, 2) sex, 3) race/ethnicity (white/non-Hispanic; black/non-Hispanic; other/non-Hispanic; Hispanic; 2+ races/non-Hispanic), 4) education (less than high school; high school; some college; bachelor’s degree or higher), and 5) household income (nineteen categories ranging from less than $5000 to $175,000 or more). All other measures were collected via the NRS.
Because one year represents a significant milestone for resolution of an AOD problem, and it takes approximately five years for risk of relapse to SUD to become commensurate with the risk of someone without SUD history developing SUD (Dennis, Foss, & Scott, 2007), participants were grouped as having < 1 year, 1–5 years, or > 5 years since resolving their AOD problem.
3.2. Employment
Participant employment information derived from GfK’s existing KnowledgePanel data was categorized as follows: 1) working–paid employee, 2) working–self-employed, 3) not working–on a temporary layoff from job, 4) not working–looking for work, 5) not working–retired, 6) not working–disabled, and 7) not working–other. The “not working–other” category included those who were neither working as paid employees or self-employed, and were students, stay-at-home partners, or working in an unpaid job such as an internship.
Because we were primarily interested in the general effect of employment versus unemployment, for the bulk of the analyses we collapsed employment categories into three groups, 1) employed (i.e., working as a paid employee or self-employed), 2) unemployed and needing work (i.e., on temporary layoff from a job or looking for work), or 3) unemployed but not requiring work (i.e., retired, disabled, or “not working – other”).
3.3. U.S. population employment and unemployment statistics
Employment and unemployment statistics for the U.S. population were derived from the July 2016 Bureau of Labor Statistics Current Population Survey (U.S. Bureau of Labor Statistics, 2016), except for retirement statistics, which are not released in monthly Current Population Survey reports. Retirement statistics were thus derived from the Bureau of Labor Statistics’ 2014 Current Population Survey Annual Social and Economic Supplement (U.S. Bureau of Labor Statistics, 2015).
It is important to note that the Current Population Survey samples individuals 16 years and older. Because employment statistics including working as a paid employee, and being self-employed are provided by age grouping, we were able to calculate employment statistics excluding 16–17-year-olds in order to make age-accurate comparisons to the NRS sample, which surveyed individuals 18 years or older. However, because age categories are not provided for the unemployed and on temporary layoff, and unemployed and looking for work in the Bureau of Labor Statistics Current Population Survey, comparisons with the NRS sample on these categories were made with individuals 16 years or older.
Additionally, because the Bureau of Labor Statistics does not have an employment category commensurate with the NRS’ “not working–other” category, a comparison between the NRS sample and U.S. population could not be made for this employment category.
3.4. Quality of life
Quality of life was assessed using the EUROHIS-QOL (Schmidt, Mühlan, & Power, 2005), a widely used eight-item measure of quality of life, adapted from the World Health Organization Quality of Life - Brief Version. Item responses are on Likert scales from 1 to 5 (e.g., “How satisfied are you with your personal relationships?” 1 = very dissatisfied to 5 = very satisfied) with a total possible range of 8–40. The measure has strong psychometric properties, including good to excellent predictive validity, and its internal consistency was excellent in the current sample (α = 0.90).
3.5. Self-esteem
Self-esteem was assessed using the Single-Item Self-Esteem Scale (Robins, Hendin, & Trzesniewski, 2001), which asks participants to rate the extent to which the statement, “I have high self-esteem” is true, on a Likert scale from 1 = not very true to 10 = very true. We modified the traditional 10-point scale of the Single-Item Self-Esteem Scale to a 5-point scale to account for formatting issues with the 10-point scales on mobile phone visual displays. The reliability estimate of the Single-Item Self-Esteem Scale is 0.75 (Robins et al., 2001), and it has high concurrent correlation with the well-validated, multi-item Rosenberg Self-Esteem Scale (Robins et al., 2001).
3.6. Happiness
Participants rated their happiness on a Likert scale from 1 = completely unhappy to 5 = completely happy. This single-item measure has ecological validity and been used successfully in previous research (Meyers & Smith, 1995) but has not been psychometrically validated.
4. Analyses
Comparisons to the U.S. population were conducted using the original seven employment/unemployment categories with the exception of the “not working–other” category for which U.S. population statistics are not available. One-way chi-square tests were used to test for differences between the NRS sample and the U.S. population for each distinct employment/unemployment category. All analyses were conducted using the survey weights to statistically account for any under-representation in the KnowledgePanel sample, as well as differential responding to the NRS screening question.
Collapsed employment categories (i.e., employed; unemployed and needing work; unemployed and not requiring work) were then used to explore differences in employment and unemployment among demographic categories in the NRS sample. First, eight separate logistic regression models were run using the PROC LOGISTIC procedure in SAS 9.4 (SAS Institute, 2018), with employment category as the dependent variable (i.e., employed; unemployed and needing work; unemployed and not requiring work), and the predictor of interest as the independent variable (i.e., age-group, sex, race, education, time since AOD problem resolution, primary substance used, history of arrest [yes/no], and number of arrests). For the model testing for effects of time since AOD problem resolution on employment, we controlled for age by adding this measure as a covariate, since age is inevitably strongly associated with time since AOD problem resolution. In this model, odds ratios were calculated with age as a covariate; however, for clearer interpretation we report the R-squared value for time since AOD problem resolution alone, omitting the effects of age.
After exploring demographic differences in employment status within the nationally representative NRS sample, we then ran three linear regression models using the PROC SURVEYREG procedure in SAS 9.4 (SAS Institute, 2016) to examine the degree to which employment status is related to quality of life, self-esteem, and happiness. Quality of life, self-esteem, and happiness were the dependent variables, and employment status was the independent variable, with age, sex, race/ethnicity, education, income, and time since resolving a problem with AOD included as covariates.
To help control for test-wise alpha inflation, omnibus test alpha was set at p < .01 for all regression models. To provide an indication of the strength of association between each tested measure and employment status we calculated R-squared values. Standard R-squared values are shown for linear regression models, while McFadden’s R-squared values are shown for logistic regression models (Allison, 2014; Shtatland, Kleinman, & Cain, 2002). We report R-squared values produced without covariates in these model to indicate the actual variance accounted for by these factors without the influence of covariates.
In the discussion section we also provide relative differences between the NRS sample and U.S. population in employment and unemployment percentages. Relative differences were calculated as, NRS sample percentage − U.S. population percentage ÷ U.S. population percentage × 100, and can be thought of as effect sizes for between group differences in employment and unemployment.
5. Results
Sample characteristics have been reported elsewhere (see Kelly et al., 2017). Briefly, the weighted age characteristics of the sample are as follows: 18–24 yrs. (emerging adulthood), 7.1%; 25–49 yrs. (young adults), 45.2%; 50–64 yrs. (mid-life stage adults), 34.7%; and 65 + yrs. (older adults), 13.0%. The weighted sample is 40% female, 61.5% white/non-Hispanic, 13.8% black/non-Hispanic, 5.8% other/non-Hispanic, 17.3% Hispanic, and 1.7% 2+ races/non-Hispanic. In terms of time since resolving their AOD problem, 11.1% of the sample endorsed having < 1 year, 21.5% endorsed 1–5 years, and 67.4% endorsed > 5 years. Table 1 presents descriptive information on the NRS sample broken into the seven employment categories.
Table 1.
National Recovery Study participant employment by age group, sex, race, education, time since resolving a problem with alcohol and other drugs, primary substance used, history of arrest (yes/no) and number of arrests, quality of life, self-esteem, and happiness.
| Working - as a paid employee n = 837, 47.7% (weighted n = 944) | Working - self-employed n = 161, 8.0% (weighted n = 139) | Not working - on temporary layoff from job n = 19, 1.0% (weighted n = 30) | Not working - looking for work n = 110, 5.5% (weighted n = 152) | Not working - retired n = 437, 21.8% (weighted n = 237) | Not working - disabled n = 311, 15.5% (weighted n = 310) | Not working - other n = 127, 0.6% (weighted n = 167) | |
|---|---|---|---|---|---|---|---|
| Age group (% by age category) | |||||||
| 18–24 yrs emerging adulthood | 65.8 [8.3] | 8.0 [4.5] | 5.5 [4.0] | 18.3 [7.0] | - | 2.4 [2.4] | - |
| 25–49 yrs young adults | 57.0 [2.6] | 6.4 [1.2] | 1.8 [0.8] | 10.0 [1.6] | 0.6 [0.6] | 10.9 [1.6] | 13.3 [1.8] |
| 50–64 yrs mid-life stage adults | 44.5 [2.3] | 7.9 [1.3] | 0.8 [0.4] | 4.9 [1.0] | 7.7 [1.2] | 27.9 [2.2] | 6.2 [1.0] |
| 65+ yrs older adults | 13.7 [1.8] | 6.4 [1.1] | 0.4 [0.3] | 1.1 [0.5] | 69.5 [2.5] | 6.6 [1.5] | 2.3 [0.9] |
| Sex (% by sex category) | |||||||
| Female | 45.6 [2.3] | 5.9 [0.9] | 1.0 [0.7] | 8.3 [1.5] | 8.4 [1.1] | 16.2 [1.6] | 14.5 [1.8] |
| Male | 49.1 [2.2] | 7.8 [1.1] | 1.9 [0.7] | 7.2 [1.2] | 14.3 [1.1] | 15.3 [1.6] | 4.4 [0.9] |
| Race (% by race category) | |||||||
| White/non-Hispanic | 49.4 [1.9] | 8.5 [1.1] | 0.6 [0.3] | 7.4 [1.2] | 14.2 [1.0] | 12.3 [1.1] | 7.6 [1.0] |
| Black/non-Hispanic | 39.4 [4.6] | 4.2 [1.7] | 4.2 [2.6] | 7.9 [2.5] | 11.3 [2.7] | 24.9 [4.0] | 8.3 [2.6] |
| Other/non-Hispanic | 49.6 [8.3] | 4.7 [2.7] | 2.8 [2.0] | 9.4 [4.9] | 5.1 [2.9] | 22.1 [6.7] | 6.3 [3.2] |
| Hispanic | 48.3 [4.5] | 4.8 [1.7] | 2.4 [1.6] | 8.6 [2.6] | 7.1 [2.0] | 16.9 [3.4] | 12.1 [3.1] |
| 2+ races/non-Hispanic | 42.6 [8.6] | 7.4 [3.6] | - | 0.9 [0.9] | 11.2 [4.3] | 25.3 [9.0] | 12.6 [5.4] |
| Education (% by education category) | |||||||
| Less than high school | 34.3 [6.0] | 3.4 [1.9] | 5.2 [3.2] | 11.2 [3.7] | 10.7 [3.2] | 28.6 [5.0] | 6.6 [2.8] |
| High school diploma | 43.4 [3.2] | 6.2 [1.6] | 0.7 [0.7] | 9.2 [2.0] | 11.4 [1.6] | 18.3 [2.3] | 10.8 [1.9] |
| Some college | 50.2 [2.1] | 7.6 [1.1] | 1.0 [0.4] | 6.6 [1.2] | 11.8 [1.0] | 14.3 [1.4] | 8.5 [1.3] |
| Bachelor’s degree or higher | 60.1 [2.6] | 9.8 [1.5] | 2.0 [0.9] | 4.3 [1.1] | 14.2 [1.3] | 4.8 [0.8] | 4.8 [1.4] |
| Time since resolving a problem with AOD (% by time category) | |||||||
| < 1 year | 53.3 [5.4] | 7.7 [3.1] | 0.9 [0.7] | 16.4 [4.4] | 3.4 [1.2] | 8.1 [2.8] | 10.1 [3.0] |
| 1–5 years | 53.1 [3.9] | 4.0 [1.2] | 3.8 [1.8] | 13.8 [2.9] | 6.8 [1.6] | 11.4 [2.1] | 7.1 [1.9] |
| > 5 years | 45.0 [1.9] | 7.9 [1.0] | 0.9 [0.4] | 4.1 [0.7] | 15.1 [1.1] | 18.3 [1.5] | 8.6 [1.2] |
| Primary substance used (% by substance) | |||||||
| Alcohol | 47.1 [2.1] | 6.5 [0.9] | 1.5 [0.6] | 6.3 [1.1] | 15.8 [1.2] | 14.5 [1.5] | 8.2 [1.3] |
| Amphetamines | 34.9 [5.4] | 8.0 [3.0] | - | 17.5 [4.9] | 1.9 [0.7] | 11.7 [5.1] | 15.0 [4.5] |
| Cannabis | 58.1 [5.5] | 2.4 [1.0] | 3.6 [2.6] | 11.3 [3.9] | 1.9 [0.7] | 12.3 [3.5] | 10.4 [3.3] |
| Cocaine | 51.1 [4.8] | 11.7 [3.5] | 1.2 [0.9] | 5.9 [2.5] | 6.9 [2.0] | 17.5 [3.5] | 5.7 [2.0] |
| Opioids | 51.5 [7.5] | 8.7 [4.9] | - | 11.2 [4.8] | 3.9 [1.3] | 15.6 [4.3] | 9.1 [3.6] |
| Other | 50.0 [14.4] | 21.6 [10.7] | - | 6.4 [3.8] | 2.1 [1.7] | 19.1 [11.2] | 0.8 [0.9] |
| History of arrest (% by arrest category) | |||||||
| Yes | 46.7 [2.3] | 8.4 [1.3] | 2.3 [0.9] | 8.0 [1.3] | 10.2 [1.1] | 17.7 [1.7] | 6.8 [1.2] |
| No | 48.5 [2.2] | 5.6 [0.8] | 0.7 [0.3] | 7.4 [1.4] | 13.9 [1.1] | 13.6 [1.5] | 10.3 [1.4] |
| Number of arrests (mean) | 3.2 (5.3) | 2.4 (1.9) | 8.2 (16.1) | 4.9 (7.1) | 3.2 (5.2) | 4.8 (7.4) | 4.7 (10.1) |
| Quality of life (mean) | 30.5 (5.8) | 31.2 (5.9) | 26.4 (6.8) | 26.2 (7.6) | 32.3 (4.9) | 25.5 (6.5) | 28.2 (7.1) |
| Self-esteem (mean) | 3.6 (1.1) | 3.7 (1.2) | 3.3 (0.9) | 3.1 (1.4) | 4.0 (0.9) | 3.1 (1.4) | 3.3 (1.2) |
| Happiness (mean) | 3.8 (1.0) | 3.9 (0.8) | 3.4 (0.9) | 3.3 (1.2) | 4.1 (0.7) | 3.4 (1.1) | 3.6 (1.0) |
Notes. Percentages are expressed by subgroup (i.e., within age group, within race group, etc.). AOD = alcohol and other drugs. Quality of life total possible range of 8–40; self-esteem total possible range of 1–5; happiness total possible range of 1–5. Standard error of percent in brackets; standard deviations in parentheses.
5.1. Comparisons between the NRS sample and the U.S. population
As shown in Table 2, compared to the U.S. population, the NRS sample was significantly more likely to be “not working–on a temporary layoff from a job”, “not working–looking for work”, and “not working–disabled”. The NRS sample was also less likely to be “working–as a paid employee”, and “not working–retired”. The NRS sample and U.S. population, however, were not significantly different in terms of “working–self-employed”.
Table 2.
National Recovery Study participant employment contrasted with U.S. population employment.
| National Recovery Study (% of sample) | United States (% of population) | χ2 (df = 1) | p | |
|---|---|---|---|---|
| Working - as a paid employee | 47.7 | 56.9 | 33.24 | <0.0001 |
| Working - self-employed | 7.0 | 6.3 | 0.97 | ns |
| Not working - on temporary layoff from a joba | 1.5 | 0.4 | 19.66 | <0.0001 |
| Not working - looking for worka | 7.7 | 2.8 | 67.51 | <0.0001 |
| Not working - retiredb | 12.0 | 15.4 | 14.98 | <0.0001 |
| Not working - disabled | 15.6 | 5.6 | 194.42 | <0.0001 |
| Not working - otherc | 8.6 | - | - | - |
Data reported for U.S. population 16 years of age or older based on available statistics from the Current Population Survey, U.S. Bureau of Labor Statistics.
Based on 2014 annual population statistics (U.S. Bureau of Labor Statistics, 2015).
The Bureau of Labor Statistics does not have an employment category commensurate with “not working – other”. χ2 = Rao-Scott chi-square; df = degrees of freedom.
5.2. NRS participant employment status by individual characteristics
The results of the logistic regression models indicated that employment was associated with numerous demographic and clinical measures (see Tables 3 for regression model effects and Table 4 for odds ratios). These included: age-group, χ2(6) = 254.55, p < .0001, R2 = 0.10; time since resolving a problem with AOD after controlling for age, χ2(4) = 34.36, p < .0001, R2 = 0.03 (with univariate R2 value reported here); education, χ2(6) = 72.40, p < .0001, R2 = 0.02; primary substance used, χ2(12) = 54.18, p < .0001, R2 = 0.02; number of arrests, χ2(2) = 27.20, p < .0001, R2 = 0.01; and race, χ2(8) = 24.67, p = .002, R2 = 0.01.
Table 3.
National Recovery Study participant employment status by individual characteristics expressed as percentage by category, with logistic regression model chi-square and linear regression model F-value, as well as univariate R2 effect sizes.
| Employed n = 998, 54.7% (weighted n = 1084) | Unemployed & needing work n = 129, 9.2% (weighted n = 182) | Unemployed & not needing work n = 875, 36.1% (weighted n = 714) | Model χ2/F | df | R2 | |
|---|---|---|---|---|---|---|
| Age group (% by age category) | 254.55*** | 6 | 0.10 | |||
| 18–24 yrs emerging adulthood | 73.9 [7.8] | 23.9 [7.6] | 2.4 [2.4] | |||
| 25–49 yrs young adults | 63.4 [2.6] | 11.8 [1.8] | 24.8 [2.3] | |||
| 50–64 yrs mid-life stage adults | 52.4 [2.3] | 5.7 [1.0] | 41.8 [2.3] | |||
| 65+ yrs older adults | 20.1 [2.0] | 1.5 [0.6] | 78.4 [2.1] | |||
| Sex (% by sex category) | 6.00 | 2 | 0.00 | |||
| Female | 51.5 [2.3] | 9.3 [1.6] | 39.1 [2.3] | |||
| Male | 56.9 [2.1] | 9.1 [1.4] | 34.0 [1.9] | |||
| Race (% by race category) | 24.67** | 8 | 0.01 | |||
| White/non-Hispanic | 57.9 [1.8] | 8.0 [1.2] | 34.1 [1.6] | |||
| Black/non-Hispanic | 43.6 [4.7] | 12.0 [3.5] | 44.4 [4.7] | |||
| Other/non-Hispanic | 54.3 [8.1] | 12.2 [5.2] | 33.5 [7.4] | |||
| Hispanic | 53.0 [4.5] | 11.0 [3.0] | 36.0 [4.3] | |||
| 2+ races/non-Hispanic | 50.0 [8.8] | 0.9 [0.9] | 49.1 [8.8] | |||
| Education (% by education category) | 72.40*** | 6 | 0.02 | |||
| Less than high school | 37.7 [6.0] | 16.4 [4.7] | 45.9 [5.8] | |||
| High school diploma | 49.6 [3.2] | 9.9 [2.1] | 40.5 [3.0] | |||
| Some college | 57.8 [2.1] | 7.6 [1.2] | 34.6 [2.0] | |||
| Bachelor’s degree or higher | 69.9 [2.3] | 6.4 [1.4] | 23.6 [2.0] | |||
| Time since resolving a problem with AOD (% by time category) | 34.36*** | 4 | 0.03 | |||
| < 1 year | 60.7 [5.2] | 18.7 [4.4] | 20.7 [4.1] | |||
| 1–5 years | 57.1 [3.8] | 17.6 [3.3] | 25.3 [3.1] | |||
| > 5 years | 52.8 [1.8] | 5.2 [0.9] | 42.1 [1.8] | |||
| Primary substance used (% by substance) | 54.18*** | 12 | 0.02 | |||
| Alcohol | 53.6 [2.1] | 7.8 [1.3] | 38.6 [2.0] | |||
| Amphetamines | 42.9 [5.7] | 17.5 [4.9] | 39.6 [5.9] | |||
| Cannabis | 60.6 [5.5] | 14.9 [4.5] | 24.6 [4.5] | |||
| Cocaine | 62.8 [4.5] | 7.1 [2.6] | 30.1 [4.2] | |||
| Opioids | 60.2 [7.0] | 11.2 [4.8] | 28.6 [5.8] | |||
| Other | 71.5 [11.9] | 6.4 [3.8] | 22.0 [11.4] | |||
| History of arrest (% by arrest category) | 5.90 | 4 | 0.00 | |||
| Yes | 55.1 [2.3] | 10.3 [1.6] | 34.6 [2.1] | |||
| No | 54.1 [2.2] | 8.1 [1.4] | 37.8 [2.1] | |||
| Number of arrests (mean) | 3.2 (5.2) | 7.3 (14.3) | 5.9 (9.8) | 27.20*** | 2 | 0.01 |
| Quality of life (mean) | 30.3 (6.3) | 25.0 (9.4) | 28.3 (6.2) | 22.25*** | 2 | 0.06 |
| Self-esteem (mean) | 3.6 (1.2) | 3.0 (1.5) | 3.4 (1.2) | 5.88** | 2 | 0.01 |
| Happiness (mean) | 3.8 (1.0) | 3.2 (1.3) | 3.7 (0.9) | 7.50** | 2 | 0.03 |
Notes. Percentages are expressed by subgroup (i.e., within age group, within race group, etc.). AOD = alcohol and other drugs. Quality of life total possible range of 8–40; self-esteem total possible range of 1–5; happiness total possible range of 1–5. Standard error of percent in brackets; standard deviation of the mean in parentheses. χ2 = Wald chi-square for logistic regression models; F = F-value for linear regression models; df = degrees of freedom; R2 = R-squared (McFadden’s R2 is shown for age, sex, race/ethnicity, education, time since resolving a problem with AOD, primary substance used, history of arrest, and number of arrests models; standard R2 is shown for quality of life, self-esteem, and happiness models). To clearly convey effect sizes without the influence of covariates, univariate R2 values are reported for all models.
p < .01.
p < .0001.
Table 4.
Odds ratios/unstandardized beta coefficients by National Recovery Study participant employment status and individual characteristics.
| Employed vs. unemployed & needing work | Unemployed & not needing work vs. unemployed & needing work | Employed vs. unemployed & not needing work | |
|---|---|---|---|
| OR [95% CI] | OR [95% CI] | OR [95% CI] | |
| b [95% CI] | b [95% CI] | b [95% CI] | |
| Age group (OR) | |||
| 18–24 yrs emerging adulthood | 0.23 [0.08, 0.70]** | 0.00 [0.00, 0.01]*** | 120.73 [39.08, 373.01]*** |
| 25–49 yrs young adults | 0.40 [0.14, 1.15] | 0.04 [0.01, 0.11]*** | 9.98 [7.02, 14.06]*** |
| 50–64 yrs mid-life stage adults | 0.67 [0.22, 2.00] | 0.14 [0.05, 0.40]*** | 4.89 [3.47, 6.89]*** |
| 65+ yrs older adults | 1.00 [Reference] | 1.00 [Reference] | 1.00 [Reference] |
| Sex (OR) | |||
| Female | 0.88 [0.64, 1.22] | 1.12 [0.81, 1.56] | 0.79 [0.65, 0.95] |
| Male | 1.00 [Reference] | 1.00 [Reference] | 1.00 [Reference] |
| Race (OR) | |||
| White/non-Hispanic | 1.00 [Reference] | 1.00 [Reference] | 1.00 [Reference] |
| Black/non-Hispanic | 0.50 [0.32, 0.78]** | 0.87 [0.56, 1.35] | 0.58 [0.44, 0.77]*** |
| Other/non-Hispanic | 0.62 [0.33, 1.14] | 0.64 [0.34, 1.23] | 0.96 [0.63, 1.45] |
| Hispanic | 0.67 [0.44, 1.01] | 0.77 [0.50, 1.18] | 0.87 [0.67, 1.13] |
| 2+ races/non-Hispanic | 7.41 [0.22, 248.48] | 12.34 [0.37, 414.16] | 0.60 [0.30, 1.19] |
| Education (OR) | |||
| Less than high school | 0.21 [0.12, 0.37]*** | 0.75 [0.41, 1.36] | 0.28 [0.19, 0.41]*** |
| High school diploma | 0.46 [0.28, 0.75]** | 1.10 [0.65, 1.86] | 0.42 [0.31, 0.56]*** |
| Some college | 0.70 [0.42, 1.17] | 1.23 [0.71, 2.13] | 0.57 [0.42, 0.76]** |
| Bachelor’s degree or higher | 1.00 [Reference] | 1.00 [Reference] | 1.00 [Reference] |
| Time since resolving a problem with AOD (OR)a | |||
| < 1 year | 0.36 [0.23, 0.57]*** | 0.30 [0.18, 0.51]*** | 1.20 [0.81, 1.76] |
| 1–5 years | 0.36 [0.24, 0.53]*** | 0.38 [0.24, 0.58]*** | 0.95 [0.72, 1.26] |
| > 5 years | 1.00 [Reference] | 1.00 [Reference] | 1.00 [Reference] |
| Primary substance used (OR) | |||
| Alcohol | 1.00 [Reference] | 1.00 [Reference] | 1.00 [Reference] |
| Amphetamines | 0.36 [0.22, 0.58]*** | 0.46 [0.28, 0.75]** | 0.78 [0.54, 1.12] |
| Cannabis | 0.59 [0.38, 0.93]* | 0.34 [0.20, 0.55]*** | 1.77 [1.26, 2.50]** |
| Cocaine | 1.29 [0.71, 2.35] | 0.86 [0.45, 1.61] | 1.50 [1.07, 2.10]* |
| Opioids | 0.78 [0.40, 1.53] | 0.52 [0.25, 1.06] | 1.52 [0.96, 2.39] |
| Other | 1.61 [0.34, 7.58] | 0.69 [0.13, 3.72] | 2.33 [0.93, 5.83] |
| History of arrest (OR) | |||
| Yes | 0.81 [0.59, 1.10] | 0.72 [0.52, 1.00] | 1.11 [0.92, 1.35] |
| No | 1.00 [Reference] | 1.00 [Reference] | 1.00 [Reference] |
| Number of arrests (OR) | 0.95 [0.93, 0.97]*** | 0.98 [0.97, 1.01] | 0.96 [0.94, 0.98]*** |
| Quality of life (b) | 3.92 [2.05, 5.78]*** | 1.27 [−0.67, 3.23] | 2.64 [1.74, 3.53]*** |
| Self-esteem (b) | 0.35 [0.04, 0.66]* | 0.07 [−0.24, 0.38] | 0.28 [0.10, 0.46]** |
| Happiness (b) | 0.48 [0.21, 0.76]** | 0.31 [0.03, 0.59]* | 0.18 [0.04, 0.32]* |
Notes. OR = odds ratio; b = unstandardized beta coefficient; 95% CI = 95% confidence interval; AOD = alcohol and other drugs.
Model controlled for age.
p < .05.
p < .01.
p < .0001.
Results from the linear regression models show that employment was associated with quality of life, F(2) = 22.25, p < .0001, R2 = 0.06; happiness, F(2) = 7.50, p = .0006, R2 = 0.03; and self-esteem, F(2) = 5.88, p = .003, R2 = 0.01.
5.3. Sex
There were no statistically significant effects of sex (model χ2, p = .05).
5.4. Race
As shown in Table 4, in partial support of hypotheses, individuals identifying as black/non-Hispanic (OR = 0.50, 95% CI = 0.32–0.78) were significantly less likely to be employed than those identifying as white/non-Hispanic (reference group; Fig. 1a) versus unemployed and needing work. Contrary to prediction, however, participants identifying as Hispanic were not significantly less likely to be employed versus unemployed and needing work in comparison to those identifying as white/non-Hispanic.
Fig. 1.
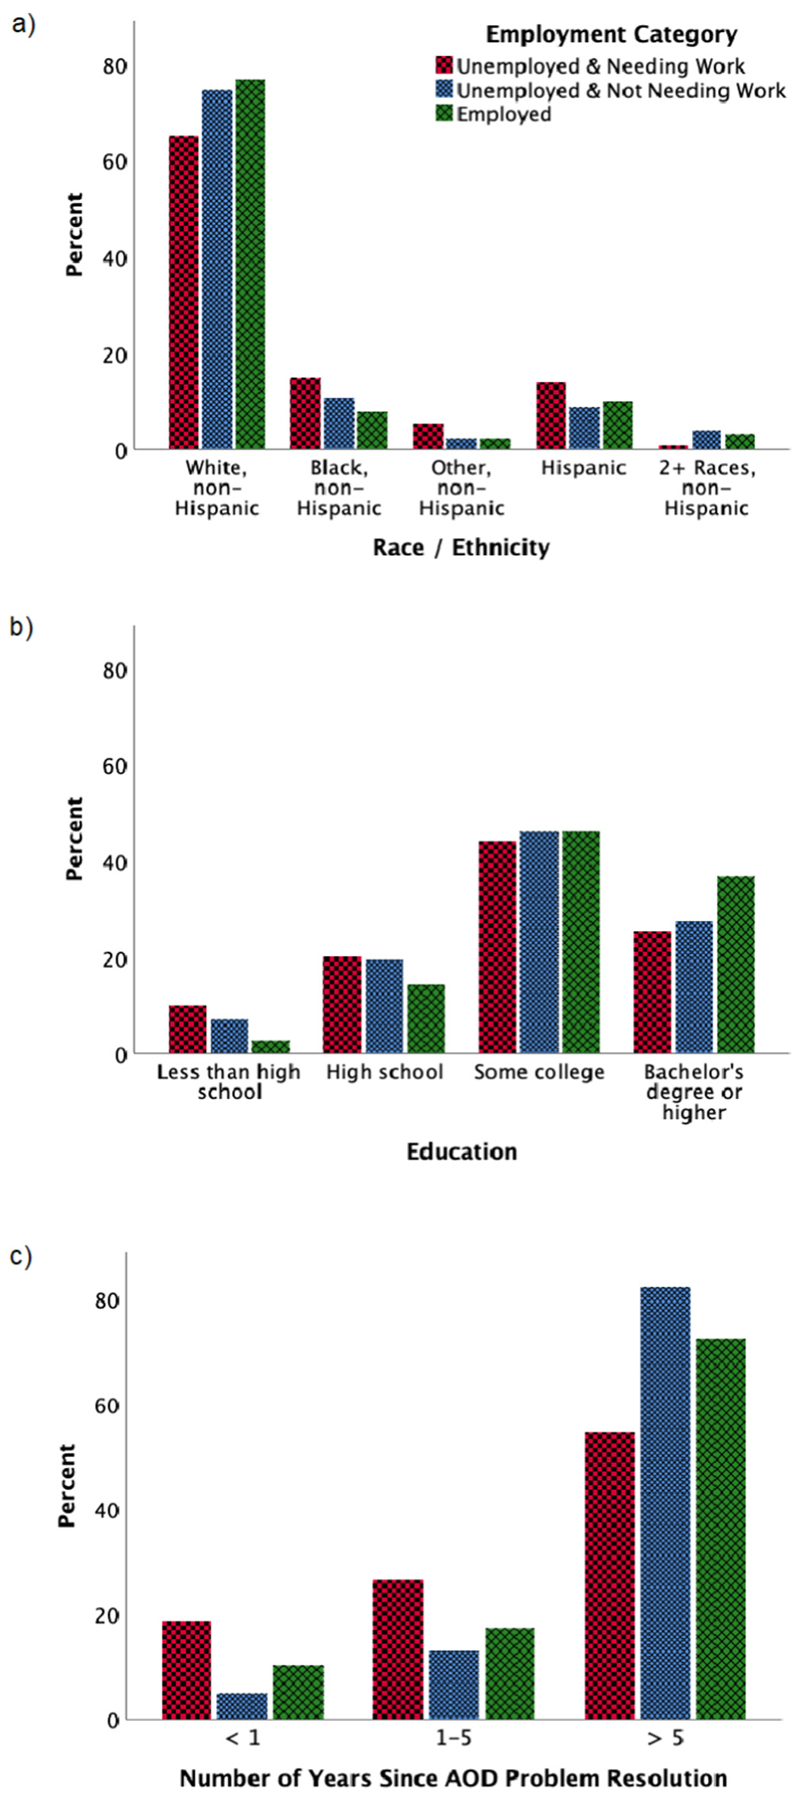
a) Employment status collapsed into three general categories (unemployed and needing work, unemployed and not requiring work, and employed) by race and ethnicity. Unemployed and needing work n = 129, unemployed and not requiring work n = 875, employed n = 998. Black/non-Hispanic participants were significantly more likely to be unemployed and needing work (p < .001), and unemployed and not requiring work than White/non-Hispanic participants (p < .01). b) Employment status collapsed into three general categories (unemployed and needing work, unemployed and not requiring work, and employed) by education level. Unemployed and needing work n = 129, unemployed and not requiring work n = 875, employed n = 998. c) Employment status collapsed into three general categories (unemployed and needing work, unemployed and not requiring work, and employed) by number of years since resolving a problem with alcohol and other drugs (AOD). Unemployed and needing work n = 129, unemployed and not requiring work n = 875, employed n = 998. Those with < 1 year (p < .001), and 1–5 years since problem resolution (p < .001) were significantly more likely to be unemployed and needing work compared to those with > 5 years since resolving a problem with AOD.
Individuals identifying as black/non-Hispanic (OR = 0.58, 95% CI = 0.44–0.77) were also significantly less likely to be employed versus unemployed and not requiring work compared to those identifying as white/non-Hispanic (reference group; Fig. 1a).
5.5. Education
As hypothesized, being employed, versus unemployed and needing work, was associated with a higher level of education, with those with a high school diploma (OR = 0.46, 95% CI = 0.28–0.75) less likely to be employed than those with a college education (reference group). Similarly, those with less than a high school education (OR = 0.21, 95% CI = 0.12–0.37; Fig. 1b) were less likely to be employed than those with a college education (reference group).
Additionally, those having a college education (reference group) were significantly more likely to be employed, versus unemployed and not requiring work, than those with some college (OR = 0.57, 95% CI = 0.42–0.76), a high school diploma (OR = 0.42, 95% CI = 0.31–0.56), and less than a high school education (OR = 0.28, 95% CI = 0.19–0.41; Fig. 1b).
5.6. Time since resolving a problem with alcohol and other drugs
After adjusting for age, those with less time since resolving a problem with AOD were less likely to be employed, with those with < 1 year (OR = 0.36, 95% CI = 0.23–0.57) and 1–5 years since problem resolution (OR = 0.36, 95% CI = 0.24–0.53) being significantly more likely to be unemployed and needing work compared to those with > 5 years since resolving a problem with AOD (reference group; Fig. 1c). The observed lower percentage of unemployment and needing work in the > 5 years since AOD problem resolution group can however be explained by people transitioning to retirement or becoming disabled, as well as people transitioning to employment.
There were no statistically significant effects of time since AOD problem resolution between those who were employed and those unemployed and not requiring work.
5.7. Primary substance used
Employment was also associated with primary substance used, such that individuals indicating amphetamine (OR = 0.36, 95% CI = 0.22–0.58) and cannabis (OR = 0.59, 95% CI = 0.38–0.93) use were more likely to be unemployed and needing work versus employed, compared to those indicating alcohol as their primary substance used (reference group).
Individuals indicating cannabis (OR = 1.77, 95% CI = 1.26–2.50) and cocaine (OR = 1.50, 95% CI = 1.07–2.10) as their primary substance were more likely to be unemployed and not requiring work versus employed compared to those indicating alcohol as their primary substance (reference group).
The findings for employment status by primary substance used, however, should be considered in light of some small cell sizes in this model (weighted n alcohol = 1013.0; weighted n amphetamines = 165.2; weighted n cannabis = 217.2; weighted n cocaine = 197.9; weighted n opiates = 105.0; weighted n other = 27.8), and that 219 participants (weighted n = 249.6) did not indicate any primary substance used, which reduces our confidence in this model.
5.8. History of arrest & number of arrests
Contrary to prediction, having ever been arrested (yes or no) was not associated with employment status (model χ2, p = .21). However, those with more arrests were less likely to be employed (OR = 0.95, 95% CI = 0.93–0.97) versus unemployed and needing work, and also less likely to be employed relative to being unemployed and not requiring work (OR = 0.96, 95% CI = 0.94–0.98).
To more deeply explore associations between number of arrests and employment status, we conducted a post hoc analysis in which we categorized participants categorically on number of arrests (0, 1, or ≥2). Compared to those with no previous arrests, participants with ≥2 arrests were less likely to be employed versus unemployed and needing work (OR = 0.57, 95% CI = 0.41–0.80) and less likely to be unemployed and not requiring work versus unemployed and needing work (OR = 0.57, 95% CI = 0.40–0.80). However, compared to those with no arrest history, participants with 1 arrest were actually more likely to be employed versus unemployed and needing work (OR = 2.15, 95% CI = 1.21–3.82), and employed versus unemployed and not requiring work (OR = 1.58, 95% CI = 1.20–2.10). Additionally, those with 1 arrest, versus ≥2 arrests, were more likely to be employed versus unemployed and needing work (OR = 3.80, 95% CI = 2.13–6.68), more likely to be employed versus unemployed and not requiring work (OR = 1.57, 95% CI = 1.17–2.10), and more likely to be unemployed and not requiring work, versus unemployed and needing work (OR = 2.41, 95% CI = 1.33–4.36).
5.9. Quality of life, self-esteem, & happiness
As predicted, those employed, versus unemployed and needing work had greater quality of life, b = 3.92, t(1973) = 4.12, p < .0001, as did those who were employed, versus unemployed and not requiring work, b = 2.64, t(1973) = 5.79, p < .0001. However, differences in quality of life between those unemployed and not requiring work, and unemployed and needing work were not statistically significant (p = .20).
Similarly, as anticipated, those employed, versus unemployed and needing work had greater self-esteem, b = 0.35, t(1978) = 2.21, p = .03, as did those who were employed, versus unemployed and not requiring work, b = 0.28, t(1978) = 3.12, p = .002. However, differences in self-esteem between those unemployed and not requiring work, and unemployed and needing work were not statistically significant (p = .66).
Further, those employed, versus unemployed and needing work endorsed greater happiness, b = 0.48, t(1978) = 3.46, p = .0006, as did those who were employed, versus unemployed and not requiring work, b = 0.18, t(1978) = 2.47, p = .01. In addition, those unemployed and not requiring work endorsed greater happiness than those unemployed and needing work, b = 0.31, t(1978) = 2.14, p = .03.
6. Discussion
For many individuals, gaining or regaining employment after having a problem with AOD represents a central component of their recovery, and getting individuals in AOD problem recovery who would benefit from working back to work is an economic imperative. In the current study we characterized employment and its psychosocial correlates in a nationally representative U.S. sample of adults who have resolved an AOD problem.
6.1. Comparisons with the U.S. population
Prevalence of working as a paid employee at the time of surveying (July–August 2016) was significantly lower in the NRS sample (47.7%) than the general U.S. population (56.9%), reflecting a relative difference of 19%. The NRS sample was also significantly more likely to be not working and looking for work (7.7%) than the U.S. population (2.8%)—a relative difference of 175%. Given the many challenges that individuals face after overcoming an AOD problem, some employment disparities relative to the general U.S. population are expected. The magnitude of the disparities reported here, however, is cause for concern. And even though the unemployment percentage was significantly better among those with > 5 years since AOD problem resolution (Table 4, first column), suggesting time in recovery might offset employment disparities, this finding is partially explained by the fact that those with > 5 years since AOD problem resolution were also significantly more likely to be unemployed and not requiring work because they had become disabled or retired (Table 4, second column).
Given the physical disease burden exacted by AOD problems (Eddie, Greene, White, & Kelly, 2019), it is perhaps not surprising that the NRS sample was also significantly more likely to be not working because of disability (15.6%) than the general population (5.6%) a 179% relative magnitude of difference. This high percentage of disability among individuals who have resolved an AOD problem reinforces calls for earlier and more proactive primary care–based interventions for AOD problems and related medical conditions.
It is also possible that differences in employment between the NRS sample and U.S. population are partly explained by NRS participants staying in the workforce longer. The NRS sample was significantly less likely to be not working due to retirement (12.0%) than the general U.S. population (15.4%), representing a 22% relative difference. This difference suggests that individuals who have resolved an AOD problem are staying in the workforce longer, perhaps due to a need to offset financial losses sustained as a result of addiction. At the same time, this finding should be considered in light of the fact that 12.9% of the NRS sample was 65+, versus 14.9% of the U.S. population at the time of the 2015 census (U.S. Census Bureau, 2017). This difference, therefore, could in part be attributable to the NRS sample having fewer individuals of retirement age than the general U.S. population.
It is important to note that because age categories are not provided for the unemployment categories “unemployed and on temporary layoff”, and “unemployed and looking for work” in the U.S. Bureau of Labor Statistics’ Current Population Survey, which surveys individuals 16 years or older, comparisons with the NRS sample on these categories were, out of necessity, made with individuals 16 years or older. NRS unemployment percentages, therefore, represent a conservative estimate, because 16–17-year-olds are less likely be unemployed and on a temporary layoff, and unemployed and looking for work because most have not yet entered the workforce.
6.2. NRS sample employment characteristics
Aligning with our hypotheses, within the NRS sample, odds ratios showed that those identifying as black/non-Hispanic were 50% less likely to be employed compared to those identifying as white/non-Hispanic. Conversely, our hypothesis that Hispanics would report greater unemployment was not supported. The proportion of Hispanic individuals who identify as racially white in the NRS is unknown; however, if the proportion is consistent with the U.S. Census then it is a little more than half (United States Census Bureau, 2010). Individuals identifying as white/Hispanic may share more similarities with white/non-Hispanics than black/non-Hispanics, making the Hispanic group appear statistically similar to white/non-Hispanics. Although a considerable body of evidence shows racial and ethnic minorities bear a disproportional burden of AOD related health and social consequences (Galea & Rudenstine, 2005; Zapolski, Pedersen, McCarthy, & Smith, 2014) despite lower prevalence of SUD (Vilsaint et al., 2019), our findings are the first concrete evidence of differences in percentages of employment and unemployment among individuals who identify as black and having resolved an AOD problem.
It is of course possible that these differences reflect broader racial disparities in drug-related arrest and incarceration rates for individuals identifying as black in the general U.S. population (Fielding-Miller, Davidson, & Raj, 2016; Mitchell & Caudy, 2015). Though we did not find evidence for racial differences in ever being arrested (yes or no) between those identifying as black/non-Hispanic, and white/non-Hispanic (p = .12), on average individuals identifying as black did report more arrests (M = 6.36, SD = 11.83) than whites (M = 3.91, SD = 6.51) (χ2(1) = 10.74, p = .001). This difference, however, should be considered in light of greater variance in the number of arrests among those identifying as black (as evinced by the larger standard deviation), and the fact that the median and modal number of arrests for both groups was the same (Median = 2, Mode = 1). This suggests number of arrests outliers among black participants were driving this statistical difference. In addition, previous research among individuals prescribed methadone has found that criminal involvement was strongly negatively associated with having employment among individuals who identify as black, but not as white, which suggests that the association between criminal involvement and employment may vary by race (Metzger, 1987; Platt, 1995). Taken together, the current findings build on the existing literature showing that individuals identifying as black who have overcome an AOD problem face barriers to recovery above and beyond those experienced by individuals identifying as white (Kelly et al., 2018; Laudet, 2012).
As hypothesized, participants with more education were more likely to be employed, with odds ratios showing that those with a high school diploma were 54% less likely to be employed versus unemployed and needing work compared to those with a college degree. Further, odds ratios showed that those with less than a high school diploma were 79% less likely to be employed compared to those with a college degree. Having a college degree thus may help with the chances of employment among individuals in AOD recovery. Though it is also possible that participants with college degrees are higher functioning or had less addiction severity than those with less education, these findings suggest greater education may help offset employment challenges faced by individuals in AOD recovery. Further, this reinforces the case for helping individuals in AOD recovery access higher education, potentially through collegiate recovery programs designed specifically to attract individuals in SUD recovery to university, and provide a safe, pro-recovery educational environment (Cleveland, Harris, Baker, Herbert, & Dean, 2007; Laitman, Kachur-Karavites, & Stewart, 2014; Laudet, Harris, Kimball, Winters, & Moberg, 2014). It is also likely that having more education confers access to a greater range of employment opportunities and less physically strenuous office-based jobs, thus reducing individuals’ risk of unemployment due to physical or medical problems.
Although history of arrest was not associated with employment status, the hypothesis that history of arrest would be associated with lower percentages of employment was partially supported such that those with more arrests were more likely to be unemployed and needing work, with odds ratios indicating that each arrest was associated with a 5% lower likelihood of being employed. This finding, however, was qualified by the observation that although those with ≥2 arrests were 43% less likely to be employed versus unemployed and needing work than those without any arrests, those with one arrest were actually about twice as likely to be employed versus unemployed and needing work than as those with no arrest history. Taken together, it appears that it is having multiple arrests, versus none or one, that most adversely impacts later employment chances. It may be that multiple arrests reflect a longer and more pervasive pattern of AOD problems with higher likelihood of felony offences that have greater bearing on employment prospects than misdemeanors.
As anticipated, unstandardized beta coefficients indicated that those who were employed versus unemployed and needing work endorsed greater quality of life, scoring on average about 3.92 points more on the 40-point EUROHIS-QOL scale (equating to a 9.8% difference), with employment accounting for 6% of the variance in quality of life. Similarly, being employed, versus unemployed and needing work, was associated with greater self-esteem, with those employed scoring on average 0.35 points more on the 5-point self-esteem scale (a 7% difference), though notably employment only accounted for 1% of the variance in self-esteem. Also, as predicted, those who were employed also endorsed greater happiness compared to those unemployed and needing work, with employment predicting scores on average 0.48 points greater on the 5-point happiness scale (a 9.6% difference), with employment accounting for 3% of the variance in happiness. These findings provide population-level evidence supporting findings from previous work that has shown that accumulating recovery resources closely aligns with increases in these measures (Epstein & Preston, 2012; Kelly et al., 2018; Petry et al., 2014; Platt, 1995).
Odds ratios also indicated that those for whom amphetamines were the primary substance used had 64% lower odds of being employed versus unemployed and needing work compared to those for whom alcohol was primary. Further, those for whom cannabis was primary had 41% lower odds of being employed versus unemployed and needing work than those for whom alcohol was primary. On one hand it appears that individuals typically thought of as more stigmatized and marginalized, such as those who primarily use amphetamines, appear to face greater employment challenges in AOD recovery. At the same time, those for whom cannabis was primary also demonstrated a lower percentage of employment, though to a lesser extent than for those using amphetamines. These findings, however, should be considered in light of the small cell sizes in this model, which markedly reduces our confidence in these specific results. These findings should be replicated in larger samples.
R-squared values showed that age group explains 10% of the variance in employment status. This is perhaps not surprising given employment status is so strongly influenced by age. Much of the variance in employment explained by age-group is a function of retirement among the 65+ age group. When the 65+ age group is excluded from the analyses, the R-squared value reduces to 0.05. That is, 5% of the variance in employment is explained, versus 10%.
6.3. Limitations
The current findings should be viewed in light of important limitations pertaining to the study design. First, the NRS’ stem question (“Did you used to have a problem with drugs or alcohol but no longer do?”) was designed to capture the broader population of individuals affected by AOD problems, including those who have not been formally diagnosed, or do not identify as having an SUD history, but whose AOD problems nevertheless contribute to the AOD public health burden. Higher functioning individuals may have recognized AOD problems earlier and at lower severities, leading to lower likelihood of job loss. This may have also played a role in the protective effect associated with having more education. Second, these data are cross-sectional; we cannot know whether certain factors shown to be associated with employment in the current sample were a cause or effect of employment, or how these associations were affected by factors such as addiction severity. Third, although the total sample size was large, the number of participants endorsing certain employment types (e.g., not working - on temporary layoff from a job, and the unemployed and needing work category) and primary substances used was relatively small. As such, confidence in some of these estimates is lower. Fourth, Bureau of Labor Statistics employment categories do not perfectly align with the employment categories in the NRS sample; because there is no direct analog of the NRS employment category “not working–other”, the totality of the U.S. population is not represented in Table 2. Relatedly, individuals aged 16–17 were included in U.S. population unemployment statistics obtained from the Bureau of Labor Statistics’ Current Population Survey, and could not be parsed out when calculating unemployment statistics (i.e., unemployed and needing work, and unemployed on a temporary layoff). This may have subtly affected the accuracy of comparisons with the NRS sample on these specific unemployment measures because the NRS sampled individuals 18 years or older. Last, it is possible that for some individuals improved financial means associated with gaining employment could increase access to substances and thus vulnerability to substance use disorder relapse. Though we did not find evidence of this, future research should investigate this potential risk.
7. Conclusions and future directions
Individuals who are attempting to overcome, or have overcome an AOD problem face myriad challenges. The current findings are the first to report on national employment and unemployment percentages among individuals who report AOD problem resolution, and they show significant disparities in comparison to the general U.S. population. These disparities appear to be larger among already marginalized populations, such as those identifying as black. Findings also highlight the high percentages of disability in this population compared to the general population. Conversely, certain factors, such as more education and less prior criminal system involvement appear to buffer individuals against unemployment risk. Given that employment is a means to accrual of critical recovery capital and a major driver of so many other positive aspects of individuals’ lives, further research should more deeply explore the factors that influence employment among individuals in AOD recovery so that employment disparities may be better addressed. Results also speak to the need for employment barriers to be dismantled for individuals in AOD recovery, and the need for more community resources, such as recovery community centers that can provide critical support to individuals seeking to re-enter employment (Haberle et al., 2014; Kelly et al., 2020).
Acknowledgements
The National Recovery Study was funded by Massachusetts General Hospital Recovery Research Institute. The authors of this publication were supported by National Institute on Alcohol Abuse and Alcoholism awards F32AA025251, F32AA025823, and K24AA022136, and National Institute on Drug Abuse award F32DA047741.
References
- Allison PD (2014). Measures of fit for logistic regression. Paper presented at the SAS Global Forum Conference. [Google Scholar]
- Battaglia MP, Izrael D, Hoaglin DC, & Frankel MR (2009). Practical considerations in raking survey data. Survey Practice, 2(5), 1–10. [Google Scholar]
- Bouchery EE, Harwood HJ, Sacks JJ, Simon CJ, & Brewer RD (2011). Economic costs of excessive alcohol consumption in the U.S., 2006. American Journal of Preventive Medicine, 41(5), 516–524. [DOI] [PubMed] [Google Scholar]
- Braunstein WB, Powell BJ, McGowan JF, & Thoreson RW (1983). Employment factors in outpatient recovery of alcoholics: A multivariate study. Addictive Behaviors, 8(4), 345–351. [DOI] [PubMed] [Google Scholar]
- Center for Behavioral Health Statistics and Quality (2016). 2015 National Survey on Drug Use and Health (NSDUH): Methodological summary and definitions. Rockville, MD. [Google Scholar]
- Centers for Disease Control and Prevention (2013). Unweighted response rates for The National Health and Nutrition Examination Survey 2011–2012. Retrieved from https://www.cdc.gov/nchs/nhanes/response_rates_cps.htm.
- Cleveland HH, Harris KS, Baker AK, Herbert R, & Dean LR (2007). Characteristics of a collegiate recovery community: Maintaining recovery in an abstinence-hostile environment. Journal of Substance Abuse Treatment, 33(1), 13–23. 10.1016/j.jsat.2006.11.005. [DOI] [PubMed] [Google Scholar]
- Dennis ML, Foss MA, & Scott CK (2007). An eight-year perspective on the relationship between the duration of abstinence and other aspects of recovery. Evaluation Review, 31(6), 585–612. 10.1177/0193841x07307771. [DOI] [PubMed] [Google Scholar]
- Eddie D, Greene MC, White WL, & Kelly JF (2019). Medical burden of disease among individuals in recovery from alcohol and drug problems in the United States: Findings from the National Recovery Survey. Journal of Addiction Medicine, 13(5), 385–395. 10.1097/ADM.0000000000000512. [DOI] [PMC free article] [PubMed] [Google Scholar]
- Epstein DH, & Preston KL (2012). TGI Monday?: Drug-dependent outpatients report lower stress and more happiness at work than elsewhere. American Journal of Addiction, 21(3), 189–198. 10.1111/j.1521-0391.2012.00230.x. [DOI] [PMC free article] [PubMed] [Google Scholar]
- Fielding-Miller R, Davidson P, & Raj A (2016). Blacks face higher risk of drug arrests in White neighborhoods. International Journal of Drug Policy, 32, 100–103. 10.1016/j.drugpo.2016.03.008. [DOI] [PMC free article] [PubMed] [Google Scholar]
- Fosados R, Evans E, & Hser YI (2007). Ethnic differences in utilization of drug treatment services and outcomes among Proposition 36 offenders in California. Journal of Substance Abuse Treatment, 33(4), 391–399. 10.1016/j.jsat.2007.02.005. [DOI] [PMC free article] [PubMed] [Google Scholar]
- Galea S, & Rudenstine S (2005). Challenges in understanding disparities in drug use and its consequences. Journal of Urban Health, 82(2 Suppl 3), iii5–12. 10.1093/jurban/jti059. [DOI] [PMC free article] [PubMed] [Google Scholar]
- GfK (2013). GfK Knowledgepanel design summary. Retrieved from www.gfk.com/fileadmin/user_upload/dyna_content/US/documents/KnowledgePanel_-_A_Methodological_Overview.pdf.
- Grant BF, Goldstein RB, Saha TD, Chou SP, Jung J, Zhang H, … Huang B (2015). Epidemiology of DSM-5 alcohol use disorder: Results from the National Epidemiologic Survey on alcohol and related conditions III. JAMA Psychiatry, 72(8), 757–766. 10.1001/jamapsychiatry.2015.0584. [DOI] [PMC free article] [PubMed] [Google Scholar]
- Haberle BJ, Conway S, Valentine P, Evans AC, White WL, & Davidson L (2014). The recovery community center: A new model for volunteer peer support to promote recovery. Journal of Groups in Addiction & Recovery, 9(3), 257–270. 10.1080/1556035X.2014.940769. [DOI] [Google Scholar]
- Kelly JF, Bergman B, Hoeppner BB, Vilsaint CL, & White WL (2017). Prevalence and pathways of recovery from drug and alcohol problems in the United States population: Implications for practice, research, and policy. Drug & Alcohol Dependence, 181, 162–169. 10.1016/j.drugalcdep.2017.09.028. [DOI] [PMC free article] [PubMed] [Google Scholar]
- Kelly JF, Fallah-Sohy N, Vilsaint C, Hoffman L, Jason L, Stout RL, … Hoeppner BB (2020). New kid on the block: An investigation of the physical, operational, personnel, and service characteristics of recovery community centers in the United States. Journal of Substance Abuse Treatment, 111, 1–10. 10.1016/j.jsat.2019.12.009. [DOI] [PMC free article] [PubMed] [Google Scholar]
- Kelly JF, Greene MC, & Bergman BG (2018). Beyond abstinence: Changes in indices of quality of life with time in recovery in a nationally representative sample of U.S. adults. Alcoholism Clinical and Experimental Research, 42(4), 770–780. 10.1111/acer.13604. [DOI] [PMC free article] [PubMed] [Google Scholar]
- Kelly JF, & Hoeppner B (2015). A biaxial formulation of the recovery construct. Addiction Research & Theory, 23(1), 5–9. 10.3109/16066359.2014.930132. [DOI] [Google Scholar]
- Kessler RC, Andrews G, Colpe LJ, Hiripi E, Mroczek DK, Normand SL, … Zaslavsky AM (2002). Short screening scales to monitor population prevalences and trends in non-specific psychological distress. Psychological Medicine, 32(6), 959–976. 10.1017/s0033291702006074. [DOI] [PubMed] [Google Scholar]
- Kulesza M, Matsuda M, Ramirez JJ, Werntz AJ, Teachman BA, & Lindgren KP (2016). Towards greater understanding of addiction stigma: Intersectionality with race/ethnicity and gender. Drug and Alcohol Dependence, 169, 85–91. 10.1016/j.drugalcdep.2016.10.020. [DOI] [PMC free article] [PubMed] [Google Scholar]
- Laitman L, Kachur-Karavites B, & Stewart LP (2014). Building, engaging, and sustaining a continuum of care from harm reduction to recovery support: The Rutgers Alcohol and Other Drug Assistance Program. Journal of Social Work Practice in the Addictions, 14(1), 64–83. 10.1080/1533256X.2014.872010. [DOI] [Google Scholar]
- Laudet AB (2012). Rate and predictors of employment among formerly polysubstance dependent urban individuals in recovery. Journal of Addictive Diseases, 31(3), 288–302. 10.1080/10550887.2012.694604. [DOI] [PMC free article] [PubMed] [Google Scholar]
- Laudet AB, Harris K, Kimball T, Winters KC, & Moberg DP (2014). Collegiate recovery communities programs: What do we know and what do we need to know? Journal of Social Work Practice in the Addictions, 14(1), 84–100. 10.1080/1533256X.2014.872015. [DOI] [PMC free article] [PubMed] [Google Scholar]
- Laudet AB, & White WL (2008). Recovery capital as prospective predictor of sustained recovery, life satisfaction, and stress among former poly-substance users. Substance Use and Misuse, 43(1), 27–54. 10.1080/10826080701681473. [DOI] [PMC free article] [PubMed] [Google Scholar]
- McQuaid RJ, Jesseman R, & Rush B (2018). Examining barriers as risk factors for relapse: A focus on the Canadian treatment and recovery system of care. Canadian Journal of Addiction, 9(3), 5–12. 10.1097/cxa.0000000000000022. [DOI] [PMC free article] [PubMed] [Google Scholar]
- Metzger DS (1987). Factors predicting employment status of methadone maintained clients. Doctoral dissertationNew Brunswick, NJ: Rutgers University. [Google Scholar]
- Meyers RJ, & Smith JE (1995). Clinical guide to alcohol treatment: The community reinforcement approach. New York, NY, USA: Guilford Press. [Google Scholar]
- Mitchell O, & Caudy MS (2015). Examining racial disparities in drug arrests. Justice Quarterly, 32(2), 288–313. 10.1080/07418825.2012.761721. [DOI] [Google Scholar]
- Niv N, Pham R, & Hser YI (2009). Racial and ethnic differences in substance abuse service needs, utilization, and outcomes in California. Psychiatric Services, 60(10), 1350–1356. 10.1176/ps.2009.60.10.1350. [DOI] [PMC free article] [PubMed] [Google Scholar]
- Office of National Drug Control Policy (2019). National drug control strategy. Washington, DC: Office of National Drug Control Polic. [DOI] [PubMed] [Google Scholar]
- Petry NM, Andrade LF, Rash CJ, & Cherniack MG (2014). Engaging in job-related activities is associated with reductions in employment problems and improvements in quality of life in substance abusing patients. Psychology of Addictive Behaviors, 28(1), 268–275. 10.1037/a0032264. [DOI] [PMC free article] [PubMed] [Google Scholar]
- Platt JJ (1995). Vocational rehabilitation of drug abusers. Psychological Bulletin, 117(3), 416–433. [DOI] [PubMed] [Google Scholar]
- Robins RW, Hendin HM, & Trzesniewski KH (2001). Measuring global self-esteem: Construct validation of a single-item measure and the Rosenberg Self-Esteem Scale. Personality and Social Psychology Bulletin, 27(2), 151–161. 10.1177/0146167201272002. [DOI] [Google Scholar]
- Ruais J (2019). My journey to recovery: How an employer changed my life. Retrieved from https://www.addictionpolicy.org/blog/employers-key-to-recovery.
- Sahker E, Ali SR, & Arndt S (2019). Employment recovery capital in the treatment of substance use disorders: Six-month follow-up observations. Drug and Alcohol Dependence, 205, 107624 10.1016/j.drugalcdep.2019.107624. [DOI] [PubMed] [Google Scholar]
- SAS Institute (2016). SAS/STAT® 14.2 user’s guide the SURVEYREG procedure. Cary, NC: SAS institute Inc. [Google Scholar]
- SAS Institute (2018). SAS 9.4 user’s guide. Cary, NC: SAS institute Inc. [Google Scholar]
- Schmidt S, Mühlan H, & Power M (2005). The EUROHIS-QOL 8-item index: Psychometric results of a cross-cultural field study. The European Journal of Public Health, 16(4), 420–428. 10.1093/eurpub/cki155. [DOI] [PubMed] [Google Scholar]
- Shtatland ES, Kleinman K, & Cain EM (2002). One more time about R2 measures of fit in logistic regression. Paper presented at the NESUG 15 proceedings. [Google Scholar]
- U.S. Bureau of Labor Statistics (2015). Beyond the numbers. People who are not in the labor force: Why aren’t they working? Retrieved from https://www.bls.gov/opub/btn/volume-4/pdf/people-who-are-not-in-the-labor-force-why-arent-they-working.pdf.
- U.S. Bureau of Labor Statistics (2016). Current population survey. Retrieved from https://www.bls.gov.
- U.S. Census Bureau (2017). Facts for features: Older Americans month: May 2017. Retrieved from https://www.census.gov/newsroom/facts-for-features/2017/cb17-ff08.html.
- United States Census Bureau (2010). Overview of race and Hispanic origin. Retrieved from www.census.gov/prod/cen2010/briefs/c2010br-02.pdf.
- Vilsaint CL, Kelly JF, Bergman BG, Groshkova T, Best D, & White W (2017). Development and validation of a Brief Assessment of Recovery Capital (BARC-10) for alcohol and drug use disorder. Drug and Alcohol Dependence, 177, 71–76. 10.1016/j.drugalcdep.2017.03.022. [DOI] [PubMed] [Google Scholar]
- Vilsaint CL, NeMoyer A, Fillbrunn M, Sadikova E, Kessler RC, Sampson NA, … Alegria M (2019). Racial/ethnic differences in 12-month prevalence and persistence of mood, anxiety, and substance use disorders: Variation by nativity and socio-economic status. Comprehensive Psychiatry, 89, 52–60. 10.1016/j.comppsych.2018.12.008. [DOI] [PMC free article] [PubMed] [Google Scholar]
- Xie H, McHugo GJ, Fox MB, & Drake RE (2005). Special section on relapse prevention: Substance abuse relapse in a ten-year prospective follow-up of clients with mental and substance use disorders. Psychiatric Services, 56(10), 1282–1287. 10.1176/appi.ps.56.10.1282. [DOI] [PubMed] [Google Scholar]
- Zapolski TC, Pedersen SL, McCarthy DM, & Smith GT (2014). Less drinking, yet more problems: Understanding African American drinking and related problems. Psychological Bulletin, 140(1), 188–223. 10.1037/a0032113. [DOI] [PMC free article] [PubMed] [Google Scholar]