Abstract
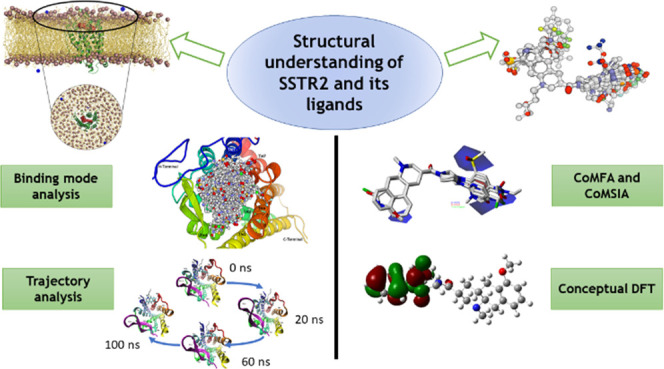
Somatostatin receptor 1 (SSTR1), a subtype of somatostatin receptors, is involved in various signaling mechanisms in different parts of the human body. Like most of the G-protein-coupled receptors (GPCRs), the available information on the structural features of SSTR1 responsible for the biological activity is scarce. In this study, we report a molecular-level understanding of SSTR1–ligand binding, which could be helpful in solving the structural complexities involved in SSTR1 functioning. Based on a three-dimensional quantitative structure–activity relationship (3D-QSAR) study using comparative molecular field analysis (CoMFA) and comparative molecular similarity index analysis (CoMSIA), we have identified that an electronegative, less-bulkier, and hydrophobic atom substitution can substantially increase the biological activity of SSTR1 ligands. A density functional theory (DFT) study has been followed to study the electron-related properties of the SSTR1 ligands and to validate the results obtained via the 3D-QSAR study. 3D models of SSTR1–ligand systems have been embedded in lipid–lipid bilayer membranes to perform molecular dynamics (MD) simulations. Analysis of the MD trajectories reveals important information about the crucial residues involved in SSTR1–ligand binding and various conformational changes in the protein that occur after ligand binding. Additionally, we have identified the probable ligand-binding site of SSTR1 and validated it using MD. We have also studied the favorable conditions that are essential for forming the most stable and lowest-energy bioactive conformation of the ligands inside the binding site. The results of the study could be useful in constructing more potent and novel SSTR1 antagonists and agonists.
Introduction
Over the past decade, structural understanding of the G-protein-coupled receptors (GPCRs), which constitute the largest family of membrane protein receptors, has been the focus of attention of structural biologists.1 Recent studies on the structures of GPCRs have led to notable discoveries, helping in studying the pathophysiology of various GPCR-related diseases and in their drug discovery.2 Although all GPCRs are structurally similar, having seven transmembrane helices and a highly conserved E/DRY motif, every single GPCR differs in its mode of cellular communication.3,4 Hence, in addition to the crystallization of GPCRs, it becomes important to study the conformational dynamics of ligand-binding sites and G-protein interaction sites that happen during the binding of both agonists and antagonists with the receptors. As a stable conformation of GPCRs is expected to regulate their functions, analyzing their conformational changes over time is significant. We have selected somatostatin receptors (SSTRs), a GPCR, in our study due to the important structural features necessary for SSTR–ligand binding and conformational changes that occur during binding. Previously, we have carried out structural characterization of SSTR5 and SSTR2 in two different studies5,6 and studied the binding of respective ligands with the receptor. In this study, we hope to analyze the various structural properties of SSTR1 and their ligands responsible for their biological activity.
SST receptors are omnipresent throughout the human body, expressed by intronless genes except for SSTR2.7 There is a notable sequence similarity (39–57%) among subtypes, with the highest sequence similarity observed between SSTR1 and SSTR4 (70%).8 Binding of the cyclic neuropeptide somatostatin (SRIF) with SSTRs triggers a cascade of signaling episodes that result in the regulation of various functions, such as inhibition of the secretion of growth hormone, glucagon, gastrin, insulin, and other gut hormones.9−14 SRIF occurs in two natural forms: SRIF-14 and SRIF-28 having 14 and 28 amino acids, respectively. SRIF has a short plasma half-life ≲3 min, which leads to their quick proteolytic degradation.15 Moreover, just a nanomolar activity of SRIF is efficient to bind it with the receptors,15 making the analysis of protein–ligand binding of SSTR–SRIF difficult. Analogues that mimic the SRIF structure are, hence, used in the treatment of SRIF-related disorders, known as somatostatin analogues (SSAs).16 Octreotide, first SSA to be clinically used, inhibits the growth hormone 45 folds compared to SRIF-14 and has a better half-time of ∼90 min.17 In addition to SSA, the availability of cloned SST receptor subtypes expedited the study of the various features involved in SSTR–SRIF binding.
SSTR1 is found to be secreted in various regions of the human body including neuroendocrine cells,18 cerebral cortex,19 retina,20 and blood vessels.21 In addition to this, SSTR1 is found to be expressed in various human tumors.22−25 Structural information about SSTR1 binding site could be useful in analysis of SSTR1-related tumors. In a site-directed mutagenesis study of SSTR2, Kaupmann et al. have constructed an SSTR1 mutant to validate the important residues that they have proposed to be involved in the binding of SSTR2 with an analogue SMS 201-995.26 Based on their study, a point mutation of the residues Q6.55 and S7.34 of SSTR1 greatly affected SSTR1–ligand binding. In another study, Liapakis et al. studied the importance of residues R197 to E214 present in the extracellular loop of SSTR1 related to binding of SSTR1 selective agonists.27 It becomes important to validate the role of these residues in ligand–SSTR1 binding, which we hope to carry out in this study. We performed a combination of molecular- and atomic-level analyses using homology modeling, molecular docking, three-dimensional quantitative structure–activity relationship (3D-QSAR), molecular dynamics, and DFT in this study to investigate the features responsible for the biological activity of SSTR1 ligands, both agonists and antagonists, and to propose and validate a probable binding site of SSTR1.
Results
Homology Modeling
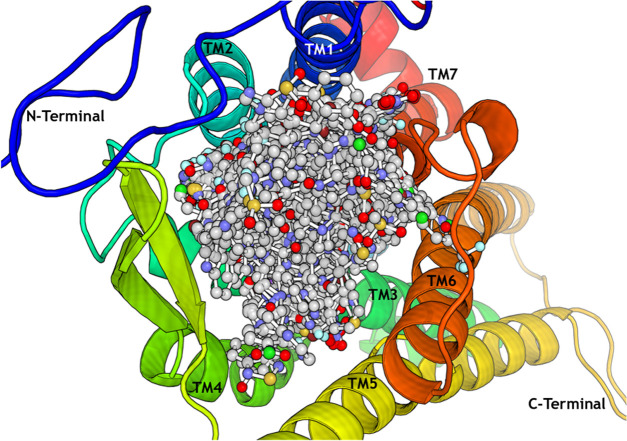
We have predicted 45 models totally: 40 models from EasyModeller and 5 models using the I-Tasser online server, which were later subjected to validation. The developed models have retained the characteristic seven transmembrane helices of the GPCR superfamily. We have discerned model 08, developed using the template 4RWA, to be scoring better validation scores compared to the other 44 models. The model has a root-mean-square deviation (RMSD) of 0.149 with its template 4RWA. On analyzing the model residues using the Ramachandran (RC) plot, we have observed 94.1% of the residues in the favored region, 3.3% in the allowed region, and the remaining 2.6% in the outlier region. It scored a QMEANDisCO value of −4.96 and a ProSA overall model quality value of −2.60. On analyzing the ERRAT plot, we have identified that the overall quality factor of the model is 81.905. Statistics of the model validation scores of all developed models is tabulated in Table S1. Figure 1 shows model 08, template (4RWA) superimposition, and Figure S1 represents the plots developed using RAMPAGE and ERRAT servers for model 08. Using the PEP-FOLD3 server, 3D structures of peptides SRIF-28 and cortistatin-14 are predicted. The models are subjected to validation, and one best model of each protein is selected for performing protein–protein docking. Model validation statistics of both peptides are represented in Table S2. The RC plot and ERRAT plots of the selected models are represented in Figure S2.
Figure 1.
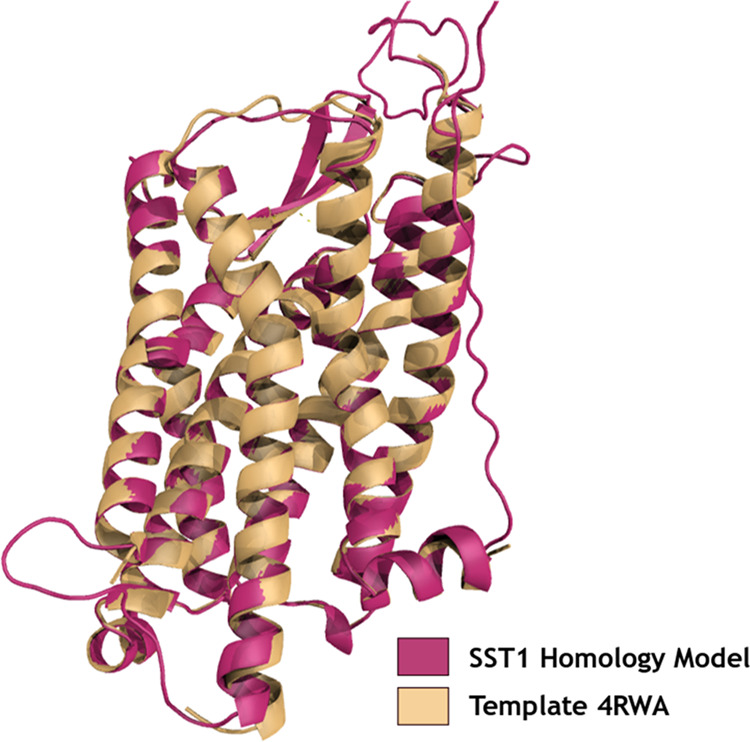
Selected homology model of SSTR1 (Model 08) is superimposed with the template (4RWA). Figure is generated using the PYMOL program (http://www.pymol.org).
Binding Site Characterization Using Molecular Docking
Using the COACH server, we have identified different clusters of probable binding pockets and ranked them based on C-score, which is the confidence score of prediction. We have also used the SiteID Find pocket available in Sybyl-X 2.1 to identify local clefts in the protein, which are plausible enough to be considered as a binding site. Results of both tools are grouped together to identify the residues that are consistently appearing in the top clusters. We have ascertained that residues S1.31, Y1.39, T2.64, R121, V206, C208, T5.43, Q6.55, S7.34, S7.37, and Y7.42 are significant in shaping the SSTR1 binding site. To validate this prediction, we have scrutinized the predicted binding pocket by docking ligands that are cocrystallized with the templates and observed that the ligands bound well within the site. Since the template shares a substantial sequence identity (>40%) with SSTR1 and belongs to the same structural family, we deem them to have comparable biological roles. We have carried out molecular docking of the selected 144 molecules with the proposed binding site using the Surflex docking algorithm in Sybyl-X 2.1. After energy minimization, we have clustered the molecules into a database and generated a protomol surrounding the binding site. After docking, we have ranked the molecules based on their Surflex energy score and identified the residues forming hydrogen bonds with each molecule (Table S3).
Arylpiperazine derivatives, compounds 01–23, have Surflex scores lesser compared to other derivatives, which is strengthened by the fact that they form H-bonds less frequently. Compounds 7 and 8 are the only residues to have scored >5, scoring 5.89 and 5.29, respectively. Y1.39 is observed to be the most consistently H-bond-forming residue. Compounds 24–46 (phenylpiperazines) follow the arylpiperazines in the case of Surflex energy scores but form H-bonds more frequently than them. Here, once again, residue Y1.39 could be seen forming H-bond more frequently than other residues. Cyclic tertiary amides, 47–55, that are not piperazine derivatives, have scores better than previous derivatives but still lesser than the overall average. Recurrence of Y1.39 in H-bond formation is the case here too, with C208 and ASP137 being the other residues to form H-bonds.
Octahydrobenzo[g]quinoline derivatives (compounds 56–71) having variations at position 6 scored better than the piperazines with an average score of about 4.3. Along with Y1.39, residues R121, C208, T5.43, and Q6.55 formed H-bond with ligands more than once. In the case of other octahydrobenzo[g]quinoline derivatives (compounds 72–77) that have variations at position 9, the Surflex score and formation of H-bond were lesser than average. Similar is the case with ergoline derivatives that have variations at position 2 (compounds 78–85). But ergoline derivatives that have variations at position 6 (compounds 86–92) scored better than the overall average, around 5, and residues Y1.39, R121, and Y7.42 formed H-bond with the molecules. Ergoline derivatives with variations of the piperazine substituent (compounds 93–110) had an average Surflex score comparable to overall average and formed H-bonds with residues Y1.39, R121, V206, C208, Q7.35, and Y7.42. β-alanine piperazine amide derivatives with modifications at the polycyclic moiety (compounds 111–120) scored good scores >6.5. For example, compound 111 and 112 had Surflex scores of 7.43 and 7.32, respectively, and compound 118 scored the overall best value of 8.55. Each molecule formed at least one H-bond with protein, with Y1.39, T2.64, T5.43, and Q6.55 forming H-bond more than once. Four compounds 121–124, which are fluorene derivatives having modifications at the alkyl moiety, scored slightly lesser than the previous case, with scores of 5.04, 6.68, 7.04, and 6.41, respectively. Of these four compounds, three formed H-bonds with residues T5.43 and Q6.55. Fluorene derivatives with modified arylpiperazine moieties, 125–142, even though had an average dock score around 6, formed H-bond less frequently. Compounds 127, 130, 141, and 142 formed H-bond with Y1.39, whereas 128, 135, 139, and 140 formed H-bond with T2.64. Other highly active molecules 143 and 144 scored 6.09 and 6.77, respectively, and both formed a H-bond interaction with Y1.39. In addition to identifying the residues involved in H-bond interactions, we also recognized the residues steadily taking part in hydrophobic interactions with SSTR1 antagonists. It becomes imperative to remark that the residues which we have proposed to be forming the SSTR1 binding site could certainly play a key role in the formation of an SSTR1–ligand complex. This result corresponds with the work by Kaupmann et al.,26 who studied the importance of residues Q6.55 and S7.34 in determining the biological activity of an SSTR1 ligand. The mentioned residues form a vital part in the binding site that we have proposed in this study. Figure 2 represents the binding mode of all 144 compounds that we have docked, and it can be perceived that the compounds share the same binding area.
Figure 2.
SSTR1 antagonists share the same binding space, inside the proposed binding site. Figure is generated using the PYMOL program (http://www.pymol.org).
Protein–Protein Docking
Homology models developed for both the receptor (SSTR1) and the ligand peptides (cortistatin-14 and SRIF-28) were used to carry out protein–protein docking by the ClusPro server. A total of 15 and 16 clusters of protein–protein complexes were developed by the server for SRIF-28 and cortistatin-14, respectively. Each cluster was given a rank based on its lowest weighted energy score. In the case of SSTR1–cortistatin-14, the top cluster consisted of 155 members with a lowest energy score of −975.0, whereas the top cluster of the SSTR1–SRIF-28 complex had 276 members with a lowest energy score of −977.6. We observed that SRIF-28 formed a more stable protein–protein complex since it formed 25 hydrogen bonds in contrast to the 8 bonds formed by cortistatin-14. Both SRIF-28 and cortistatin-14 formed H-bonds with residues S7.34 and Y7.42, which are part of the predicted binding site. Other than stated residues, S1.31, L2.65, D3.32, S202, D203, T205, E298, D300, and A7.31 were also involved in H-bond interactions. All of these residues are either part of the proposed binding site or exist in the vicinity. Figure 3 shows the docking posture of the peptides with the receptor, disclosing that the peptides reside inside the proposed binding site same as the antagonists. Based on this observation, we can deduce that the antagonist can consume the binding spot, thereby intercepting the agonist from binding. Results of the protein–protein docking are represented in Table S4.
Figure 3.
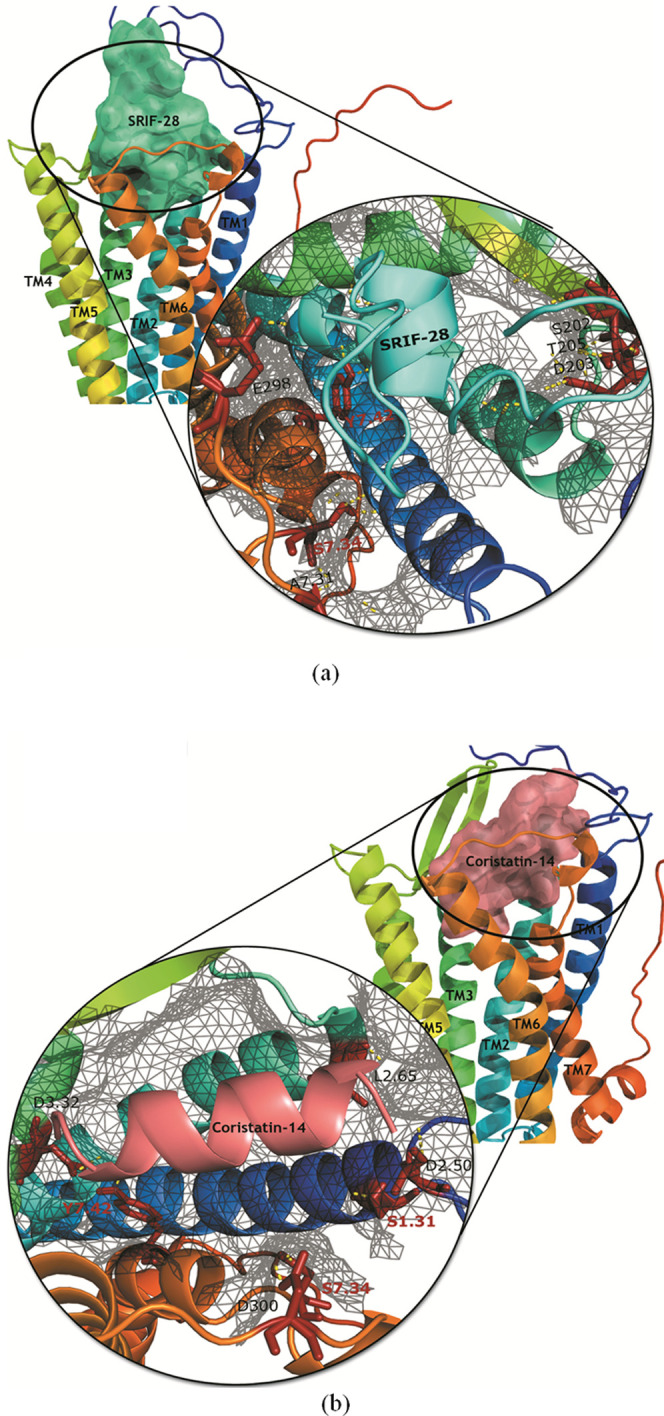
(a) SSTR1–SRIF-28 complex and (b) SSTR1–cortistatin-14 complex. Figures are generated using the PYMOL program (http://www.pymol.org).
3D-QSAR Study Based on Comparative Molecular Field Analysis (CoMFA) and Comparative Molecular Similarity Index Analysis (CoMSIA)
Based on the selected common scaffold, we aligned the data set using the atom-by-atom match method (Figure 4). Of 144 compounds used, 20 were identified to be outliers based on their residual pKd value (actual pKd—predicted pKd). These outliers were removed from the data set, and the remaining 124 compounds were used for developing CoMFA and CoMSIA models.
Figure 4.
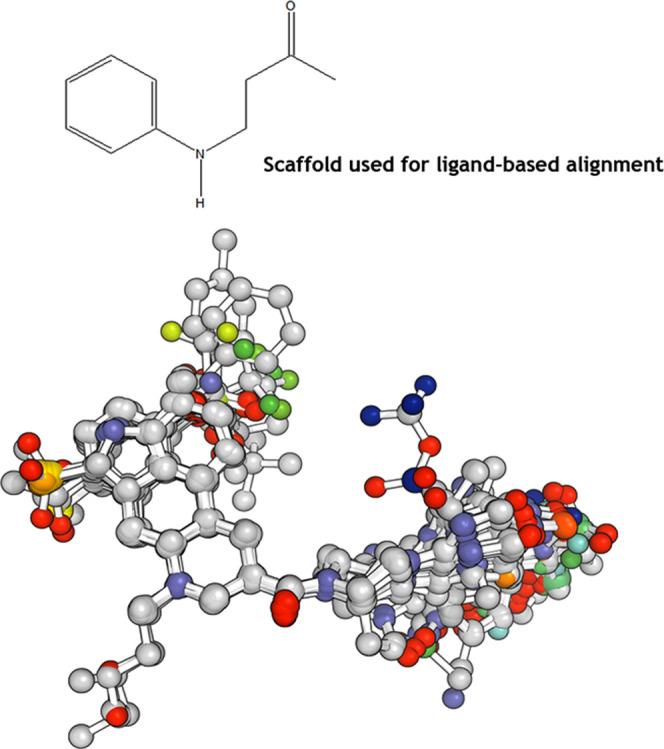
Ligand-based alignment of the antagonists.
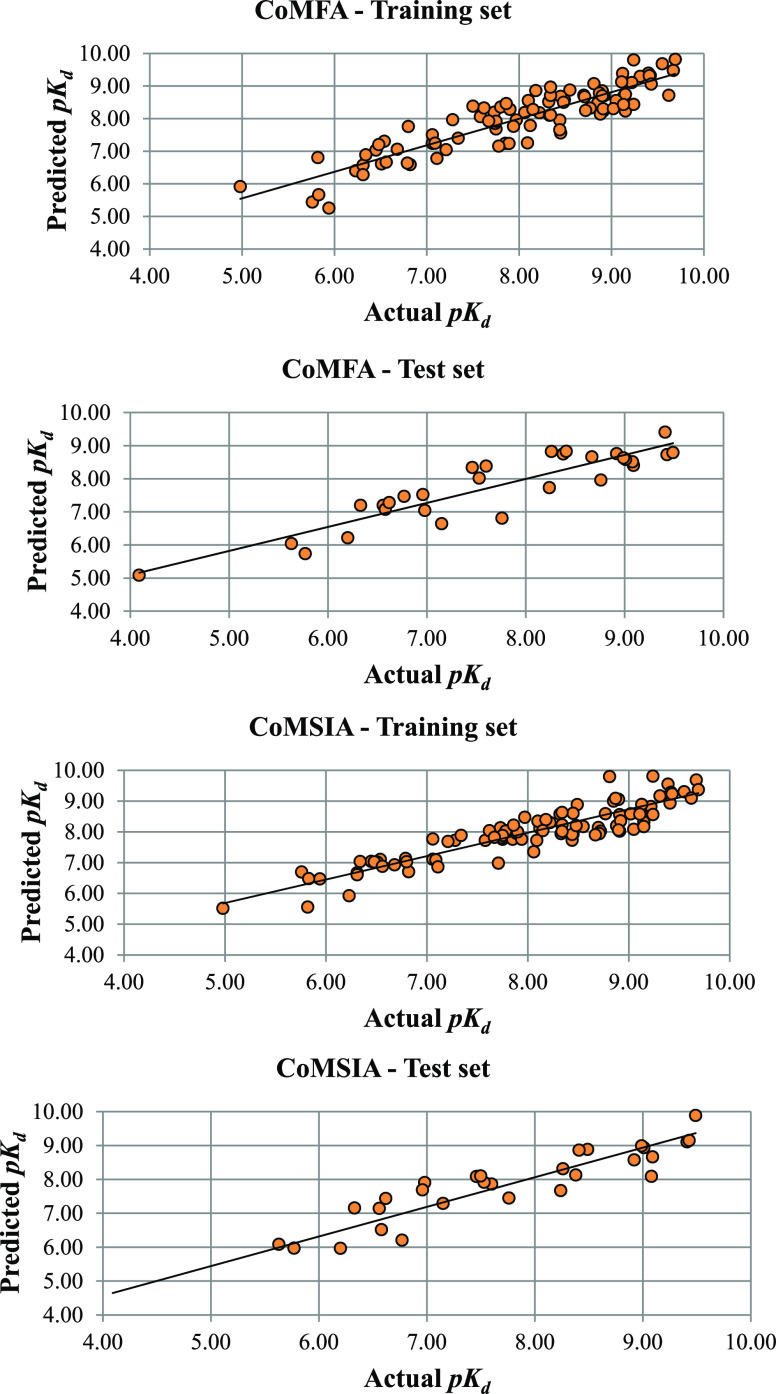
To identify reliable models with good q2 and rpred2 scores, we divided the data set into a variety of training and test set combinations (4:1), and five models with good prediction scores (q2 > 0.500 and rpred2 > 0.600) were chosen for further study (Table 1). Model 1, which has compounds 1, 4, 6, 16, 33, 38, 39, 40, 45, 46, 48, 53, 59, 61, 68, 76, 77, 83, 87, 91, 93, 95, 100, 101, 102, 108, 110, 113, 137, and 144 in the test set, has a q2 value of 0.520 and an rpred2 value of 0.640. Other models with similar good values have compounds 131, 132, 134, and 135 in the test set. Like the CoMFA model generation, we have developed CoMSIA models with various combinations of training and test sets. Table 2 represents the CoMSIA selected with good prediction scores. Test set compounds that were part of the best CoMFA model generation were consistent in CoMSIA model generation too. Model 4 has q2 and rpred2 scores of 0.550 and 0.543, respectively. Residual pKd values (actual pKd – predicted pKd) of the compounds based on CoMFA and CoMSIA analyses are tabulated in Table S5, and corresponding scatter plots are represented in Figure 5.
Table 1. Statistics of Ligand-Based CoMFA.
| leave-one-out
cross-validation |
non-cross-validation |
field
contribution |
||||||
|---|---|---|---|---|---|---|---|---|
| model | q2 | n | r2 | SEE | F-value | rpred2 | steric | electrostatic |
| 1 | 0.520 | 5 | 0.833 | 0.468 | 86.863 | 0.640 | 0.470 | 0.530 |
| 2 | 0.523 | 5 | 0.836 | 0.464 | 88.979 | 0.632 | 0.472 | 0.528 |
| 3 | 0.517 | 5 | 0.832 | 0.469 | 86.325 | 0.637 | 0.470 | 0.530 |
| 4 | 0.543 | 5 | 0.841 | 0.456 | 92.179 | 0.621 | 0.462 | 0.538 |
| 5 | 0.531 | 5 | 0.835 | 0.463 | 87.792 | 0.617 | 0.467 | 0.533 |
| Test set compounds | ||||||||
| Model 1: 1, 4, 6, 16, 33, 38, 39, 40, 45, 46, 48, 53, 59, 61, 68, 76, 77, 83, 87, 91, 93, 95, 100, 101, 102, 108, 110, 113, 137, 144 | ||||||||
| Model 2: 1, 4, 6, 16, 33, 38, 39, 40, 45, 46, 48, 53, 59, 61, 68, 76, 77, 83, 87, 91, 93, 95, 100, 101, 102, 108, 110, 113, 135, 144 | ||||||||
| Model 3: 1, 4, 6, 16, 33, 38, 39, 40, 45, 46, 48, 53, 59, 61, 68, 76, 77, 83, 87, 91, 93, 95, 100, 101, 102, 108, 110, 113, 134, 144 | ||||||||
| Model 4: 1, 4, 6, 16, 33, 38, 39, 40, 45, 46, 48, 53, 59, 61, 68, 76, 77, 83, 87, 91, 93, 95, 100, 101, 102, 108, 110, 113, 132, 144 | ||||||||
| Model 5: 1, 4, 6, 16, 33, 38, 39, 40, 45, 46, 48, 53, 59, 61, 68, 76, 77, 83, 87, 91, 93, 95, 100, 101, 102, 108, 110, 113, 131, 144 | ||||||||
Table 2. Statistics of Ligand-Based CoMSIA.
| LOO
cross-validation |
non-cross-validation |
field
contribution |
|||||||||
|---|---|---|---|---|---|---|---|---|---|---|---|
| model | q2 | n | r2 | SEE | F-value | rpred2 | steric | electrostatic | acceptor | donor | hydrophobic |
| 1 | 0.550 | 6 | 0.847 | 0.443 | 79.153 | 0.531 | 0.172 | 0.209 | 0.169 | 0.210 | 0.240 |
| 2 | 0.542 | 6 | 0.844 | 0.447 | 77.795 | 0.547 | 0.174 | 0.207 | 0.170 | 0.207 | 0.242 |
| 3 | 0.546 | 6 | 0.847 | 0.443 | 79.061 | 0.538 | 0.172 | 0.208 | 0.169 | 0.207 | 0.242 |
| 4 | 0.550 | 6 | 0.851 | 0.437 | 81.885 | 0.543 | 0.173 | 0.207 | 0.169 | 0.209 | 0.242 |
| 5 | 0.552 | 6 | 0.852 | 0.433 | 82.604 | 0.530 | 0.174 | 0.208 | 0.170 | 0.205 | 0.243 |
| Test set compounds | |||||||||||
| Model 1: 1, 4, 6, 16, 33, 38, 39, 40, 45, 46, 48, 53, 59, 61, 68, 76, 77, 83, 87, 91, 93, 95, 100, 101, 102, 108, 110, 113, 137, 144 | |||||||||||
| Model 2: 1, 4, 6, 16, 33, 38, 39, 40, 45, 46, 48, 53, 59, 61, 68, 76, 77, 83, 87, 91, 93, 95, 100, 101, 102, 108, 110, 113, 135, 144 | |||||||||||
| Model 3: 1, 4, 6, 16, 33, 38, 39, 40, 45, 46, 48, 53, 59, 61, 68, 76, 77, 83, 87, 91, 93, 95, 100, 101, 102, 108, 110, 113, 134, 144 | |||||||||||
| Model 4: 1, 4, 6, 16, 33, 38, 39, 40, 45, 46, 48, 53, 59, 61, 68, 76, 77, 83, 87, 91, 93, 95, 100, 101, 102, 108, 110, 113, 132, 144 | |||||||||||
| Model 5: 1, 4, 6, 16, 33, 38, 39, 40, 45, 46, 48, 53, 59, 61, 68, 76, 77, 83, 87, 91, 93, 95, 100, 101, 102, 108, 110, 113, 131, 144 | |||||||||||
Figure 5.
Plots of actual pKd vs predicted pKd values of the compounds generated based on CoMFA and CoMSIA.
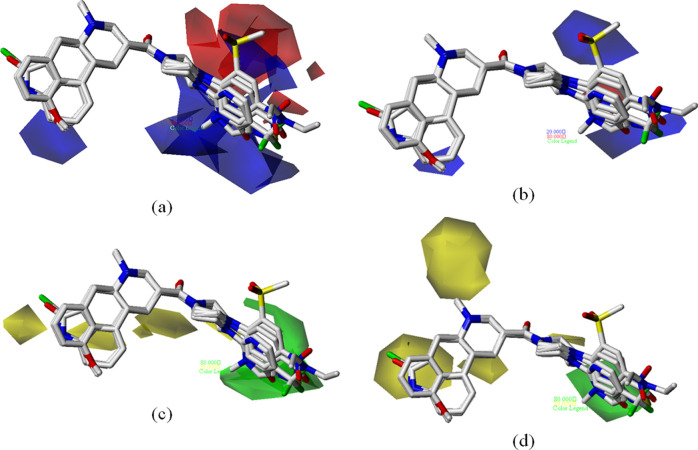
Contour maps based on the various physicochemical descriptors responsible for the biological activity of the compounds were generated using CoMFA and CoMSIA models. Approved and disapproved levels were set, respectively, at 80 and 20%. On studying electrostatic contours generated from both CoMFA and CoMSIA models, we identified that a large red contour is present adjacent to the R substitution position (Figure 6). A red contour corresponds to the zone where an electronegative group increases the biological activity of compounds. Most of the compounds that have an electronegative group at this position showed high–medium activity compared to others.
Figure 6.
(a, b) Represent the electrostatic contour maps and (c, d) represent the steric contour maps generated using CoMFA and CoMSIA models, respectively, along with the test compounds. In electrostatic contours, the region where electropositive groups increase activity are represented in blue, whereas the regions where electronegative groups increase activity are represented in red. In steric contours, the regions where bulky groups increase and decrease activity are represented in green and yellow, respectively.
For example, the presence of an electronegative F atom at this position in compounds 42 and 43 has greatly increased their activity than compounds 35, 36, 37, 38, 39, 40, and 41, which do not have an electronegative atom. Especially, compound 39 with an electropositive Na at this position has shown the least activity of all compounds. Other highly active compounds like 92, 93, 105, 129, 130, 131, and 134 also have fluorine at this position. In electrostatic contour maps (Figure 6), blue regions are the points where an electropositive substitution would increase the ligand activity or in other words the presence of electronegative atoms would decrease the activity. This is the case with compounds 6, 33, 35, 40, 41, 51, 52, 53, 54, 83, 89, 90, 91, 117, 119, 133, and 136. Based on the SAR analysis by Hurth et al.,28 the introduction of a 4-cyano substituent (compound 5) instead of 4-pyridyl (compound 2) results in a gain in SSTR1 affinity, which supports the presence of red contour in the vicinity of the 4′-position of the pyridine ring. Troxler et al.29 studied the SAR of nonpeptide obeline somatostatin SSTR1 antagonists at positions 6 and 9 of the octahydrobenzo[g]quinoline ring system. They have reported that replacing 6′-OMe with H in compounds 57, 65, and 66 results in a loss of activity. Blue contours in the region could explain the fact that replacing a highly electronegative atom with a H atom could have caused the loss in activity. Similarly, the presence of red contour near the 9′ position of the ring system could explain the reason for the reduced affinity of compounds 72 and 73 due to halogenation of that position.
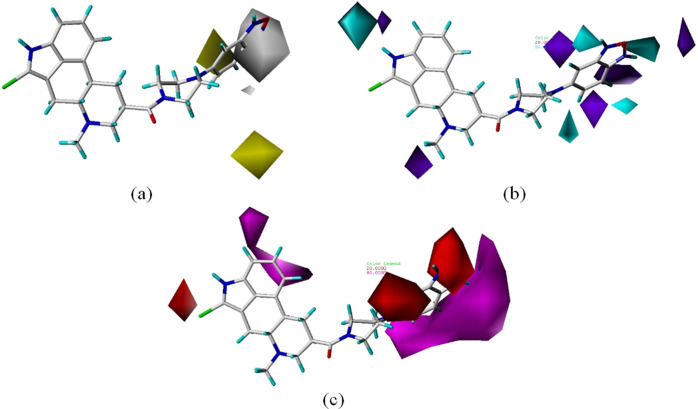
In the steric contours that are represented in Figure 6c,d, we have identified the zones where bulky group substitution can increase/decrease the activity of the ligand. The presence of bulky group substitutions in compounds like 6, 8, and 13 could be responsible for their low activity. In the case of compounds 47–55, Hurth et al.28 replaced the piperazine ring with homopiperazine, tetrahydropyridine ring, and some other moieties, but it resulted in a significant loss of activity. The presence of a yellow contour near the region indicates the fact that the bulky atom substituent at this position is not favorable for the activity. Another example can be the case of compounds with ergoline derivatives (86–92); compounds with bulkier groups in the unfavorable region (86–90) show considerably less activity than the compounds with less bulky substitution (91–92). Compounds that have a bulky substitution in favorable regions like 56, 58, 59, 63, 64, 67, 68, 69, 70, 71, 75, and 76 show better activity. For example, compounds 63, 69, and 71 have sulfonic acid esters of the phenol moiety at this position. Troxler et al.29 reported that these compounds are the most active derivatives of the series and have substantially increase SSTR1 affinity with no compromise of SSTR1 selectivity over SSTR2. Among the compounds with fluorene substitutions (121–124), 121 is more active than others as it has a less bulky atom in the unfavorable region. In Figure 7a, hydrophobic contours are represented where white and yellow contours denote favorable and unfavorable regions for hydrophobic atoms, respectively. The presence of sulfur, a hydrophobic atom, in the favorable region in compounds like 20, 21, 22, 46, 69, 70, 71, 74, 75, 76, 108, 109, and 110 could be the reason for their higher activity than that of compounds 40, 41, 72, 73, and 77, which have sulfur in the unfavorable region. Similarly, the presence of chlorine near white contours in compounds like 98, 99, and 100 could strengthen the reason for their high activity. Meanwhile, it is noteworthy that the presence of cyanide in these regions (compounds 12 and 28) greatly reduces their activity.
Figure 7.
(a) Represents the hydrophobic contour map and (b, c) represent the hydrogen bond donor and acceptor contour maps generated using CoMFA and CoMSIA models, respectively. In hydrophobic contours, the region where hydrophobic atoms are favorable and unfavorable for activity are represented in white and yellow, respectively. In H-bond donor contours, the areas where the H-bond donor group increases and decreases the activity are represented in cyan and blue, respectively. In H-bond acceptor contours, the areas where the H-bond acceptor group increases and decreases the activity are represented in purple and red, respectively.
Hurth et al.28 reported that going for a 2-pyridone substituent instead of 2-pyridine, with a N-methyl substitution, resulted in increased activity and more than 6000-fold selectivity for SSTR1 over SSTR2. The presence of a white contour near this substitution position supports the result reported by Hurth et al.28 Compound 9 with an NH instead of N-methyl at this position has comparatively lesser activity and SSTR1 selectivity than compound 10. Hurth et al. also reported that the presence of more wettable atoms like hydroxy, carbonyl, carboxyl, sulfonyl, and sulfonamide at 4′ in compounds 34–41 respectively is less favorable for their activity. We observed the presence of white contour in the region, which could explain the reason for the low activity of compounds. Figure 7b,c depicts the hydrogen bond donor and acceptor contour maps, respectively, where the presence of hydrogen bond donors/acceptors increasing or decreasing the activity of the ligand are represented. For example, the presence of fluorine atom in the unfavorable region in compound 6 could be the reason for its lower activity than that of its derivative counterparts. The same could be the reason for the low activity of octahydrobenzo[g]quinoline derivatives (47–55), which have hydrogen donor atoms in the region not favoring activity. Troxler et al.30 reported that the nature of the substituent at position 2 of the arylpiperazine moiety did not affect the affinity of compounds toward SSTR1. On observing the contour maps generated, we did not observe a single contour in the vicinity of the said position. This fact is confirmed in other studies related to obeline derivatives reported by the same group.28,29
Density Functional Theory
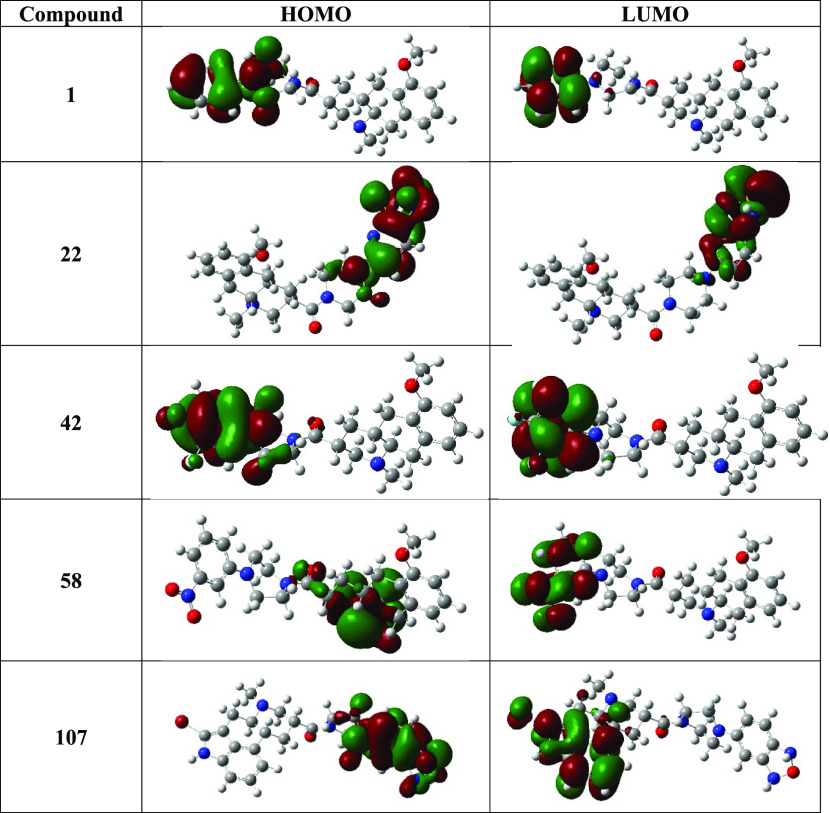
Ten different descriptors based on the molecular orbital theory were calculated for all 144 compounds after optimization using the B3LYP function. Energies of HOMO (EHOMO) and LUMO (ELUMO) were calculated, which respectively stand for the electron-giving and -receiving capacity of a molecule. Based on Fukui’s molecular orbital theory,31 molecular reactivity of the molecules based on their frontier orbitals were calculated. EHOMO and ELUMO of selected compounds are represented in Table 3, and the respective electron density maps of their molecular orbitals are represented in Figure 8. Energy gaps (ΔE) between HOMO and LUMO of the molecules were calculated by calculating the difference in energies between the two orbitals: ΔE = ELUMO – EHOMO. Figure S3 represents the energy gap distribution of molecules. It is important to note that the energy gap is inversely proportional to molecular reactivity.32 Compounds 58–77 and 111–122 have shown lesser energy gap than the average. Here, most of the compounds like 58, 59, 63, 67, 68, 69, 70, 71, 75, 76, 115, 116, and 121 are highly active. We have calculated the molecular dipole moment of all compounds, which is directly proportional to the chemical reactivity of the compound.33 Hurth et al.28 reported that a simple change in the position of a N atom between compounds 16 and 17 resulted in a difference in SSTR1 affinity by at least 2 orders of magnitude. 16 and 17 scored vastly different values in terms of molecular dipole moment; however, other energy values like total energy and molecular orbital energies were similar. This phenomenon shown by these two compounds depicts the importance of the molecular dipole moment of a molecule even though the compounds show similar energy levels. Table 3 represents the energy values of molecular orbitals, energy gap values, and molecular dipole moments of selected molecules (for corresponding values of other molecules, check Table S6).
Table 3. DFT Statistics of the Selected Molecules (Statistics of Other Molecules Are Tabulated in Table S6).
| compound | total energy (eV) | molecular dipole moment (Debye) | EHOMO (eV) | ELUMO (eV) | HOMO/LUMO gap (ΔE) |
|---|---|---|---|---|---|
| 1 | –36501.08 | 4.28 | –5.42 | –0.34 | 5.08 |
| 22 | –50314.84 | 1.62 | –5.01 | –0.80 | 4.21 |
| 42 | –41464.72 | 2.75 | –5.39 | –0.22 | 5.17 |
| 58 | –41617.18 | 4.80 | –5.52 | –2.74 | 2.78 |
| 107 | –110444.75 | 5.32 | –5.17 | –0.36 | 4.81 |
| compound | absolute hardness (η) | global softness (σ) | electronegativity (χ) | chemical potential (μ) | electrophilicity index (ω) |
|---|---|---|---|---|---|
| 1 | 2.54 | 0.20 | –2.88 | 2.88 | 1.64 |
| 22 | 2.11 | 0.24 | –2.90 | 2.90 | 2.00 |
| 42 | 2.59 | 0.19 | –2.80 | 2.80 | 1.52 |
| 58 | 1.39 | 0.36 | –4.13 | 4.13 | 6.13 |
| 107 | 2.41 | 0.21 | –2.76 | 2.76 | 1.59 |
Figure 8.
Electron density maps of HOMO and LUMO of five selected molecules.
Using EHOMO and ELUMO, other DFT-based molecular descriptors like chemical potential (μ), electronegativity (χ), global softness (σ), absolute hardness (η), and electrophilicity index (ω) of the molecules were calculated. Electronegativity of a molecule influences the capability of a molecule to accept electrons. Chemical potential (μ) is the negative of electronegativity of a molecule, which describes the energy absorbed or released by a molecule during a chemical reaction. Both values greatly influence the inhibitive efficiency of a molecule.34,35 By analyzing the electronegativity values of the compounds and their electron density maps, we have observed that the presence of an electronegative atom at the R substitution position increases the activity of the compounds, which supports the results obtained through CoMFA and CoMSIA. For instance, molecules with high χ values like 43, 44, 46, 58, 59, 63, 67, 68, 70, and 71 are highly active than low active compounds like 52, 53, 54, 55, 85, 86, 87, 88, 89, 90, and 91, which have comparatively lesser χ values. Troxler at al.30 reported that removal or replacing of the N-methyl substituent of the 2-bromo-ergoline core, in compounds 87–91, with longer alkyl groups resulted in a significant loss of SSTR1 activity. Based on the SAR analysis of substituted phenylpiperazines by Hurth et al.,28 the presence of an electronegative atom like 2′F or 2′cyano is not favorable for activity, whereas the introduction of a nitro atom at these positions greatly increases the SSTR1 affinity. χ analysis of molecules with these substituents supported this result. Molecule 31 with a 4′ NO2, one of the best compounds of the series, is the most electronegative molecule, followed by compounds 29 and 30, which have NO2 at 2′ and 3′, respectively. This result is supported by the electrostatic contour maps generated using CoMFA analysis, where the presence of a contour representing the region favoring electronegative atoms near the 4′-position of phenylpiperazine can be observed. Most of the low active molecules have high μ values, which denotes the fact that more energy would be required by these molecules to bind with the receptor.
Membrane-Protein Dynamics Simulation
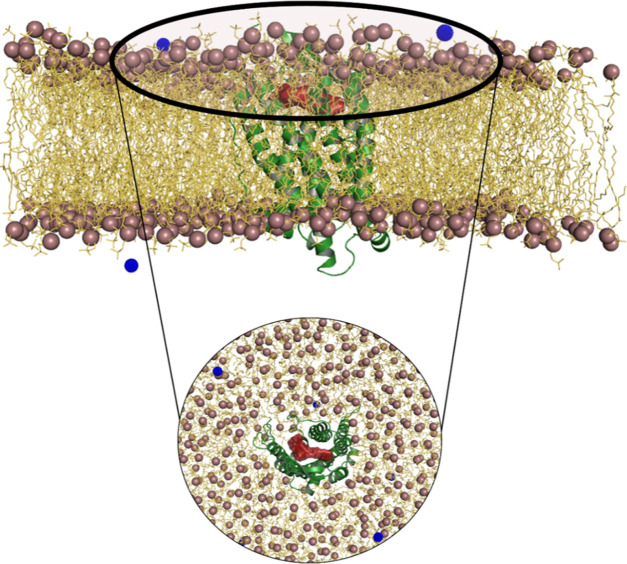
To mimic the actual biological environment, protein–ligand systems were embedded in lipid–lipid bilayer membranes using the Membrane builder tool and simulated for 100 ns using GROMACS. DPPC, one of the most studied phospholipids in studies related to membrane-protein dynamics, is extensively used in modeling membrane interactions using highly acceptable force field parameters. We have constructed a bilayer consisting of 200 DPPC molecules in top and bottom layers. Figure 9 represents one of the four lipid membrane-protein–ligand systems constructed to perform molecular dynamics simulation. The aim of the study is to identify the low-energy conformation of the ligands inside the protein binding site, which can be considered as the most stable and bioactive conformation of the ligand. Also, an MD-based structure–activity relationship study of the obeline and ergoline derivatives is carried out by correlating the results with 3D-QSAR and DFT results. Before analyzing the simulated membrane-protein system, it is important to examine the physical stability of the system during the simulation time. Structural stability of the system is studied by plotting RMSD of the protein backbone. The potential energy of the system over the simulation time is calculated to examine whether the systems are energetically stable. After a gradual decrease from the initial potential energy, the potential energies of the systems are equilibrated around −2.07 × 10+06, −2.80 × 10+06, −2.06 × 10+06, and −2.06 × 10+06 kJ mol–1, respectively, for systems with compounds 22, 42, 58, and 107.
Figure 9.
Lipid bilayer-SSTR1 protein–ligand complex constructed using Membrane Builder. SSTR1 is represented as a green cartoon. Compound 42 is represented as a red surface. Ions are represented as blue spheres. DPPC headgroups and tail groups are represented as violet spheres and yellow lines, respectively.
It is important to take a note on the experimentally estimated properties of the DPPC molecule to compare them with the results obtained from simulation analysis. After simulation of each system, parameters of the bilayer like area per lipid, mean-square displacement, deuterium order parameters, and density of different simulated components of the system are analyzed. The results are later compared with experimentally determined values, and different understanding for each system is given. Area per lipid (APL) is a crucial parameter of both biological and artificially constructed membrane bilayers. Correctly predicting the APL of a membrane is important to verify the accurate two-dimensional (2D) density in the bilayer plane, which in turn results in correct prediction of other properties like electron density profiles, thickness of the bilayer, and lipid tail order parameters. APL of a bilayer can be calculated by dividing the area of the simulation box by the number of lipids present in each leaflet. APL throughout the simulated trajectory is calculated, and averaged APL provides the approximate APL of the system over the simulation time. According to various literature reports, experimentally determined APL of a DPPC molecule is between 0.629 and 0.643 nm2 at 323 K.36−39 Similarly, the experimentally calculated volume per DPPC lipid is 1.229 nm3 at 323 K.40 GridMAT-MD,41 a grid-based membrane analysis tool, is used to analyze the bilayer thickness of the systems constructed. It is an algorithm that reads the GROMACS trajectory file and calculates the average thickness of the bilayer over the simulated time. After calculating APL of the headgroup, APL values in the top and bottom layers of the systems with compounds 22, 42, 58, and 107 are calculated to be 63.68, 63.68, 65.95, and 64.80 Å2, respectively. The experimentally determined bilayer thickness of a DPPC bilayer is between 3.78 and 3.86 nm at 323 K.36,38−40 The bilayer thickness of various simulation components like lipid headgroup, N atoms, P atoms, C atoms, ions, and water can be determined using the distribution of electron density profiles of the component. We calculated the density of each component using gmx density. In Figure S4, density plots of membrane components of each system are represented. It is important to note that the density values of the headgroups of both top and bottom layers are near the experimentally determined values. Also, similar trends are seen in the case of each component in all plots. In molecular dynamics related to lipid molecules, deuterium order parameters of the lipid acyl chains are crucial to validate simulations. As lipids in a bilayer are constantly in motion, different movements occur at a different time scale like lipid flip-flop, lateral diffusion, rotation around the axis, wobbling, and some undulatory movements.
We have plotted the deuterium order parameters for each system and are represented in Figure S5. In the plot, order parameters of the lipid acyl chain (Scd) are plotted against renumbered atoms. After examining the trend of Scd, we have inferred that the membrane has entered the gel phase during the simulation. Similarly, analysis of the mean-square displacement (msd) of the lipids is essential to calculate their lateral diffusion. Naturally, lipids are always in a state of diffusion along a plane rather than in all three spatial dimensions. For instance, if the lateral diffusion coefficient of a lipid molecule is 10–7 cm2/s, then the lipid will travel ∼1 nm in a 25 ns simulation on an average. For calculating msd, the phosphorus atom present in the headgroup is chosen as a reference point. After estimation, the msd values of systems with compounds 22, 42, 58, and 107 were 0.0106 × 10⁻⁵, 0.00943 × 10⁻⁵, 0.0106 × 10⁻⁵, and 0.009615 × 10⁻⁵ cm–2/s, respectively.
MD Trajectory Analysis
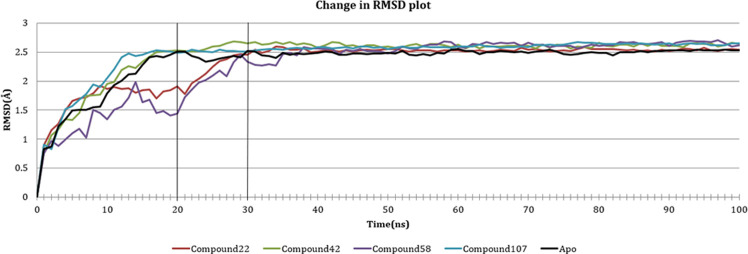
Protein–ligand complexes with four compounds, 22, 42, 58, and 107, were selected to study the change in conformation of the receptor over a period of 100 ns. Trajectories of the simulations were scrutinized to comprehend protein dynamics over time and the ligand position inside the binding site. The protein dynamics was analyzed by charting the variations in RMSD and the variations in the root-mean-square fluctuation (RMSF) of protein backbone residues. In the case of compound 22, we observed a wobbling protein structure in first 20 ns, i.e., the RMSD changing in the range of 0–0.2 nm. Then, from 20 ns onward until 30 ns, there was an upward spike in RMSD (from 0.2 to 0.25 nm), which gradually became stable after 30 ns. Similar was the case with compound 42, which showed an upward trend until 20 ns and gradually became stable after 30 ns. Compound 58 had an increased RMSD from 0 to 0.2 nm until 14 ns, which further dipped to 0.15 nm at 20 ns. Then, there was an upward trend till the 35 ns, after which the protein became stable around approximately 0.25 nm. Compound 107 showed little variation in RMSD compared to other compounds, 0–0.25 nm in the first 20 ns, which gradually became stable afterward. We compared the changes in RMSD of the above-mentioned complexes with that of the apoprotein, to study their effect on the change in conformation of the protein. Compound 42 and 107 showed a similar trend as that of the apoprotein, whereas 22 and 58, though showing a different trend in the beginning, became comparable to apoprotein as time progressed. Figure 10 represents the plot of change in RMSD of complexes where the change in RMSD of apoprotein is shown in black for a better understanding.
Figure 10.
Change in RMSD of the backbone Cα atoms of the complexes over 100 ns.
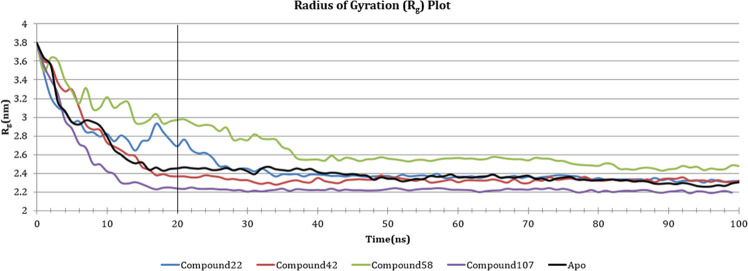
In addition to this, the change in the radius of gyration (Rg) of the protein was also plotted, to measure the distance of backbone Cα atoms of the protein from their axis of rotation. The change in Rg is similar to the change in RMSD since compounds 42 and 107 again displayed comparable plots to apoprotein. These compounds showed a fall in Rg value (0.38–0.24 nm) for the first 20 ns, which became stable after that (0.22–0.24 nm). Compound 22 showed an initial fall of Rg from 0.38 to 0.28 nm in the first 10 ns, which was followed by a quiver in Rg till 20 ns. The complex later became stable (0.24–0.22 nm), following a fall in the Rg, 30 ns onward. Compound 58 was comparably less stable than other compounds, as it was erratic in first 40 ns and became stable around 0.26–0.24 nm afterward. The change in Rg of the complexes against time is represented in Figure 11.
Figure 11.
Change in Rg of the backbone Cα atoms of the complexes over a period of 100 ns.
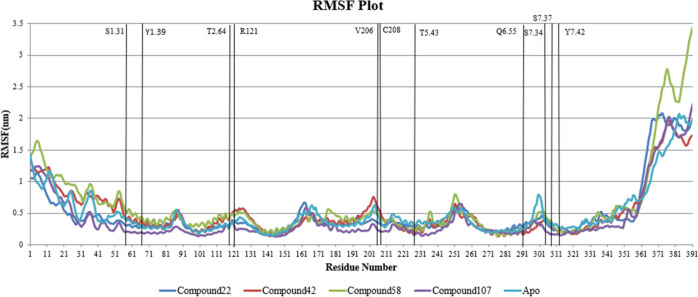
The change in RMSF of amino acid residues of the protein was plotted over simulation time. The average RMSF (RMSFavg) value of all residues for each complex was calculated, and residues were stated as stable or fluctuating based on their RMSF values in comparison with the RMSFavg value. If values were 2 times more than RMSFavg, they were regarded as fluctuating, and if the values were less than half the average value, they were considered as stable residues. Based on this, we identified that N-terminal residues M1 to S12 and C-terminal residues S364 to L391 fluctuated a lot than average RMSF throughout the simulation. As the fluctuations of N- and C-terminal residues are common in any protein simulation, we looked for other residues that fluctuated or stayed stable over the simulation time. We compared the residues that were stable/fluctuating with RMSF values of residues from apo simulation and identified residues that were behaving differently. Residues that were fluctuating more than average in apoprotein simulation like N2.45, A2.49, F3.37, T3.38, S3.39, I3.40, Y3.41, C3.42, T3.44, and G5.461 were identified to be stable in the protein–ligand complex simulation. In all protein–ligand complex systems, some residues like V1.53, Y2.42, I2.43, L2.44, L2.46, A2.47, I2.48, D2.50, E2.51, D3.32, A3.33, V3.34, N3.35, M3.36, Y3.41, C3.42, L3.43, V3.45, L3.46, S3.47, V3.48, Y5.42, T5.43, F5.44, L5.45, F5.47, I6.33,..., F6.60, and I7.39,..., L7.52 were stable over the simulation. Certain residues of the apo receptor in terminal and loop regions were stable compared to the same residues in their holo counterparts. For instance, residues like G26, P30, A32, N44, T50, G54, S57, R197, A199, S202, D203, M210, L211, E214, Q299, and D300 were stable in apo simulation but fluctuated more in complexes. Liapakis et al. reported that the extracellular loop residues of SSTR1 from R197 to E214 are crucial for the binding of SSTR1 selective agonists.27 These residues were stable in the case of apo, 22 and 107 complexes but comparatively fluctuating in 42 and 58. The fact that compounds 22 and 107 are more active than the other two compounds can be correlated with these values.
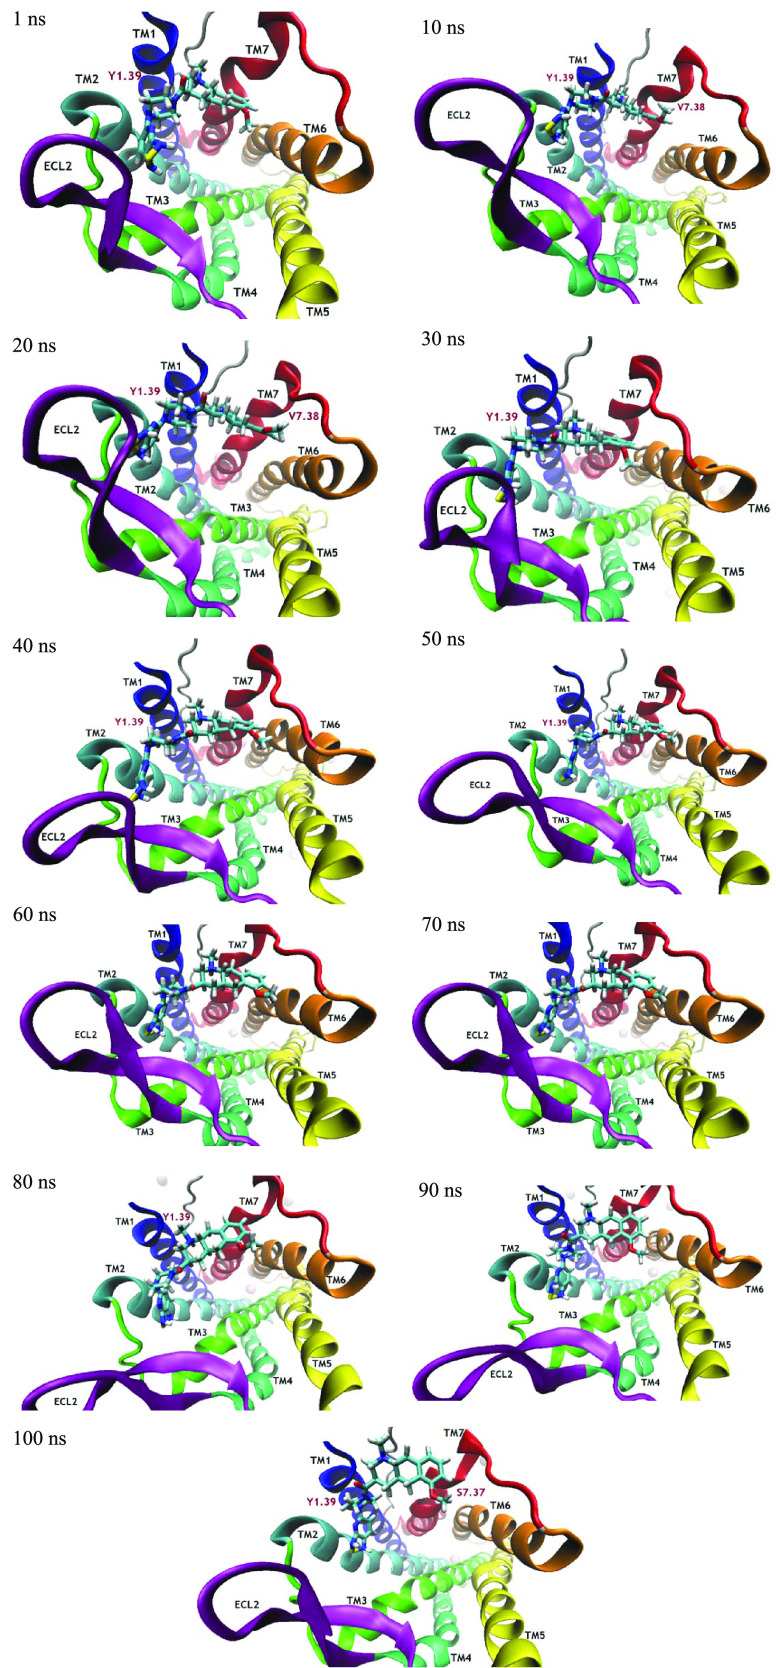
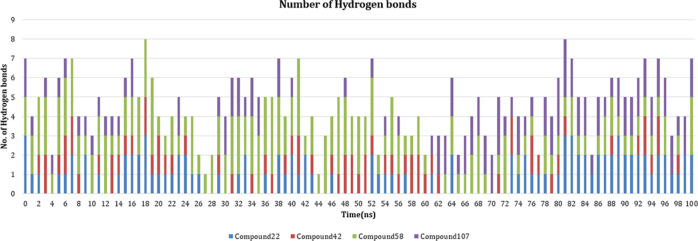
The flexibility of binding site residues was studied, and it was identified that average RMSFavg of binding site residues in the 107 complex was significantly less than other complexes. In the case of 42 and 58, RMSFavg values of the binding site residues were 0.3600 and 0.3719 nm, respectively, which are remarkably greater than RMSFavg values of highly active compounds 22 and 107 with values 0.2916 nm and 0.2070 nm, respectively. RMSFavg of apo binding site residues stayed in between the values, i.e., 0.3357 nm. Figure 12 represents the RMSF plot of simulated SSTR1 complexes. Figure 13 represents snapshots of the bioactive conformation of the compound inside the receptor binding site at different time stamps. Important SSTR1 residues reported by Liapakis et al.27 are represented as a purple sheet. It is important to note that the ligand consistently formed H-bonds with these residues, suggesting the importance of these residues for stability and bioactivity of compound 22. Similarly, the relation between these residues and other compounds (42, 58, and 107) is studied, and we have observed a similar H-bonding pattern. Figure 14 represents the number of H-bonds formed by simulated compounds over time. As hydrogen bonds formed between the protein and ligand are important for the stability of the ligand, we have plotted the number of H-bonds formed by the ligand over the course of simulation. 48 formed the least number of H-bonds on average when compared to other compounds. 48 formed ∼0.7 H-bonds on an average, whereas 22, 58, and 107 formed ∼1.03, 1.76, and 1.09 H-bonds, respectively.
Figure 12.
RMSF of SSTR1 residues over a period of 100 ns.
Figure 13.
Simulation time-based progression of ligand bioactive confirmation of compound 22 inside the protein binding site.
Figure 14.
Change in the number of H-bonds formed by compounds with the protein over 100 ns.
Discussion
This study is a part of an extensive study we have carried out on somatostatin receptors, including structural characterization of other SSTRs like SSTR25 and SSTR5.6 The aim of the study is to understand the underlying features responsible for the functioning of SSTR1 by characterizing the structural features responsible for their action. Also, we have studied the essential structural features required for the biological activity of SSTR1 ligands and look to possible improvements in their structure to increase the activity. We have performed a computational study using molecular modeling and 3D-QSAR-based molecular dynamics analysis. Initially, computational modeling of the 3D structure of SSTR1 is performed as there is no available structure in the PDB, and a reliable 3D model is selected after model validation. A total of 144 SSTR1 antagonists reported in the literature are selected to perform 3D-QSAR analysis to understand the structural characteristics responsible for their biological activity. Molecular docking of the selected compounds with the SSTR1 model is performed to rank molecules based on their binding energy. Also, we have characterized the probable binding site of SSTR1 using computational tools and molecular docking. Later, protein–protein docking of SSTR1 model with native peptide agonists of SSTR1 is carried out to validate the results of molecular docking. We have identified that residues S1.31, Y1.39, T2.64, R121, V206, C208, T5.43, Q6.55, S7.34, S7.37, and Y7.42 group together to form the binding site of SSTR1. Afterward, a 3D-QSAR study of SSTR1 antagonists using CoMFA and CoMSIA is performed to understand the reason for their biological activity. Based on the analysis, we have observed that an electronegative, less-bulkier, and hydrophobic atom substitution is preferable than an electropositive and hydrogen donor substitution. We have performed a DFT analysis to study electron density-based features of the molecules and to correlate the results with 3D-QSAR results. Results obtained through 3D-QSAR and DFT are correlated with the SAR studies on the obeline and ergoline derivatives in the literature28−30,42 and are found to be consistent with the results published. Molecular dynamics simulation of SSTR1 in a DPPC lipid–lipid membrane bilayer is carried out for 100 ns using GROMACS. Four different protein–ligand systems and an apoprotein system are simulated. Initially, analyses like change in RMSD, area per lipid, the density of the simulated components, acyl chain order parameters, and mean-square displacement of the membrane were performed to examine the stability of the membrane-protein systems. Then, MD trajectories of the simulated systems based on changes in RMSF of SSTR1 residues are analyzed. We have observed that the stability of ECL2 of SSTR1 is crucial for a stable SSTR1 binding. Based on the analysis, we can infer that SSTR1 ligands that form more H-bonds with the residues of the ECL2 loop will have high bioactivity. This inference supports the study by Liapakis et al.,27 which suggested the importance of these residues in SSTR1–ligand binding. Also, the behavior of the ligands inside the binding site corresponds well with the respective CoMFA result. Based on CoMFA, the presence of a hydrogen acceptor group at this position increases the activity of the ligand. Here, the consistent formation of H-bonds by the ligand with residues of TM1 and TM2 strengthens the fact that it is important for the ligand to have H-bond acceptor groups at this position for high bioactivity. Also, it is notable that the residues that form H-bonds frequently with ligands are part of the proposed SSTR1 binding site. A novel ligand with suggested functional groups at the favorable position based on the 3D-QSAR analysis and that could potentially form H-bonds with the residues of the ECL2 loop could significantly increase the biological activity of novel SSTR1 ligands. The results of this study could be helpful in the development of novel and more potent ligands that target SSTR1.
Materials and Methods
We have used software like MODELLER and Sybyl-X 2.1 installed in a Windows environment and Gaussian 16 A.03 and GROMACS (v. 2016.3) installed in a Linux environment to perform various molecular modeling calculations.
Homology Modeling and Model Validation
Homology modeling was performed since there are no available crystal structures of SSTR1 in the Protein Data Bank (PDB).43 Homology modeling could provide reliable three-dimensional models of protein structures when only sequence information of the protein is available.44 The amino acid sequence of human SSTR1 (accession number: P30872) was procured from the UniProt database.45 The sequence consisting of 391 amino acids was given as input in a BLAST (basic local alignment search tool) search46,47 against PDB, and templates acceptable for modeling the SSTR1 structure were identified. Various statistics of the templates such as E-value, query coverage, and sequence identity were identified, and eight templates scoring satisfactory values were tabulated (Table 4).
Table 4. Templates Selected for Modeling of SSTR1.
| template PDB ID_Chain | max score | total score | query coverage (%) | E-value | identity (%) |
|---|---|---|---|---|---|
| 5C1M_A | 239 | 239 | 74 | 2e-76 | 43 |
| 4RWA_A | 236 | 236 | 78 | 9e-74 | 45 |
| 4N6H_A | 235 | 235 | 71 | 2e-73 | 47 |
| 5DHG_A | 232 | 232 | 73 | 3e-72 | 44 |
| 4EA3_A | 232 | 232 | 73 | 4e-72 | 44 |
| 4DJH_A | 189 | 247 | 78 | 5e-55 | 42 |
| 4EJ4_A | 185 | 245 | 71 | 8e-54 | 48 |
| 4DKL_A | 183 | 245 | 75 | 4e-53 | 47 |
All selected templates belong to the GPCR superfamily and have query coverage between 71 and 78% of the SSTR1 sequence. Since it is crucial for the templates to have at least 30% identical sequence to the query for a reliable model prediction, it becomes important to mention that the sequence identity of the templates ranges between 40 and 48%.48Figure S6 represents the alignment of SSTR1 and template sequences (4RWA). Two different modeling platforms were used to perform homology modeling: EasyModeller49 and I-Tasser.50 EasyModeller 4.0 is an offline graphical user interface that operates MODELLER51 in the background. I-Tasser (iterative threading assembly refinement) is ranked as the best online server for protein structure prediction in the recent community-wide CASP experiments. I-Tasser runs based on a hierarchical algorithm called LOMETS (local meta-threading-server)52 to solve protein 3D conformations based on its amino acid sequence. Different model validation tools were used to select the best models developed using homology modeling.
Root-mean-square deviation (RMSD) of the selected structures in accordance with their respective templates was calculated. Initially, the developed structures were prepared using the structure preparation module in Sybyl-X 2.1.53 Using the Powell algorithm54 and the Tripos force field,55 energy minimization of the structures was performed for 1000 iterations to eliminate the poor contacts formed during the model generation. Energy-minimized structures were subjected to model validation by the Ramachandran (RC) plot,56 ERRAT plot,57 Verify3D,58 QMEAN,59 and ProSA.60 RC plots were plotted using the RAMPAGE server (http://mordred.bioc.cam.ac.uk/~rapper/rampage.php),61 and ERRAT plots57 were developed using the SAVES server (http://servicesn.mbi.ucla.edu/ERRAT/). To check for the compatibility of the models with their respective amino acid sequence, validation using Verify3D58 was followed. QMEANDisCO59 and ProSA60 scores were also calculated using respective servers to validate the quality of the developed models.
Data Set Selection
Hurth et al. have studied the SSTR1 antagonistic ability of nonpeptide ligands having octahydrobenzo[g]quinoline (obeline) and octahydro-indolo[4,3-fg]quinoline (ergoline) structural elements in their structures.28−30,42 We identified a common scaffold for the data set and drawn 144 compounds using the scaffold (Table S7). In Sybyl-X 2.1, the drawn compounds were minimized using a distance-dependent dielectric function in a Tripos force field.55 Powell’s gradient method54 was utilized to perform minimization, and the partial charges to the compounds were applied using the Gasteiger–Hückel (GH) method.62 To analyze the ligand binding mode with the receptor, molecular docking of the energy-minimized molecules with selected homology models was performed. SRIF-28,15 the native ligand peptide of SSTR1, and cortistatin-14,63 a neuropeptide that has a similar structure to SRIF-28, were selected to study protein–protein interactions with SSTR1. cortistatin-14 had a binding affinity (pKd) of 10.0 with SSTR1,63,64 whereas the binding affinity (pKi) of SRIF-28 ranged from 8.6 to 10.0.64−67 Since there are no 3D structures present for both peptides in PDB, we theoretically modeled their structure using homology modeling. PEP-FOLD3,68 a de novo peptide prediction server, was used in this regard.
Ligand Binding Site Prediction and Molecular Docking
We have used two different platforms to predict the probable binding site of SSTR1: COACH69 and SiteID Find Pocket. COACH is a meta-server, which produces complementary ligand-binding sites based on two comparative methods, TM-SITE and S–SITE, which recognize from ligand-binding templates available in the BioLiP protein function database.69,70 Based on the weekly Continuous Automated Model EvaluatiOn (CAMEO) experiments,71 the COACH algorithm was considered to be the best online server for ligand binding site prediction. SiteID Find Pocket is a binding site prediction module available in Sybyl-X 2.1, which uses a flood-fill solvation technique for prediction. Using both tools, a group of residues that could probably construct the binding site was propounded and evaluated with the binding sites of the templates for its validity. Molecular docking of the selected SSTR1 antagonist data set with selected SSTR1 homology models was carried out using the Surflex docking program72 present in Sybyl-X 2.1. The Surflex algorithm works based on a surface-based molecular similarity method, postulating various postures of ligand fragments. It is self-operating, flexible, and uses Hammerhead empirical scoring function for calculations.73 It creates a theoretical representation of the binding site known as protomol74 with which ligand molecules are docked. Threshold and bloat influence the protomol formation, which corresponds to the degree to which protein can be enfolded and the volume of protomol, respectively. In addition to the mentioned factors, the algorithm calculates various physical factors of a molecule in computing the ligand binding affinities.73 To validate the accuracy of the molecular docking algorithm used, we have performed redocking of the cocrystallized ligand with the template structure to ensure that the ligand resides inside the same binding pocket.
Protein–Protein Docking
ClusPro 2.0,75,76 a protein–protein docking server, was used to execute protein–protein docking of SRIF-28 and cortistatin-14 with SSTR1. ClusPro is the most extensively used server for performing protein–protein docking, which is ranked as the best protein–protein dock in the recent critical assessment of prediction of interactions (CAPRI).77 ClusPro runs using a fast Fourier transform (FFT) correlation algorithm called PIPER,78 which can generate dependable native-like conformations.79 After calculation, the resulting structures were grouped together and refined by means of pairwise RMSD being the distance measure.
3D-QSAR Study
3D-QSAR studies based on both ligand-based CoMFA and CoMSIA were followed.
Bioactive Conformer Determination and Partial Charge Calculations
Using Sybyl-X 2.1, we assigned Gasteiger–Hückel (GH) partial charges for the atoms of the compounds. The existence of rotatable bonds in the compound was recognized by incrementing the dihedral angle from 120° via a systematic search conformation method. We ascertained the minimal-energy conformer as the template, and based on the identified template, a common scaffold for aligning the data set was identified. For optimizing errors in the conformation of molecules, a 10 000 step energy minimization was performed, using the GH charging method in a Tripos force field. For performing minimization, a convergence factor of 0.05 kcal mol–1 was set. For alignment of compounds based on template conformation, the atom fit method available in Sybyl 2.1 was used.
Generation of CoMFA and CoMSIA Fields
At every intersection in an evenly spaced grid (2 Å), interactions due to steric and electrostatic clashes were calculated while keeping distance-dependent dielectric as constant. For calculating these interactions, we fixed an sp3 carbon atom and a single positive charge (+1) as the probe, respectively. The lattice energy points lesser than the set limit of 2.0 kcal mol–1 were skipped over to perk up the signal-to-noise ratio. A partial least-squares (PLS) regression analysis was performed by way of the full cross-validation method.80,81 To determine the number of components, a non-cross-validation PLS method was executed by means of the leave-one-out (LOO) method.82 We have used the formula given below to determine the cross-validated correlation coefficient (q2)
| 1 |
where γpred, γactual, and γmean symbolize the predicted, actual, and mean values of the target property (pKi), respectively. To calculate the standard error of estimate (SEE), the following formula was employed
| 2 |
where N represents the total number of molecules.
Density Functional Theory
Density functional theory (DFT) is a quantum mechanical calculation method derived from the Hohenberg–Kohn theorem.83 DFT can bestow dependable foundation in the molecular (or atomic)-level examination of a structure, based on its energetics.84 In studying the structure–activity relationship of biologically active molecules, DFT can be utilized to describe and scrutinize important chemical descriptors. In this study, we followed conceptual DFT, a subfield of DFT, which makes use of electron-density-related ideas in studying molecular chemical behavior.85 Ten diverse molecular descriptors were derived for all compounds, which include total energy, highest occupied molecular orbital (HOMO), lowest unoccupied molecular orbital (LUMO), band energy gap, molecular dipole moment, chemical potential, electronegativity, electrophilicity index, absolute hardness, and global softness. All 144 compounds taken for the study were optimized using the B3LYP function86−88 and 6-31G(d) basis set in Gaussian 16 A.03.89 Fukui’s molecular orbital theory was used to calculate the molecular reactivity based on their frontier orbitals (EHOMO and ELUMO).31
Membrane-Protein Dynamics
The lipid bilayer is the main gatekeeper for the transport of various substrates across the cell membrane, which is crucial for various biological events including cell-to-cell signaling. Molecular dynamics can simulate the behavior of all atoms involved in the membrane transport. Somatostatin is an important mediator of various biological function roles controlled by an SSTR-related signaling mechanism. Hence, we studied the dynamics of SSTR1 in the presence of lipids surrounded by water. We have selected high activity compounds 22, 42, 58, and 108 to study their time-dependent conformational changes using molecular dynamics. GROMACS molecular simulation software (v. 2016.3) was used to carry out the simulations. CHARMM-GUI,90 a web-based platform, was used to place the modeled receptor in a bilayer of lipid molecules. Using the platform, inputs required for running dynamics simulation in GROMACS were generated.91−93 To combine coordinates of protein and bilayer, it is important for them to have the same dimensions. Hence, the protein structure was initially oriented in a way such that the hydrophobic region of the protein is lined up with the nonpolar lipid tails. The hydrophobic region of the membrane proteins consists only of neutral residues; in other words, no charged residues are present. The Orientations of Proteins in Membranes (OPMs) database94 consists of spatial arrangements of various membrane proteins aligned to the hydrophobic core of lipid bilayers. The database consists of OPMs for all of the experimentally solved membrane proteins present in PDB. It can be freely accessible at https://opm.phar.umich.edu/. The coordinates of the membrane-oriented proteins can be downloaded from the database. In our case, as the starting structure of SSTR1 was a homologically predicted model, the orientation coordinates for SSTR1 were not present in the database. Hence, we downloaded the orientation coordinates of the template (4RWA) used for modeling the SSTR1 structure. The OPM file of 4RWA was downloaded from the database, and the SSTR1 homology model was aligned with the file. 4RWA is a synchrotron structure of the human δ-opioid receptor deposited by Fenalti et al.95 in PDB. The δ-opioid receptor is a GPCR having seven transmembrane helices and heavily expressed in regions of the human brain. It is important to note that SSTRs and opioid receptors are ∼40% identical to each other.
DPPC is one of the most studied phospholipids in studies related to membrane-protein dynamics and extensively used in modeling membrane interactions using highly acceptable force field parameters. While constructing the bilayer using Membrane Builder,96 200 DPPC molecules were packed on both top and bottom layers of the bilayer. Using Membrane Builder, a reasonably packed lipid bilayer was constructed around the protein. Water thickness at the top and bottom layers was maintained at 20.0 Å. After determining the system size, the components of the bilayer such as lipid bilayer, counterions, and bulk water were built using the replacement method. Finally, minimization, equilibration, and production MD of the system were carried out in six steps.93 Each step is crucial to gradually equilibrate the assembled system by changing different parameters that might affect the components like lipids, proteins, ions, and water. Restraint forces like planar restraints, repulsive planar restraints, and harmonic restraints were reduced gradually during each equilibration step. Simulations were carried out in an all-atom CHARMM36m force field. Equilibration steps were performed after minimizing the system energy using steepest descent convergence. There are six steps in a general membrane builder protocol: reading the protein input structure, orientation of protein, determining the system size, constructing the components of the bilayer, assembly of the components, and finally equilibrating the system. Once the user inputs a protein structure, the algorithm checks for any errors in the structure like missing residues or chains, the presence of unknown atoms, and other similar errors. After checking the structure, the algorithm proceeds to perform the orientation of the protein structure. However, in our case, as we have already performed protein orientation for the homology models, this step is skipped.
Acknowledgments
This study was supported by the Computational Biology Lab, funded by SERB Young Scientist grant (SB/YS/LS-128/2013). The authors also express gratitude to StemOnc R&D Private, Ltd., for the valuable revision of the manuscript. The authors thank the High-Performance Computing Center, SRM Institute of Science and Technology, for providing the computational facility.
Supporting Information Available
The Supporting Information is available free of charge at https://pubs.acs.org/doi/10.1021/acsomega.0c02847.
Model validation, molecular information, and various results related to docking, 3D-QSAR, and molecular dynamics (PDF)
Author Contributions
Corresponding author T.M. has designed the experiment. S.K.N. has contributed to data acquisition and analysis and interpretation of data. T.M. and S.B. have validated the results. S.K.N. has drafted the manuscript. S.B. and H.S. have contributed to the critical examination of the manuscript.
The authors declare no competing financial interest.
Supplementary Material
References
- Bermudez M.; Wolber G. Structure versus function—The impact of computational methods on the discovery of specific GPCR–ligands. Bioorg. Med. Chem. 2015, 23, 3907–3912. 10.1016/j.bmc.2015.03.026. [DOI] [PubMed] [Google Scholar]
- Hauser A. S.; Attwood M. M.; Rask-Andersen M.; Schiöth H. B.; Gloriam D. E. Trends in GPCR drug discovery: new agents, targets and indications. Nat. Rev. Drug Discovery 2017, 16, 829–842. 10.1038/nrd.2017.178. [DOI] [PMC free article] [PubMed] [Google Scholar]
- Wacker D.; Stevens R. C.; Roth B. L. How Ligands Illuminate GPCR Molecular Pharmacology. Cell 2017, 170, 414–427. 10.1016/j.cell.2017.07.009. [DOI] [PMC free article] [PubMed] [Google Scholar]
- Munk C.; Harpsøe K.; Hauser A. S.; Isberg V.; Gloriam D. E. Integrating structural and mutagenesis data to elucidate GPCR ligand binding. Curr. Opin. Pharmacol. 2016, 30, 51–58. 10.1016/j.coph.2016.07.003. [DOI] [PMC free article] [PubMed] [Google Scholar]
- Nagarajan S. K.; Babu S.; Sohn H.; Devaraju P.; Madhavan T. Towards a better understanding of the interaction between Somatostatin receptor 2 (SSTR2) and its ligands: a structural characterization study using molecular dynamics and conceptual Density Functional Theory (DFT). J. Biomol. Struct. Dyn. 2019, 37, 3081. 10.1080/07391102.2018.1508368. [DOI] [PubMed] [Google Scholar]
- Nagarajan S. K.; Babu S.; Madhavan T. Theoretical analysis of somatostatin receptor 5 with antagonists and agonists for the treatment of neuroendocrine tumors. Mol. Diversity 2017, 21, 367–384. 10.1007/s11030-016-9722-7. [DOI] [PubMed] [Google Scholar]
- Theodoropoulou M.; Stalla G. K. Somatostatin receptors: From signaling to clinical practice. Front. Neuroendocrinol. 2013, 34, 228–252. 10.1016/j.yfrne.2013.07.005. [DOI] [PubMed] [Google Scholar]
- Bell G. I.; Reisine T. Molecular biology of somatostatin receptors. Trends Neurosci. 1993, 16, 34–38. 10.1016/0166-2236(93)90050-V. [DOI] [PubMed] [Google Scholar]
- Tichomirowa M. A.; Daly A. F.; Beckers A. Treatment of pituitary tumors: somatostatin. Endocrine 2005, 28, 93–99. 10.1385/ENDO:28:1:093. [DOI] [PubMed] [Google Scholar]
- Hugues J.-N.; Epelbaum J.; Voirol M.; Sebaoun J.; Kordon C.; Enjalbert A. Involvement of endogenous somatostatin in the regulation of thyrotroph secretion during acute and chronic changes in diet. Neuroendocrinology 1986, 43, 435–439. 10.1159/000124560. [DOI] [PubMed] [Google Scholar]
- Iversen J. Inhibition of Pancreatic Glucagon Release by Somatostatin: In Vitro. Scand. J. Clin. Lab. Invest. 1974, 33, 125–129. 10.3109/00365517409082479. [DOI] [PubMed] [Google Scholar]
- Shimon I.; Taylor J.; Dong J.; Bitonte R.; Kim S.; Morgan B.; Coy D.; Culler M.; Melmed S. Somatostatin receptor subtype specificity in human fetal pituitary cultures. Differential role of SSTR2 and SSTR5 for growth hormone, thyroid-stimulating hormone, and prolactin regulation. J. Clin. Invest. 1997, 99, 789–798. 10.1172/JCI119225. [DOI] [PMC free article] [PubMed] [Google Scholar]
- Curry D.; Bennett L. Does somatostatin inhibition of insulin secretion involve two mechanisms of action?. Proc. Natl. Acad. Sci. U.S.A. 1976, 73, 248–251. 10.1073/pnas.73.1.248. [DOI] [PMC free article] [PubMed] [Google Scholar]
- Raptis S.; Schlegel W.; Lehmann E.; Dollinger H.; Zoupas C. Effects of somatostatin on the exocrine pancreas and the release of duodenal hormones. Metabolism 1978, 27, 1321–1328. 10.1016/0026-0495(78)90066-5. [DOI] [PubMed] [Google Scholar]
- Weckbecker G.; Lewis I.; Albert R.; Schmid H. A.; Hoyer D.; Bruns C. Opportunities in somatostatin research: biological, chemical and therapeutic aspects. Nat. Rev. Drug Discovery 2003, 2, 999–1017. 10.1038/nrd1255. [DOI] [PubMed] [Google Scholar]
- Ösapay G.; Ösapay K. Therapeutic applications of somatostatin analogues. Expert Opin. Ther. Pat. 1998, 8, 855–870. 10.1517/13543776.8.7.855. [DOI] [Google Scholar]
- Lamberts S. W.; van der Lely A.-J.; de Herder W. W.; Hofland L. J. Octreotide. N. Engl. J. Med. 1996, 334, 246–254. 10.1056/NEJM199601253340408. [DOI] [PubMed] [Google Scholar]
- Olias G.; Viollet C.; Kusserow H.; Epelbaum J.; Meyerhof W. Regulation and function of somatostatin receptors. J. Neurochem. 2004, 89, 1057–1091. 10.1111/j.1471-4159.2004.02402.x. [DOI] [PubMed] [Google Scholar]
- Piwko C.; Thoss V.; Schüpbach E.; Kummer J.; Langenegger D.; Probst A.; Hoyer D. Pharmacological characterisation of human cerebral cortex somatostatin SRIF1 and SRIF2 receptors. Naunyn-Schmiedeberg’s Arch. Pharmacol. 1997, 355, 161–167. 10.1007/PL00004927. [DOI] [PubMed] [Google Scholar]
- Thermos K. Functional mapping of somatostatin receptors in the retina: a review. Vision Res. 2003, 43, 1805–1815. 10.1016/S0042-6989(03)00169-X. [DOI] [PubMed] [Google Scholar]
- Bocci G.; Culler M.; Fioravanti A.; Orlandi P.; Fasciani A.; Colucci R.; Taylor J.; Sadat D.; Danesi R.; Del Tacca M. In vitro antiangiogenic activity of selective somatostatin subtype-1 receptor agonists. Eur. J. Clin. Invest. 2007, 37, 700–708. 10.1111/j.1365-2362.2007.01848.x. [DOI] [PubMed] [Google Scholar]
- Reubi J.; Schaer J.; Waser B.; Hoeger C.; Rivier J. A selective analog for the somatostatin sst1-receptor subtype expressed by human tumors. Eur. J. Pharmacol. 1998, 345, 103–110. 10.1016/S0014-2999(97)01618-X. [DOI] [PubMed] [Google Scholar]
- Reubi J.; Waser B.; Schaer J.; Laissue J. Somatostatin receptor SSTR1–SSTR5 expression in normal and neoplastic human tissues using receptor autoradiography with subtype-selective ligands. Eur. J. Nucl. Med. 2001, 28, 836–846. 10.1007/s002590100541. [DOI] [PubMed] [Google Scholar]
- Klagge A.; Krause K.; Schierle K.; Steinert F.; Dralle H.; Fuhrer D. Somatostatin receptor subtype expression in human thyroid tumours. Horm. Metab. Res. 2010, 42, 237–240. 10.1055/s-0029-1243636. [DOI] [PubMed] [Google Scholar]
- Miller G.; Alexander J.; Bikkal H.; Katznelson L.; Zervas N.; Kilbanski A. Somatostatin receptor subtype gene expression in pituitary adenomas. J. Clin. Endocrinol. Metab. 1995, 80, 1386–1392. 10.1210/jcem.80.4.7714115. [DOI] [PubMed] [Google Scholar]
- Kaupmann K.; Bruns C.; Raulf F.; Weber H. P.; Mattes H.; Lübbert H. Two amino acids, located in transmembrane domains VI and VIl, determine the selectivity of the peptide agonist SMS 201-995 for the SSTR2 somatostatin receptor. EMBO J. 1995, 14, 727–735. 10.1002/j.1460-2075.1995.tb07051.x. [DOI] [PMC free article] [PubMed] [Google Scholar]
- Liapakis G.; Fitzpatrick D.; Hoeger C.; Rivier J.; Vandlen R.; Reisine T. Identification of ligand binding determinants in the somatostatin receptor subtypes 1 and 2. J. Biol. Chem. 1996, 271, 20331–20339. 10.1074/jbc.271.34.20331. [DOI] [PubMed] [Google Scholar]
- Hurth K.; Enz A.; Floersheim P.; Gentsch C.; Hoyer D.; Langenegger D.; Neumann P.; Pfäffli P.; Sorg D.; Swoboda R.; Vassout A.; Troxler T. SAR of the arylpiperazine moiety of obeline somatostatin sst1 receptor antagonists. Bioorg. Med. Chem. Lett. 2007, 17, 3988–3991. 10.1016/j.bmcl.2007.04.078. [DOI] [PubMed] [Google Scholar]
- Troxler T.; Hoyer D.; Langenegger D.; Neumann P.; Pfäffli P.; Schoeffter P.; Sorg D.; Swoboda R.; Hurth K. Identification and SAR of potent and selective non-peptide obeline somatostatin sst1 receptor antagonists. Bioorg. Med. Chem. Lett. 2007, 17, 3983–3987. 10.1016/j.bmcl.2007.04.086. [DOI] [PubMed] [Google Scholar]
- Troxler T.; Enz A.; Hoyer D.; Langenegger D.; Neumann P.; Pfäffli P.; Schoeffter P.; Hurth K. Ergoline derivatives as highly potent and selective antagonists at the somatostatin sst1 receptor. Bioorg. Med. Chem. Lett. 2008, 18, 979–982. 10.1016/j.bmcl.2007.12.030. [DOI] [PubMed] [Google Scholar]
- Fukui K. Role of frontier orbitals in chemical reactions. Science 1982, 218, 747–754. 10.1126/science.218.4574.747. [DOI] [PubMed] [Google Scholar]
- Bostan R.; Varvara S.; Găină L.; Mureşan L. M. Evaluation of some phenothiazine derivatives as corrosion inhibitors for bronze in weakly acidic solution. Corros. Sci. 2012, 63, 275–286. 10.1016/j.corsci.2012.06.010. [DOI] [Google Scholar]
- Mert B. D.; Erman Mert M.; Kardaş G.; Yazıcı B. Experimental and theoretical investigation of 3-amino-1,2,4-triazole-5-thiol as a corrosion inhibitor for carbon steel in HCl medium. Corros. Sci. 2011, 53, 4265–4272. 10.1016/j.corsci.2011.08.038. [DOI] [Google Scholar]
- Zhan C.; Nichols J. A.; Dixon D. A. Ionization Potential, Electron Affinity, Electronegativity, Hardness, and Electron Excitation Energy: Molecular Properties from Density Functional Theory Orbital Energies. J. Phys. Chem. A 2003, 107, 4184–4195. 10.1021/jp0225774. [DOI] [Google Scholar]
- Pearson R. G. Absolute electronegativity and hardness correlated with molecular orbital theory. Proc. Natl. Acad. Sci. U.S.A. 1986, 83, 8440–8441. 10.1073/pnas.83.22.8440. [DOI] [PMC free article] [PubMed] [Google Scholar]
- Nagle J. F.; Tristram-Nagle S. Structure of lipid bilayers. BBA, Biochim. Biophys. Acta, Rev. Biomembr. 2000, 1469, 159–195. 10.1016/S0304-4157(00)00016-2. [DOI] [PMC free article] [PubMed] [Google Scholar]
- Petrache H. I.; Dodd S. W.; Brown M. F. Area per lipid and acyl length distributions in fluid phosphatidylcholines determined by (2)H NMR spectroscopy. Biophys. J. 2000, 79, 3172–3192. 10.1016/S0006-3495(00)76551-9. [DOI] [PMC free article] [PubMed] [Google Scholar]
- Nagle J. F.; Zhang R.; Tristram-Nagle S.; Sun W.; Petrache H. I.; Suter R. M. X-ray structure determination of fully hydrated L alpha phase dipalmitoylphosphatidylcholine bilayers. Biophys. J. 1996, 70, 1419–1431. 10.1016/S0006-3495(96)79701-1. [DOI] [PMC free article] [PubMed] [Google Scholar]
- Kučerka N.; Nagle J. F.; Sachs J. N.; Feller S. E.; Pencer J.; Jackson A.; Katsaras J. Lipid Bilayer Structure Determined by the Simultaneous Analysis of Neutron and X-Ray Scattering Data. Biophys. J. 2008, 95, 2356–2367. 10.1529/biophysj.108.132662. [DOI] [PMC free article] [PubMed] [Google Scholar]
- Kučerka N.; Nieh M.; Katsaras J. Fluid phase lipid areas and bilayer thicknesses of commonly used phosphatidylcholines as a function of temperature. BBA, Biochim. Biophys. Acta, Rev. Biomembr. 2011, 1808, 2761–2771. 10.1016/j.bbamem.2011.07.022. [DOI] [PubMed] [Google Scholar]
- Allen W. J.; Lemkul J. A.; Bevan D. R. GridMAT-MD: a grid-based membrane analysis tool for use with molecular dynamics. J. Comput. Chem. 2009, 30, 1952–1958. 10.1002/jcc.21172. [DOI] [PubMed] [Google Scholar]
- Troxler T.; Hurth K.; Mattes H.; Prashad M.; Schoeffter P.; Langenegger D.; Enz A.; Hoyer D. Discovery of novel non-peptidic β-alanine piperazine amide derivatives and their optimization to achiral, easily accessible, potent and selective somatostatin sst1 receptor antagonists. Bioorg. Med. Chem. Lett. 2009, 19, 1305–1309. 10.1016/j.bmcl.2009.01.072. [DOI] [PubMed] [Google Scholar]
- Berman H. M.; Westbrook J.; Feng Z.; Gilliland G.; Bhat T. N.; Weissig H.; Shindyalov I. N.; Bourne P. E. The Protein Data Bank. Nucleic Acids Res. 2000, 28, 235–242. 10.1093/nar/28.1.235. [DOI] [PMC free article] [PubMed] [Google Scholar]
- Esposito E. X.; Tobi D.; Madura J. D.. Comparative Protein Modeling. In Reviews in Computational Chemistry; Lipkowitz K. B.; Cundari T. R.; Gillet V. J.; Boyd D. B., Eds.; John Wiley & Sons: New York, NY, 2006; Vol. 22, pp 57–167. [Google Scholar]
- UniProt: a hub for protein information. Nucleic Acids Res. 2015, 43, D204–D212. 10.1093/nar/gku989. [DOI] [PMC free article] [PubMed] [Google Scholar]
- Altschul S. F.; Gish W.; Miller W.; Myers E. W.; Lipman D. J. Basic local alignment search tool. J. Mol. Biol. 1990, 215, 403–410. 10.1016/S0022-2836(05)80360-2. [DOI] [PubMed] [Google Scholar]
- Altschul S. F.; Madden T. L.; Schäffer A. A.; Zhang J.; Zhang Z.; Miller W.; Lipman D. J. Gapped BLAST and PSI-BLAST: a new generation of protein database search programs. Nucleic Acids Res. 1997, 25, 3389–3402. 10.1093/nar/25.17.3389. [DOI] [PMC free article] [PubMed] [Google Scholar]
- Xiang Z. Advances in Homology Protein Structure Modeling. Curr. Protein Pept. Sci. 2006, 7, 217–227. 10.2174/138920306777452312. [DOI] [PMC free article] [PubMed] [Google Scholar]
- Kuntal B. K.; Aparoy P.; Reddanna P. EasyModeller: A graphical interface to MODELLER. BMC Res. Notes 2010, 3, 226. 10.1186/1756-0500-3-226. [DOI] [PMC free article] [PubMed] [Google Scholar]
- Yang J.; Yan R.; Roy A.; Xu D.; Poisson J.; Zhang Y. The I-TASSER Suite: protein structure and function prediction. Nat. Methods 2015, 12, 7–8. 10.1038/nmeth.3213. [DOI] [PMC free article] [PubMed] [Google Scholar]
- Webb B.; Sali A. Comparative Protein Structure Modeling Using MODELLER. Curr. Protoc. Bioinf. 2016, 54, 5.6.1–5.6.37. 10.1002/cpbi.3. [DOI] [PMC free article] [PubMed] [Google Scholar]
- Wu S.; Zhang Y. LOMETS: A local meta-threading-server for protein structure prediction. Nucleic Acids Res. 2007, 35, 3375–3382. 10.1093/nar/gkm251. [DOI] [PMC free article] [PubMed] [Google Scholar]
- SYBYL-X 2.1; Tripos International: 1699 South Hanley Road, St. Louis, MO, 63144-2319, USA, 2010.
- Powell M. An efficient method for finding the minimum of a function of several variables without calculating derivatives. Comput. J. 1964, 7, 155–162. 10.1093/comjnl/7.2.155. [DOI] [Google Scholar]
- Clark M.; Cramer R. D. III; Van Opdenbosch N. Validation of the general purpose tripos 5.2 force field. J. Comput. Chem. 1989, 10, 982–1012. 10.1002/jcc.540100804. [DOI] [Google Scholar]
- Ramachandran G. N.; Ramakrishnan C.; Sasisekharan V. Stereochemistry of polypeptide chain configurations. J. Mol. Biol. 1963, 7, 95–99. 10.1016/S0022-2836(63)80023-6. [DOI] [PubMed] [Google Scholar]
- Colovos C.; Yeates T. O. Verification of protein structures: patterns of nonbonded atomic interactions. Protein Sci. 1993, 2, 1511–1519. 10.1002/pro.5560020916. [DOI] [PMC free article] [PubMed] [Google Scholar]
- Eisenberg D.; Lüthy R.; Bowie J. U. [20] VERIFY3D: Assessment of protein models with three-dimensional profiles. Methods Enzymol. 1997, 277, 396–404. 10.1016/s0076-6879(97)77022-8. [DOI] [PubMed] [Google Scholar]
- Benkert P.; Tosatto S. C.; Schomburg D. QMEAN: A comprehensive scoring function for model quality assessment. Proteins 2008, 71, 261–277. 10.1002/prot.21715. [DOI] [PubMed] [Google Scholar]
- Wiederstein M.; Sippl M. J. ProSA-web: interactive web service for the recognition of errors in three-dimensional structures of proteins. Nucleic Acids Res. 2007, 35, W407–W410. 10.1093/nar/gkm290. [DOI] [PMC free article] [PubMed] [Google Scholar]
- Lovell S. C.; Davis I. W.; Arendall B.; de Bakker P. I.; Word J. M.; Prisant M. G.; Richardson J. S.; Richardson D. C. Structure validation by Cα geometry: ϕ,ψ and Cβ deviation. Proteins 2003, 50, 437–450. 10.1002/prot.10286. [DOI] [PubMed] [Google Scholar]
- Gasteiger J.; Marsili M. Iterative partial equalization of orbital electronegativity—a rapid access to atomic charges. Tetrahedron 1980, 36, 3219–3228. 10.1016/0040-4020(80)80168-2. [DOI] [Google Scholar]
- Siehler S.; Seuwen K.; Hoyer D. [125I]Tyr10-cortistatin14 labels all five somatostatin receptors. Naunyn-Schmiedeberg’s Arch. Pharmacol. 1998, 357, 483–489. 10.1007/PL00005197. [DOI] [PubMed] [Google Scholar]
- Siehler S.; Seuwen K.; Hoyer D. Characterisation of human recombinant somatostatin receptors. 1. Radioligand binding studies. Naunyn-Schmiedeberg’s Arch. Pharmacol. 1999, 360, 488–499. 10.1007/s002109900141. [DOI] [PubMed] [Google Scholar]
- Bruns C.; Raulf F.; Hoyer D.; Schloos J.; Lübbert H.; Weckbecker G. Binding properties of somatostatin receptor subtypes. Metabolism 1996, 45, 17–20. 10.1016/S0026-0495(96)90072-4. [DOI] [PubMed] [Google Scholar]
- Meyerhof W.The elucidation of somatostatin receptor functions: a current view. In Reviews of Physiology, Biochemistry and Pharmacology; Springer, 2005; Vol. 133, pp 55–108. [DOI] [PubMed] [Google Scholar]
- Patel Y. C.; Srikant C. B. Subtype selectivity of peptide analogs for all five cloned human somatostatin receptors (hsstr 1-5). Endocrinology 1994, 135, 2814–2817. 10.1210/endo.135.6.7988476. [DOI] [PubMed] [Google Scholar]
- Lamiable A.; Thévenet P.; Rey J.; Vavrusa M.; Derreumaux P.; Tufféry P. PEP-FOLD3: faster de novo structure prediction for linear peptides in solution and in complex. Nucleic Acids Res. 2016, 44, W449–W454. 10.1093/nar/gkw329. [DOI] [PMC free article] [PubMed] [Google Scholar]
- Yang J.; Roy A.; Zhang Y. Protein-ligand binding site recognition using complementary binding-specific substructure comparison and sequence profile alignment. Bioinformatics 2013, 29, 2588–2595. 10.1093/bioinformatics/btt447. [DOI] [PMC free article] [PubMed] [Google Scholar]
- Yang J.; Roy A.; Zhang Y. BioLiP: a semi-manually curated database for biologically relevant ligand-protein interactions. Nucleic Acids Res. 2012, 41, D1096–D1103. 10.1093/nar/gks966. [DOI] [PMC free article] [PubMed] [Google Scholar]
- Haas J.; Barbato A.; Behringer D.; Studer G.; Roth S.; Bertoni M.; Mostaguir K.; Gumienny R.; Schwede T. Continuous Automated Model EvaluatiOn (CAMEO) complementing the critical assessment of structure prediction in CASP12. Proteins 2018, 86, 387–398. 10.1002/prot.25431. [DOI] [PMC free article] [PubMed] [Google Scholar]
- Jain A. N. Surflex: fully automatic flexible molecular docking using a molecular similarity-based search engine. J. Med. Chem. 2003, 46, 499–511. 10.1021/jm020406h. [DOI] [PubMed] [Google Scholar]
- Jain A. N. Scoring noncovalent protein-ligand interactions: A continuous differentiable function tuned to compute binding affinities. J. Comput.-Aided Mol. Des. 1996, 10, 427–440. 10.1007/BF00124474. [DOI] [PubMed] [Google Scholar]
- Jain A. N. Scoring functions for protein-ligand docking. Curr. Protein Pept. Sci. 2006, 7, 407–420. 10.2174/138920306778559395. [DOI] [PubMed] [Google Scholar]
- Kozakov D.; Hall D. R.; Xia B.; Kathryn P. A.; Padhorny D.; Yueh C.; Beglov D.; Vajda S. The ClusPro web server for protein–protein docking. Nat. Protoc. 2017, 12, 255–278. 10.1038/nprot.2016.169. [DOI] [PMC free article] [PubMed] [Google Scholar]
- Comeau S. R.; Gatchell D. W.; Vajda S.; Camacho C. J. ClusPro: an automated docking and discrimination method for the prediction of protein complexes. Bioinformatics 2004, 20, 45–50. 10.1093/bioinformatics/btg371. [DOI] [PubMed] [Google Scholar]
- Lensink M. F.; Wodak S. J. Docking, scoring, and affinity prediction in CAPRI. Proteins 2013, 81, 2082–2095. 10.1002/prot.24428. [DOI] [PubMed] [Google Scholar]
- Kozakov D.; Brenke R.; Comeau S. R.; Vajda S. PIPER: An FFT-based protein docking program with pairwise potentials. Proteins 2006, 65, 392–406. 10.1002/prot.21117. [DOI] [PubMed] [Google Scholar]
- Kozakov D.; Beglov D.; Bohnuud T.; Mottarella S. E.; Bing X.; Hall D. R.; Vajda S. How good is automated protein docking?. Proteins: Struct., Funct., Bioinf. 2013, 81, 2159–2166. 10.1002/prot.24403. [DOI] [PMC free article] [PubMed] [Google Scholar]
- Cramer R. D.; Patterson D. E.; Bunce J. D. Comparative molecular field analysis (CoMFA). 1. Effect of shape on binding of steroids to carrier proteins. J. Am. Chem. Soc. 1988, 110, 5959–5967. 10.1021/ja00226a005. [DOI] [PubMed] [Google Scholar]
- Wold S.; Albano C.; DunnIII W. J.; Edlund U.; Esbensen K.; Geladi P.; Hellberg S.; Johansson E.; Lindberg W.; Sjöström M.. Multivariate Data Analysis in Chemistry. In Chemometrics; Kowalski B. R., Ed.; Springer: Dordrecht, 1984; Vol. 138, pp 17–95. [Google Scholar]
- Wold S. Cross-Validatory Estimation of the Number of Components in Factor and Principal Components Models. Technometrics 1978, 20, 397–405. 10.1080/00401706.1978.10489693. [DOI] [Google Scholar]
- Hohenberg P.; Kohn W. Inhomogeneous Electron Gas. Phys. Rev. 1964, 136, B864–B871. 10.1103/PhysRev.136.B864. [DOI] [Google Scholar]
- Geerlings P.; De Proft F.; Langenaeker W. Conceptual Density Functional Theory. Chem. Rev. 2003, 103, 1793–1874. 10.1021/cr990029p. [DOI] [PubMed] [Google Scholar]
- Domingo L. R.; Ríos-Gutiérrez M.; Pérez P. Applications of the Conceptual Density Functional Theory Indices to Organic Chemistry Reactivity. Molecules 2016, 21, 748. 10.3390/molecules21060748. [DOI] [PMC free article] [PubMed] [Google Scholar]
- Becke A. D. Density-functional thermochemistry. III. The role of exact exchange. J. Chem. Phys. 1993, 98, 5648–5652. 10.1063/1.464913. [DOI] [Google Scholar]
- Becke A. D. A new inhomogeneity parameter in density-functional theory. J. Chem. Phys. 1998, 109, 2092–2098. 10.1063/1.476722. [DOI] [Google Scholar]
- Lee C.; Yang W.; Parr R. G. Development of the Colle-Salvetti correlation-energy formula into a functional of the electron density. Phys. Rev. B 1988, 37, 785–789. 10.1103/PhysRevB.37.785. [DOI] [PubMed] [Google Scholar]
- Frisch M. J.; Trucks G. W.; Schlegel H. B.; Scuseria G. E.; Robb M. A.; Cheeseman J. R.; Scalmani G.; Barone V.; Petersson G. A.; Nakatsuji H.; Li X.; Caricato M.; Marenich A. V.; Bloino J.; Janesko B. G.; Gomperts R.; Mennucci R.; Hratchian H. P.; Ortiz J. V.; Izmaylov A. F.; Sonnenberg J. L.; Williams-Young D.; Ding F.; Lipparini F.; Egidi F.; Goings J.; Peng B.; Petrone A.; Henderson T.; Ranasinghe D.; Zakrzewski V. G.; Gao J.; Rega N.; Zheng G.; Liang W.; Hada M.; Ehara M.; Toyota K.; Fukuda R.; Hasegawa J.; Ishida M.; Nakajima T.; Honda Y.; Kitao O.; Nakai H.; Vreven T.; Throssell K.; Montgomery J. A. Jr.; Peralta J. E.; Ogliaro F.; Bearpark M. J.; Heyd J. J.; Brothers E. N.; Kudin K. N.; Staroverov V. N.; Keith T. A.; Kobayashi R.; Normand J.; Raghavachari K.; Rendell A. P.; Burant J. C.; Iyengar S. S.; Tomasi J.; Cossi M.; Millam J. M.; Klene M.; Adamo C.; Cammi R.; Ochterski J. W.; Martin R. L.; Morokuma K.; Farkas O.; Foresman J. B.; Fox D. J.. Gaussian 16, Revision C.01; Gaussian, Inc.: Wallingford CT, 2016. [Google Scholar]
- Jo S.; Kim T.; Iyer V. G.; Im W. CHARMM-GUI: A Web-based Graphical User Interface for CHARMM. J. Comput. Chem. 2008, 29, 1859–1865. 10.1002/jcc.20945. [DOI] [PubMed] [Google Scholar]
- Lee J.; Cheng X.; Swails J. M.; Yeom M. S.; Eastman P. K.; Lemkul J. A.; Wei S.; Buckner J.; Jeong J. C.; Qi Y.; Jo S.; Pande V. S.; Case D. A.; Brooks C. L. III; Alexander M. D. Jr.; Klauda J. B.; Im W. CHARMM-GUI Input Generator for NAMD, GROMACS, AMBER, OpenMM, and CHARMM/OpenMM Simulations Using the CHARMM36 Additive Force Field. J. Chem. Theory Comput. 2016, 12, 405–413. 10.1021/acs.jctc.5b00935. [DOI] [PMC free article] [PubMed] [Google Scholar]
- Wu E. L.; Cheng X.; Jo S.; Rui H.; Song K. C.; Dávila-Contreras E. M.; Qi Y.; Lee J.; Monje-Galvan V.; Venable R. M.; Klauda J. B.; Im W. CHARMM-GUI Membrane Builder Toward Realistic Biological Membrane Simulations. J. Comput. Chem. 2014, 35, 1997–2004. 10.1002/jcc.23702. [DOI] [PMC free article] [PubMed] [Google Scholar]
- Jo S.; Kim T.; Im W. Automated Builder and Database of Protein/Membrane Complexes for Molecular Dynamics Simulations. PLoS One 2007, 2, e880 10.1371/journal.pone.0000880. [DOI] [PMC free article] [PubMed] [Google Scholar]
- Lomize M. A.; Pogozheva I. D.; Joo H.; Mosberg H. I.; Lomize A. L. OPM database and PPM web server: resources for positioning of proteins in membranes. Nucleic Acids Res. 2012, 40, D370–D376. 10.1093/nar/gkr703. [DOI] [PMC free article] [PubMed] [Google Scholar]
- Fenalti G.; Zatsepin N. A.; Betti C.; Giguere P.; Han G. W.; Ishchenko A.; Liu W.; Guillemyn K.; Zhang H.; James D.; Wang D.; Weierstall U.; Spence J. C.; Boutet S.; Messerschmidt M.; Williams G. J.; Gati C.; Yefanov O. M.; White T. A.; Oberthuer D.; Metz M.; Yoon C. H.; Barty A.; Chapman H. N.; Basu S.; Coe J.; Conrad C. E.; Fromme R.; Fromme P.; Tourwé D.; Schiller P. W.; Roth B. L.; Ballet S.; Katritch V.; Stevens R. C.; Cherezov V. Structural Basis for Bifunctional Peptide Recognition at Human δ-opioid Receptor. Nat. Struct. Mol. Biol. 2015, 22, 265–268. 10.1038/nsmb.2965. [DOI] [PMC free article] [PubMed] [Google Scholar]
- Wu E. L.; Cheng X.; Jo S.; Rui H.; Song K. C.; Dávila-Contreras E. M.; Qi Y.; Lee J.; Monje-Galvan V.; Venable R. M.; Klauda J. B.; Im W. CHARMM-GUI Membrane Builder toward realistic biological membrane simulations. J. Comput. Chem. 2014, 35, 1997–2004. 10.1002/jcc.23702. [DOI] [PMC free article] [PubMed] [Google Scholar]
Associated Data
This section collects any data citations, data availability statements, or supplementary materials included in this article.


