Abstract
NMR spectroscopy is a powerful technique for separating and measuring each distinct pKa value of the amino groups around aminoglycoside antibiotics. Unambiguous assignments were made for each individual amine substituent on 2-deoxystreptamine, tobramycin, kanamycin B, amikacin, sisomicin, and netilmicin using variations in the NMR spectroscopic chemical shift (δ) with 1H, 13C, and 15N HMBC; the individual pKa values of netilmicin are reported for the first time.
1. Introduction
Aminoglycosides are clinically important microorganism-derived natural products, which consist of an aminocyclitol moiety 2-deoxystreptamine or a streptidine ring in streptomycin attached to amino sugars by glycosidic bonds.1,2 These polyamine-type alkaloids are primarily used for the treatment of infection by Gram-negative (aerobic) or Gram-positive bacteria.1−5 The target at which these drugs act is found in the 16S fragment of ribosomal RNA (rRNA) located in the 30S subunit of the 70S bacterial ribosome, leading to cell death.6−8 The amino functional group substituents around the different rings of aminoglycoside antibiotics are key to the biological activities of these natural product alkaloids. The specific binding induced by the positively charged ammonium groups on aminoglycosides is to the negatively charged backbones of rRNA by electrostatic interactions.8
Ionization constants (pKa) provide key information about the physical and kinetic behavior of a chemical substance. The pKa values of a medication are significant physicochemical data and are therefore relevant to drug activity. This study is to determine individual pKa values by detailed nuclear magnetic resonance (NMR) spectroscopy of selected aminoglycoside alkaloids from Streptomyces and Micromonospora. To determine the individual pKa values, not available by potentiometric methods,9,10 different NMR reporter nuclei have been employed. Studying the pKa values of the ionizable nitrogen atoms in these antibiotic alkaloids will afford a better understanding of their structure–activity relationships (SAR), especially the order in which these similar functional groups gain/lose protons. Such data will potentially help in understanding the order of target rRNA binding, in bacterial cells, of the key basic functional groups or their conjugate ammonium ions. The aim is to measure pKa values of individual amines on aminoglycosides by using new combinations of 1H, 13C, and 15N HMBC NMR spectroscopic data.11−13
2. Results
2.1. pKa Values of the Individual Amino Groups of Tobramycin
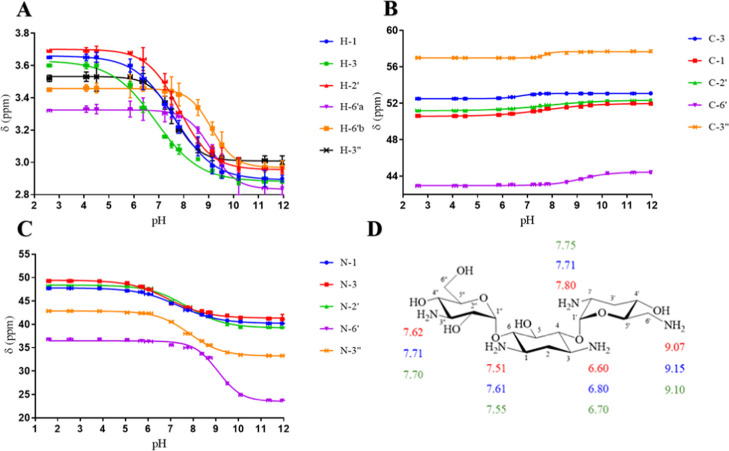
Tobramycin is a 4,6-O-disubstituted 2-deoxystreptamine (see Figure 1). Tobramycin has five primary amine functional groups. Three of those amines are substituents on two amino sugar rings: 3-deoxykanosamine (nebrosamine) and 3-amino-3-deoxy-d-glucose and two are on a central cyclohexane ring (2-deoxystreptamine). The pKa determinations at every point on each curve were repeated twice using 1H, 13C, and 15N HMBC NMR spectroscopy. The average values of the chemical shifts of 1H, 13C, and 15N HMBC of tobramycin at different pHs were plotted against the pH values of the solution. The pKa values of individual nitrogen atoms of tobramycin, shown in Figure 2 and Table 1, were extracted from the inflection points of the nonlinear sigmoidal curves (Figure 2).
Figure 1.
Tobramycin.
Figure 2.
NMR titration curves for (A) 1H, (B) 13C, and (C) 15N HMBC chemical shifts of 0.740–0.132 M tobramycin in 99.97% D2O at 25 °C and (D) pKa values of individual nitrogen atoms of tobramycin determined using 1H (red), 13C (blue), and 15N HMBC (green) NMR spectroscopy.
Table 1. pKa Values of Individual Nitrogen Atoms of Tobramycin Determined Using 1H, 13C, and 15N HMBC NMR Spectroscopy in This Work and Then Compared With the Published Data, as Indicated.
| individual
nitrogen atoms pKa |
|||||
|---|---|---|---|---|---|
| method | N-1 | N-3 | N-2′ | N-6′ | N-3″ |
| 15N NMRa | 7.40 | 6.20 | 7.60 | 8.60 | 7.40 |
| 1H NMRb | 7.30 | 6.60 | 7.50 | 8.40 | 7.30 |
| 15N NMRb | 7.40 | 6.40 | 7.70 | 8.50 | 7.40 |
| 1H NMRc | 7.51 ± 0.03 | 6.60 ± 0.05 | 7.80 ± 0.05 | 9.07 ± 0.10d | 7.62 ± 0.08 |
| 13C NMRc | 7.61 ± 0.07 | 6.80 ± 0.15 | 7.71 ± 0.07 | 9.15 ± 0.05 | 7.71 ± 0.03 |
| 15N HMBC NMRc | 7.55 ± 0.05 | 6.70 ± 0.05 | 7.75 ± 0.05 | 9.10 ± 0.05 | 7.70 ± 0.05 |
pKa values of individual nitrogen atoms of tobramycin determined using 15N NMR spectroscopy in H2O/D2O (90:10 v/v) relative to 15NH4Cl at 25 °C.11
pKa values of individual nitrogen atoms of tobramycin determined using 1H NMR spectroscopy and 15N NMR spectroscopy in D2O relative to TMS at 25 °C.14
This work.
The pKa value of N-6′ of tobramycin determined using 1H NMR spectroscopy (in this work) is the average pKa of the values of N-6′ obtained using 1H NMR spectroscopic data for 6′a (9.05) and 6′b (9.10).
The average pKa values determined using 1H, 13C, and 15N HMBC NMR spectroscopic data of each individual nitrogen atom on tobramycin are calculated to be: N-1 = 7.55, N-3 = 6.70, N-2′ = 7.75, N-6′ = 9.10, and N-3″ = 7.68. The assignment order of the average ionization constants within ±0.05 is N-6′ > N-2′ ≈ N-3′′ > N-1 > N-3. These pKa values are consistent in the assignment order with those reported in the literature.11,14
2.2. pKa Values of the Individual Amino Groups of Kanamycin B
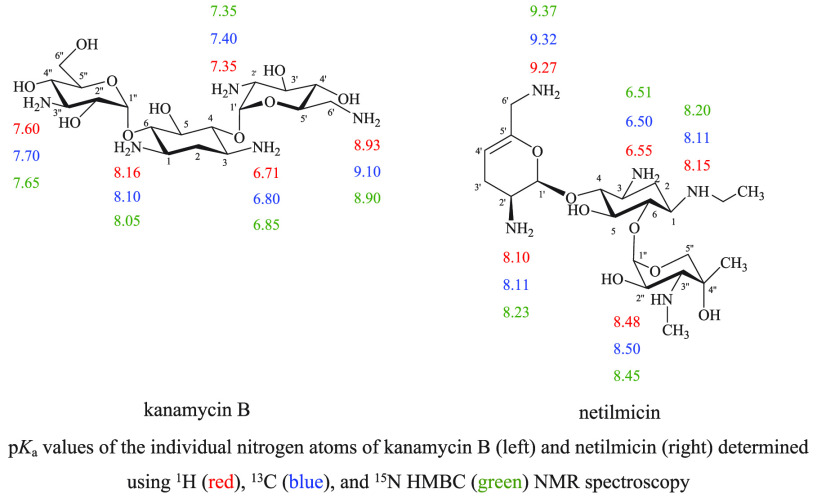
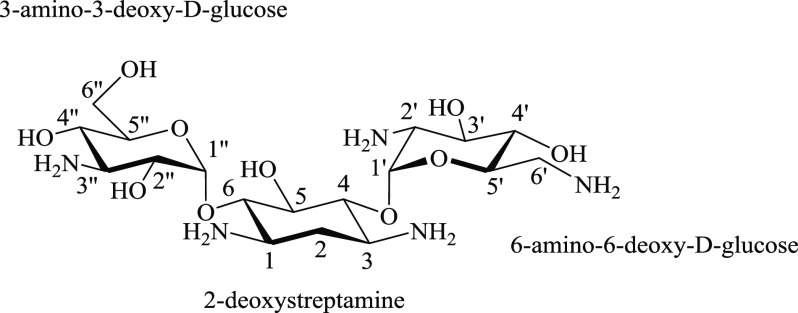
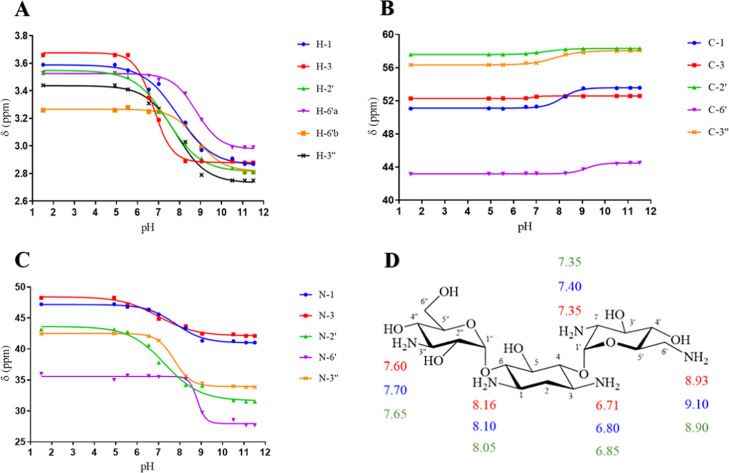
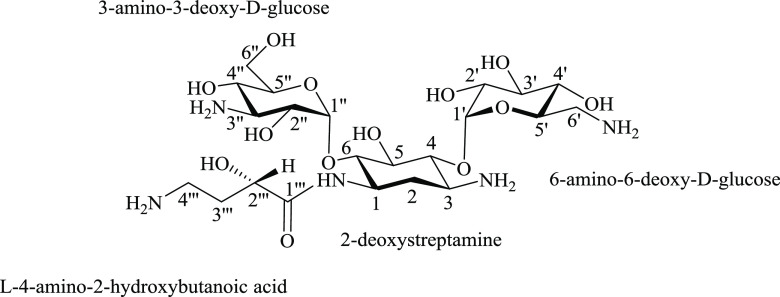
Kanamycin B (Figure 3), like tobramycin (Figure 1), is a 4,6-O-disubstituted 2-deoxystreptamine. Kanamycin B has five primary amines. Three of those amines are substituents on two amino sugar rings: 3-amino-3-deoxy-d-glucose and 6-amino-6-deoxy-d-glucose and two are on a central cyclohexane ring (2-deoxystreptamine). The chemical shifts of 1H, 13C, and 15N HMBC of kanamycin B at different pH values were plotted against the pH values of the solution. The pKa values of individual nitrogen atoms of kanamycin B, shown in Figure 4 and Table 2, were extracted from the inflection points of the nonlinear sigmoidal curves (Figure 4).
Figure 3.
Kanamycin B.
Figure 4.
NMR titration curves for the (A) 1H, (B) 13C, and (C) 15N HMBC chemical shifts of 1.315–0.822 M kanamycin in 99.97% D2O at 25 °C and (D) pKa values of individual nitrogen atoms of kanamycin B determined using 1H (red), 13C (blue), and 15N HMBC (green) NMR spectroscopy.
Table 2. pKa Values of Individual Nitrogen Atoms of Kanamycin B Determined Using 1H, 13C, and 15N HMBC NMR Spectroscopy and Then Compared with the Published Data, as Indicated.
| individual
nitrogen atoms pKa |
|||||
|---|---|---|---|---|---|
| method | N-1 | N-3 | N-2′ | N-6′ | N-3″ |
| 1H NMRa | 8.12 | 6.04 | 9.03 | 7.46 | |
| 1H NMRb | 8.16 | 6.71 | 7.35 | 8.93c | 7.60 |
| 13C NMRb | 8.10 | 6.80 | 7.40 | 9.10 | 7.70 |
| 15N HMBC NMRb | 8.05 | 6.85 | 7.35 | 8.90 | 7.65 |
pKa values of individual nitrogen atoms of kanamycin A (note, which lacks an N-2′ amine) determined using 1H NMR spectroscopy in D2O relative to TSP at 25 °C.15 Note also that there are no literature data for the pKa values of kanamycin B.
This work.
The pKa value of N-6′ of kanamycin B determined using 1H NMR spectroscopy (in this work) is the average pKa of the values of N-6′ obtained using 1H NMR spectroscopic data for 6′a (8.95) and 6′b (8.90).
After calculating, using 1H, 13C, and 15N HMBC NMR spectroscopic data, the average pKa values of each individual nitrogen atom on kanamycin B are N-1 = 8.10, N-3 = 6.78, N-2′ = 7.36, N-6′ = 8.97, and N-3″ = 7.65. The assignment order of the average ionization constants is N-6′ > N-1 > N-3′′ > N-2′ > N-3. In the absence of any kanamycin B published pKa data determined using NMR spectroscopy, these are therefore reported for the first time.
2.3. pKa Values of the Individual Amino Groups of Amikacin
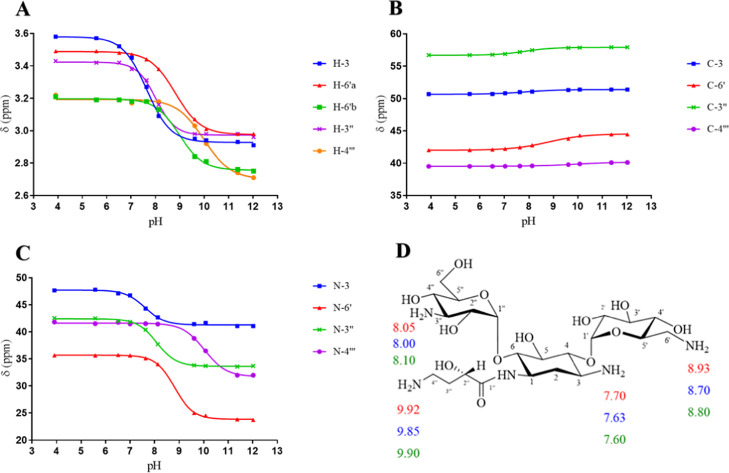
Amikacin has four primary amines, which are substituents on two amino sugar rings: 3-amino-3-deoxy-d-glucose and 6-amino-6-deoxy-d-glucose, a central cyclohexane ring (2-deoxystreptamine), and l-amino-α-hydroxybutanoic acid (see Figure 5). The chemical shifts of 1H, 13C, and 15N HMBC of amikacin at different pH values were plotted against the pH values of the solution. The pKa values of the individual amino groups of amikacin, shown in Figure 6 and Table 3, were extracted from the inflection points of the nonlinear sigmoidal curves (Figure 6). After calculating, the average pKa values, using 1H, 13C, and 15N HMBC NMR spectroscopic data, of each amino group on amikacin are N-3 = 7.64, N-6′ = 8.81, N-3″ = 8.05, and N-4‴ = 9.89. The assignment order of the average ionization constants is N-4‴ > N-6′ > N-3′′ > N-3. These pKa values are consistent in magnitude and in assignment order with those reported in the literature.16
Figure 5.
Amikacin.
Figure 6.
NMR titration curves for (A) 1H, (B) 13C, and (C) 15N HMBC chemical shifts of 0.896–0.597 M amikacin in 99.97% D2O at 25 °C and (D) pKa values of individual nitrogen atoms of amikacin determined using 1H (red), 13C (blue), and 15N HMBC (green) NMR spectroscopy.
Table 3. pKa Values of Individual Nitrogen Atoms of Amikacin Determined Using 1H, 13C, and 15N HMBC NMR Spectroscopy in This Work and Then Compared with the Published Data, as Indicated.
| individual nitrogen atoms pKa |
||||
|---|---|---|---|---|
| method | N-3 | N-6′ | N-3″ | N-4‴ |
| 15N NMRa | 7.62 | 8.92 | 8.13 | 9.70 |
| 1H NMRb | 7.70 | 8.93c | 8.05 | 9.92 |
| 13C NMRb | 7.63 | 8.70 | 8.00 | 9.85 |
| 15N HMBC NMRb | 7.60 | 8.80 | 8.10 | 9.90 |
pKa values of individual nitrogen atoms of amikacin determined using 15N NMR spectroscopy in H2O/D2O (85:15 v/v) relative to 15NH4Cl at 25 °C.16
This work.
The pKa value of N-6′ of amikacin determined using 1H NMR spectroscopy (in this work) is the average pKa of the values of N-6′ obtained using 1H NMR spectroscopic data for 6′a (8.90) and 6′b (8.96).
2.4. pKa Values of the Individual Amino Groups of Sisomicin
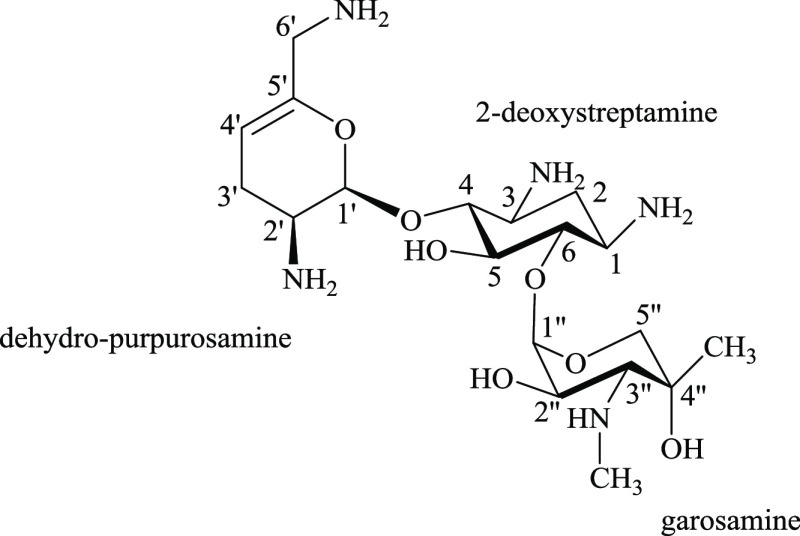
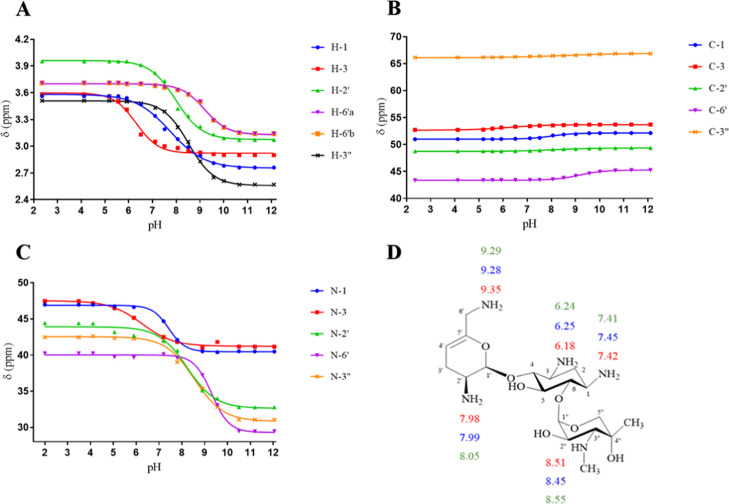
Sisomicin has four primary amines and a secondary N-methylamine. Those amines are substituents on two amino sugar rings: dehydro-purpurosamine and garosamine and a central cyclohexane ring (2-deoxystreptamine) (see Figure 7). The chemical structure of sisomicin is similar to that of netilmicin, with a primary amine as N-1 for the N-ethyl of netilmicin the only difference. The chemical shifts of 1H, 13C, and 15N HMBC of sisomicin at different pHs were plotted against the pH values of the solution. The pKa values of the individual nitrogen atoms of sisomicin, shown in Figure 8 and Table 4, were extracted from the inflection points of the nonlinear sigmoidal curves. After calculating, the average pKa values, using 1H, 13C, and 15N HMBC NMR spectroscopic data, of each individual nitrogen atom on sisomicin are N-1 = 7.42, N-3 = 6.22, N-2′ = 8.00, N-6′ = 9.30, and N-3″ = 8.50. The assignment order of the average ionization constants is N-6′ > N-3′′ > N-2′ > N-1 > N-3. These pKa values are consistent in magnitude and in assignment order with those reported in the literature.17
Figure 7.
Sisomicin.
Figure 8.
NMR titration curves for (A) 1H, (B) 13C, and (C) 15N HMBC chemical shifts of 0.160–0.063 M sisomicin in 99.97% D2O at 25 °C and (D) pKa values of the individual nitrogen atoms of sisomicin determined using 1H (red), 13C (blue), and 15N HMBC (green) NMR spectroscopy.
Table 4. pKa Values of Individual Nitrogen Atoms of Sisomicin Determined Using 1H, 13C, and 15N HMBC NMR Spectroscopy in This Work and Then Compared With the Published Data, as Indicated.
| individual
nitrogen atoms pKa |
|||||
|---|---|---|---|---|---|
| method | N-1 | N-3 | N-2′ | N-6′ | N-3″ |
| 1H NMRa | 7.34 | 6.11 | 7.93 | 9.45 | 8.63 |
| 1H NMRb | 7.42 | 6.18 | 7.98 | 9.35c | 8.51 |
| 13C NMRb | 7.45 | 6.25 | 7.99 | 9.28 | 8.45 |
| 15N HMBC NMRb | 7.41 | 6.24 | 8.05 | 9.29 | 8.55 |
pKa values of individual nitrogen atoms of sisomicin determined using 1H NMR spectroscopy in D2O relative to TSP at 25 °C.17
This work.
The pKa value of N-6′ of sisomicin determined using 1H NMR spectroscopy (in this work) is the average pKa of the values of N-6′ obtained using 1H NMR spectroscopic data for 6′a (9.35) and 6′b (9.35), which gave the same value.
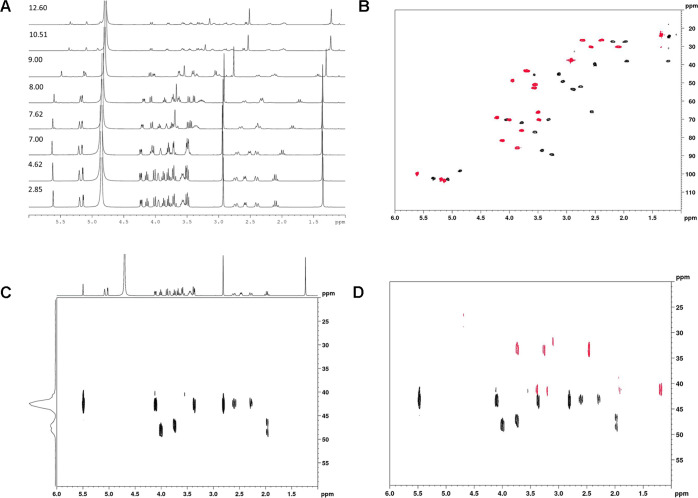
Some NMR spectra obtained for sisomicin, typical of these experiments, are shown below (Figure 9A). These illustrate the ease of applying our technique to determine the chemical shifts. While peak heights do reduce on dilution during titration with an aqueous base, there was no significant increase in line width. The 1H spectra for the various aminoglycosides at the extremes of pH are well-resolved, as in these conditions the amines are either fully protonated or fully deprotonated. At more intermediate values of pH, the situation is more complicated, as at any time the bases will tend to be in an equilibrium state between protonation/deprotonation, and this may be expected to impact on the spectral appearance, as potentially the rates of exchange approach the NMR time scale. However, as seen in the stack plot of the 1H spectra for sisomicin at all pD points (Figure 9A), while there is a little line broadening observed, the line shapes remain distinct and accurate chemical shift information can easily be gleaned. Typically, the 13C data points were determined by HSQC (overlay plot Figure 9B) in 20 min, as direct detection via a simple 1D 13C experiment may have been significantly longer in duration (depending upon the concentration). The use of the HSQC experiment increases the sensitivity as signal detection is through the proton channel and thus is intrinsically far more sensitive. In addition, the use of the second dimension gives advantages in assignment by reducing the incidence of the overlapping peaks. For the 15N data obtained via 15N–1H HMBC, typically ∼45 min was required per data point (acquisition data can be found in the legend for Figure 9C). Of course, this acquisition time could be reduced if needed (at the cost of more noisy data). The overlay of the 15N–1H HMBC spectra for sisomicin at pD 2.50 (in black) and at pD 12.55 (in red) (Figure 9D) shows the shifts in both the 1H and 15N spectra, which are followed during the titration experiment. pKa determination via Prism only needs 1–2–3 points in the transition as well as the start and end points. The data extracted fit well with the pKas reported and obtained by other methods.10
Figure 9.
(A) Stack plot of the 1H NMR spectra of sisomicin with pD increasing from 2.85 to 12.60. During the course of the experiment, the concentration of sisomicin was reduced by the addition of aliquots of NaOD solution to increase the basicity of the solution. As can clearly be seen, there was a little broadening of the signals observed—this implies that while the sisomicin bases were undergoing protonation/deprotonation, the rate of this was significantly faster than the NMR time scale. This allowed for convenient monitoring of the relevant shifts. (B) Overlay plot of the 13C–1H HSQC spectra of sisomicin with pD from 2.85 (red) to 12.60 (black), illustrating the shifts evidenced by both the protons and the carbon atoms. The 13C chemical shifts can be determined directly from the HSQC spectra or from a 1D-projection of the cross-peak data. Both sets of data were referenced using trimethylsilylpropanoic (TMSP) as 0.00 ppm for both 13C and 1H. (C) 15N–1H HMBC spectrum for sisomicin at pD 2.50. Individual 15N chemical shifts were obtained directly from the two-dimensional (2D) plot and can also be seen in the projected spectrum (a sum of the peaks presenting in the 2D spectrum between 6.0 and 1.5 ppm). Note that the intensity of the projected spectrum is related to the number of peaks and the strength of the correlation and has no other significance. The HMBC spectrum was acquired at 500.13 MHz for 1H and 50.67 MHz for 15N using the Bruker hmbcgpndqf pulse sequence. The data were acquired at 25 °C. TD was 2048 in the F2 dimension and 256 in the F1 (all ns = 4). Relaxation delay (d1) was 2.92 s. SW was 8.77 ppm for 1H and 450 ppm for 15N. 15N was referenced externally to nitromethane. For processing, SI was 4096 for F2 and 1024 for F1. The total time for acquisition was ∼45 min. (D) Overlay of the 15N–1H HMBC spectra for sisomicin at pD 2.50 (in black) and at pD 12.55 (in red), showing the shifts in both 1H and 15N spectra (all ns = 4). For assignment, the nitrogen cross-peaks are correlated to the protons and followed during the course of the titration experiment.
2.5. pKa Values of the Individual Amino Groups of Netilmicin
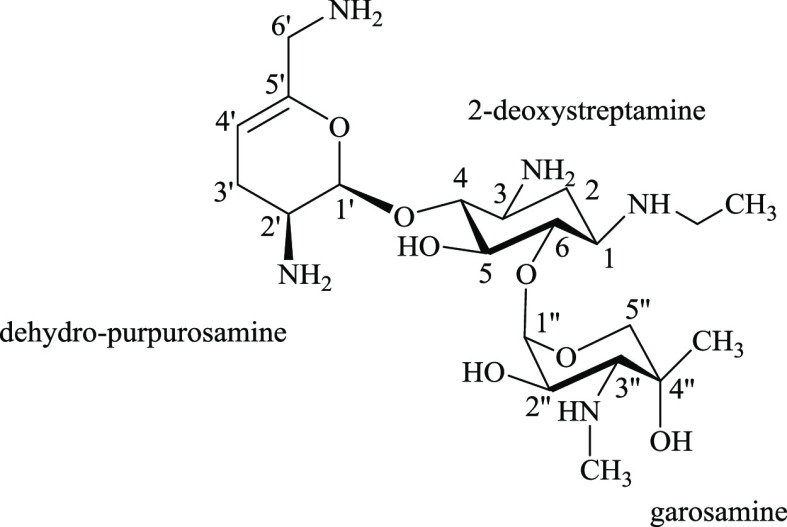
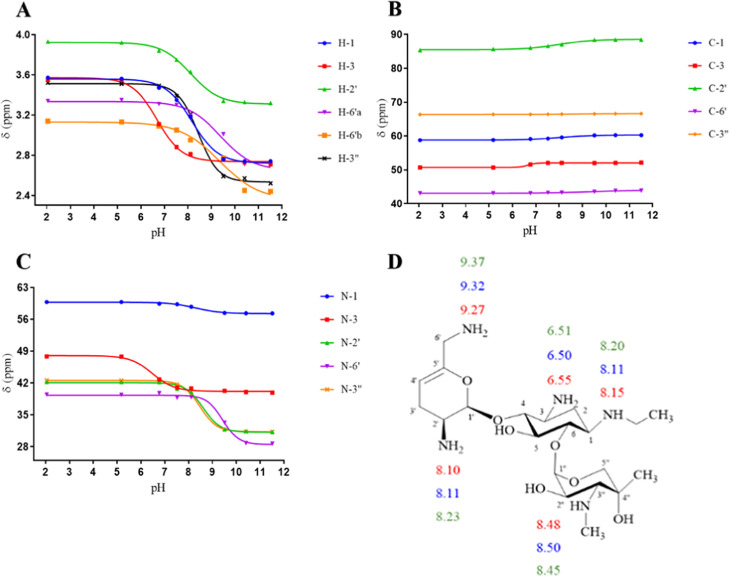
Netilmicin includes five amines, which are substituents on two amino sugar rings, dehydro-purpurosamine and garosamine, and a central cyclohexane ring (2-deoxystreptamine) (see Figure 10). There are three primary amines and two different N-alkyl substituents: N-ethyl on N-1 and N-methyl on N-3″. The chemical shifts of 1H, 13C, and 15N HMBC of netilmicin at different pHs were plotted against the pH values of the solution. The pKa values of individual nitrogen atoms of netilmicin, shown in Figure 11 and Table 5, were extracted from the inflection points of the nonlinear sigmoidal curves. In the absence of any published netilmicin pKa data, these are therefore reported for the first time. The average pKa values are N-1 = 8.15, N-3 = 6.52, N-2′ = 8.14, N-6′ = 9.29, and N-3″ = 8.47 and these are assigned in the following order: N-6′ > N-3′′ > N-1 ≈ N-2′ > N-3.
Figure 10.
Netilmicin.
Figure 11.
NMR titration curves for (A) 1H, (B) 13C, and (C) 15N HMBC chemical shifts of 0.506–0.434 M netilmicin in 99.97% D2O at 25 °C and (D) pKa values of the individual nitrogen atoms of netilmicin determined using 1H (red), 13C (blue), and 15N HMBC (green) NMR spectroscopy.
Table 5. pKa Values of the Individual Nitrogen Atoms of Netilmicin Determined Using 1H, 13C, and 15N HMBC NMR Spectroscopy in This Work and Then Compared With the Published Data, as Indicated.
| individual
nitrogen atoms pKa |
|||||
|---|---|---|---|---|---|
| method | N-1 | N-3 | N-2′ | N-6′ | N-3″ |
| 1H NMRa | 8.15 | 6.55 | 8.10 | 9.27b | 8.48 |
| 13C NMRa | 8.11 | 6.50 | 8.11 | 9.32 | 8.50 |
| 15N HMBC NMRa | 8.20 | 6.51 | 8.23 | 9.37 | 8.45 |
This work. As far as can be determined, there are no literature data for the pKa values of netilmicin.
The pKa value of N-6′ of netilmicin determined using 1H NMR spectroscopy (in this work) is the average pKa of the values of N-6′ obtained using 1H NMR spectroscopic data for 6′a (9.29) and 6′b (9.25).
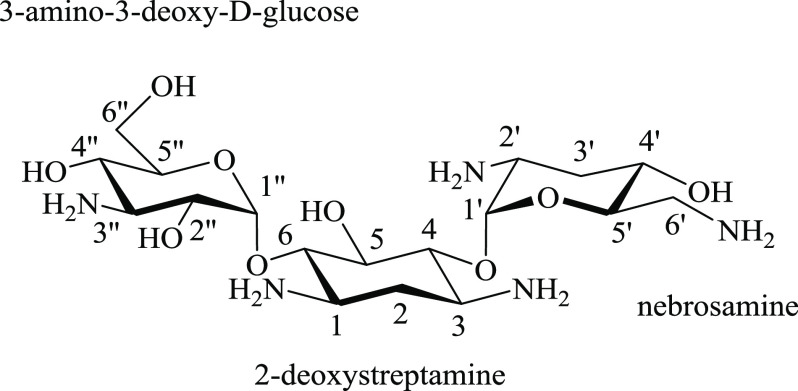
2.6. pKa Measurement Studies on 2-Deoxystreptamine
The reproducibility of the data obtained from these 1H, 13C, and 15N HMBC NMR spectroscopic experiments was determined by three repetitions using a simple diamine as a model compound, 2-deoxystreptamine (Figure 12). It was observed that the majority of the error bars for the pH values and for the chemical shifts were of a similar size as the (small, typical) symbols used to plot the points on the nonlinear sigmoidal curves. Typically, pKa values were accurate to <±0.1 and sometimes even down to ±0.03.
Figure 12.
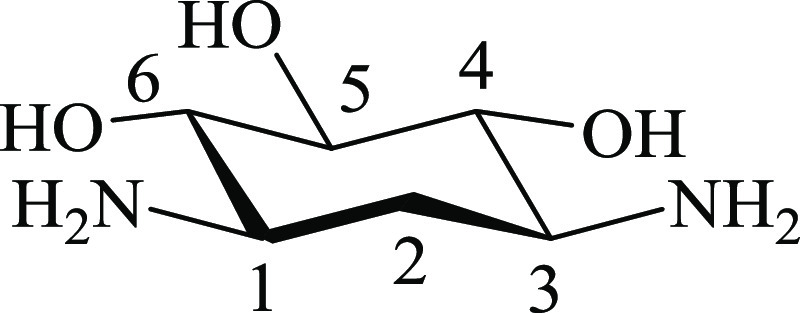
2-Deoxystreptamine.
1H and 13C NMR spectroscopic data were measured at pD 1.44, 8.30, and 11.68 for the model compound 2-deoxystreptamine at three fixed temperatures 25, 35, and 50 °C. The results showed that the chemical shifts corresponding to the H-1/3 and C-1/3 of 2-deoxystreptamine did not shift with the temperature increasing from 25 to 50 °C at low or high pD. One possible explanation of this observation is that the chemical shifts of these protons and carbons of 2-deoxystreptamine were not temperature dependent. Therefore, we concluded that the pKa values of the amino groups on aminoglycosides will not be affected by increasing the temperature in this typical NMR experiment range. 1H NMR spectroscopic data were measured at two concentrations of 0.631 and 0.157 M at low pD (∼2) for 2-deoxystreptamine. The obtained results showed that the chemical shifts corresponding to the H-1/3 of 2-deoxystreptamine did not shift with the changing concentration levels. Thus, the pKa values of N-1/3 on 2-deoxystreptamine were not affected by changing their concentrations, at least in this typical NMR concentration range.
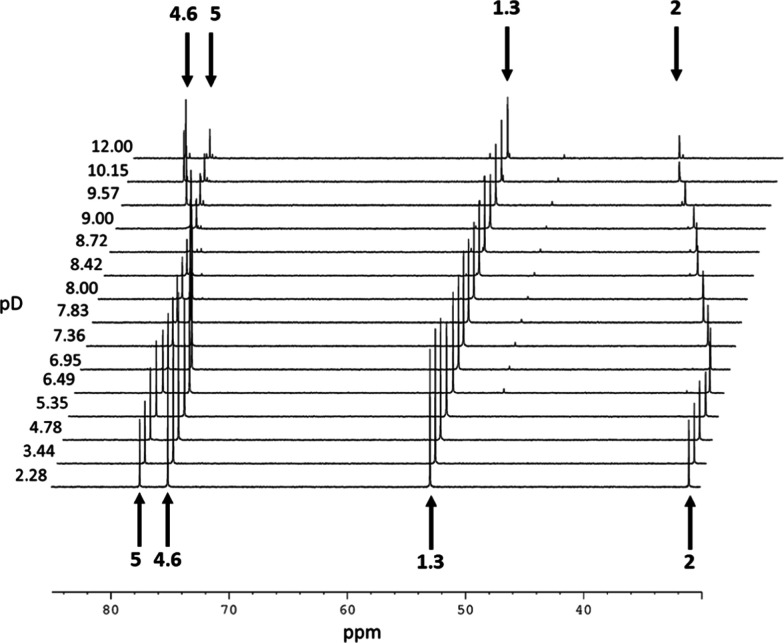
The 13C NMR (125.77 MHz) spectra of 0.631–0.369 M 2-deoxystreptamine in 99.97% D2O at 25 °C recorded between pD 2.28 and 12.00 showed the effects of dilution on titration, but no significant line broadening in the stack plot (Figure 13). Note the inversion of the chemical shift order for carbons labeled 5 and 4,6 and the stepped transition arising from double deprotonation of the two amine functional groups, most evidently reported for carbon 2. The 15N HMBC chemical shift (ppm) in 99.97% D2O (50.67 MHz) of N-1/3 of 2-deoxystreptamine (0.631–0.369 M) at pH 1.53 is 48.17 ppm and at pH 11.84 is 40.45 ppm measured relative to external nitromethane (CH3NO2/CDCl3 1:1, v/v) at −511.72 ppm at 25 °C. Not unexpectedly, this symmetrical diamine molecule only provides one signal in 15N HMBC spectroscopy.
Figure 13.
Stack plot of the 13C NMR (125.77 MHz) spectra of 2-deoxystreptamine at a range of pD (dilution 0.631–0.369 M from pD 2.28 to 12.00, hence the observed decrease in the signal intensity), measured relative to TMSP in 99.97% D2O at 25 °C; C-1/3, C-2, C-4/6, and C-5 marked with the arrows. Using a relaxation delay (d1) of 2s and 512 transients, the acquisition time was ∼30 min for each spectrum.
3. Discussion
The pKa values of the individual amino groups of tobramycin, kanamycin B, amikacin, sisomicin, and netilmicin were determined using chemical shift (δ) variation with 1H, 13C, and 15N HMBC NMR spectroscopy. The chemical shifts of 1H, 13C, and 15N of these natural products depend on their chemical environment. Consequently, the gradual change in acidity or basicity leads to subtle alterations in their chemical shifts. The ionization constants were measured for every amine on each polyamine-type aminoglycoside alkaloid. Unambiguous assignments were made for each individual proton, carbon, and amine substituent on these clinically important aminoglycoside antibiotics using combinations of 1H, 13C, HSQC, HMBC, NOESY, and 15N HMBC NMR spectroscopy. Where the proton and carbon signals overlap, 1H–13C HSQC was used to determine the chemical shifts of each of the protons and carbons (see Figure 9B). These chemical shifts were then plotted against the pH; the pKa values were extracted from the inflection points of these sigmoidal curves. The reason for using NMR spectroscopy rather than potentiometry or UV spectrophotometry is that NMR spectroscopy is a powerful technique for separating and measuring the distinct pKa values of the similar amino groups located around the aminoglycosides. The NMR signals measured at low pH are diagnostic of the (>99%) protonated forms of these amino substituents, ammonium ions. Likewise, the signals obtained at high pH indicate the (>99%) free-base amines on these alkaloids. The key 1H and 15N NMR peaks (from protons located on the carbon atom adjacent to the amine of interest) shift downfield (to higher ppm) with decreasing pH. Correspondingly, the 1H and 15N NMR spectroscopic data associated with each amine free-base functional group resonated at lower chemical shifts (ppm) than for its conjugate protonated amine salt. However, the reverse is true for the 13C chemical shifts. This phenomenon is due to the change in the electron transition type at the nitrogen from n → π* to σ → π*, therefore the ΔE will increase. However, the σp will decrease and, as was indeed observed, shielding resulted.18
The use of D2O instead of H2O as a solvent is a routine procedure for NMR spectroscopy, including for in situ NMR titration. However, the use of D2O raises the problem of the relationship between the pKa values measured in D2O and in H2O.10 The comparisons of pH and pD determined data are not straightforward because the binding affinities of protonating groups are, in general, different for H+ and D+. For this reason, the apparent pKa values measured in D2O and expressed using pD, a measure of D+ concentration, are not the same as the corresponding values, measured in H2O and expressed in pH, the well-known measure of H+ concentration. A proposed and widely accepted equation pH = pD – 0.4 is derived for ionic strength I = 0.001 mol dm–3 and 25 °C.19 However, another paper used pH = pD – 0.44 for ionic strength I = 0.01 mol dm–3 and 22 °C and another paper used pH = pD – 0.5 for ionic strength I = 0.1 mol dm–3 and 25 °C.20,21 Although the differences between the subtracted values, 0.4, 0.44, and 0.5, are not large, it has a significant participation in the systematic error, particularly for high ionic strengths and temperatures as the diversity of relationships between pKa (D2O) and pKa (H2O) is both ionic strength and temperature dependent. In these studies, the guidelines for NMR measurements for the determination of high and low pKa values, given in the IUPAC Technical Report, have been followed.22 Therefore, the measured pD values were converted into pH values by the subtraction of 0.5.
Depending on both, the chemical structures and the acid–base properties of tobramycin, kanamycin B, amikacin, sisomicin, and netilmicin, the amino substituents can be classified into three groups: primary amines attached directly to the amino sugar ring (R-NH2), primary aminomethylene groups (R-CH2NH2), and in sisomicin and netilmicin secondary amines (N-methyl and an additional N-ethyl on N-1 in netilmicin) are found. 1H, 13C, and 15N HMBC NMR spectroscopic data indicated that the lowest pKa values were the primary amines (R-NH2) attached directly to the sugar ring. The average pKa value for the primary amines attached directly to the amino sugar ring (R-NH2) using 1H, 13C, and 15N HMBC NMR spectroscopic data is 7.41 and for the primary aminomethylene groups (R-CH2NH2) is 9.09 (see Table 6). This value may well result from the primary aminomethylene groups being less sterically hindered than the primary amines attached directly to the amino sugar rings, respectively.17
Table 6. Average pKa Values of the Individual Nitrogen Atoms of the Indicated Aminoglycosides Determined Using 1H, 13C, and 15N HMBC NMR Spectroscopy.
| individual
nitrogen atoms pKa |
||||||
|---|---|---|---|---|---|---|
| aminoglycoside | N-1 | N-3 | N-2′ | N-6′ | N-3″ | N-4‴ |
| tobramycin | 7.55 | 6.70 | 7.75 | 9.10 | 7.68 | |
| kanamycin B | 8.10 | 6.78 | 7.36 | 8.97 | 7.65 | |
| amikacin | 7.64 | 8.81 | 8.05 | 9.89 | ||
| sisomicin | 7.42 | 6.22 | 8.00 | 9.30 | 8.50 | |
| netilmicin | 8.15 | 6.52 | 8.14 | 9.29 | 8.47 | |
4. Conclusions
1H, 13C, and 15N HMBC NMR spectroscopy is a powerful technique for the measurement of the individual pKa values. Unambiguous assignments have been made for each amine substituent on tobramycin, kanamycin B, amikacin, sisomicin, and netilmicin using variations in the chemical shift. The individual pKa values of netilmicin are reported for the first time. At the concentrations (∼0.9 M) used in these studies, 1H NMR spectroscopy was shown to be less time consuming (2 min per data point) than 13C (20 min per data point) and 15N HMBC (∼45 min per data point) NMR spectroscopy. The NMR equipment used in these studies is now standard for many NMR facilities, where 500 MHz is ubiquitous for small-molecule research. The data were also obtained with a standard BBFO probe (tuneable X-channel). In the last decade, cryoprobes have become far more common in NMR laboratories, increasing the sensitivity of the probe by chilling the receivers with either liquid helium or nitrogen. Typically, a nitrogen-cooled cryoprobe can increase sensitivity by four-fold. The availability of a cryoprobe would therefore increase the S/N. However, the 15N experiments would still be best achieved by 2D methods, although the availability of such a probe may impact on making 1D 13C NMR measurements quicker.
1H NMR spectroscopy is the most preferable method for measuring individual pKa values. These results demonstrate the analysis by NMR techniques of individual amine basicity, which is impossible by other analytical techniques. Therefore, knowing each amine’s basicity in a polyamine can lead to selective functionalization and a more precise knowledge of the molecule at physiological pH can lead to a deeper understanding of SAR.
5. Experimental Section
5.1. Materials and General Methods
Deuterium oxide (D2O), DCl, and NaOD were purchased from Goss Scientific. The purchased DCl was a 20% concentration solution in D2O. NaOD was a 30% concentration solution in D2O. 2-Deoxystreptamine dihydrobromide, tobramycin free base, kanamycin B sulfate, amikacin sulfate, sisomicin sulfate, netilmicin sulfate, potassium hydrogen phthalate, disodium tetra-borate, trimethylsilylpropanoic acid (TMSP), and nitromethane (CH3NO2) were purchased from Sigma-Aldrich (U.K.).
5.2. Instrumentation
The NMR spectra including 1H, 13C, HSQC, HMBC, NOESY, and 15N HMBC were recorded on Bruker Avance III (operating at 500.13 MHz for 1H, 125.77 MHz for 13C, and 50.67 MHz for 15N HMBC) spectrometers at 25 °C. MestReNova and Bruker Topspin have been used for processing the spectra. 1H and 13C chemical shifts (δ) were observed and are reported in parts per million (ppm) relative to trimethylsilylpropanoic acid (TMSP) at 0.00 ppm as an internal reference and 15N HMBC chemical shifts were measured relative to external nitromethane (CH3NO2 in CDCl3 (1:1, v/v) at −511.72 ppm).23 The total recording time differs for each isotope as follows: 2, 20, and ∼45 min per data point for 1H, 13C, and 15N HMBC NMR spectroscopy, respectively.
5.3. Calibration of a 5 mm NMR Tube-pH Electrode
A 5 mm NMR tube-pH electrode purchased from Sigma-Aldrich (U.K.) was used for measuring the pH values. The electrode easily fitted into the 5 mm NMR tubes. Standard buffers of 0.40 M potassium hydrogen phthalate in H2O, pH 4.00, and 0.01 M disodium tetra-borate in H2O, pH 9.18, were used for calibrating the 5 mm NMR tube-pH electrode. All of the measurements were carried out at 25 °C.
5.4. Reproducibility, Errors, and Consistency
The data obtained from these 1H, 13C, and 15N HMBC NMR spectroscopic experiments were determined reproducibly by repetitions (n = 3) using the simple symmetrical diamine 2-deoxystreptamine as a model compound. Similarly, each of the different NMR experiments was then repeated for tobramycin (n = 2) to calculate the errors in the measurement of: pH values, chemical shifts (δ), and pKa values. The majority of the error bars for the pH values and for the chemical shifts were of a similar size as the (small, typical) symbols used to plot the points on the nonlinear sigmoidal curves. Typically, the pKa values were accurate to <±0.1 and sometimes even down to ±0.03. Therefore, having determined by the experiment that the typical size of the errors is small, it was judged that n = 1 was sufficient for obtaining further NMR spectroscopic data for each of kanamycin B, amikacin, sisomicin, and netilmicin. As the chemical shifts of the protons and carbons of 2-deoxystreptamine were not temperature dependent, the pKa values of the amino groups on aminoglycosides will not be affected by increasing the temperature in this typical NMR experiment range. Likewise, the 1H NMR spectroscopic data for 2-deoxystreptamine, measured at 0.630 and 0.157 M, at low pD (∼2), showed that the chemical shifts corresponding to the H-1/3 of 2-deoxystreptamine did not shift with the changing concentration levels. Thus, the pKa values of N-1/3 on 2-deoxystreptamine were not affected by changing their concentrations, at least in this typical NMR concentration range
5.5. pKa Determination Using 1H, 13C, and 15N HMBC NMR Spectroscopy
Aminoglycoside analyte solutions were typically prepared at ∼635 to 525 mg/mL, ∼1.3 to 0.9 M analyte, beginning from an acidic pH and adjusting with 0.5 M NaOD (∼9 × 20 μL) to pH = 14, when the final concentration will have been diluted by ∼33% to ∼0.8 to 0.6 M. The pH values were adjusted using 0.5 M NaOD and 0.5 M DCl. MestReNova and Bruker Topspin were used for the analysis of the recorded spectra. Chemical shifts of 1H, 13C, and 15N HMBC of aminoglycosides at varying pH values were plotted against the pH values. The nonlinear sigmoidal curve and the inflection point of the sigmoidal curve were determined using GraphPad Prism 7 (version 2017), after subtraction of 0.5 to convert the measured pD values into pH values.22 The pKa values of the individual nitrogen atoms of each aminoglycoside are extracted from the inflection points of the sigmoidal curves.
Acknowledgments
We thank the Government of the Kingdom of Saudi Arabia for fully funding this studentship to A.H.A.
The authors declare no competing financial interest.
References
- Seiler N.; Hardy A.; Moulinoux J. P. Aminoglycosides and polyamines: Targets and effects in the mammalian organism of two important groups of natural aliphatic polycations. Prog. Drug Res. 1996, 46, 183–241. 10.1007/978-3-0348-8996-4_5. [DOI] [PubMed] [Google Scholar]
- Armstrong E. S.; Kostrub C. F.; Cass R. T.; Moser H. E.; Serio A. W.; Miller G. H.. Aminoglycosides. Antibiotic Discovery and Development, 2nd ed; Dougherty T. J.; Pucci M. J., Eds.; Springer: Boston, 2012; pp 229–270. [Google Scholar]
- Beale J. M.; Block J.; Hill R.. Organic Medicinal and Pharmaceutical Chemistry, 12th ed; Lippincott, Williams & Wilkins: Philadelphia, 2010; pp 294–300. [Google Scholar]
- Ramirez M.; Tolmasky M. Aminoglycoside modifying enzymes. Drug Resist. Updates 2010, 13, 151–171. 10.1016/j.drup.2010.08.003. [DOI] [PMC free article] [PubMed] [Google Scholar]
- Watkins D.; Norris F.; Kumar S.; Arya D. A fluorescence-based screen for ribosome binding antibiotics. Anal. Biochem. 2013, 434, 300–307. 10.1016/j.ab.2012.12.003. [DOI] [PMC free article] [PubMed] [Google Scholar]
- Moazed D.; Noller H. F. Interaction of antibiotics with functional sites in 16S ribosomal RNA. Nature 1987, 327, 389–394. 10.1038/327389a0. [DOI] [PubMed] [Google Scholar]
- Ogle J. M.; Ramakrishnan V. Structural insights into translational fidelity. Annu. Rev. Biochem. 2005, 74, 129–177. 10.1146/annurev.biochem.74.061903.155440. [DOI] [PubMed] [Google Scholar]
- Kulik M.; Goral A.; Jasiński M.; Dominiak P.; Trylska J. Electrostatic interactions in aminoglycoside–RNA complexes. Biophys. J. 2015, 108, 655–665. 10.1016/j.bpj.2014.12.020. [DOI] [PMC free article] [PubMed] [Google Scholar]
- Geall A. J.; Taylor R. J.; Earll M. E.; Eaton M. A. W.; Blagbrough I. S. Synthesis of cholesteryl polyamine carbamates: pKa studies and condensation of calf thymus DNA. Bioconjug. Chem. 2000, 11, 314–326. 10.1021/bc990115w. [DOI] [PubMed] [Google Scholar]
- Blagbrough I. S.; Metwally A. A.; Geall A. J.. Polyamines. In Measurement of Polyamine pKa Values; Methods in Molecular Biology; Springer Protocols, 2011; Vol. 720, pp 493–503. [DOI] [PubMed] [Google Scholar]
- Dorman D. E.; Paschal J. W.; Merkel K. E. Nitrogen-15 nuclear magnetic resonance spectroscopy. J. Am. Chem. Soc. 1976, 98, 6885–6888. 10.1021/ja00438a020. [DOI] [PubMed] [Google Scholar]
- Köck M.; Junker J.; Lindel T. Impact of the 1H,15N-HMBC experiment on the constitutional analysis of alkaloids. Org. Lett. 1999, 1, 2041–2044. 10.1021/ol991009c. [DOI] [PubMed] [Google Scholar]
- Zeng Z.; Qasem A. M. A.; Woodman T. J.; Rowan M. G.; Blagbrough I. S. Impacts of steric compression, protonation, and intramolecular hydrogen-bonding on the 15N NMR spectroscopy of norditerpenoid alkaloids and their piperidine-ring analogues. ACS Omega 2020, 5, 14116–14122. 10.1021/acsomega.0c01648. [DOI] [PMC free article] [PubMed] [Google Scholar]
- Pagano T. G.; Gong Y.; Kong F.; Tsao R.; Fawzi M.; Zhu T. Structural characterization of the tobramycin–piperacillin reaction product formed at pH 6.0. J. Antibiot. 2011, 64, 673–677. 10.1038/ja.2011.72. [DOI] [PubMed] [Google Scholar]
- Gutiérrez-Moreno N. J.; Medrano F.; Yatsimirsky A. K. Schiff base formation and recognition of amino sugars, aminoglycosides and biological polyamines by 2-formyl phenylboronic acid in aqueous solution. Org. Biomol. Chem. 2012, 10, 6960–6972. 10.1039/c2ob26290h. [DOI] [PubMed] [Google Scholar]
- Cox J. R.; Serpersu E. H. Biologically important conformations of aminoglycoside antibiotics bound to an aminoglycoside 3′-phosphotransferase as determined by transferred nuclear Overhauser effect spectroscopy. Biochemistry 1997, 36, 2353–2359. 10.1021/bi9626822. [DOI] [PubMed] [Google Scholar]
- Krę̇zel A.; Szczepanik W.; Świątek M.; Jeżowska-Bojczuk M. Acid–base versus structural properties of an aminoglycoside antibiotic – sisomicin: NMR and potentiometric approach. Bioorg. Med. Chem. 2004, 12, 4075–4080. 10.1016/j.bmc.2004.05.029. [DOI] [PubMed] [Google Scholar]
- Günther H.NMR Spectroscopy: An Introduction. In Berichte der Bunsengesellschaft für physikalische Chemie; Wiley: Chichester, 1980; pp 368–369. [Google Scholar]
- Glasoe P. K.; Long F. A. Use of glass electrodes to measure acidities in deuterium oxide. J. Phys. Chem. A. 1960, 64, 188–190. 10.1021/j100830a521. [DOI] [Google Scholar]
- Mikkelsen K.; Nielsen S. O. Acidity measurements with the glass electrode in H2O-D2O mixtures. J. Phys. Chem. B. 1960, 64, 632–637. 10.1021/j100834a026. [DOI] [Google Scholar]
- Geraldes C. F. G. C.; Urbano A. M.; Alpoim M. C.; Sherry A. D.; Kuan K. T.; Rajagopalan R.; Maton F.; Muller R. N. Preparation, physico-chemical characterization, and relaxometry studies of various gadolinium (III)-DTPA-bis (amide) derivatives as potential magnetic resonance contrast agents. Magn. Reson. Imaging 1995, 13, 401–420. 10.1016/0730-725X(94)00117-L. [DOI] [PubMed] [Google Scholar]
- Popov K.; Rönkkömäki H.; Lajunen L. H. Guidelines for NMR measurements for determination of high and low pKa values (IUPAC Technical Report). Pure Appl. Chem. 2006, 78, 663–675. 10.1351/pac200678030663. [DOI] [Google Scholar]
- Wishart D. S.; Bigam C. G.; Yao J.; Abildgaard F.; Dyson H. J.; Oldfield E.; Markley J. L.; Sykes B. D. 1H, 13C and 15N chemical shift referencing in biomolecular NMR. J. Biomol. NMR 1995, 6, 135–140. 10.1007/BF00211777. [DOI] [PubMed] [Google Scholar]


