Abstract
Epithelial-to-mesenchymal transitions (EMT) are phenotypic plasticity processes that confer migratory and invasive properties to epithelial cells during development, wound-healing, fibrosis and cancer1–4. EMTs are driven by SNAIL, ZEB and TWIST transcription factors5,6 together with micro-RNAs that balance this regulatory network7,8. Transforming growth factor β (TGF-β) is a potent inducer of developmental and fibrogenic EMTs4,9,10. Aberrant TGF-β signaling and EMT are implicated in the pathogenesis of renal fibrosis, alcoholic liver disease, non-alcoholic steatohepatitis, pulmonary fibrosis, and cancer4,11. TGF-β depends on RAS and mitogen-activated protein kinase pathway inputs for the induction of EMTs12–19. Here we elucidate how these signals coordinately trigger EMTs and integrate them with broader pathophysiological processes. We identify RAS responsive element binding protein 1 (RREB1), a RAS transcriptional effector20,21, as a key partner of TGF-β-activated SMAD transcription factors in EMT. MAPK-activated RREB1 recruits TGF-β-activated SMAD factors to SNAIL. Context-dependent chromatin accessibility dictates the ability of RREB1 and SMAD to activate additional genes which determine the nature of the resulting EMT. In carcinoma cells, SMAD and RREB1 directly drive expression of SNAIL and fibrogenic factors stimulating myofibroblasts, promoting intra-tumoral fibrosis and supporting tumour growth. In mouse epiblast progenitors, TGF-β/Nodal with RREB1 induce expression of SNAIL and mesendoderm differentiation genes that drive gastrulation. Thus, RREB1 provides a molecular link between RAS and TGF-β pathways for coordinated induction of developmental and fibrogenic EMTs. These insights provide a better understanding of epithelial plasticity regulation and its pathophysiological consequences in development, fibrosis and cancer.
EMT induction by TGF-β requires RAS signaling
Oncogenic mutations in KRAS are prevalent in pancreatic adenocarcinoma (PDA) and strongly potentiate the induction of EMT by TGF-β12. We transduced an inducible KRASG12D oncogene into pancreatic epithelial organoids from Pdx1-Cre; Cdkn2afl/fl; lox-stop-lox (LSL)-YFP (CIY) mice (Fig. 1a), and treated organoids with either TGF-β or SB505124 (SB)22 which blocks endogenous TGF-β signaling. With KRASG12D expression off, TGF-β caused a modest (4-fold) increase in Snai1 and did not alter organoid morphology or survival. With KRASG12D on, TGF-β induced a 30-fold increase in Snai1 (encoding SNAIL) (Fig. 1b), followed by a drop in E-cadherin, gain in ZEB1, organoid dissociation (Fig. 1c, Extended Data Fig. 1a), and apoptosis (Supplemental Information Movie 1), all characteristic of a lethal EMT12. Induction of Smad7 expression, a conserved TGF-β negative feedback response, was independent of KRASG12D (Fig. 1b). TGF-β modulated the expression of 56 genes >4-fold and KRASG12D augmented TGF-β induction of 13 of these genes (Extended Data Fig. 1b,c) including Snai1 and hyaluronan synthase 2 (Has2), known regulators of EMT23 (Extended Data Fig. 1d). We confirmed this response pattern in different pancreatic organoids and primary cultures (Extended Data Fig. 1e,f). These TGF-β responses required SMAD4, as determined in PDA cells with restored SMAD4 expression (Extended Data Fig. 1g).
Figure 1. RREB1; a KRAS-dependent SMAD cofactor.
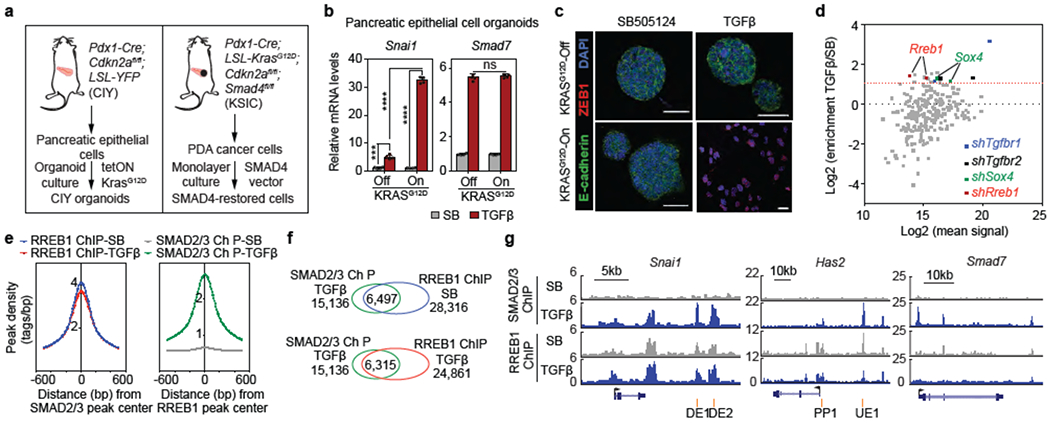
(a) Schematic of source and generation of CIY pancreatic epithelial organoids and SMAD4-restored PDA cells. (b) Snai1 and Smad7 mRNA levels in pancreatic epithelial organoid cultures. Cells engineered to express KRASG12D under doxycycline control treated with TGF^/Nodal receptor inhibitor SB505124 (SB, 2.5 μM) or TGF-β (10 pM) for 1.5 h. Mean ± s.d. n=4, two-way ANOVA analysis, ****, p<0.0001. (c) E-cadherin, ZEB1 and DAPI immunofluorescence images of CIY pancreatic organoids +/− KRASG12D treated with SB or TGF-β for 2.5 days. Scale bars, 30 μm. Images are representative of two independent experiments. (d) Screening of pancreatic progenitor transcription factor shRNA library for mediators of TGF-β-induced lethal EMT. Dot plot of shRNA enrichment in TGF-β-treated versus SB-treated SMAD4-restored PDA cells. Sox412 and Rreb1 transcription factors scoring positive in the screen. shRNAs targeting Tgfbr1 and Tgfbr2 included as positive controls. (e) Position of RREB1 peak summits relative to summits of overlapping SMAD2/3 peaks (left), and position of SMAD2/3 peak summits relative to summits of overlapping RREB1 peaks (right), based on ChIP-seq analysis in Extended Data Figure 2d. (f) Venn diagram depicting overlap between SMAD2/3 and RREB1 ChIP-seq peaks, based on ChIP-seq analysis in Extended Data Figure 2d. (g) Gene track view of SMAD2/3 and HA-RREB1 ChIP-seq tags at indicated loci and experimental conditions. Gene bodies represented at bottom of track sets. PP: proximal promoter; DE: downstream enhancer; UE: upstream enhancer. ChIP-seq was performed once and an independent ChIP was performed in which selective genomic regions were confirmed by quantitative PCR (qPCR). See also Extended Data Figure 1–3 and Supplemental Information Movie 1.
RREB1 as a KRAS-dependent SMAD cofactor in EMT
TGF-β binding to the receptor kinases TGFBR1/TGFBR2 activates SMAD2/3/4 trimeric complexes, which target specific promoters and enhancers by interacting with context-determining transcription factors9. SMAD2/3 chromatin immunoprecipitation and DNA sequencing (ChIP-seq) in PDA cells treated with TGF-β revealed binding motifs for various RAS transcriptional effectors (FOS and JUN AP-1 components, ELK3) and the SMAD binding motifs CAGAC and 5GC24 within SMAD2/3 peaks independently of KRASG12D (Extended Data Fig. 1h–j). Notably, RREB1 motifs were specifically enriched within SMAD2/3 peaks in KRASG12D-dependent TGF-β targets (Extended Data Fig. 1h). Although EMT is generally pro-tumourigenic in carcinoma cells, in KRAS-mutant pancreatic progenitors TGF-β triggers apoptosis due to simultaneous induction of SNAIL and the pro-epithelial transcription factor SOX412. Leveraging this property, we screened an shRNA library targeting 40 transcription factors expressed in PDA cells and shRNAs targeting the TGF-β receptors as positive controls (Fig. 1d). Rreb1 and Sox4 were the only transcription factors with two independent shRNAs enriched over two-fold (Fig. 1d).
RREB1 is a 15 zinc-finger protein21 with little known about its function and regulation25–27. In SMAD4-restored PDA cells expressing HA-tagged RREB1 (1-1291 mouse isoform) (Extended Data Fig. 2a), ligation assays showed close proximity between nuclear RREB1 and SMAD2/3 upon TGF-β treatment (Extended Data Fig. 2b,c). Co-immunoprecipitation revealed interactions between SMAD3 and HA-RREB1 (Extended Data Fig. 2d). The genome binding pattern of HA-RREB1 overlapped with that of SMAD2/3 in TGF-β treated cells (Fig. 1e,f, Extended Data Fig. 2e), including in Snai1 and Has2 but not in Smad7 (Fig. 1g). HA-RREB1 bound to these loci without TGF-β signaling (Fig. 1e–g, Extended Data Fig. 2e). MAPK signaling has been implicated in RREB1 regulation28. Treatment of SMAD4-restored PDA cells with ERK inhibitor SCH772984 (ERKi) or MEK inhibitor AZD6244 (MEKi) did not alter nuclear localization (Extended Data Fig. 3a) or levels of RREB1 (Extended Data Fig. 3b,c) but diminished binding of HA-RREB1 to Snai1, Has2 and Il11 cis-regulatory regions (Extended Data Fig. 3d). HA-RREB1 immunoprecipitated from PDA cell lysates bound dsDNA probes corresponding to Snai1 enhancer and Has2 promoter regions; ERKi decreased this activity (Extended Data Fig. 3e). In HA-RREB1 immunoprecipitated from SMAD4-restored PDA cells, we identified four ERK-dependent phosphorylation sites (Extended Data Fig. 3f,g), all situated between zinc-finger domains (Extended Data Fig. 3h). S161 and S970 fit the MAPK motif PX(S/T)P, whereas S1138 and S175 conceivably represent indirect phosphorylation by other kinases. RREB1 with S161 or S970 alanine substitutions was deficient in restoring Snai1 and Has2 TGF-β responses to Rreb1-KO cells and in binding to these loci, compared to vectors encoding RREB1 with aspartate (phospho-mimic) substitution (Extended Data Fig. 3i,j).
RREB1 mediates RAS- and TGF-β-dependent EMT
Rreb1 knockout (KO) in SMAD4-restored PDA cells (Extended Data Fig. 4a–c) diminished the TGF-β dependent binding of SMAD2/3 to regulatory regions in Snai1 and Has2, and abolished their induction and EMT (Fig. 2a–c, Extended Data Fig. 4d,e). Rreb1 KO had limited effects on binding of SMAD2/3 to, and induction of Smad7 (Fig. 2c, Extended Data Fig. 4f). Restoration of RREB1 rescued induction of Snai1, Has2 and Il11 by TGF-β in KO cell lines (Extended Data Fig. 4g).
Figure 2. RREB1 mediates KRAS and TGF-β dependent EMT.
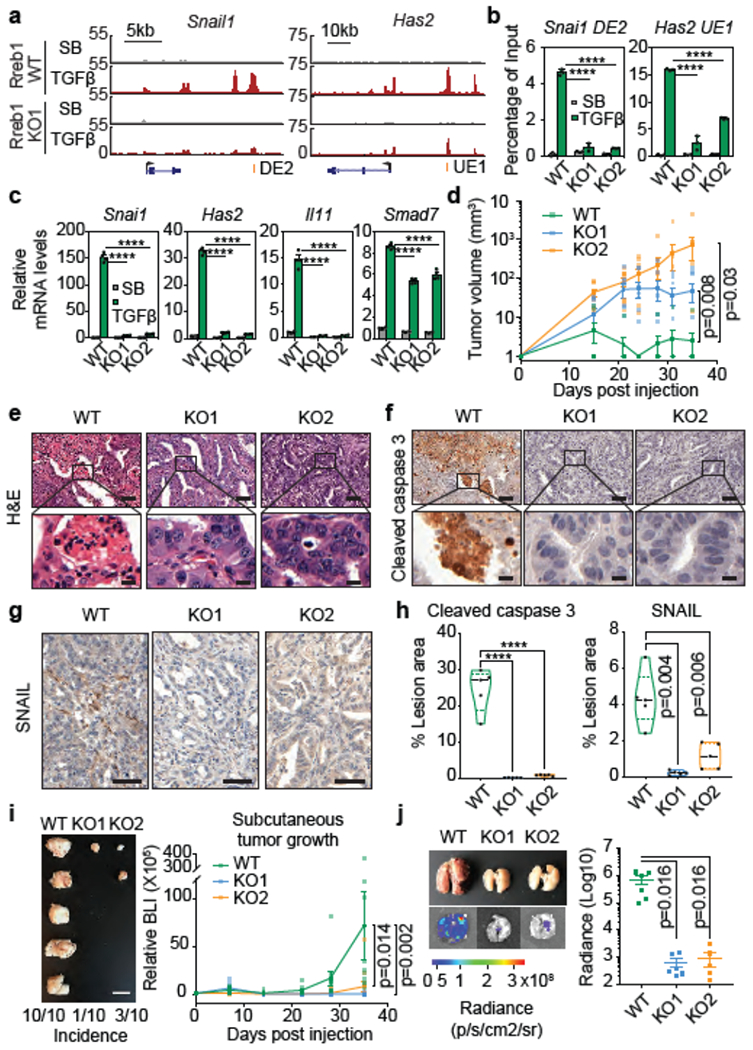
(a) Gene track view of SMAD2/3 ChIP-seq tags at indicated loci of RREB1 WT and KO SMAD4-restored mouse PDA cells. Gene bodies represented at the bottom of track sets. DE: downstream enhancer, UE: upstream enhancer. ChIP-seq was performed once and an independent ChIP was performed in which selected genomic regions were confirmed by qPCR. (b) ChIP-PCR analysis of SMAD2/3 binding to indicated sites of Snai1 (DE2) and Has2 (UE1) in RREB1 WT and KO PDA cells after treatment with SB (2.5 μM) or TGF-β (100 pM) for 1.5 h. Mean ± s.e.m. n=4, two-way ANOVA analysis, ****, p<0.0001. (c) Levels of Snai1, Has2, Il11, and Smad7 in RREB1 WT and KO PDA cells after treatment with SB (2.5 μM) or TGF-β (100 pM) for 1.5 h. Mean ± s.e.m. n=4, two-way ANOVA analysis, ****, p<0.0001. (d) Volume of RREB1 WT and KO SMAD4-restored PDA tumours after subcutaneous inoculation in syngeneic FVB mice. Mean ± s.e.m. n=10 tumours, 5 mice per group, two-way ANOVA analysis. (e,f) Representative hematoxylin and eosin staining (e), cleaved caspase-3 immunohistochemistry (IHC) (f) and SNAIL IHC (g) images of subcutaneous tumours formed by RREB1 WT and KO SMAD4-restored PDA cells 35 days after inoculation. Scale bars (e-f) upper panels, 50 μm; (e-f) lower panels, 10 μm; (g) 50 μm. (e-g) Images are representative of five biological replicates. (h) Quantification of cleaved caspase-3-positive and SNAIL-positive cells in PDA tumour sections. n=5 per group, two-tailed unpaired t test. ****, p<0.0001. Violin plots: midline, median; dotted lines, 25% and 75% quartiles. (i) Images of subcutaneous tumours formed by RREB1 WT or KO 393T3 lung adenocarcinoma cells in syngeneic B6129SF1/J mice excised 35 days after inoculation. Scale bars of left panel, 10 mm. Tumour growth monitored by firefly luciferase bioluminescence imaging (BLI) plotted over time (right panel). Mean ± s.e.m. n=10 tumours, 5 mice per group, two-way ANOVA analysis, (j) Representative ex vivo brightfield and BLI of lungs from mice inoculated via tail vein to test lung colonizing activity of RREB1 WT or KO 393T3 cells. Lungs excised and imaged 21 days after inoculation. Lung colonization load was determined by quantitative BLI. Mean ± s.e.m. n=6 mice per group, two-tailed unpaired t test. See also Extended Data Figure 4–6.
The induction of lethal EMT by TGF-β in KRAS-mutant pancreatic progenitor cells is a barrier to PDA development12. SMAD4-restored PDA cells grew poorly as subcutaneous tumours in mice (Fig. 2d), were undifferentiated (Fig. 2e) and contained cells expressing apoptosis markers (Fig. 2f,h) and SNAIL (Fig. 2g–h). In contrast, Rreb1 KO cells had higher tumorigenic activity (Fig. 2d), with well-differentiated epithelial histology (Fig. 2e) and few apoptotic (Fig. 2f,h) or SNAIL+ cells (Fig. 2g–h). Notably, RREB1 is down-regulated in human PDA25 and mutated in approximately 5% of PDA cases20.
Activating KRAS mutations define a major subtype of human lung adenocarcinoma (LUAD). 393T3 cells derived from a KrasG12D;p53−/− mouse LUAD tumour29 showed ERK-dependent induction of Snai1 and Has2 by TGF-β, followed by EMT without apoptosis (Extended Data Fig. 5a–e). Rreb1 knockout inhibited the induction of EMT by TGF-β and acutely diminished growth of 393T3 as subcutaneous tumours and pulmonary metastatic colonies in mice (Fig. 2i,j, Extended Data Fig. 5f–j). In A549 cells, a KRAS-mutant human LUAD cell line30, RREB1 knockout (Extended Data Fig. 6a) diminished SNAI1, SNAI2 (encoding SLUG) and EMT responses to TGF-β, and inhibited tumour formation in mice (Extended Data Fig. 6b–d). Collectively, the results indicate that RREB1 mediates TGF-β-induced EMT in PDA and LUAD models independently of the tumorigenic phenotype associated with EMT.
EMT-associated fibrogenic program
The KRAS-dependent TGF-β response in pancreatic cancer progenitors showed enrichment for cell adhesion, migration, and EMT gene signatures (Extended Data Fig. 6e). Notably, a majority of 13 KRAS-dependent TGF-β–induced genes were related to deposition of fibrous connective tissue (Extended Data Fig. 1d). Four genes encode inducers of extracellular matrix (ECM) production by mesenchymal cells in fibrosis, including interleukin 11 (IL-11) in cardiovascular and renal fibrosis31, connective tissue growth factor (CTGF/CCN2) in glomerulonephritis32, WNT-inducible signaling pathway protein 1 (WISP1/CCN4) in idiopathic pulmonary fibrosis33, and platelet-derived growth factor B (PDGFB) in hepatic fibrosis34. The gene set additionally includes ECM proteins laminin α3 (Lama3), collagen 6α1 (Col6a1), collagen and calcium-binding EGF domain-containing protein 1 (Ccbe1), and the ECM protease inhibitor serpin E1 (Serpine1).
Induction of Il11, Wisp1, Serpine1, Pdgfb, Ccbe1 and Cola61 by TGF-β in mouse PDA cells required RREB1 (Fig. 3a, Extended Data Fig. 6f). RREB1 ChIP peaks overlapped with SMAD2/3 peaks in these genes (Fig. 3b). In PDA cells, TGF-β induced Snai1 and Zeb1 expression with typical kinetics35 (Extended Data Fig. 6g), and depletion of SNAIL and ZEB1 (Extended Data Fig. 6h,i) inhibited EMT but not fibrogenic gene responses (Extended Data Fig. 6j–m), showing that these gene responses are integral, though experimentally separable components of a common fibrogenic EMT program. Similar RREB1-dependent induction of these fibrogenic genes, Snai1 and Has2 by TGF-β occurred in 393T3 and A549 LUAD cells (Fig. 3a,c). 393T3 pulmonary nodules showed marked presence of cancer-associated myofibroblasts and abundant collagen deposition, whereas time-matched, size-matched Rreb1 KO 393T3 nodules did not (Fig. 3d–e). Thus, TGF-β-activated SMADs converge with RAS-activated RREB1 to drive fibrogenic EMTs in PDA and LUAD cells.
Figure 3. RREB1 mediates a TGF-β fibrogenic response.
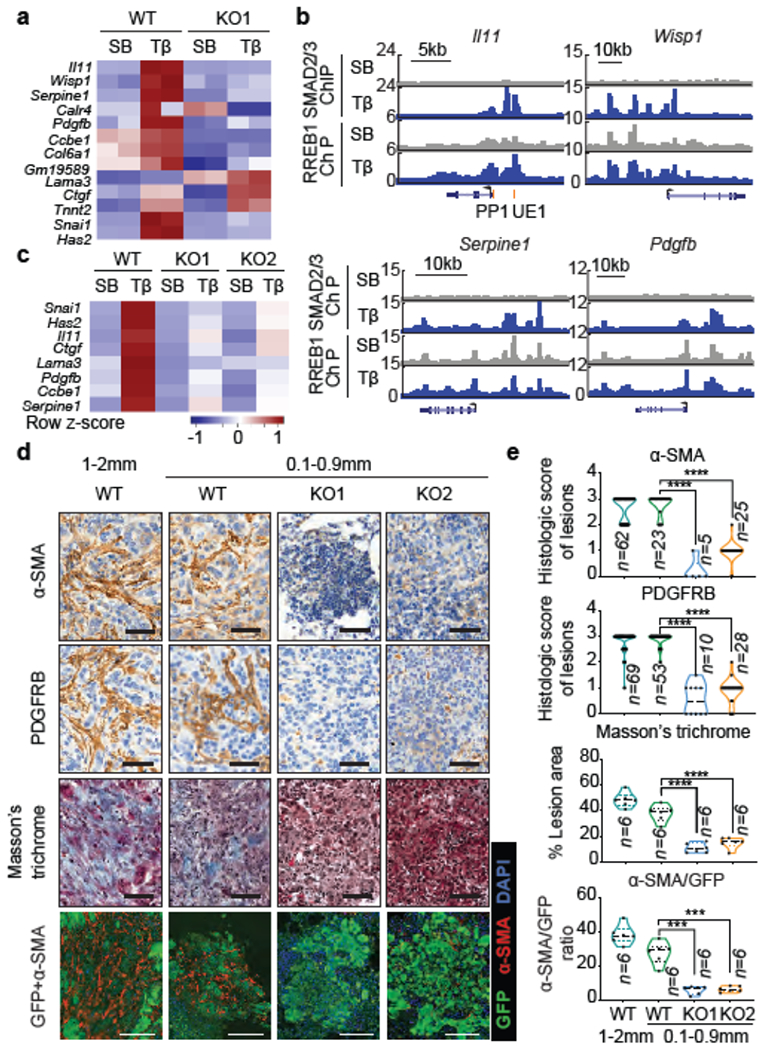
(a) Heatmap of fibrogenic gene responses in RREB1 WT and KO PDA cells after treatment with SB or TGF-β for 1.5 h. n=2. (b) Gene track view of SMAD2/3 and HA-RREB1 ChIP-seq tags at indicated loci and experimental conditions. Gene bodies represented at bottom of track sets. PP: proximal promoter; UE: upstream enhancer. ChIP-seq was performed once and an independent ChIP was performed in which selective genomic regions were confirmed by qPCR. (c) Heatmap representation of fibrogenic genes in RREB1 WT and KO 393T3 cells treated with SB or TGF-β for 1.5 h. n=4. (d) Representative images of α-SMA and PDGFRB IHC, Masson’s trichrome stain, and α-SMA/GFP immunofluorescence of colonized lung tissue after tail vein injection of WT or Rreb1 KO GFP+ 393T3 cells. Scale bars, 100 μm. (e) Quantification of staining in (d). n for each group indicated in graph, two-tailed unpaired t test. ****, p<0.0001; ***, p<0.001. Violin plots: all data points, midline, median; dot lines, 25% and 75% quartiles. See also Extended Data Figures 6 and 7.
Mammary ductal morphogenesis involves EMT36, and mammary epithelial cells undergo EMT in response to TGF-β37. EMT induction by TGF-β in normal mouse mammary gland (NMuMG) cells 38,39 requires ERK40 and RREB1 (Extended Data Fig. 7a–c). RREB1 mediated SMAD2/3 binding to the Snai1 locus, and to a lesser extent, the Has2 locus, and induction of these genes by TGF-β (Extended Data Fig. 7d–f). ERKi diminished binding of HA-RREB1 to regulatory regions of Snai1 and Has2 in NMuMG cells (Extended Data Fig. 7g). The ERK pathway activator epidermal growth factor (EGF) increased, and ERKi suppressed these gene responses, whereas an EGFRi had little effect on basal Snai1 and Has2 expression (Extended Data Fig. 7h), indicating that RREB1 is required for TGF-β-induced EMT in normal mammary epithelial cells.
Contextual EMT coupling to developmental and fibrogenic programs
Next, we investigated the role of RREB1 during gastrulation, whereby pluripotent epiblast cells undergo an EMT as they migrate and differentiate. Nodal, FGF, and WNT signals drive mesendodermal differentiation and EMT in epiblast cells1,3,4. In a spatially resolved RNA-seq dataset41 Rreb1 transcripts accumulated in the posterior, primitive streak (PS) domain, at mid-gastrulation (embryonic day (E) 7.0) (Extended Data Fig. 8a), and overlapped with mesendoderm markes Gsc and Brachyury/T, and EMT markers Snai1 and Cdh2 (N-cadherin) (Extended Data Fig. 8a). Mouse embryonic stem cells (ESCs) form embryoid bodies (EBs) recapitulating signaling and lineage specification events of gastrulation42. Expression of the mesendoderm genes Eomes, Mixl1, Brachyury (T), Goosecoid (Gsc), Fgf8 and Wnt3 gradually increased after two days of EB differentiation, peaking on day 4 together with EMT drivers Snai1, Twist1, Twist2 and Zeb2, and Cdh2 (Fig. 4a, Extended Data Fig. 8b). EMT, stem cell differentiation, and gastrulation transcriptional signatures were enriched in parallel (Fig. 4b). Rreb1 knockout (Extended Data Fig. 8c) inhibited the expression of Snai1 and key mesendoderm genes (Extended Data Fig. 8d). Addition of Activin A (ligand for Nodal receptors) to Day3 EBs augmented the expression of mesendoderm and Snai1 genes in WT but not Rreb1-KO EBs (Extended Data Fig. 8e).
Figure 4. RREB1 and SMAD regulate distinct context-dependent EMTs.
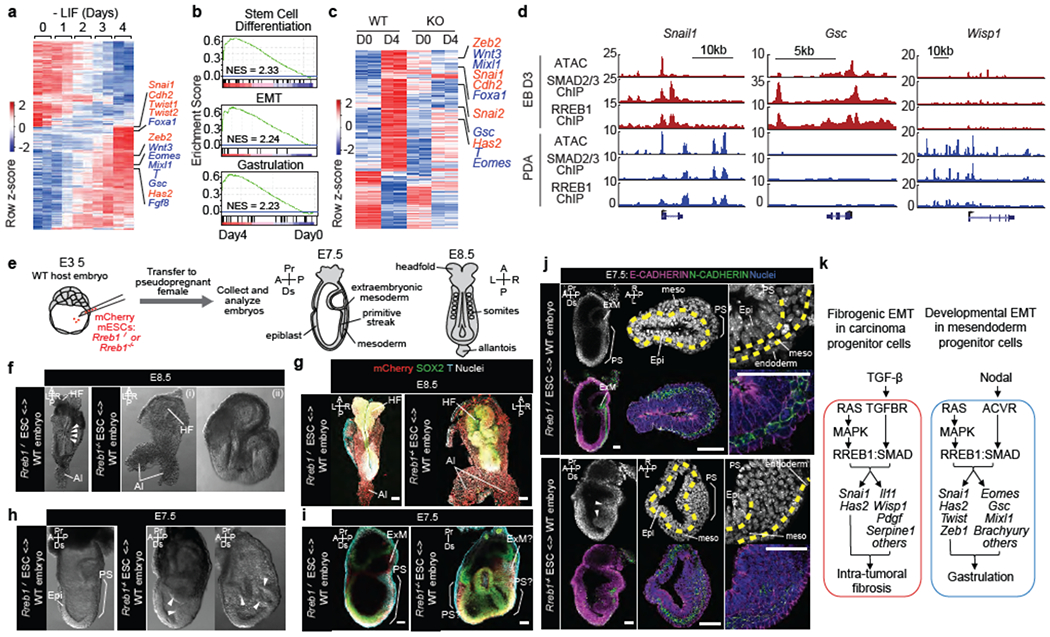
(a) Heatmap representing transcripts up- or down-regulated during embryoid body (EB) differentiation. RNA-seq was performed at indicated times after shifting ESCs into differentiation medium (−LIF). EMT (red) and mesendoderm lineage genes (blue) are highlighted. n=2. (b) Gene set enrichment analysis (GSEA) for EMT, stem cell differentiation and gastrulation signatures in Day 4 EBs. (c) Transcripts exhibiting extensive up- or down-regulation (fold change > 4 or < 0.25) in WT and RREB1 KO cells, on Day4 relative to Day0 of differentiation. n=2. (d) Gene track view of ATAC-seq, and SMAD2/3 and RREB1 ChIP-seq tags at indicated loci, in Day3 EBs (red tracks) versus TGF-β treated (1.5 h) PDA cells (blue tracks). ATAC-seq and ChIP-seq were performed once. Independent ATAC and ChIP were performed in which selected genomic regions were confirmed by qPCR. (e) Chimeras generated by injecting wild-type (WT) Rreb1+/+ or mutant Rreb1−/− mCherry tagged ESCs into WT mouse blastocysts were transferred to pseudopregnant females and dissected at E7.5-E8.5. (f,h) Brightfield images of WT and Rreb1−/− chimeric embryos at E8.5 (f) and E7.5 (h). Rreb1−/− chimeras displayed morphological defects. Arrowheads in (f), somites. Arrowheads in (h), abnormal accumulation of cells within epiblast. (g,i,j) Confocal images of wholemount immunostained chimeras. (g) Maximum intensity projections of E8.5 chimeras. Rreb1−/− chimera shows abnormal neurectoderm development and axis duplication (double allantois). (i) Sagittal section showing Brachyury expression in multiple regions and extensive epiblast folding and multiple cavities in Rreb1−/− chimera (right panel). Due to abnormal morphology, anterior-posterior orientation of the embryo was not possible, (j) Sagittal sections of whole chimeras and representative sections through primitive streak region. Arrowheads, abnormal epiblast folding. Yellow dashed lines, boundary between epiblast and mesoderm. Brackets, primitive streak. HF, headfold; NT, neural tube; Al, allantois; Epi, epiblast; PS, primitive streak; ExM, extraembryonic mesoderm; meso, mesoderm; A, anterior; P, posterior; Pr, proximal; Ds, distal; L, left; R, right. Scale bars, 50 μm. (f-j) Images are representative of two independent experiments. (k) Summary of RAS-dependent TGF-β or Nodal effects, coordinately triggered by cooperation between RREB1 and SMAD2/3 to activate EMT and associated contextual programs in carcinoma progenitors and pluripotent embryonic cells. Principal RREB1/SMAD2/3 target genes in each program and context are indicated. See also Extended Data Figures 8–10.
RNA-seq analysis of WT and Rreb1 KO ESCs under pluripotency conditions (Day0) and after 4 days of EB differentiation (Day4) showed few differences between WT and KO cells on Day0, but lack of differentiation on Day4 (Fig. 4c), together with an absence of stem cell differentiation, EMT, and gastrulation gene signatures (Extended Data Fig. 8f). Nodal/Activin receptors signal through SMAD2/39. SMAD2/3 ChIP-seq peaks in Day3 EBs overlapped with HA-RREB1 ChIP peaks genome-wide (Fig. 4d, Extended Data Fig. 9a–c), providing evidence for direct cooperation of SMADs and RREB1 in mesendoderm differentiation and EMT.
Using ATAC-seq to determine chromatin accessibility revealed distinct profiles but shared a major peak on the Snai1 promoter43 in EBs and PDA cells, which exhibited a conserved pattern of SMAD2/3 and RREB1 binding. The ATAC profile overlapped with the SMAD2/3 and RREB1 ChIP profiles on Day3-EB differentiation genes, and Wisp1 and Serpine1 (Fig. 4d, Extended Data Fig. 9c). ATAC-seq revealed low chromatin accessibility at Gsc and Mixll in PDA cells, and at Wisp1 and Serpine1 in EBs, suggesting that different chromatin accessibility patterns enable SMAD2/3 and RREB1 access to Snai1 and Has2, but with contextual restriction from fibrogenic and mesendoderm loci.
RREB1 deficiency leads to gastrulation defects
To determine whether RREB1 regulates gastrulation in vivo, we assessed the development of chimeric embryos comprising Rreb1−/− ESCs (Fig. 4e). While Rreb1+/+ chimeras generally developed normally, the majority (~75%) of Rreb1−/− ESC-containing embryos exhibited severe morphological abnormalities (Extended Data Fig. 10a,b). At E8.5, we observed aberrant development of neuroectoderm, comprising irregular neural plate folding (Fig. 4f,g) and disproportionate and bilaterally asymmetric headfolds (Extended Data Fig. 10c), defective intersomitic boundaries (Fig. 4f), and ectopic somite-like structures (Extended Data Fig. 10d). Some mutant chimeras were so defective that specific structures including the primitive streak (PS) and anterior-posterior axis could not be discerned (Fig. 4f). We also noted axis duplications, including duplications of the epiblast (Extended Data Fig. 10c), posterior derivatives including the allantois (Fig. 4f), and anterior derivatives including the headfolds (Extended Data Fig. 10c,e).
At E7.5, approximately 75% of mutant embryo chimeras were developmentally retarded or morphologically abnormal (Extended Data Fig. 10a–b, f). Like WT embryos, chimeras containing WT ESCs formed a PS and expressed markers of differentiation and EMT (Fig. 4h–j, Extended Data Fig. 10f). While mutant embryo chimeras expressed T/Brachyury and SNAIL within the PS and nascent mesoderm (in both WT and Rreb1−/− cells), they frequently showed an accumulation of cells in the posterior epiblast resulting in bulges into the amniotic cavity and/or a folded epiblast layer containing multiple cavities (Fig. 4h–i, Extended Data Fig. 10f–g), defects characteristic of gastrulation failure. No difference was discerned in the number of mitotic or apoptotic cells between WT versus mutant embryo chimeras (Extended Data Fig. 10h–i).
In WT embryos and chimeras, there was an E-to-N-cadherin switch as cells ingress through the PS (Fig. 4j). In mutant embryo chimeras, cells within the aberrant bulges/folds continued expressing E-cadherin and either did not strongly upregulate N-cadherin (Fig. 4j) or co-expressed both cadherins, with some embryos exhibiting ectopic N-cadherin within the posterior epiblast (Extended Data Fig. 10j). Together these data demonstrate that mutant cells do not undergo a proper EMT at the PS, resulting in gastrulation defects. Notably, Rreb1 mutant cells did not exhibit an absolute EMT block. Considering EMT a continuum of states4, several including Nodal- and RREB1-dependent EMT may be amalgamated temporally and spatially within the embryo44,45.
Discussion
The present work reveals how TGF-β and RAS-MAPK signals acting jointly through SMAD and RREB1 transcription factors trigger EMTs in different contexts (Fig. 4k). With 15 zinc fingers and large inter-domain regions, RREB1 likely coordinates interactions between DNA, SMAD proteins and other cofactors42,46,47. RREB1 is an understudied RAS effector whose structural and functional properties and genetic alterations warrant further attention. EMT and mesendoderm differentiation are entwined events during gastrulation1,4,48, and our results shed light on this link. SMADs with RREB1 directly regulate the expression of EMT transcription factors and mesendoderm genes in pluripotent progenitors, and of EMT transcription factors and fibrogenic factors in carcinoma cells. The induction of SNAIL and fibrogenic mediators are biologically coordinated but experimentally separable processes. This level of coordination is distinct from, and adds to the role of SNAIL as inducer of downstream fibrogenic signals in renal fibrosis49,50. EMTs can couple to either morphogenic or fibrogenic events depending on context, and our evidence points at an epigenetic basis for this contextual nature of EMTs. The generality of the TGF-β-SMAD-RREB1 mechanism as a trigger of diverse EMTs provides common ground for the analysis of EMTs in developmental and regenerative processes and paves the way for a better understanding of the role of TGF-β in the pathogenesis of organ fibrosis and cancer.
METHODS
Cell lines
All cell lines and organoid lines were maintained at 37°C and 5% CO2. To circumvent the very limited replication potential of wild type pancreatic ductal epithelial cells and the senescence induced by KrasG12D expression in these cells we used mice harboring a Cdkn2afl/fl (or p16Ink4afl/fl) allele. Cdkn2 deletion in the pancreatic epithelium by Pdx1-driven expression of Cre mitigates these limitations and facilitates the analysis of KrasG12D effects in pre-malignant pancreatic epithelial progenitors and organoids. Primary pancreatic epithelial cells were cultured with DMEM/F12 medium supplemented with 5 mg/mL D-glucose (Sigma), 0.1 mg/mL soybean trypsin inhibitor type I (Sigma), 5 mL/L insulin-transferrin-selenium (ITS+; BD Biosciences), 25 μg/mL bovine pituitary extract (BD Biosciences), 20 ng/mL epidermal growth factor (EGF) (BD Biosciences), 5 nM 3,3′,5-triiodo-L-thyronine (Sigma), 1 μM dexamethasone (Sigma), 100 ng/mL cholera toxin (Sigma), 10 mM nicotinamide (Sigma), 5% Nu-serum IV culture supplement (Collaborative Biomedical Products), and 100 units/mL penicillin and 100μg/mL streptomycin, 0.25 μg/mL amphotericin B. Cells were grown on 2.3 mg/mL rat tail collagen type I (BD Biosciences)51. Pancreatic organoids were embedded in Matrigel (Corning) with Advanced DMEM/F12 (GIBCO) supplemented with B-27 (Life Technologies), 1.25 mM N-acetyl-cysteine (Sigma), 10 nM Gastrin (Sigma), 50 ng/mL EGF (Thermo Fisher), 100 ng/mL R-spondin-1 (Peprotech), 100 ng/mL Noggin (Peprotech), 100 ng/mL FGF-10 (Peprotech), 10 mM nicotinamide (Sigma), 2.5 μM SB-505124 (Sigma), 20 μg/mL Primocin (Invivogen), as previously described52. Organoids were cultured in medium without EGF (LITE medium), and with 0.5 μM gefitinib for 12 h before 6h SB or 1.5 h TGF-β treatment. Pancreatic oncospheres were grown in ultra-low attachment dishes (Corning) in DMEM supplemented with B-27, 5 μg/mL heparin (Sigma), 1 mM sodium pyruvate (GIBCO), 100 units/mL penicillin and 100 μg/mL streptomycin. mESCs E14Tg2a.IV were cultured on 0.1% gelatin (Millipore) coated plates with leukemia inhibitory factor (LIF)-supplemented ESC medium42,53. Basic ESC medium included 80% Knockout DMEM (Life Technologies), 15% FBS (HyClone), 50 units/mL penicillin and 50 μg/mL streptomycin, 1% non-essential amino acids (Life Technologies), 1% L-glutamine (Life Technologies), 100 μM β-mercaptoethanol (Sigma-Aldrich), 103 units/mL mouse LIF (Gemini Bio-Products). Embryoid body assays were carried out in ultra-low attachment dishes with ESC medium without LIF. KRASG12D;Ink4a/Arf−/−;SMAD4−/− mouse PDA-806 cells were provided by N. Bardeesy (Bardeesy et al., 2006). Pancreatic organoids were generated as previously described (Boj et al., 2015). 393T3 Kras/p53-mutant mouse lung adenocarcinoma cells were provided by T. Jacks29.
Mouse pancreatic cell lines, mous (393T3) and human (A549) lung adenocarcinoma cell lines and 293T human embryonic kidney cells were cultured in DMEM supplemented with 10% fetal bovine serum (FBS), 2 mM L-glutamine, 100 units/mL penicillin and 100μg/mL streptomycin (all from GIBCO). NMuMG mouse mammary epithelial cells were cultured in DMEM supplemented with 10% FBS, 10μg/mL insulin (Sigma), 2 mM L-glutamine, 100 units/mL penicillin and 100 μg/mL streptomycin.
Animal studies
All animal experiments were conducted in accordance with protocols approved by the MSKCC Institutional Animal Care and Use Committee and were in compliance with the relevant ethical regulations regarding animal research. FVB/NJ mice (Jackson Laboratory, 001800), Athymic NCR nu/nu mice (Envigo, 069), and B6129SF1/J mice (Jackson Laboratory, 101043) were used between 4-7 weeks of age. For subcutaneous injections, 5x10³ PDA cells or 5x10⁴ 393T3 cells in 50 μL matrigel/PBS mixture were injected on two sites per mouse. For tail vein injections, 5x10⁴ cells were delivered in 100 μL PBS. Subcutaneous tumour growth and lung colonization were monitored weekly as previously described by bioluminescence imaging using retro-orbital injection of D-luciferin (150 mg/kg) and IVIS Spectrum instrument (Caliper Life Sciences)54. Data were analyzed using Living Image software v.2.50.
CRISPR-mediated genetic knockouts
CRISPR-mediated knockouts were done by cloning sgRNAs into the pSpCas9(BB)-2A-GFP (PX458) (Addgene #48138) or pSpCas9(BB)-2A-Puro (PX459) (Addgene #48139) vectors55. Sequences of synthesized sgRNA oligos for generating CRISPR-Cas9 mediated knockout:
| Name | Forward | Reverse |
|---|---|---|
| mRreb1. sg1 | gaccggtgctaatcatagctacca | aaactggtagctatgattagcacc |
| mRreb1. sg2 | caccgcctccaggaccaaatcggat | aaacatccgatttggtcctggaggc |
| mRreb1. sg3 | gaccgctcgctgatgcaccgccgt | aaacacggcggtgcatcagcgagc |
| mRreb1. sg4 | gaccgtctcccgtccctgatcggca | aaactgccgatcagggacgggagac |
| mRreb1. sg5 | caccgcagcacaacacagacacggg | aaaccccgtgtctgtgttgtgctgc |
| hRREB1. sg1 | caccgcagcacaacacagacactgg | aaacccagtgtctgtgttgtgctgc |
shRNA screening
A pooled miR-E-based shRNA library was obtained from custom arrays and cloned into SGEP vector. Library was transduced into cells at transduction efficiency of about 10% to ensure single-copy representation of shRNAs. For TGF-β screening, shRNAs were expressed for 3 days prior to addition of SB505124 or TGF-β. To ensure adequate library representation, library was represented by a cell number ≥ (1000 x library size) prior to relevant treatment. Additional procedures were as described56.
Viral transductions
Lentivirus suspensions were produced by transfection of lentiviral vector with second generation packaging constructs psPAX2 and pMD2.G (Didier Trono, Addgene plasmids 12260 &12259) into 70% confluent 293T cells using Lipofectamine 2000. Viral particles were collected, filtered through 0.45 μm sterile filters, and incubated with the cells of interest for 12 h with 8 μg/mL polybrene. Cells were recovered in growth medium overnight before addition of selection media including 500 μg/mL hygromycin (Life Technologies, 10687-010), 10 μg/mL puromycin (Sigma), 500 μg/mL G418 (GIBCO, 10-131-035), 5 μg/mL blasticidin (Thermo Fisher Scientific, R21001).
qRT-PCR analysis
RNA was extracted using the RNeasy Mini Kit (Qiagen, 74106). 1 μg total RNA of each sample was converted into double-stranded cDNA using the Transcriptor First Strand cDNA Synthesis Kit (Roche, 04379012001). Quantitative PCR was performed on a ViiA 7 Real-Time PCR System (Life Technologies). Gapdh was used as internal control for calculating relative expression. Sequences of synthesized primers used for qRT-PCR assays (designed with mouse genome mm10):
| Name | Forward | Reverse |
|---|---|---|
| Gapdh | aggtcggtgtgaacggatttg | tgtagaccatgtagttgaggtca |
| Smad7 | ggccggatctcaggcattc | ttgggtatctggagtaaggagg |
| Snai1 | cacacgctgccttgtgtct | ggtcagcaaaagcacggtt |
| Has2 | tgtgagaggtttctatgtgtcct | accgtacagtccaaatgagaagt |
| Il11 | tgttctcctaacccgatccct | caggaagctgcaaagatccca |
| Zeb1 | gctggcaagacaacgtgaaag | gcctcaggataaatgacggc |
| Skil | aataaaaagctgaacggcatgga | gggttttcccattggcatgaat |
| Wisp1 | cagcaccactagaggaaacga | ctgggcacatatcttacagcatt |
| Serpine1 | ttcagcccttgcttgcctc | acacttttactccgaagtcggt |
| Pdgfb | catccgctcctttgatgatctt | gtgctcgggtcatgttcaagt |
| Rreb1 | gcaatacagctccagacactta | gtcagagagccacctaaagaag |
| E-cadherin | caggtctcctcatggctttgc | cttccgaaaagaaggctgtcc |
| N-cadherin | agcgcagtcttaccgaagg | tcgctgctttcatactgaacttt |
| Vimentin | cggctgcgagagaaattgc | ccacttttccgttcaaggtcaag |
| Gsc | ttgcacagacagtcgatgctact | tcgttgctttctcgacccc |
| Mixl1 | cggttctggatcatctctcaa | taccgagaacaagccagcagt |
| T (Brachyury) | tcctccatgtgctgagacttgt | ccaagagcctgccactttg |
| Eomes | gcgcatgtttcctttcttgag | ggtcggccagaaccacttc |
| Foxa2 | tacccagggggctatggt | cccgctttgttcgtgact |
Sequences of synthesized primers used for qRT-PCR assays (human genome GRCh38/hg38):
| Name | Forward | Reverse |
|---|---|---|
| GAPDH | cgtggaaggactcatgacca | gccatcacgccacagtttc |
| SNAI1 | cccaatcggaagcctaacta | caggacagagtcccagatgag |
| HAS2 | tcctggatctcattcctcagc | tgcactgaacacacccaaaata |
| IL11 | cgagcggacctactgtccta | gcccagtcaagtgtcaggtg |
| Smad7 | ttcctccgctgaaacaggg | cctcccagtatgccaccac |
| E-CADHERIN | cgagagctacacgttcacgg | gggtgtcgagggaaaaatagg |
| N-CADHERIN | agccaaccttaactgaggagt | ggcaagttgattggagggatg |
RNA-seq and data analysis
Total RNA purified from cells was quantified by Ribogreen and quality assessed by Agilent BioAnalyzer 2000. 500 ng RNA with integrity number (RIN) > 9.5 from each sample was used for library construction with TruSeq RNA Sample Prep Kit v2 (Illumina) according to manufacturer’s instructions. Multiplexed sequencing libraries were ran on a Hiseq2500 platform and more than 30 million raw paired-end reads were generated for each sample. For data analysis, reads pairs in FASTQ format (50bp/50bp) were quality assessed by FastQC v0.11.5 and mapped to mouse genome mm10 with STAR2.5.2b57 using standard settings for paired reads. On average, 85% of raw reads were uniquely mapped. Uniquely mapped reads were assigned to annotated genes with HTSeq v0.6.1p158 with default settings. Read counts were normalized by library size, and differential gene expression analysis based on a negative binomial distribution was performed using DESeq2 v3.4 (Love et al., 2014). Unless otherwise indicated, thresholds for differential expression were set as follows: adjusted p-value < 0.05, fold change > 2.0 or < 0.5, and average normalized read count > 10. Basic statistical calculations were done in R (v3.5.0). Heatmaps for RNA-Seq data were generated with heatmap.2 function in gplots package. Gene set enrichment analysis was performed using GSEA and previously curated gene sets59. Gene ontology analysis was performed using DAVID60.
ChIP-seq and data analysis
Ten million cells were collected for each ChIP sample. Cells were crosslinked at room temperature for 10 min with 1% formaldehyde (Sigma), quenched with 125 mM glycine, washed with PBS, and sonicated in lysis buffer: 50 mM HEPES/KOH pH 7.5, 140 mM NaCl, 0.1% Na-deoxycholate, 1% Triton X-100, 1 mM EDTA, 0.1% SDS, complete protease inhibitor cocktail (Roche) and phosphatase inhibitor (Thermo Fisher Scientific). Samples were incubated with 5 μg of SMAD2/3 or HA antibodies (Cell Signaling Technology) overnight and washed 7 times with high salt buffer: 20 mM Tris, pH 7.9, 500 mM NaCl, 2 mM EDTA, 1% Triton X-100, 0.1% SDS. After one wash with Tris-EDTA (TE) buffer, DNA was eluted in TE with 1% SDS for 15 min at 65°C, and reverse-crosslinked with RNAse A for 4 h and Proteinase K for 1 h at 45°C. DNA was purified using a PCR Purification Kit (Qiagen). For library construction and sequencing, ChIP-seq DNA samples were quantified and quality assessed by Ribogreen and Agilent Bioanalyzer. DNA fragments range from 200-600 bps were selected constructed for ChIP-seq library with TruSeq ChIP Sample Prep Kit (Illumina) according to manufacturer’s instructions. Sequencing libraries were multiplexed and ran on a Hiseq2500 platform.
For mapping and visualization, single-end (50 bp) or paired-end (50/50 bp) FASTQ reads were mapped to mouse genome mm 10 with Bowtie2 with default filtering criteria61. Resulted SAM files were converted to BAM files though Samtools62. BAM files were sorted and indexed with Samtools62. Tag directories, visualization in UCSC genome browser, and downstream analyses were performed using the HOMER suite63. Peak calling from ChIP-Seq data was performed with MACS 1.4.2 and verified by HOMER (v4.10)63. The parameters for peak calling included fold change > 8, p value < 1e-8 to detect high confidence binding events. Input samples were used as reference controls for background correction. Peaks identified from MACS 1.14.2 were annotated with HOMER (v4.10) using annotatePeaks.pl function. Genes were assigned with the “nearest TSS” criteria. Differentially bound peaks between two conditions were identified by mergePeaks.pl function in HOMER (v4.10). Tag density for genomic ranges surrounding defined peak centers were calculated using annotatePeaks.pl function in HOMER (v4.10). Data matrix from each ChIP-Seq experiment were merged by peak names and plotted for heatmaps in R. Blue indicates low tag density and red indicates high tag density as labeled in each figure. DNA motif enrichment analysis was performed with PscanChIP64.
ChIP-PCR analysis
For ChIP-PCR experiment, immunoprecipitated DNA was analyzed by qRT-PCR, and the amplification product was expressed as percentage of the input. ChIP-PCR primer pairs of indicated genes are listed below.
| Name | Forward | Reverse |
|---|---|---|
| Snai1_DE1 | accctgtgagaggtcagtca | ggccagggttagctgagttt |
| Snai1_DE2 | agactggaataccctcctctcc | ttctcaaaggggctgtcacc |
| Has2_UE1 | ctgcatccctgagtcattgt | aggtctgccttgagttgtaag |
| Has2_PP1 | gcctgccagtcttccattat | ggacattctgtagacgcctatg |
| Il11_UE1 | ctgtgtgtgtccgtctgt | cctctgtggctgacctg |
| Il11_PP1 | gggaggtttgtgagtgtgag | agggtgagtcaggatgtgt |
ATAC-seq and data analysis
Fifty thousand cells were collected and washed with 1 mL of cold PBS, then 1 mL of ice-cold ATAC Buffer (10 mM Tris pH 7.4, 10 mM NaCl, 3 mM MgCl2). Cells were suspended in 50 μL of ATAC Lysis Buffer (10 mM Tris pH 7.4, 10 mM NaCl, 3 mM MgCl2, 0.1% NP-40 or IGEPAL-Ca630), incubated on ice for 2 min. 1 mL of cold ATAC Buffer was added and nuclei were pelleted at 1500 rpm for 10 min at 4°C in a bucket centrifuge. Nuclei were resuspended in 22.5 μL of the supernatant and transferred to 2.5 μL Tagmentation Enzyme (transposase) and 25 μL of Tagmentation Buffer (Illumina Nextera DNA Sample Preparation Kit), and incubated at 37°C for 30 min. After tagmentation, SDS was added (0.2% final concentration) and the sample was incubated at room temperature for 5 min before purification with 2x Agencourt AMPure XP beads (Beckman Coulter A63881). Purified samples were eluted in 50 μL of 0.1x Tris-EDTA. Libraries were prepared with 50 μL sample + 55 μL of NEBNext Q5 Hot Start HiFi PCR Master Mix (NEB, catalogue M0543L) and 5 μL of primer mix using 25 μM of the Nextera primers from Buenrostro et al 2013. PCR amplification was performed as previously described for 12 cycles.
Samples were purified with 1.5x AMPure XP beads. Concentration was measured using PicoGreen and median fragment size measured using the Agilent D1000 screentape on Agilent Technologies 2200 TapeStation. Samples were sequenced (paired-end 50 bp) on HiSeq 2500. Reads were quality checked using FastQC vO.11.5 and mapped to the mouse genome (mm10) with Bowtie261. Sam Tools was used to manipulate .sam and .bam files62. Tag directories, visualization in UCSC genome browser, and downstream analyses were performed using the HOMER suite63.
DNA affinity precipitation
DNA affinity precipitation (DNAP) was used to test the DNA binding activity of RREB147. PDA 806 cells were transduced with a vector encoding HA-tagged RREB1(1-1291), and treated with DMSO or 1 μM SCH772984 for indicated time. Cell samples were collected and lysed in buffer containing 0.5% Nonidet P-40, 100 mM EDTA, and 100 mM Tris-HCI, pH 8.0. Cell lysates were incubated with biotin-labeled probes and poly(dI-dC) overnight. The next day, streptavidin beads were added into the lysates for 1 h. Streptavidin beads were then washed 3 times with lysis buffer and eluted in SDS loading buffer. Eluted proteins were subjected to Western immunoblot analysis. Synthetic biotin-labeled dsDNA oligo probes used for DNAP assays were:
| Name | Forward | Reverse |
|---|---|---|
| Snai1 probe | gtttgacttttgagataaggtgtttggggctggagtcctt | aaggactccagccccaaacaccttatctcaaaagtcaaac |
| Has2 probe | cccgcccctgcccccacccaaaggaaaaggtaaaaggaaa | tttccttttaccttttcctttgggtgggggcaggggcggg |
Accession numbers
The raw RNA-seq, ChIP-seq and ATAC-seq data for this manuscript are available at gene expression omnibus (GEO) under the accession numbers GSE118765 and GSE128958.
Western immunoblot analysis
Cells were lysed in 100 μL of 1.5x NuPAGE LDS Sample Buffer supplemented with 1.5x NuPAGE Sample Reducing Agent, heated at 95°C for 10 min and sonicated in an ice water bath for 120 s. 10 μL protein per sample were separated on NuPAGE Novex 4-12% gels in MOPS running buffer at 200V for 50 min and transferred to nitrocellulose membranes at 400 mA for 30-60 min. Membranes were blocked with 1:1 Odyssey Blocking Buffer and PBS + 0.1% Tween (PBST) for 1 h, incubated overnight in designated antibody, washed 3x in PBST, and incubated 1 h in secondary antibody in Odyssey Blocking Buffer. Signal is detected with the 680 and 800 channels of the Odyssey CLx imager.
Immunohistochemistry and Immunofluorescence
Tissue blocks were prepared from tissues fixed in 4% paraformaldehyde overnight and dehydrated in 70% ethanol. Paraffin embedded sections were rehydrated using Histo-Clear (National Diagnostics) followed by 100-70% ethanol. Endogenous peroxidase activity was quenched with H2O2. Antigen retrieval was performed in a steamer for 30 min in citrate antigen retrieval solution. Cell cultures plated on glass coverslips were fixed for 10 min a room temperature in 2% paraformaldehyde. For immunohistochemistry, sections were placed in avidin and biotin blocking solutions (Vector Labs), followed by 2.5% normal horse serum (Vector Labs) and overnight incubation with the designated primary antibody. ImmPRESS HRP Anti-Rabbit Ig and ImmPACT DAB Peroxidase (Vector Labs) were used for detection. Detection was followed by dehydration of tissue in 70-100% ethanol and HistoClear, followed by mounting with Vectashield mounting medium. For immunofluorescence, samples were treated with PBS + 0.1% Triton X (PBSTr) for 30 min, followed by a 1 h block in PBSTr supplemented with 1% normal goat serum and 1% bovine serum albumin. Primary antibody and secondary antibody incubations of 45 min were separated by 3 washes with PBSTr and finished in 3 washes of PBSTr, 5 min incubation in 1x Hoechst (Thermo Fisher Scientific), and mounting with Invitrogen ProLong Gold.
In situ proximity ligation assay
In situ PLA was done with Duolink In Situ Reagents from Olink Bioscience (Sigma) per the provider’s protocol. Cell cultures were plated on glass coverslips and fixed for 10 min at room temperature in 3% paraformaldehyde. Cells were blocked with Duolink blocking solution, incubated overnight with two primary antibodies from different host species (one mouse and one rabbit antibody), and incubated with Duolink anti-mouse plus and anti-rabbit minus PLA probes. Probes contain unique DNA strands that template the hybridization of added oligonucleotides. After ligation and amplification, coverslips were mounted with Invitrogen ProLong Gold.
Stable isotope labeling with amino acids in cell culture (SILAC)
Cell culture, lysis, immunoprecipitation, and in-gel digestion: PDA cells expressing HA-RREB1(1-1291) were cultured in DMEM supplemented with 10% FBS, 2 mM L-glutamine, 100 units/mL penicillin and 100 μg/mL streptomycin either unlabeled L-arginine (Arg0) and L-lysine (Lys0) (Light medium) at 50 mg/L, or with equimolar amounts of the isotopic variants 13C615N4 L-Arginine-HCI (Arg10) and 13C6 L-Lysine-2HCI (Lys6) (Pierce) (Heavy medium). Cells were incubated in these media for at least five population doublings, splitting cells as needed. Isotope incorporation efficiency was determined by LC-MS/MS analysis. Cells in Light medium were treated with DMSO for 6 h, and cells in heavy medium were treated with 1 μM ERK inhibitor SCH772984 for 6 h. Cells in Light and Heavy media were harvested together (1:1) and boiled in denaturing buffer (2% SDS, 30 mM DDT) for 10 min. To immunoprecipitate HA-tagged proteins under denaturing conditions, the SDS concentration was adjusted to 0.1% by adding dilution buffer (150 mM NaCI, 1% Triton X-100, 20 mM Tris pH 8.0), then immunoprecipitated overnight using Pierce anti-HA magnetic beads, and washed five times with dilution buffer. Bound proteins were eluted with 1 mg/mL HA peptide. Eluted proteins were separated on 3-8% tris-acetate protein gels, and stained with SimplyBlue (Thermo Fisher Scientific). The gel slice containing HA-RREB1 was excised and performed in-gel digestion. Gel slices were washed with 1:1 (Acetonitrile: 100 mM ammonium bicarbonate) for 30 min, and then dehydrated with 100% acetonitrile for 10 min until gel slices were shrunk and excess acetonitrile was removed and slices were dried in speed-vac for 10 min with no heat. Gel slices were reduced with 5 mM DTT (in 100 mM ammonium bicarbonate) for 30 min at 56°C in a thermomixer (Eppendorf) and chill down the tube to room temperature, and alkylated with 11 mM IAA (in 100 mM ammonium bicarbonate) for 30 min in dark. Gel slices were washed with 100 mM ammonium bicarbonate and 100% acetonitrile for 10 min each. Excess acetonitrile was removed and samples were dried in speed-vac for 10 min without heat and then rehydrated in a solution of 25 ng/μL trypsin in 50 mM ammonium bicarbonate for 30 min on ice. Digestions were performed overnight at 37°C with mixing at 850 rpm in a thermomixer (Eppendorf). Digested peptides were collected and further extracted from gel slices in extraction buffer (1:2 vol/vol 5% formic acid/acetonitrile) with mixing at 1,200 rpm. Supernatant from both extractions were combined and dried down in a vacuum centrifuge. Peptides were desalted with C18 resin-packed stage-tips.
For LC-MS/MS analysis, desalted peptides were dissolved in 3% acetonitrile/0.1% formic acid and were injected onto a C18 capillary column on a nano ACQUITY UPLC system (Water) which was coupled to the Orbitrap Fusion Lumos mass spectrometer (Thermo Scientific). Peptides were eluted with a linear 90 min gradient of 0.5%-50% buffer B (0.1% (v/v) formic acid, 100% acetonitrile) at a flow rate of 300 nL/min. After each gradient, the column was washed with 90% buffer B for 5 min and re-equilibrated with 99.5% buffer A (0.1% formic acid, 100% HPLC-grade water). MS data were acquired with an automatic switch between a full scan in profile mode and data-dependent MS/MS scans (MaxN method) in centroid mode with 3 s cycle time. Target value for the full scan MS spectra was 1 x 10⁶ charges in the 375-1500 m/z range with a maximum injection time of 50 ms and resolution of 60,000 at 200 m/z. Isolation of precursors was performed with 1.4 m/z. Precursors were fragmented by higher-energy C-trap dissociation (HCD) with a normalized collision energy of 30 eV. MS/MS scans were acquired at a resolution of 15,000 at 200 m/z with an AGC target value of 100,000 and maximum injection time of 110 ms and dynamic exclusion for 15 s.
Raw mass spectrometric data were analyzed in the MaxQuant environment65 v. 1.5.3.30 using Andromeda for database search66. The default setting was used for first search tolerance and main search tolerance at 20 ppm and 6 ppm, respectively. Labels were set to Arg10 and Lys6. MaxQuant was set to search the Uniprot reference mouse proteome database downloaded on 20160906. Maxquant search included trypsin digestion with up to 2 missed cleavages. Peptide, Site and Protein FDR were all set to 1% with a minimum of one peptide for Identification and two peptides for calculation of protein level ratio. The following modifications were used as variable modifications for identifications and included for protein quantification: methionine oxidation, N-terminus acetylation, phosphorylation of serine, threonine and tyrosine residues, and fixed modification of carbamidomethyl on cysteine. The probability that phosphorylation occurred at a given S, T or Y residue in each identified phosphopeptide was determined using the Andromeda score algorithm.
Generation of chimeric embryos
mCherry-expressing single ESC colonies were picked and cultured for 3 days on mouse embryonic fibroblast (MEF) feeder layers. Fifteen to 20 ESCs from were injected per blastocyst in Embryonic day (E) 3.5 blastocysts (C57BL/6J, Jackson Laboratory). Injected blastocysts were cultured in KSOM/AA (Millipore) at 37°C in an atmosphere of 5% CO2 to allow for recovery of blastocyst morphology, and then implanted into the uterine horns (up to ten embryos per horn) of E2.5 pseudopregnant females (C57BL/6J;CBA F1, Jackson Laboratory) using standard protocols. Chimeric embryos were recovered at E7.5 and E8.5.
Wholemount immunostaining, cryosectioning and imaging of post-implantation embryos
E7.5 and E8.5 embryos were isolated from deciduae and Reichert’s membrane was removed according to standard protocols67. Immediately after dissection, prior to fixation, embryos were imaged wholemount using a Leica M165 FC fluorescence stereomicroscope to assess gross morphology and level of chimerism based on mCherry fluorescence. Embryos were fixed for 15 min at room temperature in 4% PFA (Electron Microscopy Sciences) then washed with PBS with 0.1% Triton-X (Sigma) (PBS-T). Embryos were permeabilized with 0.5% Triton-X in PBS for 30 min at room temperature and blocked overnight at 4°C in blocking buffer (PBS-T with 5% horse serum (Sigma) and 1% bovine serum albumin (Sigma)). The next day, embryos were transferred to primary antibodies diluted in blocking buffer and incubated overnight at 4°C. Primary antibodies were used at the following dilutions: anti-E-cadherin (Sigma, U-3254, 1:500), anti-Brachyury (R&D, AF2085, 1:200), anti-cleaved caspase 3 (Cell Signaling, 9661S, 1:100), anti-phospho-Histone H3 (Millipore, 06-570, 1:300), anti-N-cadherin (Santa Cruz, Sc-7939, 1:300), anti-RFP (Rockland, 600-401-379, 1:300), anti-SNAIL (R&D, AF3639, 1:100), anti-SOX2 (eBioscience, 14-9811-82, 1:200). The next day, embryos were washed twice for 10 min at room temperature and blocked for approximately 6 h followed by overnight incubation at 4°C in secondary antibodies diluted in blocking buffer. AlexaFluor® secondary antibodies (Thermo Fisher Scientific) were diluted 1:500 in blocking buffer. Embryos were washed the following day 3x for 10 min in PBS-T at room temperature. The final wash contained 5 μg/mL Hoechst (Thermo Fisher Scientific).
For imaging, embryos were positioned in glass-bottom dishes (MatTek) in PBS and imaged using a Zeiss LSM880 laser scanning confocal microscope. Raw data was processed in ImageJ open source image processing software (Version: 2.0.0-rc-49/1.51d).
For cryosectioning, wholemount immunostained embryos were embedded in OCT (Tissue-Tek). Samples were snap-frozen in 2-methylbutane pre-cooled on dry ice. Samples were maintained for short periods at −80°C followed by cryosectioning using a Leica CM3050S cryostat. Sections of 10 μm were cut and imaged using a confocal microscope.
Extended Data
Extended Data Figure 1. RREB1 as a SMAD cofactor in TGF-β gene responses.
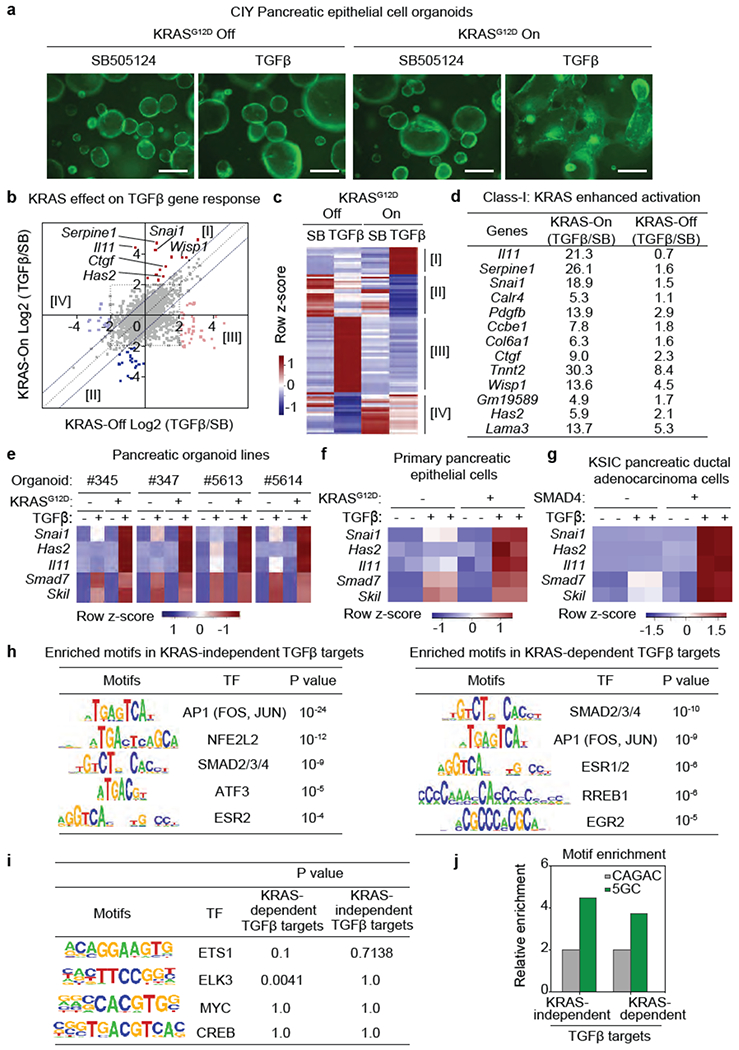
(a) YFP fluorescence images of CIY organoids expressing KRASG12D under doxycycline control treated with SB or TGF-β for 2.5 days. Scale bars, 200 μm. Images are representative of two independent experiments, (b) Influence of KRASG12D on TGF-β gene responses. CIY pancreatic organoids inducibly expressing KRASG12D, were treated with SB or TGF-β for 1.5 h and subjected to RNA-seq analysis. Dots represent Log2 fold change in mRNA levels of individual genes under TGF-β versus SB treatment conditions, with KRASG12D expression turned off (X axis) or on (Y axis). Off-diagonal dots correspond to TGF-β gene responses that were enabled (groups I and II) or disabled (groups III and IV) by KRASG12D. Gene activation (I and III) and repression responses (II and IV) are included, (c) Heatmap representation of four classes of KRAS-modified TGF-β gene responses. n=1. Representative result of two independent experiments. Classes I-IV correspond to the off-diagonal genes derived from the RNA-seq in (b). (d) TGF-β gene activation responses augmented by KRASG12D (class I responses) in CIY pancreatic organoids. Fold-increase in mRNA levels in TGF-β vs. SB treatment conditions, in presence or absence of inducible KRASG12D. (e) Heatmaps showing TGF-β induction of Snai1, Has2, Il11, Smad7 and Skil in four independent CIY mouse pancreatic organoid lines with inducible KRASG12D expression. n=4. (f) Heatmap representation of the indicated TGF-β gene responses in spheroid cultures of pancreatic epithelial cells (PECs) inducibly expressing KRASG12D. n=2. (g) Heatmap representation of the indicated TGF-β gene responses in monolayer cultures of mouse KrasG12D;Smad4fl/fl;Cdkn2afl/fl;Pdx1-Cre (KSIC) PDA cell lines transduced with a SMAD4 vector or an empty vector. n=2. (h) Transcription factor (TF)-binding motifs enriched in KRAS-independent SMAD2/3 binding sites (left panel) and KRAS-dependent SMAD2/3 binding sites (right panel). SMAD2/3 ChIP-seq analyses were performed in SMAD4-restored PDA cells that were treated with SB (2.5 μM) or TGF-β (100 pM) for 1.5 h. Transcription factor binding motif analyses were performed with PscanChIP. n=821 peak regions (left panel). n=778 peak regions (right panel), (i) Motif enrichment analysis of RAS-regulated transcription factors in KRAS-dependent (n=778 peak regions) and KRAS-independent (n=821 peak regions) SMAD2/3 binding sites. (j) Comparative enrichment of classic SMAD binding motifs (CAGAC, GGCTG) and 5GC motifs (GGC(GC)|(CG)) in 200 bp-region of SMAD2/3 ChIP peaks within 1000 bp from a transcriptional start site24. The relative enrichment is normalized to the baseline data set obtained from 20,000 random 200 bp regions from the mm10 genome assembly. The 5GC motifs are ~4-fold enriched in SMAD2/3 ChIP peaks compared to the baseline, and the classic motifs are 2-fold enriched.
Extended Data Figure 2. RREB1 interacts with SMAD and binds to TGF-β target genes.
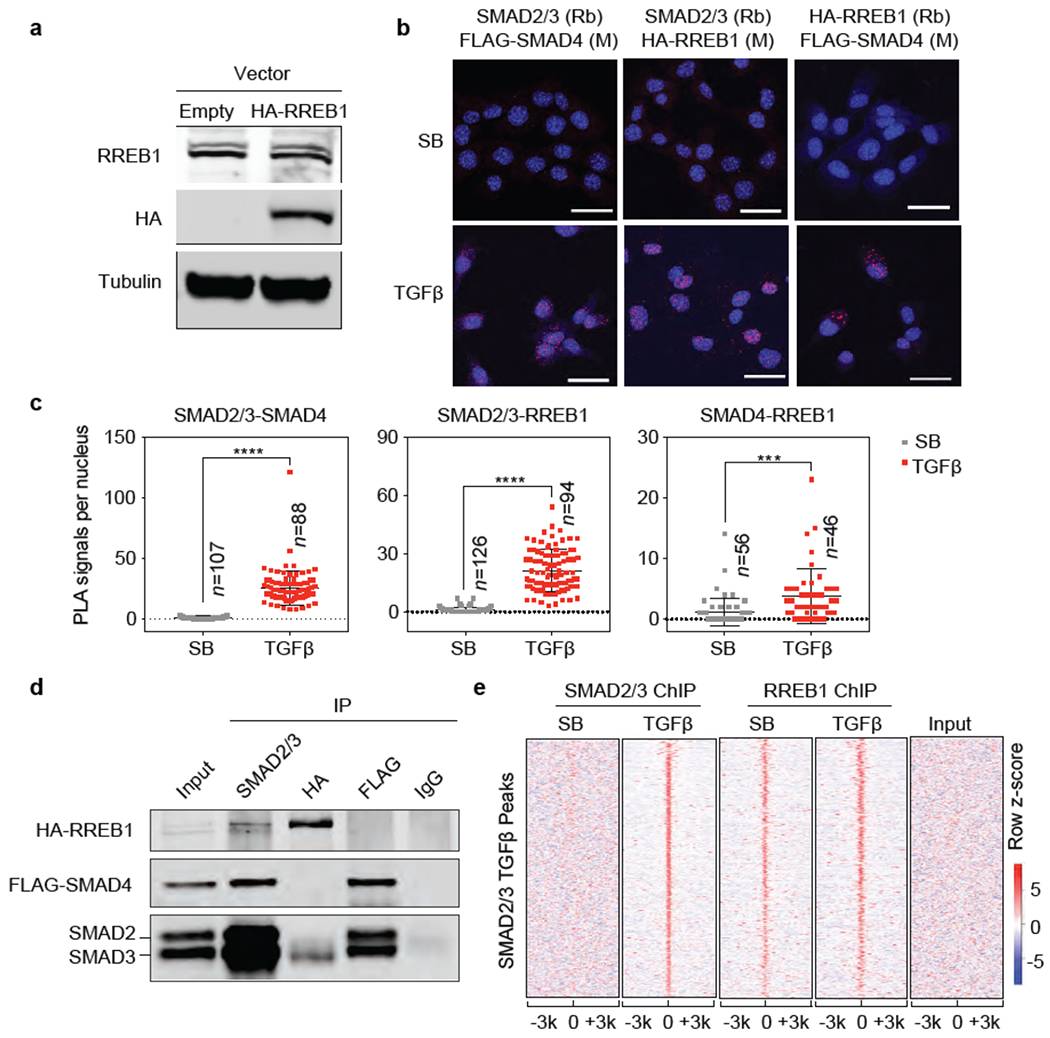
(a) Western immunoblot analysis of RREB1 and HA-RREB1 levels in SMAD4-restored PDA cells stably transduced with an HA-RREB1 vector. Anti-Tubulin immunoblotting was used as loading control. Data are representative of two independent experiments, (b) Proximity ligation assay showing TGF-β dependent proximity between RREB1, SMAD2/3 and SMAD4 in the nucleus. Scale bars, 30 μm. Data are representative of two independent experiments, (c) Quantification of PLA signals in (b). Cell numbers (n) of each group is indicated in the graph, two-tailed unpaired t test. Center values and error bars: mean ± s.d. ****, p<0.0001; ***, p<0.001. (d) SMAD4-restored PDA cells expressing HA-RREB1 were treated with TGF-β for 1.5 h, lysed, and immunoprecipitated (IP) with the indicated antibodies. The immune complexes were collected and subjected to western immunoblot with the antibodies indicated on the left. Data are representative of two independent experiments. (e) Heatmap representation of ChIP-seq tag densities for SMAD2/3 and HA-RREB1 in genomic regions ±3 kb from the center of SMAD2/3 binding peaks in SMAD4-restored PDA cells that were treated with SB or TGF-β for 1.5 h and subjected to SMAD2/3 and HA-RREB1 ChIP-seq analysis. ChIP-seq was performed once and an independent ChIP was performed in which selective genomic regions were confirmed by qPCR.
Extended Data Figure 3. RREB1 is phosphorylated and regulated by ERK.
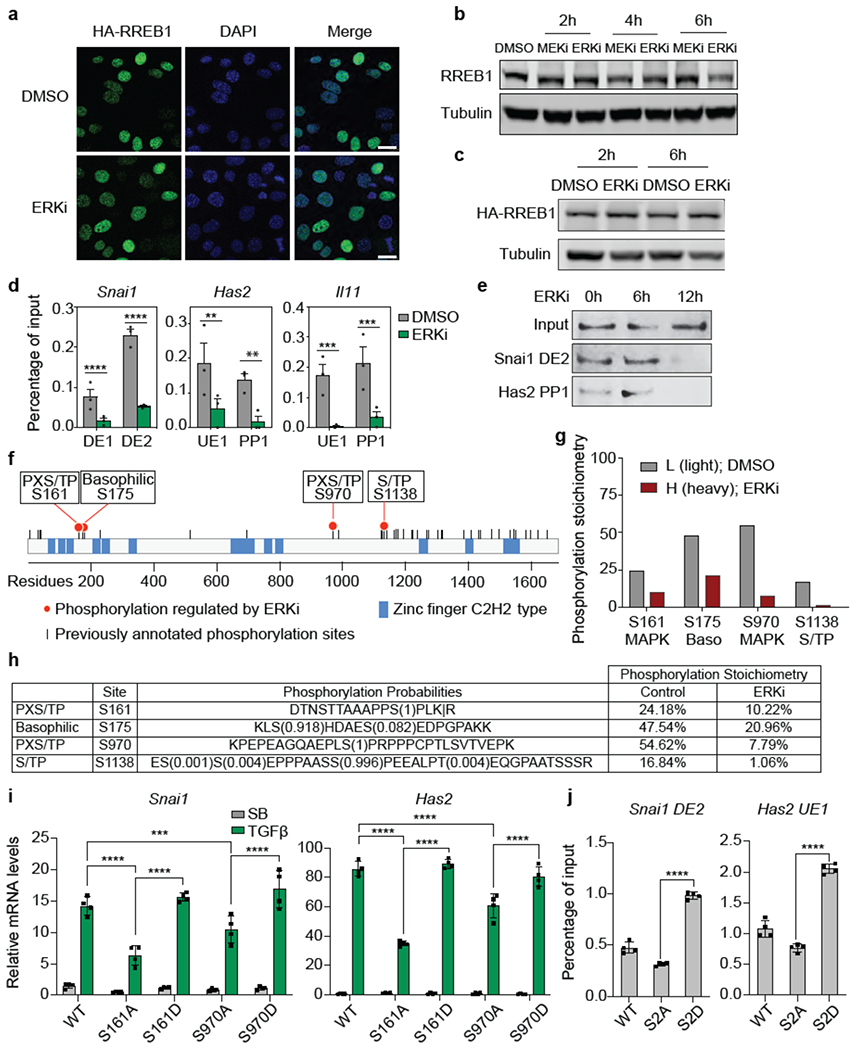
(a) Representative immunofluorescence images of HA-RREB1 in SMAD4-restored PDA cells treated with DMSO or 1 μM ERK inhibitor SCH772984 (ERKi) for 6 h. Scale bar, 20 μm. Data are representative of two independent experiments, (b) (c) Western immunoblot analysis of RREB1 (b) or HA-RREB1 levels (c) in SMAD4-restored PDA cells treated with DMSO, or 1 μM ERKi or 1 μM AZD6244 (MEKi), which is an inhibitor of the ERK-activating kinases MEK1/2 for the indicated time periods. Anti-Tubulin immunoblotting was used as loading control. Data are representative of two independent experiments, (d) ChIP-PCR analysis of HA-RREB1 binding to the indicated sites (refer to Fig. 1 g, 3b) in Snai1, Has2, and Il11 in SMAD4-restored PDA cells that were treated with vehicle DMSO or the ERKi (1 μM) for 6 h. Mean ± s.e.m. n=3, two-way ANOVA analysis. **, p<0.01; ***, p<0.001; ****, p<0.0001. (e) SMAD4-restored PDA cells expressing HA-RREB1 were treated with ERKi for the indicated length of time. HA-REBB1 was tested for binding to Snai1 DE2 and Has2 PP1 dsDNA oligonucleotide probes in DNA affinity precipitation assays. Data are representative of two independent experiments, (f) Schematic representation of RREB1. Each tick represents a previously annotated phosphorylation site in PhosphoSitePlus® identified in at least two independent mass-spectrometry experiments. Red filled circles represent high stoichiometry (>15%) phosphorylation sites that are inhibited by ERKi, as identified in (g). Zinc-finger domains annotated in Uniprot are shown. (g) Phosphorylation stoichiometry of four ERK-dependent RREB1 phosphorylation sites in SMAD4-restored PDA cells, as determined by SILAC mass spectrometry of cells treated with DMSO (control) in light medium or ERKi in heavy medium for 6 h. (h) Summary of ERK-dependent RREB1 phosphorylation sites, sequence motifs, and phosphorylation stoichiometry, (i) RREB1 KO PDA cells were transduced with the indicated RREB1 WT or phosphorylation site mutant constructs, then treated with SB or TGF-β for 1.5 h. mRNA levels of Snai1 and Has2 were determined by qRT-PCR. Mean ± s.e.m. n=4, two-way ANOVA analysis. ***, p<0.001; ****, p<0.0001. (j) ChIP-PCR analysis of HA-RREB1 binding to the indicated sites in RREB1 KO PDA cells transduced with the indicated RREB1 WT or phosphorylation site mutant constructs. Mean ± s.e.m. n=4, two-tailed unpaired t test. ****, p<0.0001.
Extended Data Figure 4. RREB1 mediates KRAS-dependent TGF-β responses in PDA cells.
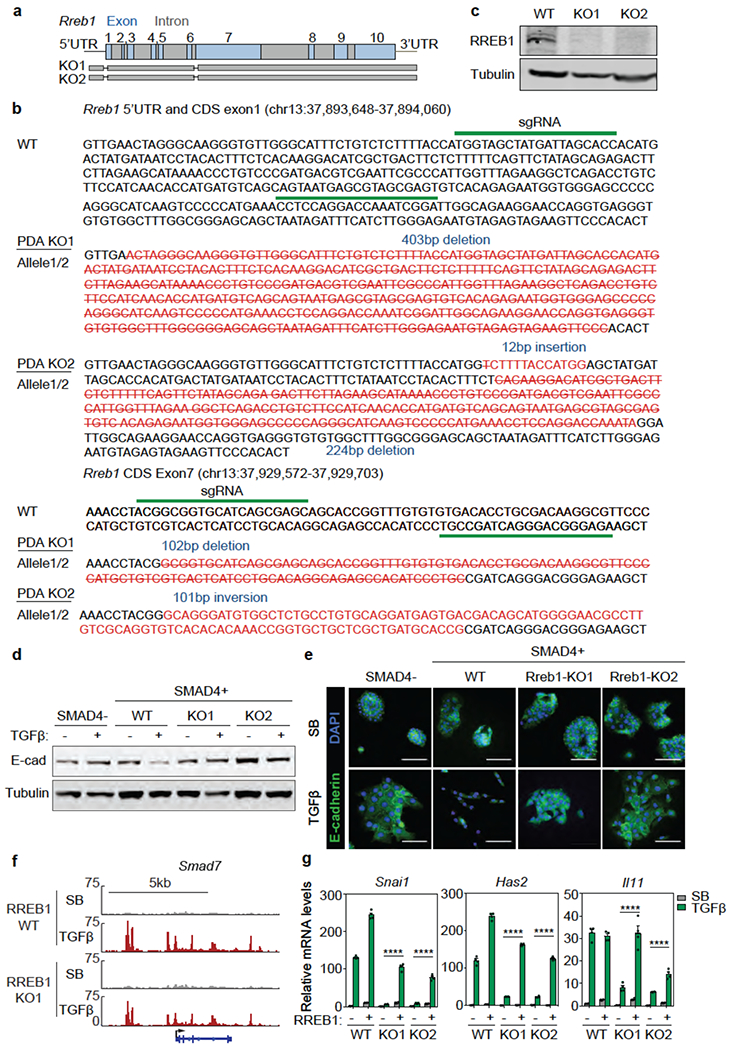
(a) Scheme of CRISPR/Cas9-mediated mutation of Rreb1 in mouse SMAD4-restored PDA cells. (b) sgRNA sequences and genomic sequences of Rreb1 coding region (CDS) exons 1 and 7 in mutant clones K01 and K02 derived from SMAD4-restored PDA cells, (c) Western immunoblot analysis of RREB1 levels in Rreb1 wild type (WT) and knockout (KO) cells. Anti-Tubulin immunoblotting was used as loading control. Data are representative of two independent experiments, (d) Western immunoblot analysis of E-cadherin in mouse KSIC PDA cells, SMAD4-restored PDA cells, and two RREB1 KO SMAD4-restored PDA clones, treated with SB or TGF-β for 24 h. Anti-Tubulin immunoblotting was used as loading control. Data are representative of two independent experiments, (e) Representative E-cadherin and DAPI immunofluorescence images of the same cells as in (f) treated with SB or TGF-β for 48 h. Scale bars, 100 pm. Data are representative of two independent experiments, (f) Gene track view of SMAD2/3 ChIP-seq tags in the Smad7 locus of the RREB1 WT and KO PDA cells. The gene body is schematically represented at the bottom. ChIP-seq was performed once and an independent ChIP was performed in which selective genomic regions were confirmed by qPCR. (g) mRNA levels of Snai1, Has2 and Il11 in WT and two RREB1 KO cells that were transduced with an RREB1 vector or empty vector and then treated with SB or TGF-β for 1.5 h. Mean ± s.e.m. n=4, two-way ANOVA analysis, ****, p<0.0001.
Extended Data Figure 5. RREB1 mediates tumorigenic EMT in lung adenocarcinoma cells.
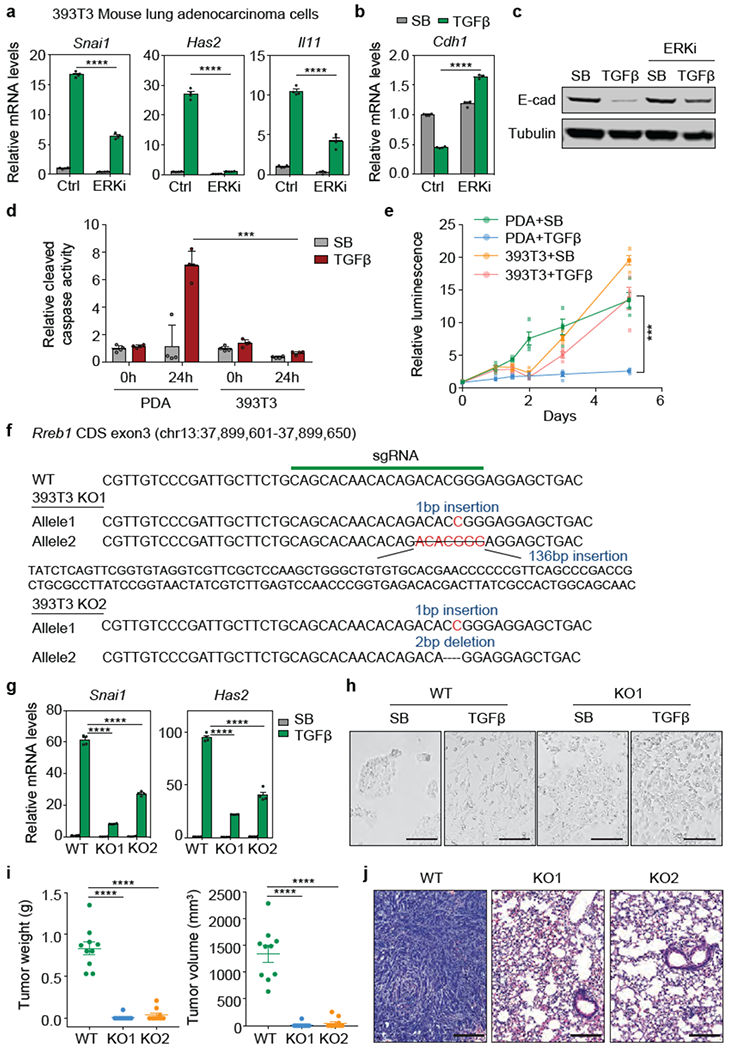
(a) Snai1, Has2 and Il11 mRNA levels in 393T3 mouse LUAD cells treated with DMSO (Ctrl) or ERKi (SCH772984, 1 μM) for 6 h, followed with treatment of SB or TGF-β for 1.5 h. Mean ± s.e.m. n=4, two-way ANOVA analysis, ****, p<0.0001. (b) Cdh1 mRNA levels in 393T3 cells with the indicated treatments for 48 h. Mean ± s.d. n=4, two-way ANOVA analysis, (c) Western immunoblot analysis of E-cadherin in 393T3 cells with the indicated treatments for 48 h. Anti-Tubulin immunoblotting was used as loading control. Data are representative of two independent experiments, (d) SMAD4-restored PDA cells and 393T3 LUAD cells cultured in D10F containing 2.5 μM MK220612 were treated with SB (2.5 μM) or TGF-β (100 pM) and assayed for cleaved caspase 3/7 activity at the indicated times. Mean ± s.e.m. n=4, two-way ANOVA analysis, ***, p<0.001. (e) SMAD4-restored PDA cells and 393T3 cells cultured in D10F containing 2.5 μM MK2206 were treated with SB or TGF-β. Cell viability was determined at the indicated times. Mean ± s.e.m. n=4, two-way ANOVA analysis, ***, p<0.001. (f) sgRNA sequence targeting Rreb1 CDS exon3, and mutant Rreb1 genomic sequences of the resulting 393T3 KO1 and KO2 clones, (g) mRNA levels of Snai1 and Has2 in the RREB1 WT and KO 393T3 cells after treatment with SB (2.5 μM) or TGF-β (100 pM) for 1.5 h. Mean ± s.e.m. n=4, two-way ANOVA analysis. ****, p<0.0001. (h) Phase contrast images of 393T3 cell monolayers treated with SB or TGF-β for 48 h. Scale bars, 200 μm. Data are representative of two independent experiments, (i) Weight and volume of tumours in Fig. 2g. Mean ± s.e.m. n=10, two sites were inoculated per mouse, two-tailed unpaired t test. ****, p<0.0001. (j) Representative hematoxylin and eosin staining images of indicated lung tissue sections in Fig. 2h. Scale bars, 200 μm. Data are representative of two independent experiments.
Extended Data Figure 6. RREB1-dependent TGF-β responses in LUAD and PDA cells.
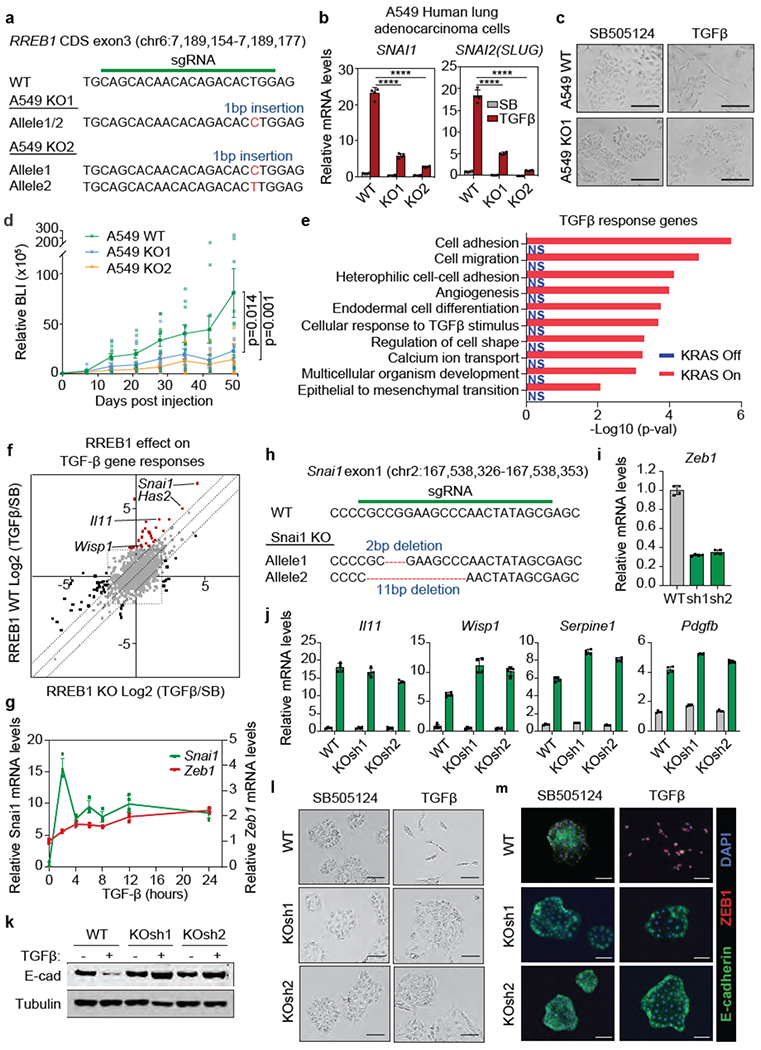
(a) sgRNA sequence targeting RREB1 CDS exon3, and mutant RREB1 genomic sequences of the resulting A549 KOI and KO2 clones, (b) SNAIL and SLUG mRNA levels in WT A549 and two RREB1 KO clones treated with SB or TGF-β for 24 h. Mean ± s.e.m. n=4, two-way ANOVA analysis. ****, p<0.0001. (c) Phase contrast images of WT A549 and RREB1 KO cell monolayers treated with SB or TGF-β for 48 h. Scale bars, 200 μm. Data are representative of two independent experiments. (d) Growth kinetics of tumours formed by subcutaneously inoculated WT or RREB1 KO A549 cells in athymic mice, as determined by BLI of a transduced firefly luciferase gene in the cells. Mean ± s.e.m. n=10, two sites were inoculated per mouse, two-way ANOVA analysis, (e) Gene ontology analysis of TGF-β response genes in CIY organoids inducibly expressing KRASG12D, based on the RNA-seq in Extended Data Fig. 1b. (f) RREB1 WT and KO PDA cells were treated with SB or TGF-β for 1.5 h and subjected to RNA-seq analysis. Dots represent Log2 (fold change) in mRNA levels of individual genes under TGF-β versus SB treatment conditions, in RREB1 KO (X axis) or WT cells (Y axis). Off-diagonal dots corresponding to Snai1, Has2, Il11 and Wisp1 are highlighted, (g) Induction of Snai1 and Zeb1 expression by TGF-β in mouse PDA cells. Mean ± s.d. n=4. (h) sgRNA sequence targeting Snai1 and resulting mutant Snai1 genomic sequences in mouse PDA cells (i) Knockdown of Zeb1 with two independent shRNAs in SNAIL KO mouse PDA cells (KOsh cells). Mean ± s.d. n=4. (j) Fibrogentic gene responses to TGF-β in WT and SNAIL/ZEB1-doubly depleted KOsh PDA cells. Mean ± s.d. n=4. (k-m) E-cadherin levels (k), phase contrast images (I), and E-cadherin and Zeb1 immunofluorescence staining in WT and KOsh PDA cells that were treated with SB or TGF-β for 48h. Scale bars, 100 μm. Data are representative of two independent experiments.
Extended Data Figure 7. RREB1 dependent TGF-β responses in mammary epithelial cells.
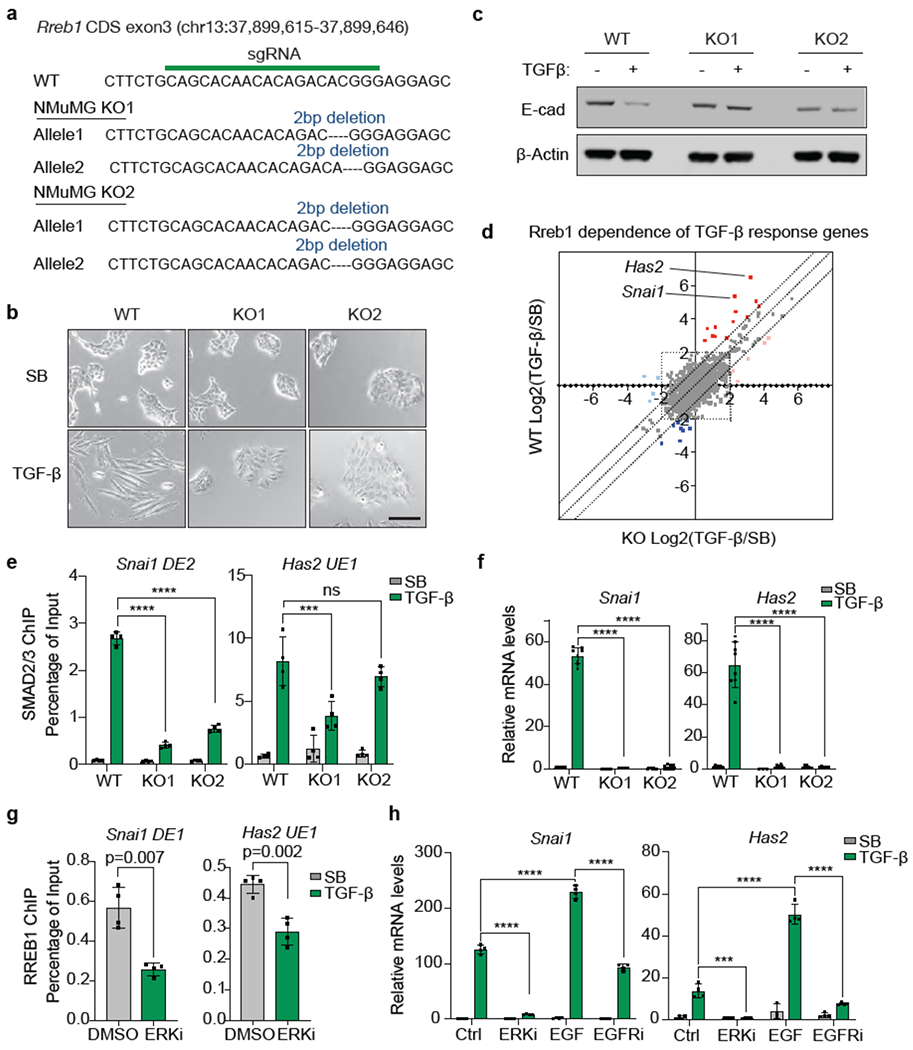
(a) sgRNA sequence targeting RREB1 CDS exon3, and mutant RREB1 genomic sequences of the resulting NMuMG KO1 and KO2 clones, (b) Phase contrast images of RREB1 WT and KO NMuMG cell monolayers treated with SB or TGF-β for 48 h. Scale bar, 100 μm. Data are representative of two independent experiments, (c) Western immunoblot analysis of E-cadherin in RREB1 WT and KO NMuMG cells, treated with SB or TGF-β for 48 h. Anti-β-actin immunoblotting was used as loading control. Data are representative of two independent experiments, (d) RREB1 WT and KO NMuMG cells were treated with SB or TGF-β for 1.5 h and subjected to RNA-seq analysis. Dots represent Log2 fold change in mRNA levels of individual genes under TGF-β versus SB treatment conditions, in RREB1 KO (X axis) or WT cells (Y axis). Off-diagonal dots corresponding to Snai1 and Has2 are highlighted, (e) ChIP-PCR analysis of SMAD2/3 binding to the Snai1 (DE2) and Has2 (UE1) regions (refer to Fig. 1g) in RREB1 WT and KO NMuMG cells. Cells were treated with 2.5 μM SB or 100 pM TGF-β for 1.5 h. Mean ± s.e.m. n=4. two-way ANOVA analysis. ***, p<0.001; ****, p<0.0001. (f) mRNA levels of Snai1 and Has2 in RREB1 WT and KO NMuMG cells after treatment with SB or TGF-β for 1.5 h. Mean ± s.e.m. n=4. two-way ANOVA analysis. ****, p<0.0001. (g) ChIP-PCR analysis of HA-RREB1 binding to the indicated Snai1 and Has2 regions in NMuMG cells that were treated with vehicle DMSO or the ERKi SCH772984 (1 μM) for 6 h. Mean ± s.e.m. n=3, two-tailed unpaired t test, (h) Snai1 and Has2 mRNA levels in NMuMG cells treated with DMSO (Ctrl), ERKi (1 μM SCH772984), EGF (10 ng/ml, 10 min), or EGFR inhibitor (Gefitinib, 1 μM, 2 h), followed by SB or TGF-β treatment for another 1.5 h. Mean ± s.e.m. n=4. two-way ANOVA analysis. ***, p<0.001; ****, p<0.0001.
Extended Data Figure 8. RREB1 in gastrulation EMT and mesendoderm differentiation.
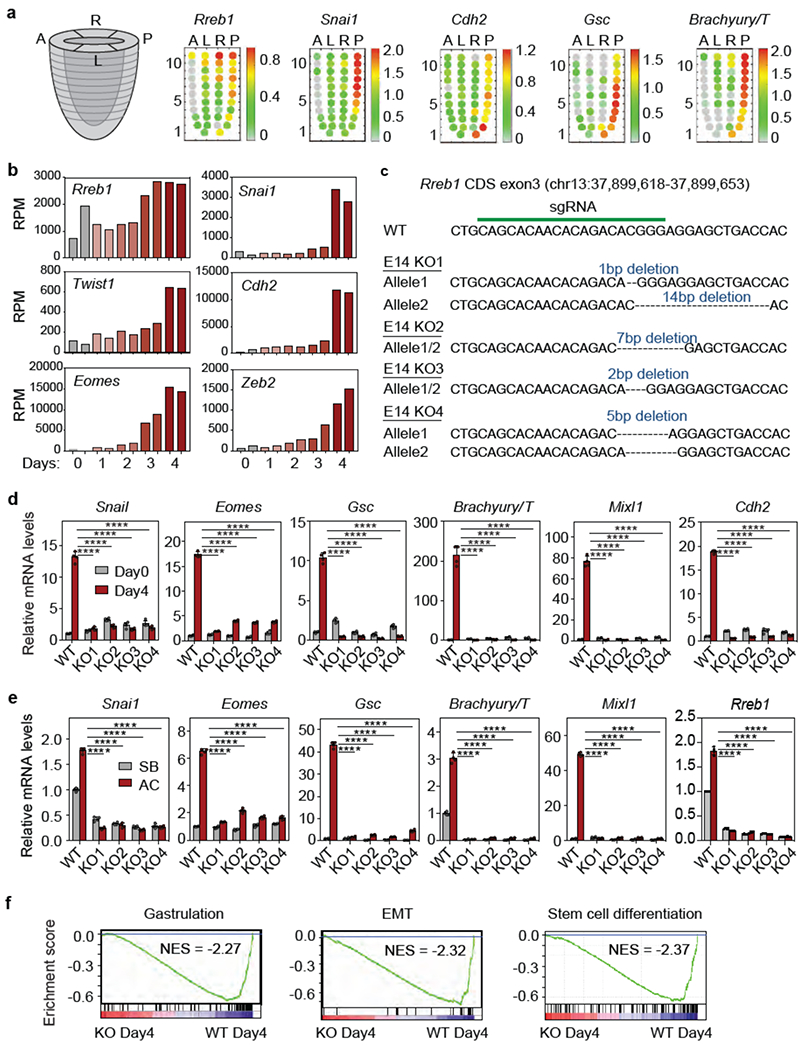
(a) Corn plot presentation of Rreb1, Snai1, Cdh2, Gsc and Brachyury/T in E7.0 mouse embryo. A: anterior, L: left, R: right, P: posterior regions. Each dot represents transcript level at a specific positional address. Heatmap denotes expression level of each gene computed from transcript counts in RNA-seq datasets41, (b) Reads per million reads (RPM) of Rreb1, Snai1, Twist1, Cdh2, Eomes and Zeb2 in the RNA-seq dataset at the indicated times after shifting ESCs into LIF-deficient EB differentiation media, (c) sgRNA sequence targeting Rreb1 CDS exon3, and mutant Rreb1 genomic sequences of four resulting mESC KO clones, (d) mRNA levels of EMT (Snai1, Cdh2) and mesendoderm differentiation genes (Eomes, Gsc, T/Brachyury and Mixi1) in WT and four independent RREB1 KO clones on Day4 EB differentiation. Mean ± s.d., n=4, two-way ANOVA analysis. ****, p<0.0001. (e) mRNA levels of the indicated genes in WT and four independent RREB1 KO clones treated with receptor inhibitor (SB) or Activin A (AC) for 2 h. Mean ± s.e.m. n=4, two-way ANOVA analysis. ****, p<0.0001. (f) GSEA for gastrulation, EMT and stem cell differentiation genes in WT cells, and absence in RREB1 KO cells, at Day4 EB differentiation.
Extended Data Figure 9. RREB1 and SMAD contextually regulate EMT genes.
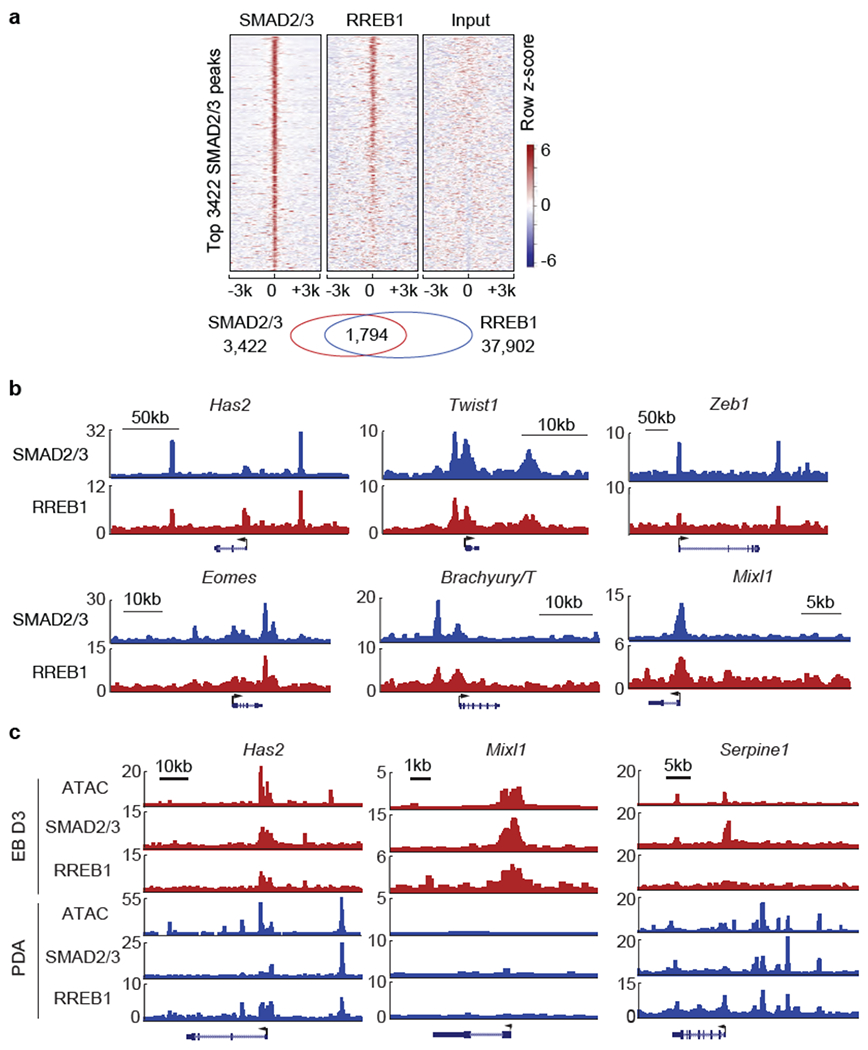
(a) Heatmap representation of ChIP-seq tag densities for SMAD2/3 and HA-RREB1 in genomic regions ±3 kb from center of 3422 high-confidence SMAD2/3 binding peaks in Day3 EBs subjected to SMAD2/3 and HA ChIP-seq analyses, (b) Gene track view of SMAD2/3 and HA-RREB1 ChIP-seq tags in the loci of EMT genes (Has2, Twist1, and ZebT) and early mesendoderm lineage genes (Eomes, Brachyury/T, and Mixi1) in Day-3 EBs. Gene bodies are schematically represented at the bottom of each track set. (c) Gene track view of ATAC-seq, and SMAD2/3 and RREB1 ChIP-seq tags on indicated loci, in Day3 EBs (red tracks) versus TGF-β treated (1.5 h) SMAD4-restored PDA cells (blue tracks), (a-c) ChIP-seq was performed once and an independent ChIP was performed in which selective genomic regions were confirmed by qPCR.
Extended Data Figure 10. Rreb1−/− mouse embryo chimeras exhibit defects in early development.
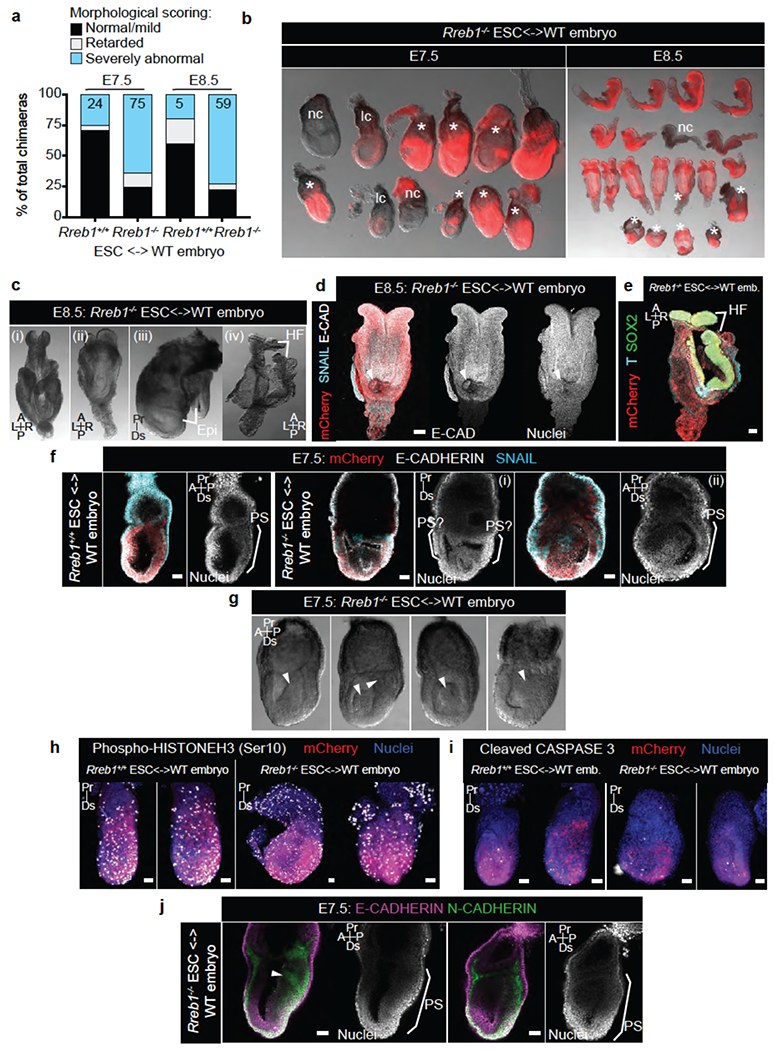
(a) E7.5 and E8.5 chimeric embryos containing WT ESCs or Rreb1−/− ESCs were scored, based on gross morphology, as normal/mild defects, developmentally retarded or severely abnormal. At E7.5, a fraction of Rreb1+/+ ESC embryos displayed small clumps of cells in the amniotic cavity, possibly an artifact from the microinjection, and hence were scored as abnormal. Rreb1+/+ data is compiled from 4 distinct KO clones, (b) Images showing brightfield morphology and mCherry fluorescence (marking descendants of injected ESCs) in representative litters of Rreb1+/+ ESC-containing chimeric embryos dissected at E7.5 and E8.5. nc, non-chimeric; lc, low chimerism. Asterisks mark morphologically abnormal/developmentally retarded embryos, (c) Brightfield images of morphologically abnormal Rreb1−/− ESC-containing chimeric E8.5 embryos. Embryos exhibited abnormal headfold development including disproportionate headfolds (i), asymmetric headfolds (ii). Axis duplication was also observed (iii) and (iv). To note, the embryo in panel (iii) is also developmentally retarded. (d)(e) Confocal maximum intensity projections of wholemount immunostained E8.5 Rreb1−/− ESC-containing chimeric embryos. Panel (d), an embryo with an ectopic somite-like structure (arrowhead). Panel (e), the embryo in (c)(iv) with axis duplication of the headfolds. (f) Sagittal confocal optical sections of wholemount immunostained chimeric E7.5 embryos. Embryos shown in (f)(i)-(ii) have multiple cavities and multiple expression sites of SNAIL hence anterior-posterior axis orientation is not possible, (g) Brightfield images of morphologically abnormal Rreb1−/− ESC-containing chimeric E7.5 embryos. Embryos frequently had protrusions into the cavity and thickening of the posterior epiblast, marked by arrowheads. (h)(i) Confocal maximum intensity projections of chimeric embryos after wholemount immunostaining for phospho-Histone H3 (h), labeling mitotic cells, and cleaved Caspase 3 (i) labeling apoptotic cells. Brackets demarcate the primitive streak, (j) Sagittal confocal optical sections of chimeric E7.5 embryos after wholemount immunostaining for E-cadherin and N-cadherin. Arrowhead, aberrant N-cadherin expression. HF, headfold; PS, primitive streak; A, anterior; P, posterior; Pr, proximal; Ds, distal; L, left; R, right. Scale bars, 50 μm. (b-j) Images are representative of two independent experiments.
Supplementary Material
Acknowledgements
We thank L. Tian and D.-F. Lee for technical assistance, L. Huang for pLenti-HA-Rreb1 plasmid, K. Anderson, A. Nieto and J.P. Thiery for insightful discussions. We acknowledge the support of Y. Furuta and S. Gong of the Mouse Genetics Core, the Molecular Cytology, Integrated Genomics, and Flow Cytometry Cores of MSKCC, and S.Y. Kim of the Rodent Genetic Engineering Laboratory of NYU. This work was supported by NIH grants R01CA34610 (J.M.), P01-CA129243 (J.M.), R01DK084391 (A.K.H.), R01HD094868 (A.K.H.) and P30-CA008748 (MSKCC). J.S. was supported by an AACR Basic Cancer Research Fellowship (16-40-01-SUJI) and a Charles H. Revson Senior Fellowship in Biomedical Science (17-23). S.M.M. was supported by a Sir Henry Wellcome Postdoctoral Fellowship. Y.H. was supported by a Medical Scientist Training Program grant (T32GM007739) and Predoctoral Fellowship (F30-CA203238) from the National Cancer Institute. H.B. was supported by a Damon Runyon Postdoctoral Fellowship.
Footnotes
Declaration of Interests
J.M. serves in the scientific advisory board and owns company stock in Scholar Rock.
REFERENCES
- 1.Arnold SJ & Robertson EJ Making a commitment: cell lineage allocation and axis patterning in the early mouse embryo. Nat Rev Mol Cell Biol 10, 91–103, doi: 10.1038/nrm2618 (2009). [DOI] [PubMed] [Google Scholar]
- 2.Dongre A & Weinberg RA New insights into the mechanisms of epithelial-mesenchymal transition and implications for cancer. Nat Rev Mol Cell Biol 20, 69–84, doi: 10.1038/s41580-018-0080-4 (2019). [DOI] [PubMed] [Google Scholar]
- 3.Ferretti E & Hadjantonakis AK Mesoderm specification and diversification: from single cells to emergent tissues. Curr Opin Cell Biol 61, 110–116, doi: 10.1016/j.ceb.2019.07.012 (2019). [DOI] [PMC free article] [PubMed] [Google Scholar]
- 4.Nieto MA, Huang RY, Jackson RA & Thiery JP Emt: 2016. Cell 166, 21–45, doi: 10.1016/j.cell.2016.06.028 (2016). [DOI] [PubMed] [Google Scholar]
- 5.Batlle E et al. The transcription factor snail is a repressor of E-cadherin gene expression in epithelial tumour cells. Nat Cell Biol 2, 84–89, doi: 10.1038/35000034 (2000). [DOI] [PubMed] [Google Scholar]
- 6.Cano A et al. The transcription factor snail controls epithelial-mesenchymal transitions by repressing E-cadherin expression. Nat Cell Biol 2, 76–83, doi: 10.1038/35000025 (2000). [DOI] [PubMed] [Google Scholar]
- 7.Brabletz S & Brabletz T The ZEB/miR-200 feedback loop--a motor of cellular plasticity in development and cancer? EMBO Rep 11, 670–677, doi: 10.1038/embor.2010.117 (2010). [DOI] [PMC free article] [PubMed] [Google Scholar]
- 8.De Craene B & Berx G Regulatory networks defining EMT during cancer initiation and progression. Nat Rev Cancer 13, 97–110, doi: 10.1038/nrc3447 (2013). [DOI] [PubMed] [Google Scholar]
- 9.David CJ & Massague J Contextual determinants of TGFbeta action in development, immunity and cancer. Nat Rev Mol Cell Biol 19, 419–435, doi: 10.1038/s41580-018-0007 (2018). [DOI] [PMC free article] [PubMed] [Google Scholar]
- 10.Heldin CH, Vanlandewijck M & Moustakas A Regulation of EMT by TGFbeta in cancer. FEBS Lett 586, 1959–1970, doi: 10.1016/j.febslet.2012.02.037 (2012). [DOI] [PubMed] [Google Scholar]
- 11.Meng XM, Nikolic-Paterson DJ & Lan HY TGF-beta: the master regulator of fibrosis. Nat Rev Nephrol 12, 325–338, doi: 10.1038/nrneph.2016.48 (2016). [DOI] [PubMed] [Google Scholar]
- 12.David CJ et al. TGF-beta Tumor Suppression through a Lethal EMT. Cell 164, 1015–1030, doi: 10.1016/j.cell.2016.01.009 (2016). [DOI] [PMC free article] [PubMed] [Google Scholar]
- 13.Horiguchi K et al. Role of Ras signaling in the induction of snail by transforming growth factor-beta. J Biol Chem 284, 245–253, doi: 10.1074/jbc.M804777200 (2009). [DOI] [PubMed] [Google Scholar]
- 14.Janda E et al. Ras and TGF[beta] cooperatively regulate epithelial cell plasticity and metastasis: dissection of Ras signaling pathways. J Cell Biol 156, 299–313, doi: 10.1083/jcb.200109037 (2002). [DOI] [PMC free article] [PubMed] [Google Scholar]
- 15.Meno C et al. Mouse Lefty2 and zebrafish antivin are feedback inhibitors of nodal signaling during vertebrate gastrulation. Mol Cell 4, 287–298 (1999). [DOI] [PubMed] [Google Scholar]
- 16.Oft M, Akhurst RJ & Balmain A Metastasis is driven by sequential elevation of H-ras and Smad2 levels. Nat Cell Biol 4, 487–494, doi: 10.1038/ncb807 (2002). [DOI] [PubMed] [Google Scholar]
- 17.Sun X, Meyers EN, Lewandoski M & Martin GR Targeted disruption of Fgf8 causes failure of cell migration in the gastrulating mouse embryo. Genes Dev 13, 1834–1846 (1999). [DOI] [PMC free article] [PubMed] [Google Scholar]
- 18.Yamaguchi TP, Harpal K, Henkemeyer M & Rossant J fgfr-1 is required for embryonic growth and mesodermal patterning during mouse gastrulation. Genes Dev 8, 3032–3044 (1994). [DOI] [PubMed] [Google Scholar]
- 19.Zhou X, Sasaki H, Lowe L, Hogan BL & Kuehn MR Nodal is a novel TGF-beta-like gene expressed in the mouse node during gastrulation. Nature 361, 543–547, doi: 10.1038/361543a0 (1993). [DOI] [PubMed] [Google Scholar]
- 20.CancerGenomeAtlasResearchNetwork. Integrated Genomic Characterization of Pancreatic Ductal Adenocarcinoma. Cancer Cell 32, 185–203 e113, doi: 10.1016/j.ccell.2017.07.007 (2017). [DOI] [PMC free article] [PubMed] [Google Scholar]
- 21.Thiagalingam A et al. RREB-1, a novel zinc finger protein, is involved in the differentiation response to Ras in human medullary thyroid carcinomas. Mol Cell Biol 16, 5335–5345 (1996). [DOI] [PMC free article] [PubMed] [Google Scholar]
- 22.DaCosta Byfield S, Major C, Laping NJ & Roberts AB SB-505124 is a selective inhibitor of transforming growth factor-beta type I receptors ALK4, ALK5, and ALK7. Mol Pharmacol 65, 744–752, doi: 10.1124/mol.65.3.744 (2004). [DOI] [PubMed] [Google Scholar]
- 23.Porsch H et al. Efficient TGFbeta-induced epithelial-mesenchymal transition depends on hyaluronan synthase HAS2. Oncogene 32, 4355–4365, doi: 10.1038/onc.2012.475 (2013). [DOI] [PMC free article] [PubMed] [Google Scholar]
- 24.Martin-Malpartida P et al. Structural basis for genome wide recognition of 5-bp GC motifs by SMAD transcription factors. Nat Commun 8, 2070, doi: 10.1038/s41467-017-02054-6 (2017). [DOI] [PMC free article] [PubMed] [Google Scholar]
- 25.Costello LC, Zou J, Desouki MM & Franklin RB Evidence for changes in RREB-1, ZIP3, and Zinc in the early development of pancreatic adenocarcinoma. J Gastrointest Cancer 43, 570–578, doi: 10.1007/s12029-012-9378-1 (2012). [DOI] [PMC free article] [PubMed] [Google Scholar]
- 26.Kent OA, Fox-Talbot K & Halushka MK RREB1 repressed miR-143/145 modulates KRAS signaling through downregulation of multiple targets. Oncogene 32, 2576–2585, doi: 10.1038/onc.2012.266 (2013). [DOI] [PMC free article] [PubMed] [Google Scholar]
- 27.Yamane T et al. Transcriptional activation of the cholecystokinin gene by DJ-1 through interaction of DJ-1 with RREB1 and the effect of DJ-1 on the cholecystokinin level in mice. PLoS One 8, e78374, doi: 10.1371/journal.pone.0078374 (2013). [DOI] [PMC free article] [PubMed] [Google Scholar]
- 28.Kent OA et al. Repression of the miR-143/145 cluster by oncogenic Ras initiates a tumor-promoting feed-forward pathway. Genes Dev 24, 2754–2759, doi: 10.1101/gad.1950610 (2010). [DOI] [PMC free article] [PubMed] [Google Scholar]
- 29.Winslow MM et al. Suppression of lung adenocarcinoma progression by Nkx2-1. Nature 473, 101–104, doi: 10.1038/nature09881 (2011). [DOI] [PMC free article] [PubMed] [Google Scholar]
- 30.Kasai H, Allen JT, Mason RM, Kamimura T & Zhang Z TGF-beta1 induces human alveolar epithelial to mesenchymal cell transition (EMT). Respir Res 6, 56, doi: 10.1186/1465-9921-6-56 (2005). [DOI] [PMC free article] [PubMed] [Google Scholar]
- 31.Schafer S et al. IL-11 is a crucial determinant of cardiovascular fibrosis. Nature 552, 110–115, doi: 10.1038/nature24676 (2017). [DOI] [PMC free article] [PubMed] [Google Scholar]
- 32.Toda N, Mukoyama M, Yanagita M & Yokoi H CTGF in kidney fibrosis and glomerulonephritis. Inflamm Regen 38, 14, doi: 10.1186/s41232-018-0070-0 (2018). [DOI] [PMC free article] [PubMed] [Google Scholar]
- 33.Konigshoff M et al. WNT1-inducible signaling protein-1 mediates pulmonary fibrosis in mice and is upregulated in humans with idiopathic pulmonary fibrosis. J Clin Invest 119, 772–787, doi: 10.1172/JCI33950 (2009). [DOI] [PMC free article] [PubMed] [Google Scholar]
- 34.Yoshida S et al. Extrahepatic platelet-derived growth factor-beta, delivered by platelets, promotes activation of hepatic stellate cells and biliary fibrosis in mice. Gastroenterology 147, 1378–1392, doi: 10.1053/j.gastro.2014.08.038 (2014). [DOI] [PubMed] [Google Scholar]
- 35.Dave N et al. Functional cooperation between Snail1 and twist in the regulation of ZEB1 expression during epithelial to mesenchymal transition. J Biol Chem 286, 12024–12032, doi: 10.1074/jbc.M110.168625 (2011). [DOI] [PMC free article] [PubMed] [Google Scholar]
- 36.Ye X et al. Distinct EMT programs control normal mammary stem cells and tumour-initiating cells. Nature 525, 256–260, doi: 10.1038/naturel4897 (2015). [DOI] [PMC free article] [PubMed] [Google Scholar]
- 37.Scheel C et al. Paracrine and autocrine signals induce and maintain mesenchymal and stem cell states in the breast. Cell 145, 926–940, doi: 10.1016/j.cell.2011.04.029 (2011). [DOI] [PMC free article] [PubMed] [Google Scholar]
- 38.Miettinen PJ, Ebner R, Lopez AR & Derynck R TGF-beta induced transdifferentiation of mammary epithelial cells to mesenchymal cells: involvement of type I receptors. J Cell Biol 127, 2021–2036 (1994). [DOI] [PMC free article] [PubMed] [Google Scholar]
- 39.Shirakihara T, Saitoh M & Miyazono K Differential regulation of epithelial and mesenchymal markers by deltaEF1 proteins in epithelial mesenchymal transition induced by TGF-beta. Mol Biol Cell 18, 3533–3544, doi: 10.1091/mbc.e07-03-0249 (2007). [DOI] [PMC free article] [PubMed] [Google Scholar]
- 40.Xie L et al. Activation of the Erk pathway is required for TGF-beta1-induced EMT in vitro. Neoplasia 6, 603–610, doi: 10.1593/neo.04241 (2004). [DOI] [PMC free article] [PubMed] [Google Scholar]
- 41.Peng G et al. Spatial Transcriptome for the Molecular Annotation of Lineage Fates and Cell Identity in Mid-gastrula Mouse Embryo. Dev Cell 36, 681–697, doi: 10.1016/j.devcel.2016.02.020 (2016). [DOI] [PubMed] [Google Scholar]
- 42.Wang Q et al. The p53 Family Coordinates Wnt and Nodal Inputs in Mesendodermal Differentiation of Embryonic Stem Cells. Cell Stem Cell 20, 70–86, doi: 10.1016/j.stem.2016.10.002 (2017). [DOI] [PMC free article] [PubMed] [Google Scholar]
- 43.Peiro S et al. Snail1 transcriptional repressor binds to its own promoter and controls its expression. Nucleic Acids Res 34, 2077–2084, doi: 10.1093/nar/gkl141 (2006). [DOI] [PMC free article] [PubMed] [Google Scholar]
- 44.Lee JD, Silva-Gagliardi NF, Tepass U, McGlade CJ & Anderson KV The FERM protein Epb4.1l5 is required for organization of the neural plate and for the epithelial-mesenchymal transition at the primitive streak of the mouse embryo. Development 134, 2007–2016, doi: 10.1242/dev.000885 (2007). [DOI] [PubMed] [Google Scholar]
- 45.Zohn IE et al. p38 and a p38-interacting protein are critical for downregulation of E-cadherin during mouse gastrulation. Cell 125, 957–969, doi: 10.1016/j.cell.2006.03.048 (2006). [DOI] [PubMed] [Google Scholar]
- 46.Yoon SJ, Wills AE, Chuong E, Gupta R & Baker JC HEB and E2A function as SMAD/FOXH1 cofactors. Genes Dev 25, 1654–1661, doi: 10.1101/gad.16800511 (2011). [DOI] [PMC free article] [PubMed] [Google Scholar]
- 47.Thuault S et al. HMGA2 and Smads co-regulate SNAIL1 expression during induction of epithelial-to-mesenchymal transition. J Biol Chem 283, 33437–33446, doi: 10.1074/jbc.M802016200 (2008). [DOI] [PMC free article] [PubMed] [Google Scholar]
- 48.Ciruna B & Rossant J FGF signaling regulates mesoderm cell fate specification and morphogenetic movement at the primitive streak. Dev Cell 1, 37–49 (2001). [DOI] [PubMed] [Google Scholar]
- 49.Grande MT et al. Snail1-induced partial epithelial-to-mesenchymal transition drives renal fibrosis in mice and can be targeted to reverse established disease. Nat Med 21, 989–997, doi: 10.1038/nm.3901 (2015). [DOI] [PubMed] [Google Scholar]
- 50.Lovisa S et al. Epithelial-to-mesenchymal transition induces cell cycle arrest and parenchymal damage in renal fibrosis. Nat Med 21, 998–1009, doi: 10.1038/nm.3902 (2015). [DOI] [PMC free article] [PubMed] [Google Scholar]
METHODS REFERENCES
- 51.Schreiber FS et al. Successful growth and characterization of mouse pancreatic ductal cells: functional properties of the Ki-RAS(G12V) oncogene. Gastroenterology 127, 250–260 (2004). [DOI] [PubMed] [Google Scholar]
- 52.Boj SF et al. Organoid models of human and mouse ductal pancreatic cancer. Cell 160, 324–338, doi: 10.1016/j.cell.2014.12.021 (2015). [DOI] [PMC free article] [PubMed] [Google Scholar]
- 53.Xi Q et al. A poised chromatin platform for TGF-beta access to master regulators. Cell 147, 1511–1524, doi: 10.1016/j.cell.2011.11.032 (2011). [DOI] [PMC free article] [PubMed] [Google Scholar]
- 54.Valiente M et al. Serpins promote cancer cell survival and vascular co-option in brain metastasis. Cell 156, 1002–1016, doi: 10.1016/j.cell.2014.01.040 (2014). [DOI] [PMC free article] [PubMed] [Google Scholar]
- 55.Ran FA et al. Genome engineering using the CRISPR-Cas9 system. Nat Protoc 8, 2281–2308, doi: 10.1038/nprot.2013.143 (2013). [DOI] [PMC free article] [PubMed] [Google Scholar]
- 56.Zuber J et al. RNAi screen identifies Brd4 as a therapeutic target in acute myeloid leukaemia. Nature 478, 524–528, doi: 10.1038/nature10334 (2011). [DOI] [PMC free article] [PubMed] [Google Scholar]
- 57.Dobin A et al. STAR: ultrafast universal RNA-seq aligner. Bioinformatics 29, 15–21, doi: 10.1093/bioinformatics/bts635 (2013). [DOI] [PMC free article] [PubMed] [Google Scholar]
- 58.Anders S & Huber W Differential expression analysis for sequence count data. Genome Biol 11, R106, doi: 10.1186/gb-2010-11-10-r106 (2010). [DOI] [PMC free article] [PubMed] [Google Scholar]
- 59.Subramanian A et al. Gene set enrichment analysis: a knowledge-based approach for interpreting genome-wide expression profiles. Proc Natl Acad Sci U S A 102, 15545–15550, doi: 10.1073/pnas.0506580102 (2005). [DOI] [PMC free article] [PubMed] [Google Scholar]
- 60.Dennis G Jr. et al. DAVID: Database for Annotation, Visualization, and Integrated Discovery. Genome Biol 4, P3 (2003). [PubMed] [Google Scholar]
- 61.Langmead B & Salzberg SL Fast gapped-read alignment with Bowtie 2. Nat Methods 9, 357–359, doi: 10.1038/nmeth.1923 (2012). [DOI] [PMC free article] [PubMed] [Google Scholar]
- 62.Li H et al. The Sequence Alignment/Map format and SAMtools. Bioinformatics 25, 2078–2079, doi: 10.1093/bioinformatics/btp352 (2009). [DOI] [PMC free article] [PubMed] [Google Scholar]
- 63.Heinz S et al. Simple combinations of lineage-determining transcription factors prime cis-regulatory elements required for macrophage and B cell identities. Mol Cell 38, 576–589, doi: 10.1016/j.molcel.2010.05.004 (2010). [DOI] [PMC free article] [PubMed] [Google Scholar]
- 64.Zambelli F, Pesole G & Pavesi G PscanChIP: Finding over-represented transcription factor-binding site motifs and their correlations in sequences from ChIP-Seq experiments. Nucleic Acids Res 41, W535–543, doi: 10.1093/nar/gkt448 (2013). [DOI] [PMC free article] [PubMed] [Google Scholar]
- 65.Cox J & Mann M MaxQuant enables high peptide identification rates, individualized p.p.b.-range mass accuracies and proteome-wide protein quantification. Nat Biotechnol 26, 1367–1372, doi: 10.1038/nbt.1511 (2008). [DOI] [PubMed] [Google Scholar]
- 66.Cox J et al. Andromeda: a peptide search engine integrated into the MaxQuant environment. J Proteome Res 10, 1794–1805, doi: 10.1021/pr101065j (2011). [DOI] [PubMed] [Google Scholar]
- 67.Behringer R Manipulating the mouse embryo : a laboratory manual. Fourth edition, edn, (Cold Spring Harbor Laboratory Press, 2014). [Google Scholar]
Associated Data
This section collects any data citations, data availability statements, or supplementary materials included in this article.


