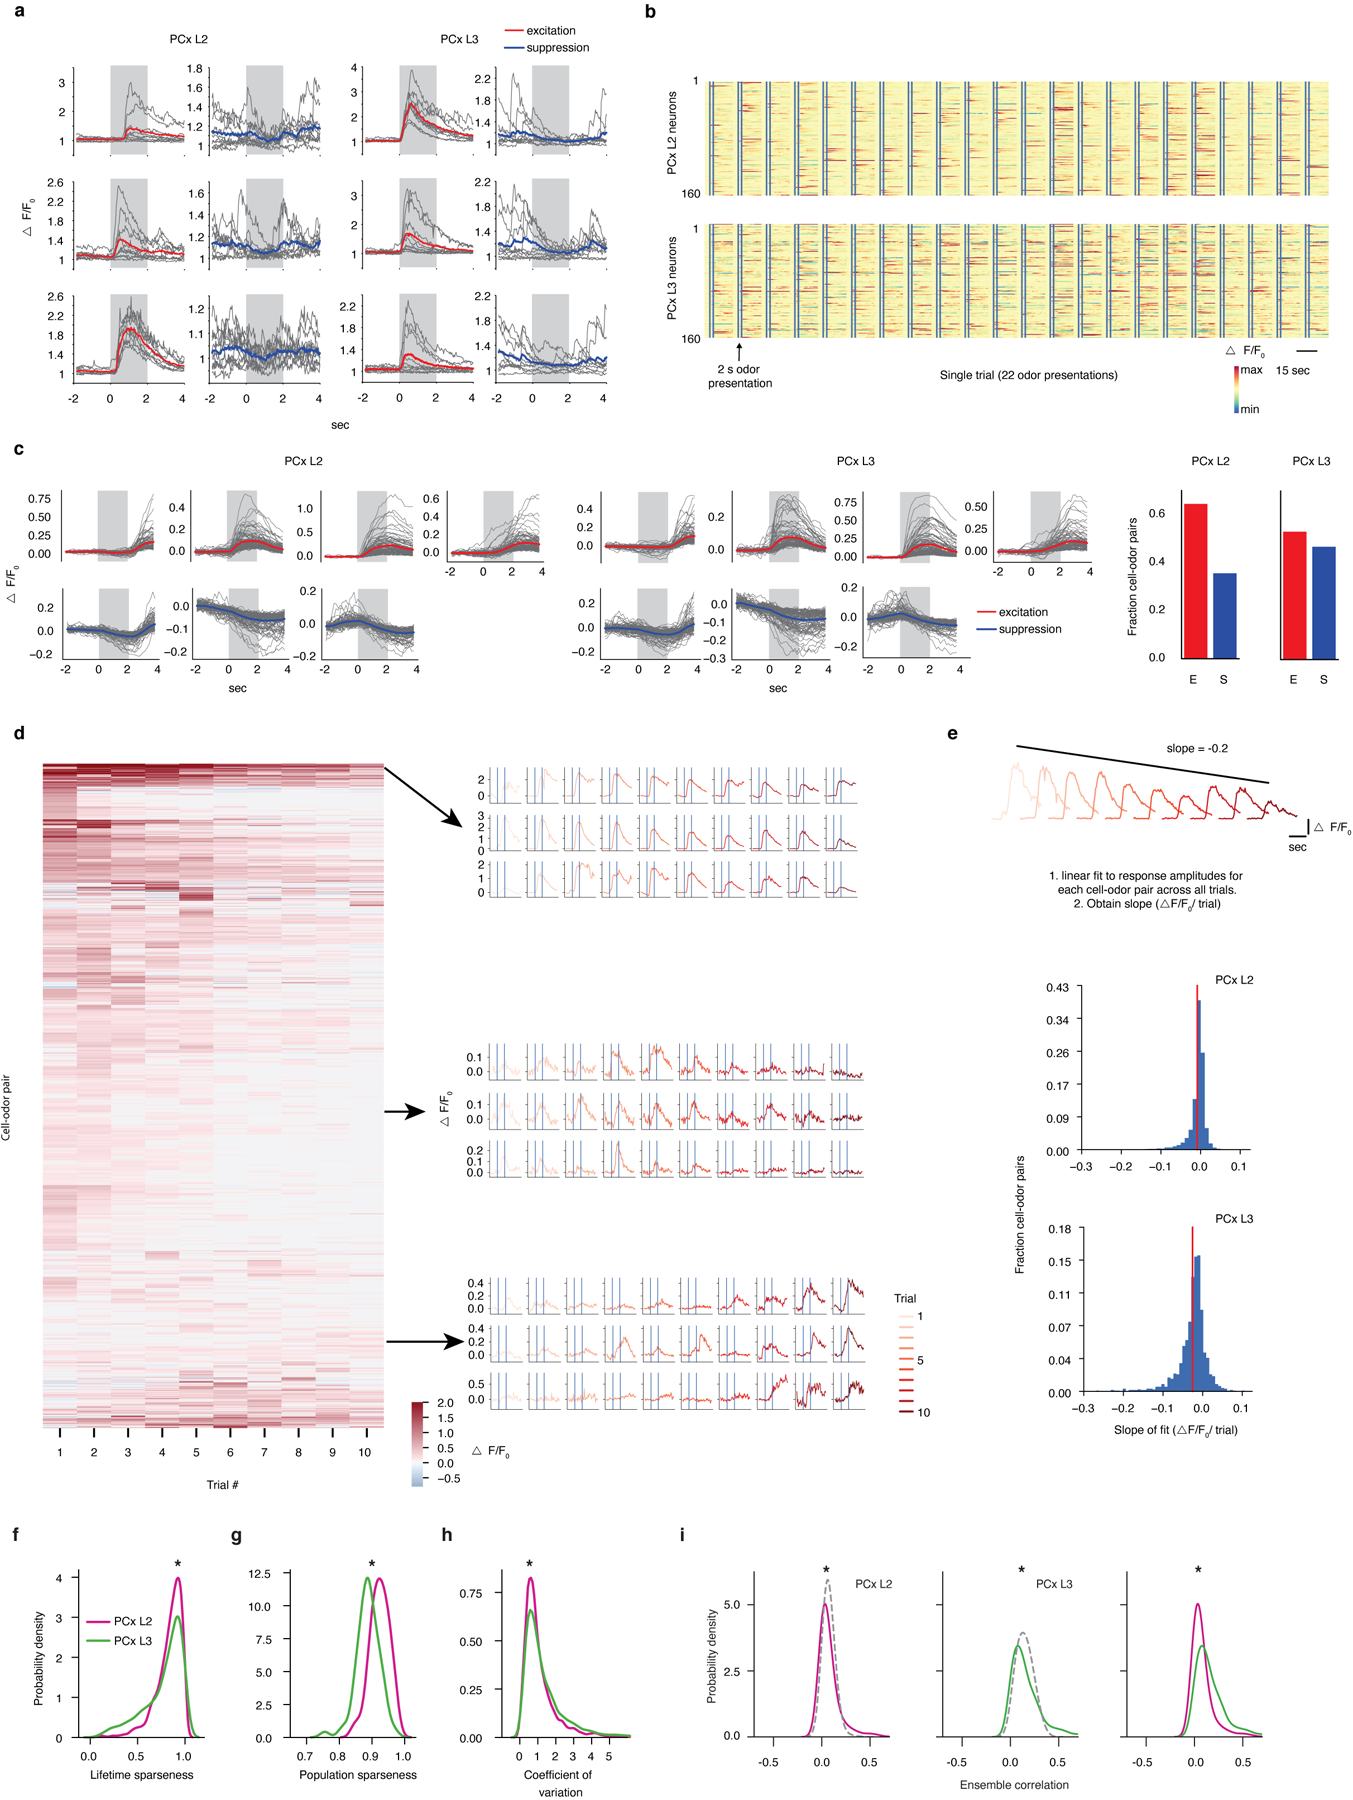
Extended Data Figure 3. PCx L3 neurons exhibit denser, broader and more reliable odor responses than neurons in PCx L2.

a, Examples of odor-evoked excitation and suppression in PCx. Each panel corresponds to a single cell-odor pair. Grey lines represent individual trials. Colored overlays represent trial-mean activity. Shaded grey rectangles delimit the odor presentation period.
b, Trial-averaged population response raster depicting odor-evoked activity in response to 22 odors (global odor set) across L2 and L3. Responses are ΔF/F0 with redder colors indicating excitatory transients and bluer colors indicating odor-evoked suppression. x-axis is time; double vertical bars delimit 2-second odor presentation periods.
c, Response types observed in L2 and L3 (clustered odor set). Individual panels correspond to clusters identified using a gaussian mixture model (see Methods). Grey traces correspond to trial-averaged cell-odor pairs. Colored overlays represent mean response time-course associated with each cluster. Right: fraction of all cell-odor pairs exhibiting excitation or suppression.
d, Response amplitudes of cell-odor pairs obtained from PCx L3 depicted on a trial-by-trial basis. Each row represents a given neuron’s response to 10 consecutive presentations of the same odor. Neurons are sorted hierarchically using average linkage and correlation distance. Despite the presence of some habituation in response to multiple presentations of the same odorant across the experiment, habituation does not appear uniform across the neural population nor does it appear to dominate neural responses to odors. Different groups of neurons were identified with maximal responses to an odor peaking at different times across the experiment; see examples depicted on the right. Each row of traces corresponds to a single cell-odor pair.
e, At the population level, odor responses do not uniformly habituate across the experiment. (Top), Cartoon depiction of procedure for determining change in response amplitude over the course of the experiment for a single cell odor pair. (Middle and Bottom), pooled data for all cell-odor pairs, sorted by layer. Red lines correspond to distribution means (clustered odor set).
f, Lifetime sparseness distributions (used to quantify tuning breadth, see Methods) in L2 and L3 across all experiments (1 = perfectly odor selective, 0 = completely non-selective, * = p<0.01, permutation test on layer label). Distributions are built using all responsive neurons (significant response to at least one odor by auROC analysis) pooled by layer across all experiments (here and throughout, global: n = 3 mice, L2 = 854 neurons, L3 = 616 neurons; clustered: n = 3 mice, L2 = 867 neurons, L3 = 488 neurons; tiled: n = 3 mice, L2 = 427 neurons, L3 = 334 neurons).
g, Population sparseness distributions (used to quantify response density, see Methods) in L2 and L3 (1 = few neurons active overall, 0 = all neurons active overall to an equal level. * = p<0.01, permutation test on layer label).
h, Probability density distributions of coefficient of variation for all significant cell-odor pairs identified with auROC analysis. (* = p<0.01, permutation test on layer label).
i, Probability density distributions of ensemble correlations (i.e., pairwise correlations between odor-evoked ensembles) between trial-averaged population odor responses in L2 (left) and L3 (middle). Dashed control curves indicate the distribution of ensemble correlations after shuffling odor labels independently across neurons. Ensemble correlations were determined independently for each animal, and subsequently pooled (* = p<0.01). L3 exhibits greater correlations at the population level than L2 (right) (* = p<0.01, permutation test on layer label).
